
Abstract
In this quasi-experimental study, the effects of lexical coverage through pseudo word manipulation in dialogue comprehension are investigated. Forty-four first-year students in a Japanese university listened to five dialogues at different lexical coverage levels: 98%, 95%, 90%, 85%, and 83%. The results of the comprehension tests confirm the results seen in narrative, monologic lexical coverage studies that it is possible for intermediate EFL learners to attain adequate listening comprehension on texts with as little as 90% lexical coverage. However, variation in participants’ scores on higher lexical coverage dialogues suggest pseudo word distribution and topic familiarity might be acting as confounding variables in lexical coverage studies which use pseudo word manipulation. Suggestions for methodological reform for future projects on this subject are provided.
I Introduction
Listening requires successful coordination between controlled and automatic processing that enable the listener to understand spoken speech, gesture, and backchannel to the speaker to show they comprehend the input. Second language (L2) listeners often encounter complications that can cause comprehension and communication breakdowns. One of these factors is lexical knowledge. The purpose of this study was to examine to what extent the inclusion of pseudo words in dialogues in increasing amounts hinders listening comprehension of intermediate proficiency, non-native English as a foreign language (EFL) learners.
II Literature review
Listening comprehension requires a combination of on-line automatic and controlled processes, attention management, working memory, and strategy use. However, at the heart of listening comprehension is lexis. Rost (2016) suggested that when the syntax of an utterance is unclear, L2 learners rely on their vocabulary knowledge to obtain the minimum comprehension required to remain an active participant in the conversation. Vandergrift and Baker’s (2015) and Andringa et al.’s (2012) analyses looked to define the factors involved in L2 listening and to what degree they contribute to successful comprehension. The results of both studies showed that first language (L1) and second language (L2) lexical knowledge are the largest contributing factors to successful listening comprehension. These results suggest that successful listeners have larger vocabulary sizes and that L2 lexical knowledge plays an essential role in overall listening comprehension. What is still under debate is the minimum amount of known vocabulary in a text for general understanding. This characteristic, lexical coverage, is an essential variable in listening text comprehensibility.
From a pedagogical point of view, Nation and Newton (2009) suggested that 25% of the language curriculum should be devoted to comprehensible or meaning-focused input. That is a difficult criterion to meet if the definition of comprehensible is subjective at best or unknown at worst. Additionally, for extensive listening – a pedagogical approach through which listeners are exposed to extensive amounts of the target language to develop bottom-up listening skills and fluency – the texts should be easy to understand so that listeners not need to divert their attention from the task to define unknown words. The number of unknown words in a text can hinder the effectiveness of extensive listening as a learning approach, but research has yet to determine to what extent. It is necessary to define these thresholds and coverage minimums so that more informed teaching practices can be developed. Lexical coverage research has led to valuable extensive reading guidelines over the last 30 years. Researchers and practitioners of extensive reading have generally agreed that, for best results, extensive reading participants should aim to read texts which fall in the vicinity of 98% lexical coverage, or 2 unknown words per 100 words on the page (Hirsh & Nation, 1992). However, there are few empirically-based extensive listening guidelines. One of the purposes of this study is to help define these thresholds in order to support educators and learners who practice extensive listening as a pedagogical tool.
1 Lexical coverage in reading and listening
There are two approaches to investigating lexical coverage; a corpus-driven approach and a pseudo word approach. Researchers using corpus-driven approaches investigate lexical coverage by profiling the content of a genre of texts (e.g. TED Talks, pop music, Wikipedia, or graded readers) and comparing the lexical profile of those texts to a representative corpus (e.g. the British National Corpus and the Corpus of Contemporary American English) to estimate how much coverage of the representative corpus a learner would need have in order to adequately understand the target text. The benefit of this approach is that it allows the researcher to use authentic or simplified materials. It also can be used more practically to help develop appropriate materials for a particular group. The detriment of the corpus-driven approach is that it is challenging to define which words in a text are known or unknown. On the other hand, researchers using the pseudo word approach directly replace certain words in a target text with fake words and require participants to answer comprehension questions to determine their level of comprehension. The benefit of this approach is that the researcher can be absolutely certain that the unknown words in their text are truly unknown. However, this can lead to a feeling of inauthenticity as the researcher is using/teaching participants words that do not exist. For a thorough overview of lexical coverage research and methods see Nurmukhamedov and Webb (2019).
It is necessary to define ‘adequate comprehension’. Laufer and Sim (1985) used interviews and multiple-choice questions in response to the reading texts to determine the threshold for adequate reading comprehension. They found that vocabulary was the major difficulty in global comprehension for their participants and defined adequate comprehension as a score of 65%–70% on comprehension tests. In a later study, Laufer (1989) found that when the comprehension threshold was set at 55%, participants were still able to understand the reading texts adequately in which they only knew 95% of the lexical items. In a corpus-driven study, Hirsh and Nation (1992) profiled the vocabulary in three unsimplified novels and found that knowledge of the most frequent 2,000 word families on the General Service List (GSL) in English was insufficient to read the novels for pleasure. The authors called for L2 readers to have a vocabulary size of at least 5,000 word families to reach 98% coverage of the GSL. Several years later, Hu and Nation (2000) conducted a pseudo word reading comprehension confirmation of Hirsh and Nation’s (1992) study that knowledge of 98% vocabulary was necessary to read a text for pleasure. Hu and Nation (2000) used graded readers and replaced 0%, 5%, 10%, and 20% of the tokens in the narratives with pseudo words. They used short-answer and multiple-choice questions to determine the participants’ comprehension. They found that knowledge of 98% of the vocabulary in a reading text was necessary to gain adequate, unassisted comprehension of graded reader narratives. However, a minority of their participants were able to understand the texts adequately at the 95% and 90% lexical coverage thresholds. The authors attributed these results to background knowledge, effective strategy application, and grammar knowledge. In another pseudo word study, Laufer and Ravenhorst-Kalovski (2010) revisited this idea of lexical thresholds and refined their conclusions from previous findings. They contended that there is a minimum lexical coverage threshold of 95% and an optimal threshold of 98%. These additional findings support the previous research that adequate reading comprehension is more likely when the reader knows between 95% and 100% of the lexical items.
There are substantially fewer lexical coverage studies for listening comprehension. Bonk (2000) examined lexical thresholds in listening and found that listening comprehension scores were significantly lower for participants who knew fewer than 80% of the vocabulary in the texts. However, even knowing less than 80% of the words, some participants were still able to obtain adequate listening comprehension. In 2009, Stæhr investigated lexical knowledge and listening comprehension of advanced Danish learners. He found that in order to reach a 70% adequate comprehension score, participants need to have a knowledge of approximately 5,000 word families, or 98% lexical coverage of English. Stæhr’s study supported previous reading research. In a replication of Stæhr (2009), Noreillie et al. (2018) found similar results. Learners who had mastered more vocabulary tended to score higher on listening comprehension tests. However, depending on how one defines ‘adequate comprehension’, the secondary conclusion reached was that L2 English listeners do not need nearly as many word families as Stæhr (2009) argued. They found that intermediate level listeners would need to only be familiar with the first 2,000 most frequent lemmas or 1,250 word families or 91% lexical coverage.
Van Zeeland and Schmitt (2013) noted that these reading coverage studies and previous listening coverage studies did not transfer exactly to listening lexical coverage. They replicated Hu and Nation’s (2000) study in a listening context to test the hypothesis that reading and listening have the same lexical coverage requirements. The researchers presented the participants with four different first-person narratives each with a different degree of lexical coverage: 100%, 98%, 95%, and 90%. They analysed the vocabulary and replaced words that appeared outside of the 2,000 word frequency list according to the BNC-20 on Compleat Lexical Tutor with pseudo words retrieved from ARC Nonword Database (Rastle, Harrington, & Coltheart, 2002). The participants listened to the stories in a randomized order and took a multiple-choice test to evaluate their listening comprehension. They listened to the stories one time, answered the questions, listened a second time, and then edited their answers if necessary. The native speakers all scored between 80%–100% on all four listening tests showing that native speakers were able to comprehend well below the proposed 98% lexical coverage level. The non-native speakers also performed well. Seventy-five percent of the non-native speakers were able to adequately comprehend the texts at 90% lexical coverage rate, although the variance of the non-native speakers was higher than that of the native speakers at 90% coverage. The authors attributed this difference in variance to general L2 proficiency, online word differentiation ability, and automaticity. They concluded that the 95%–98% coverage recommendations for reading might not be necessary for listening.
2 Task variables
Lexical knowledge is not the only variable to account for in lexical coverage listening studies. Speech rate, topic familiarity, and discourse structure are all confounding variables that might affect listeners’ abilities to adequately comprehend a text. These variables have not been addressed in other lexical coverage studies.
The effect of speech rate on listening comprehension has been investigated through various perspectives. McBride (2011) investigated the effect of fast (180 WPM, i.e. 180 words per minute) and slow (135 WPM) dialogue training to discover how listeners develop listening comprehension skills. The results showed that the group which listened to slow dialogues gained listening comprehension performance on both fast and slow dialogue tests, suggesting that they were able to gain bottom-up processing skills from the treatment sessions and apply those gains to listening tasks with higher speech rates. The group which only listened to fast dialogues were unable to transfer their top-down strategies to the listening comprehension post-tests. While this study is not exactly analogous to the current study, the important detail is the word per minute range; 135 WPM is considered slow and 180 WPM is considered fast for the purpose of the McBride study. According to Tauroza and Allison (1990) native English speech rate varies based on discourse structure. On average, conversations in British English were measured at a speech rate of 210 WPM (260 SPM, i.e. 260 syllables per minute) and interviews were measured at 190 WPM (250 SPM). On the other hand, Buck (2001) suggested that when creating assessment materials for language learners, native English speed may not be appropriate for beginners. This suggestion is sensible, but the speech rate used in an assessment should be chosen with the goals of the task in mind. In the case of lexical coverage, the speech rate should be representative of situations which L2 learners might be expected to encounter. In this case, native or near native speech rates seem appropriate as long as all the tasks have a consistent rate to limit threats to internal validity.
The second confounding factor in lexical coverage studies is topic familiarity. In fact, Schmitt, Cobb, Horst, and Schmitt (2017) discussed the need for replication of van Zeeland and Schmitt (2013) and specifically selected topic familiarity as an issue to be addressed in future studies. Lexical coverage research which depend on pseudo word manipulation often suffer from a common weakness: the use of separate texts at different lexical coverage levels. It is impossible to be certain that the differences in listening or reading comprehension are due to the different lexical coverage levels if the texts are also different. Researchers try to overcome this weakness by expert and novice piloting, detailed descriptive statistics regarding the difficulty of the texts and the coverage of the vocabulary, and comparison to native speaker performance. These are sound methodological practices, but do not address the main question: Are the performance differences on these texts different due to lexical coverage manipulation or background knowledge or topic familiarity? Research suggests that listeners have better recall on familiar topics than unfamiliar topics (Schmidt-Rinehart, 1994); L2 readers perform better on comprehension tasks when reading culturally familiar topics than similarly proficient participants reading unfamiliar tasks (Lee, 2007); and speakers are more engaged and motivated to participate in tasks on familiar topics than unfamiliar topics (Qiu & Lo, 2017). Keeping these findings in mind, it is necessary that lexical coverage research also attempt to account for topic familiarity either through short survey as is the case in Lee (2007) or through more sophisticated research design.
With regard to discourse structure, all prior research into lexical coverage has been conducted using personal narratives delivered in monologues; however, there is research which suggests that dialogues might be easier to understand than narratives. The degree of listenability of a text is dependent on a variety of factors including prosodic features, degree of planning, the amount of interaction between the speaker and the audience, and the clarity of the delivery (Rubin & Rafoth, 1986). Shohamy and Inbar (1991) argued that the listenability of a text is directly connected to where the text falls on the oral-literate continuum, where an example of an orally-oriented text is a consultative dialogue and a literate-oriented text is a news broadcast. She found that listeners performed significantly better on the dialogue versions of the stories than on news broadcast versions due to the pragmatic features. Dialogues include repetition, redundancies, and pauses which allow the listeners to monitor the flow of information and their own comprehension when the input is not as dense, whereas news broadcast monologues tend be information dense and contain few pauses to help listeners process the texts. She also found that the ease of listening to dialogues could have been partly due to listeners’ familiarity with the listening genre. The participants were unfamiliar with news broadcasting in the L2; however, they were experienced dialogue listeners.
Additionally, a series of cognitive psychological experiments using native speakers have been conducted to explore the differences between dialogue and monologue listening on complex task performance of overhearers. Fox Tree (1999) found that overhearers performed a cognitive instruction task with fewer errors while listening to dialogue instructions. She attributed the differences to the amount of discourse markers and increased multiple perspectives present in the dialogues. Fox Tree and Mayer (2008) found that there were no significant differences between monologic and dialogic instruction, but instructions which included multiple perspectives (e.g. negotiation for meaning) resulted in higher task performance. Branigan, Catchpole, and Pickering (2011) replicated Fox Tree’s (1999) study and found similar results that dialogue overhearers scored higher than monologue overhearers, but attributed the differences to the negotiation between the interlocutors which might have assisted the overhearers.
These dialogue-monologue studies have not been conducted in L2 learning conditions and the conclusions of these studies are varied. The lack of agreement in the literature suggests that there are gaps in the research about general differences between dialogic and monologic discourse structures. The purpose of the present study is to conduct a conceptual replication of Van Zeeland and Schmitt’s (2013) lexical coverage study using dialogues to determine if similar results can be discovered using a different discourse structure. The authors used four different narrative monologues at different lexical coverage levels (100%, 98%, 95%, and 90%) to test if adequate listening comprehension required similar levels of lexical coverage to previous reading studies. In the current study, the discourse structure has been changed from monologue to dialogue, and the minimum lexical coverage threshold has been reduced. Participants in the current study heard five dialogues at 98%, 95%, 90%, 85%, and 83% lexical coverage.
It was hypothesized that in a listening discourse structure, such as dialogues, non-native speakers of English might be able to adequately comprehend short listening texts with less than 90% lexical coverage. From this hypothesis, the following research question was addressed: To what extent can intermediate proficiency English as a Foreign Language (EFL) university students adequately understand dialogues at varying degrees of lexical coverage?
III Methodology
1 Participants
Forty-four first year university participants (M = 10, F = 34) in an international studies program in western Japan participated in this study. They were selected for convenience from three intact oral communication classes. The participants’ age range was 18–19 years old (M = 18) with an average of seven years of formal English instruction. Most of the students were L1 Japanese speakers, however two students were L2 Japanese and L3 English speakers. They were included in the study because they both came to Japan as elementary school students and had a similar amount of formal English language exposure as their Japanese classmates. On a background questionnaire, participants provided self-reported proficiency on two general English proficiency tests, Test of English for International Communication (TOEIC) (Education Testing Service, n.d.) and Global Test of English Communication (GTEC): Academic Listening and Reading (Benesse, n.d). The mean self-report TOEIC score was 560 (SD = 18.9) and the mean self-report GTEC score was 267 (SD = 9.1). That being said, self-reported proficiency scores might not be accurate. Therefore, two additional measures of general proficiency were collected. As part of the required curriculum, first-year students take the Pearson Four-Skills computer-based proficiency test (Pearson, n.d.) which provides students and instructors with a Global Scale of English (GSE) score. This test has a score range of 10–90 and is said to correlate with the skills outlined in the Common European Framework of Reference (CEFR) scale. Participants in this study scored an average of 30 (SD = .92), and, taken together with the GTEC results, this situates these participants in the A2–B1 levels on the CEFR scale (Pearson, n.d.). The fourth proficiency measure was an original dictation (discussed in detail in the next section).
2 Instrumentation
a Dialogues as texts
The content of the dialogues were a combination of original stories and adaptions of stories from a podcast called This American Life (Glass, 2003). The show is a downloadable version of a weekly radio program produced in the United States. The show is intended for native English speakers and the topics often reflect that bias. I chose three short stories on different of topics which did not require a deep knowledge of American culture to ensure that the texts were not biased towards those with more background knowledge. I listened to all of the stories and selected three-minute excerpts from the beginning of the episodes. Dialogues A, B, and E were adapted from older short stories published by This American Life to avoid the possibility that the listener had heard the show. Additionally, Dialogues C and D were original dialogues written in similar style to the stories adapted from This American Life. The topics of the dialogues varied but they all consisted of two people discussing an event in one of the speakers’ past.
Each story was analysed to ensure they were descriptively similar in length, descriptive difficulty, lexical diversity, and density (Table 1). Microsoft Word’s grammar analysis function, word counts, letter counts, and reading difficulty statistics are also provided to illustrate text uniformity. Standard words, the total number of characters including spaces and punctuation divided by six, were used to control for word and text length (Beglar & Hunt, 2014; Carver, 1982). The length of the dialogues ranged from approximately 350–377 standard words. Additionally, Flesch-Kincaid grade level and reading ease readability statistics showed that all the texts were descriptively similar.
Dialogue text descriptions.
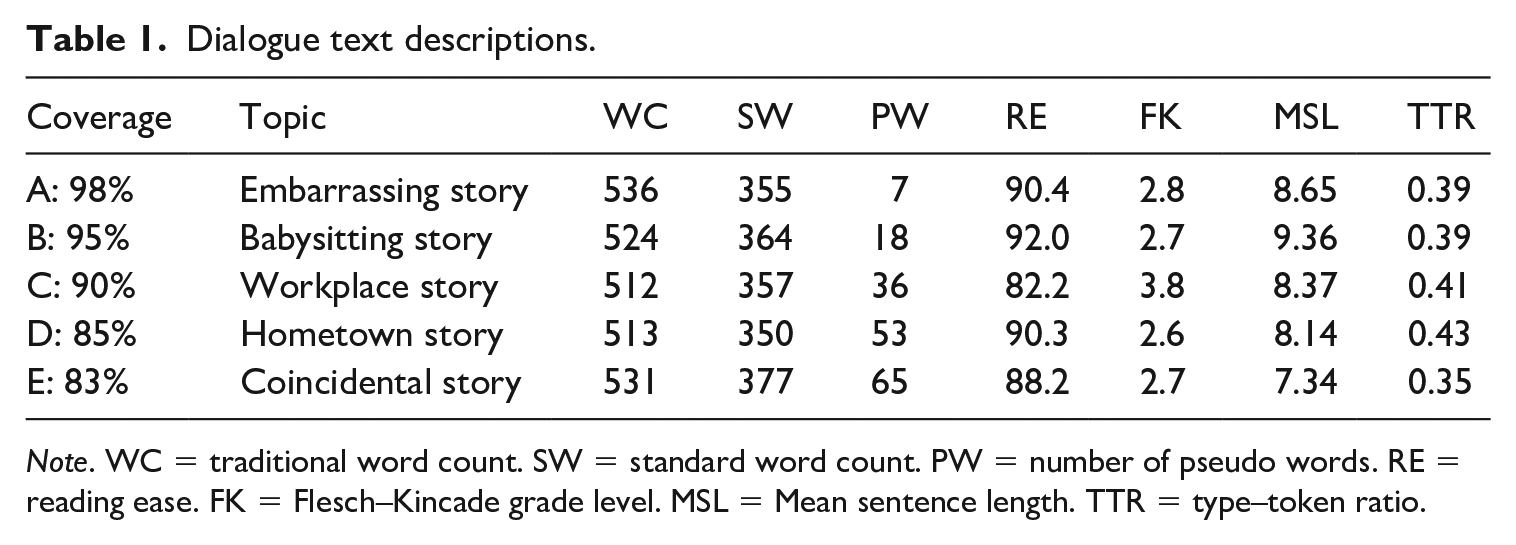
Note. WC = traditional word count. SW = standard word count. PW = number of pseudo words. RE = reading ease. FK = Flesch–Kincade grade level. MSL = Mean sentence length. TTR = type–token ratio.
Lastly, the vocabulary profiles of each of the dialogues were analysed using Compleat Web VP with Lextutor web software (Cobb, 2019). The British National Corpus and Corpus of Contemporary American English (BNC–COCA 1–25K) was the comparison corpus for these texts. Table 2 shows the details of the vocabulary coverage and the breakdown by 1,000 (1K) word frequency bands; 95%–97% of the vocabulary in the texts appear on the 1K–2K frequency bands. Additionally, all of the words from the 3K–10K bands are listed in Table 2. However, most of these words are common in spoken English, such as girlfriend, compliment, and vacation. Conversational features such as filled pauses reduced the total percentages and were not recorded as possible issue words. Proper nouns were also limited in the texts as to not cause comprehension issues.
Vocabulary profile of the five dialogues.
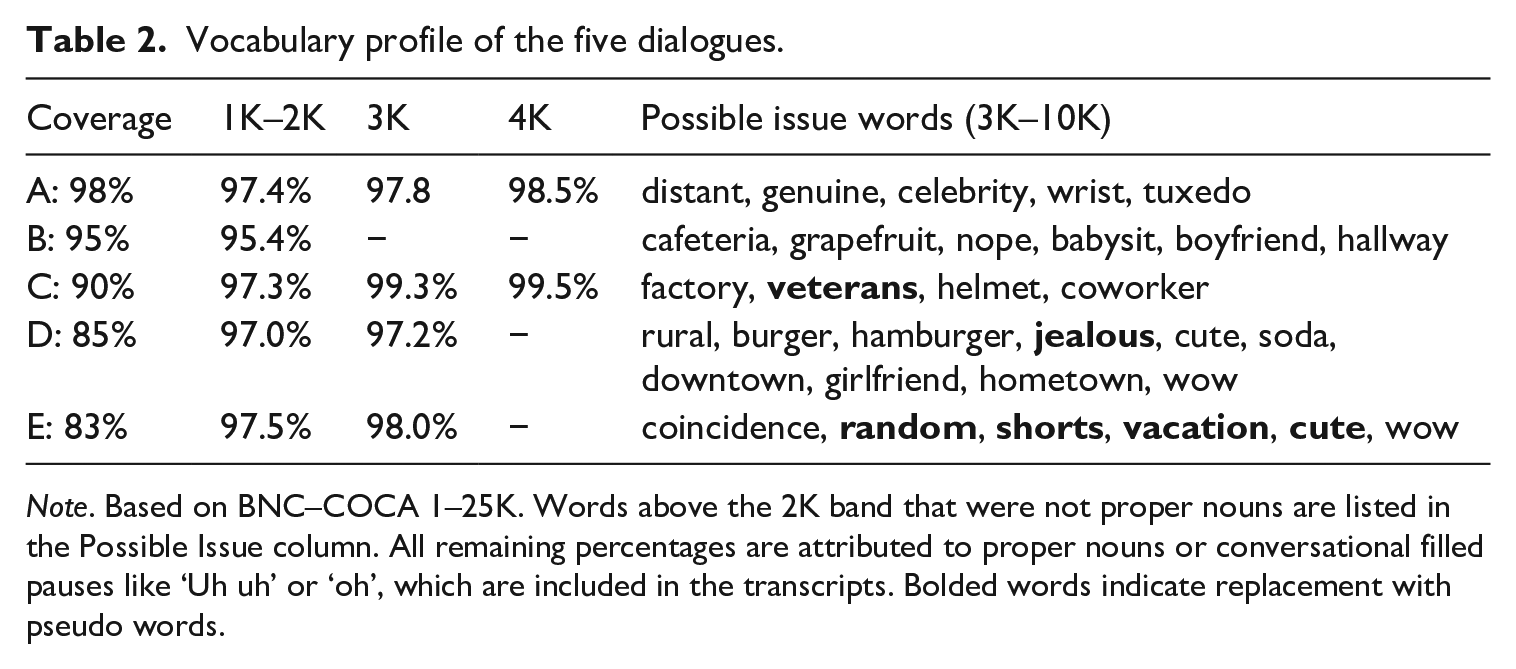
Note. Based on BNC–COCA 1–25K. Words above the 2K band that were not proper nouns are listed in the Possible Issue column. All remaining percentages are attributed to proper nouns or conversational filled pauses like ‘Uh uh’ or ‘oh’, which are included in the transcripts. Bolded words indicate replacement with pseudo words.
Following Van Zeeland and Schmitt’s (2013) research design, an increasing number of content words in the texts were replaced by pseudo words obtained from ARC Nonword Database (Rastle et al., 2002). Using the standard words of each text as a metric, 2%, 5%, 10%, 15%, and 17% of the total words were replaced with pseudo words that obey the orthographic and phonological rules of English. Content words were replaced with pseudo words with the same number of syllables, characters, and derivational morphemes. For instance, if the word writing were to be replaced with a pseudo word, the candidate pseudo word must contain seven characters, two syllables, and end in -ing. This procedure resulted in sentences such as, ‘So, one time, I wanted to
The unaltered dialogues were piloted as written texts first with four native English speakers and educators. They provided feedback on the wording of specific phrases. None of them reported that any particular dialogue was more difficult than any other before the pseudo words were included. After replacing the requisite number of real words, the altered dialogues were rated for difficulty by a fifth native English speaker who felt that the difficulty order did not match the increased frequency of pseudo words. This pilot participant felt that dialogue E was the easiest to read, followed by D, B, A and C. The opinion that dialogue C was the most difficult to read was supported by the readability statistics in Table 1.
b Recordings
Two native speakers of English and linguistics specialists with experience recording testing material recorded the audio for the dialogues in a quiet place. They were asked to read the scripts at a natural, conversational speed (approximately 180 wpm). False starts, filled pauses, and hesitations which did not hinder the flow of the dialogue were not re-recorded because it was important for the dialogues to sound authentic. The audio files were later edited for length, speech rate, volume, and pitch (Table 3).
Recording descriptive statistics.
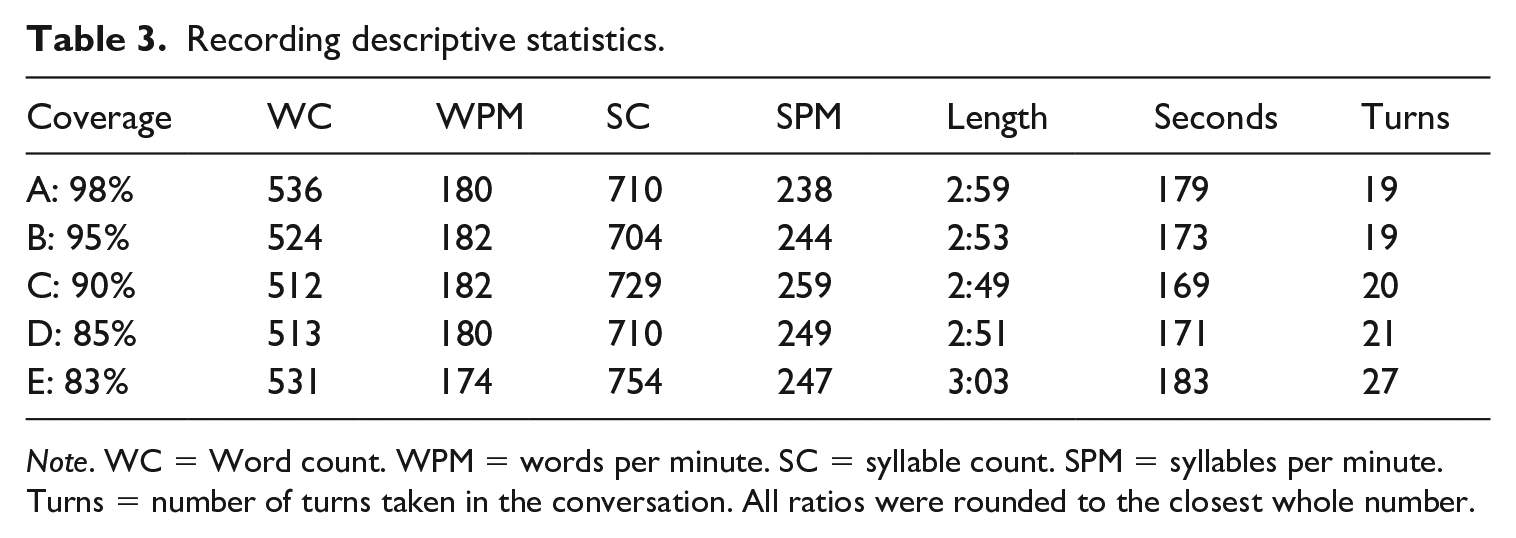
Note. WC = Word count. WPM = words per minute. SC = syllable count. SPM = syllables per minute. Turns = number of turns taken in the conversation. All ratios were rounded to the closest whole number.
After recording, the five recorded dialogues and multiple-choice questions were piloted with three multilingual, non-native English speakers and one native English speaker. They were all educators and researchers familiar with the project. They listened to the five dialogues in order from most lexical coverage to least lexical coverage and completed the tasks as the participants in the study would. They provided feedback on task flow, design, task difficulty, and multiple-choice item wording. Their feedback was essential in simplifying the flow and the wording of items. The listeners judged the difficulty of the dialogues: Dialogue A was the easiest and Dialogue E was the most difficult which followed the predicted pattern.
c Multiple-choice questions
A 10-item listening comprehension question quiz for each of the five dialogues were developed using the concept of idea units described in Van Zeeland and Schmitt (2013) and Hu and Nation (2000). The questions were piloted with native and non-native English speakers. All of the lexical items used in the quizzes fell within the first 2K frequency word bands on the BNC–COCA 1–25K list. However, on the rare occasions where lexical items were used that belonged in higher frequency bands or did not appear in the corpus (off-list words), the words were translated into Japanese or left untouched if they were loan words with similar meanings in Japanese. For instance, in Appendix 3 pose is a 3K frequency band word; however, it appears untranslated because the word pose is a loanword in Japanese which has the same meaning.
Item distractors were written and edited with the help of pilot participants to ensure that test-takers could not answer the questions correctly without listening to the dialogues. Additionally, to reduce guessing, an ‘I don’t know’ option was included on the test and participants were instructed not to guess when they were unsure of the answer. A Rasch analysis of the participants’ responses on all of the multiple-choice items revealed that item infit mean-square was between 0.5 and 1.5, and Z-standardized statistics were less than 2.0 for all the multiple-choice items. These results suggested that the items were appropriate for productive measurement of the listening construct and did not suggest that guessing was a problem with the tests (Bond & Fox, 2015; Linacre, 2007).
In accordance with similar research (Beglar & Hunt, 2014; Hu & Nation, 2000; Laufer & Sim, 1985; Stæhr, 2009; Van Zeeland & Schmitt, 2013), a score of 7 out of 10 (70%) was deemed a suitable cutoff score for adequate comprehension. Examples of the multiple-choice questions can be examined in Appendix 3. All questions were literal, as opposed to inferential, wh-questions relating to important events in chronological order. Every question had a direct and clear answer within the text.
d Dictation
Dictations are often used as in-class listening tasks to help improve bottom-up listening skills (Nation & Newton, 2009); however, they can also be used as an integrative listening assessments which have been used to test foreign language proficiency and shown to correlate with high-stakes general proficiency tests (Buck, 2001; Irvine, Atai, & Oller, 1974; Oller, 1971; Oller & Streiff, 1975). Following the advice of Wong and Leeming (2014) and Leeming and Wong (2016) regarding how to make, administer, and score a dictation task, a 116-word monologue that included a variety of grammatical forms was given as a proxy proficiency measure. Additionally, 96.2% of the lexical items were from the first 2K frequency bands on the BNC–COCA 1–25K corpus, with the additional 4% being well-known words such as vacation, aquarium, mall, and familiar pronouns such as Osaka. The participants listened to the dictation three times. The first and third times were at full-speed without any pauses (160 WPM). The second time included pauses of 15–20 seconds at natural phrasal boundaries. Phrases were separated at various run lengths between 5 and 13 words. As phrases become longer, working memory is increasingly taxed and syntactic and semantic knowledge becomes more necessary to reconstruct the text accurately. For grading purposes, spelling mistakes and word order mistakes were not penalized. If a word was recognizable by a native speaker, it was scored correctly. Each word was treated as a dichotomous item, either correct or incorrect. The data were analysed with using dichotomous Rasch analysis (Linacre, 2007) to evaluate the test’s adherence to the prescriptive model. Reliability, separation, and item fit were used to evaluate the test’s suitability to measure the listening comprehension construct. After comparing the results of the dictation to the dichotomous Rasch model, 98 of the original 116 items were include in the final version. The dictation test was suitably measuring the construct, general English proficiency, and separating the participants and the items into at least two levels of ability (person reliability = .88; person separation = 2.67; item reliability = .87; item separation = 2.56). Person ability estimates were exported into IBM SPSS Statistics for Windows (version 22) and used as a general English language proficiency measure. Dictation measures correlated significantly with self-report TOEIC scores (r = .32, p = .037) and the Pearson Four-Skills test (GSE) (r = .41, p = .006), suggesting that dictation scores can be a useful proxy for general English proficiency in this context.
3 Procedure
In the first week of the Fall semester, participants took the pen-and-paper dictation test, completed the background questionnaire and informed consent survey on Google Forms. During the second and third weeks of class, participants completed the Listening Vocabulary Levels Test (LVLT) in two parts on Google Forms (McLean, Kramer, & Beglar, 2015). They also completed a practice dialogue with practice items using an excerpt from the textbook to familiarize themselves with the treatment procedures. Many participants had issues using Google Forms at first and the treatment practice and procedure practice proved invaluable. It was important that the participants practiced the procedure and the data collection method before the actual testing began. All testing and procedures were conducted in the same classroom using classroom stereo equipment and the participants’ individual smartphones.
To avoid fatigue, participants listened to one dialogue each week which was administered in the middle of the 90-minute English communication-focused class to guarantee peak energy level, motivation, and attention. They listened to each dialogue two times as a class. After each listening attempt, they typed a short summary of the conversation in their L1 on a Google Form using their smartphones. After listening and summarizing twice, they completed the 10-item multiple choice quiz and a two-item, four-point Likert-like survey regarding topic familiarity and perceived difficulty (Appendix 4). The decision to provide two listening attempts was the same justification used by Van Zeeland and Schmitt (2013). This was intended to be a comprehension test, not a memory test. Requiring participants to answer the questions after only hearing the text one time would not be an accurate representation of an authentic listening situation during which a listener would have an opportunity to ask for clarification or repetition. After participants completed the summaries and multiple-choice questions, the class continued as normal. The entire procedure took fewer than 20 minutes of the 90-minute listening class for eight weeks. Absent students took the listening tests at a later time in similar listening conditions. However, make-up administrations to absent students were rare and occurred only five times in eight weeks, among all the participants.
IV Results and discussion
In order to determine if the participants in three intact classes had varying starting proficiencies, I conducted a series of one-way ANOVA on the available proficiency data. At the outset of the study I administered a dictation task and the Listening Vocabulary Levels Test (LVLT) to evaluate general listening proficiency and listening vocabulary level. One-way ANOVA showed the performance on dictation task (F (2,41) = 0.29, p = .746) and the LVLT (F (2,41) = 1.04, p = .362) were not statistically different between classes, suggesting that the proficiency and vocabulary knowledge of the participants involved were not significantly different at the outset of the study.
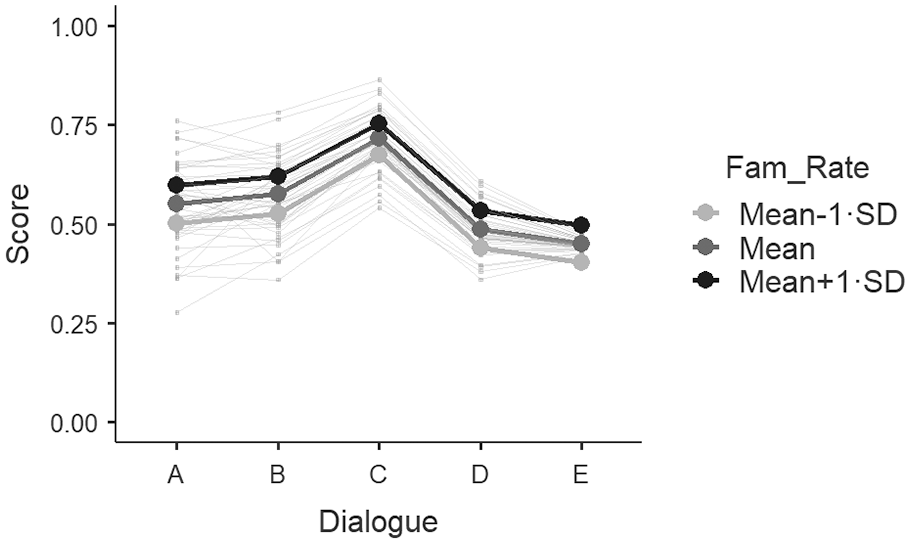
Visual examination of the histograms, analysis of descriptive statistics, multiple-choice data, and significant results on the Shapiro–Wilk test of normality for Dialogues B, C, D, and E, suggested that the data were not normally distributed and that parametric statistics were inappropriate. The descriptive statistics of the lexical coverage listening comprehension data suggested that participants who heard all five dialogues scored highest on Dialogue C with 90% lexical coverage (Table 4). If lexical coverage were the main variable in question in the tasks, then listener comprehension rates should fall as the amount of unknown words increase. The fact that participants scored highest on the 90% coverage dialogue was a counter-intuitive result that needed to be examined in detail.
Descriptive statistics for raw data for listening comprehension tests (n = 44).
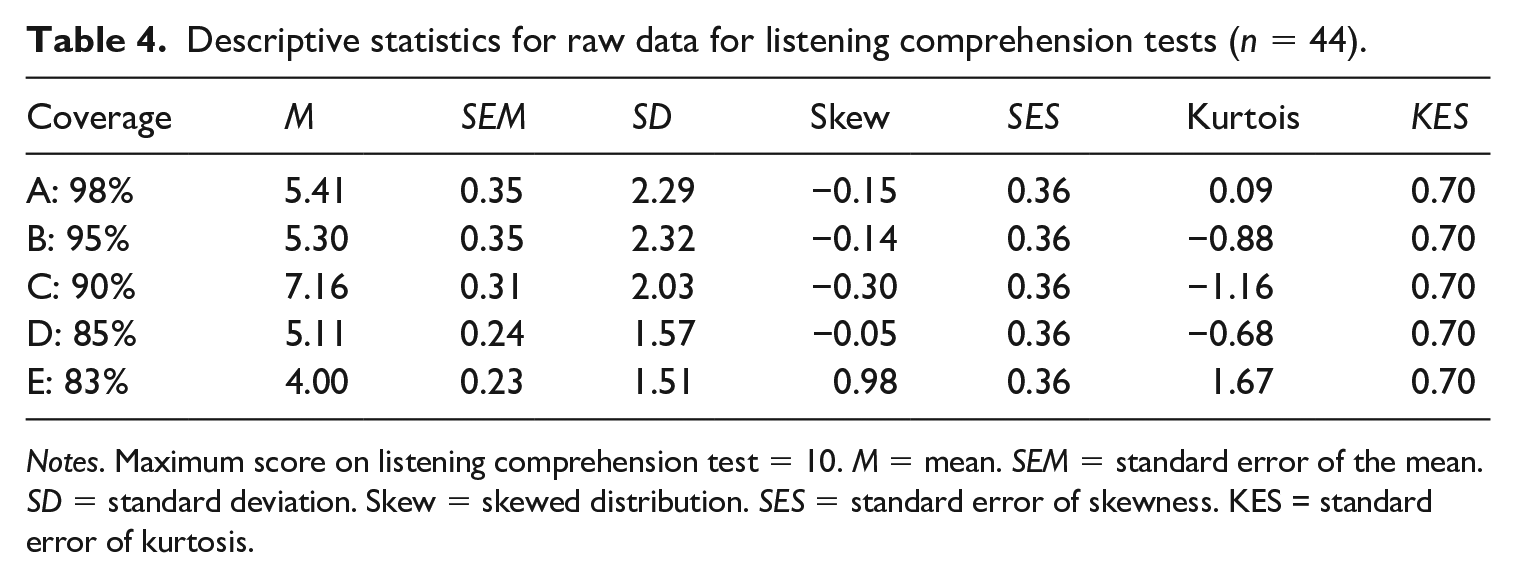
Notes. Maximum score on listening comprehension test = 10. M = mean. SEM = standard error of the mean. SD = standard deviation. Skew = skewed distribution. SES = standard error of skewness. KES = standard error of kurtosis.
Figure 1 shows the percentage of participants who achieved adequate comprehension (70%) for each of the lexical coverage levels. Forty-four participants listened to all five dialogues and the results suggest significant differences in their ability to comprehend the different texts at different lexical coverage levels. For 98% lexical coverage, 13 participants (29.5% of the participants) reached the 70% comprehension threshold; whereas as for the 90% lexical coverage, 28 participants (63.6%) were able to attain adequate comprehension. Further investigation of these differences suggested that there were significant differences between the participants’ scores on the five tests.
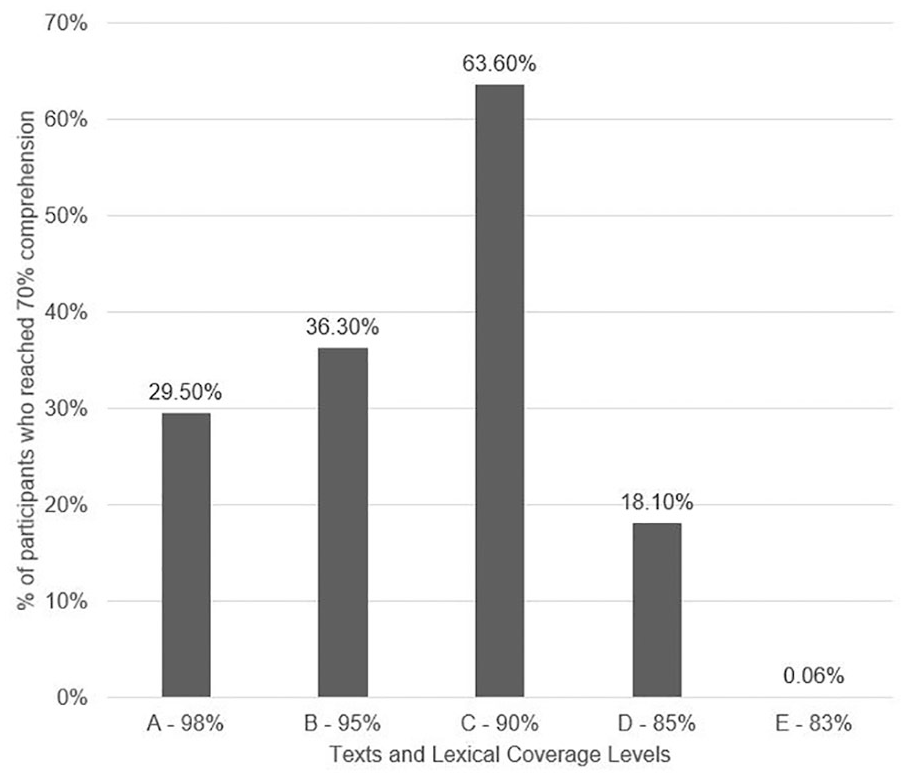
Frequency chart of adequate comprehension achieved on multiple-choice tests.
How do the results of this study support previous research in the field of listening lexical coverage? Previous studies suggest that there is a threshold for lexical coverage beyond which L2 listeners are unable to achieve adequate listening comprehension. This threshold is also demonstrated in this study, though in a counterintuitive way. Judging from the descriptive statistics, there did not seem to be any differences in student performance between 98%, 95%, and 85% lexical coverage. In other words, the students were able to perform similarly well – in this case poorly – on these topics with as few as seven unknown words and as many as 53 unknown words. This result suggests another factor other than lexical coverage was involved. There are four possible confounding variables to be explored: speech rate, practice effect, pseudo word distribution, and topic.
1 Speech rate
A possible cause of the relatively poor performance on the 98% and 95% lexical coverage tasks could have been speech rate. As shown in Table 3, the average speech rate of 179.6 WPM (247.4 SPM) in this study is high for non-native speakers of English. While the dialogues’ speech rates were carefully controlled in the current study, it is possible that the participants’ listening comprehension scores were suppressed by the shock of the fast speech rate for the first two tasks and then they became use to the speech rate and particular mannerisms and inflections of the speakers on the recordings. However, it is important to remember that the participants had a practice session the previous week with a similar text at a similar speech rate, two opportunities to listen to each dialogue, and two opportunities to summarize the conversations as a part of the immediate recall task in their L1. Additionally, all of the participants were able to successfully complete a dictation recorded at 160 WPM, a much more cognitively demanding task.
The mean speech rate for the dialogues in this study fell below Tauroza and Allison’s (1990) native English interview speech rate of 190 WPM (250 SPM) for dialogic interviews suggesting that this speech rate should be easier to understand than an unaltered, native speaker interview dialogue. This speed was chosen to represent an authentic listening situation: overhearing two native speakers of English discuss a story from one of the speakers’ past at an average speed. Additionally, these students were participating in a one-year extensive listening program in which they were exposed to a wide variety of speaking styles, registers, and speech rates. In general, performance would have been better at a slower speech rate; however, speech rate does not seem to have been the main cause of the surprising results with dialogue C at 90% lexical coverage. If speech rate were the confounding factor, one would expect performance on all tasks to be below the comprehension threshold because speech rate was held consistent through all five dialogue tasks.
2 Practice effect
There is an argument to be made for randomizing the tasks so that none of the participants received the tasks in the same order. Doing so could have reduced a possible testing threat. This is one of the methods van Zeeland and Schmitt (2013) used to avoid a practice effect. However, there is one main reason reasons why this was not implemented in the current study. First, motivation and self-efficacy in the L2 classroom are individual difference variables that can acutely affect learner performance. It is possible to demotivate participants by giving them an impossible task without preparation. At the outset of this project, based on the evidence of past research and piloting, Dialogue D and Dialogue E would likely be impossible for most of participants. The fact that some of them were able to achieve adequate listening at 85% and 83% lexical coverage is a surprising finding in itself. As such, I could not, in good conscience, assign tasks that I felt would be impossible to any group of participants as the first task in the sequence. Their inevitable failure would have tainted their perspective of the following tasks and reduced their attention and focus going forward.
3 Pseudo word distribution
The third possible cause of differences in listening comprehension based on pseudo word replacement to investigate lexical coverage effects is the types of words replaced. No other lexical coverage studies in listening have investigated the part of speech of pseudo word replacements. This information is essential to replicability of pseudo word lexical coverage studies. Nouns and verbs have higher informational content than adjectives and adverbs. Take as an example the sentence: I have a new computer. If one were to replace the adjective in this sentence with a pseudo word, I have a sen computer, a reader or listener would have a high chance of processing the key information in this sentence as the main idea is still available. If one were to replace the verb in this sentence, I garn a new computer, the sentence requires additional processing. If the learner has access to the orthography of the sentence and has time to discover the pseudo word rules, they could eventually decipher the word that the pseudo word has replaced. Listeners have a more challenging task in understanding this sentence due to the lack of orthographic representation but could still understand the basic content. Lastly, if one were to replace the noun so that the example sentence read, I have a new sliperlo, without the context of the surrounding sentences, a reader or a listener would have no recourse for understanding the meaning of the sentence. This difference in lexical richness or content importance was seen in an investigation of lexical richness in different discourses and registers in Dutch (Van Gijsel, Speelman, & Geeraerts, 2006). They found that nouns had higher lexical richness ratings than adjectives, verbs, and function words. They suggested that nouns are, on average, more lexically rich than adjectives and verbs and that lexical richness varies with topic and genre.
With regard to this study, Table 5 shows the distribution of pseudo words by part of speech in each of the five dialogues. Dialogue A had a total of seven pseudo words in the text, five of which were nouns accounting for 71.4% of the replaced words and two of which were adjectives accounting for the remaining 28.6% of the total number of replaced words. In comparison, Dialogue C had a total of 36 words replaced with pseudo words, five verbs, 17 adjectives, and 14 nouns. It is clear that there is a large variation in pseudo word replacement based on part of speech. This is a hidden variable for which no other lexical coverage study has attempted to account. In order to remove this possible variable, there is a solution: the same percentage of nouns, verbs, adjectives, and adverbs should be removed from each text. However, this would not address the issue of lexical richness of individual words from different texts affecting comprehension. For instance, the nouns in Dialogue A might be more or less lexically rich or important than the nouns in Dialogue B due to the topic of the texts.
Pseudo word distribution by part of speech (percentages in parentheses).
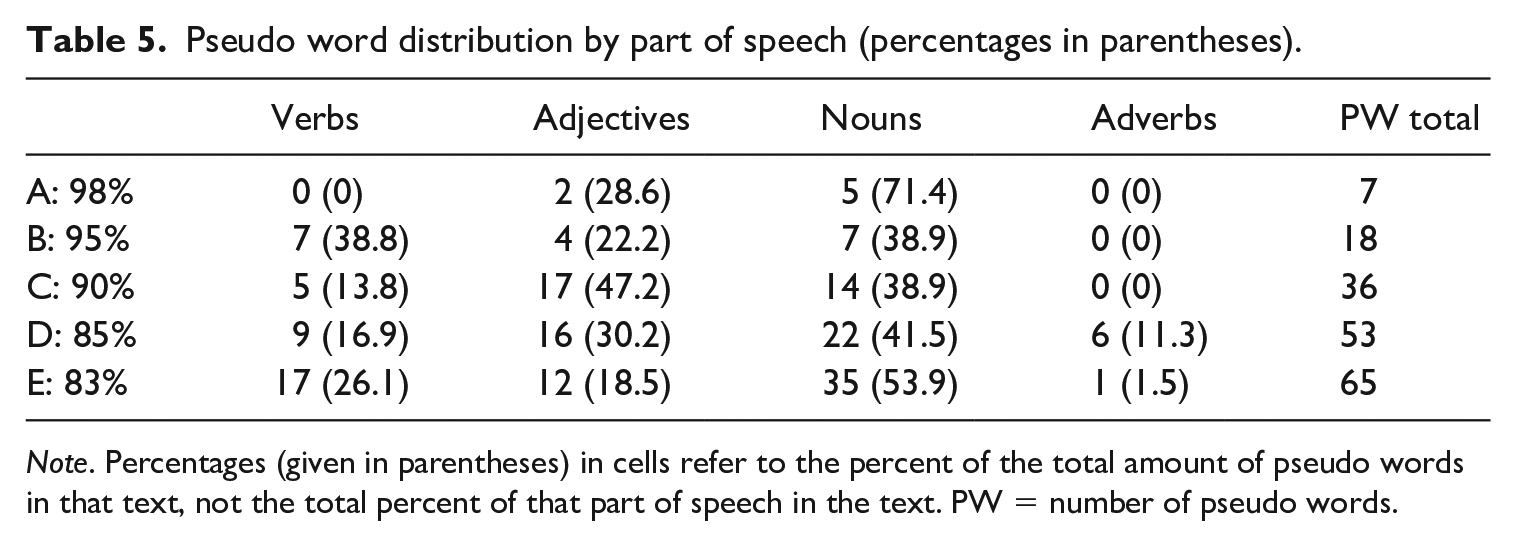
Note. Percentages (given in parentheses) in cells refer to the percent of the total amount of pseudo words in that text, not the total percent of that part of speech in the text. PW = number of pseudo words.
Could the five nouns replaced by pseudo words in Dialogue A be a cause of the participants’ poor performance on that listening text? In Dialogue A the word show, camera, and problem were replaced with pseudo words. The word camera is helpful for understanding the story, but the story is related to taking pictures and that phrase was not replaced. It is reasonable to conclude that the participants did not need the word camera, though it might have been helpful to reach adequate comprehension of the text as a whole. None of the multiple-choice items required knowledge of the word camera specifically.
4 Topic
In an attempt to address this, participants rated each dialogue for topic familiarity and difficulty immediately after completing the multiple-choice questions before seeing the results. Correlation analysis of this data showed that participants who rated the text as more familiar and easier to understand were able to attain higher listening comprehension scores for some of the texts but not others. Dialogue B and Dialogue D scores were not significantly related to participants’ ratings of familiarity or difficulty. Dialogue A scores were significantly positively correlated with familiarity (rs = .40, p = .007) and perceived simplicity (rs = .32, p = .034). Dialogue C scores were significantly positively related to perceived simplicity (rs = .35, p = .02), but not to familiarity (rs = .25, p = .098). Dialogue E scores were significantly related to both familiarity (rs = .35, p = .019) and perceived ease (rs = .38, p = .012). These results are inconclusive but suggest that in some cases, topic familiarity and perceived ease are significantly positively related to participant listening comprehension.
In order to investigate the possible causes of performance differences between the dialogues in a more systematic way, the data were further analysed using generalized linear mixed modelling (GLMM) with the jamovi software (version 1.2.27.0; The jamovi project, 2020) using the GAMLj module (Gallucci, 2019). Jamovi is a free-to-use statistical package based on the R programming language (R Core Team, 2019). Mixed models allow for analysis of fixed effects, as is traditional with regression analysis, while also allowing the flexibility to assess random effects. Observations that are nested within participants, as is the case in these data, are not independent of each other and the errors of these measurements are also not independent. These data should not be examined using an analysis that assumes that these errors are uncorrelated and that these measurements are independent observations, such as traditional regression analysis. Parametric statistics should only be used when the data have met the assumptions of those particular tests, e.g. normal distribution, homoscedasticity, or sphericity. However, mixed-effects models are robust to missing data and violations of these assumption (Linck & Cunnings, 2015). In particular, the GLMM, applied here, allows for the analysis of discrete or dichotomous outcome variables with binary, continuous, or ordinal covariates. It functions as a multilevel logistic regression analysis using odds ratios to estimate how fixed and random effects affect the binary outcome variable (Snijders & Bosker, 2012).
The current data were reorganized in such a way that the five dialogues (Dialogue A–E) were nested within participants (ID): the cluster variable for this data set. This resulted in each participant having 50 rows of data, one row for each dichotomously scored item on the multiple-choice tests (Score). Score was treated as the discrete dependent variable while ordinal data for familiarity (Fam) and difficulty (Dif) ratings were included as ordinal predictors at the task level (though difficulty rating was eventually removed from the models as it was not productive). Additionally, the dictation scores (Dict) were included in the models as a continuous fixed-effect predictor of proficiency at the individual level. The data were explored in three models fit using the logit link function and odds ratios for logistic data; the random intercept for individuals model which included the Dialogue tasks as a categorical factor (Model 1), fixed effects predictors and interactions model (Model 2), and the random intercept and random slopes for Dialogues model (Model 3). These are the R formula for each model:
Model 1: Score ~ 1 + Dialogue + (1 | ID)
Model 2: Score ~ 1 + Dialogue + Dict + Fam + Dialogue:Dict + (1 | ID)
Model 3: Score ~ 1 + Dialogue + Dict + Fam + Dialogue:Dict + (1 + Dialogue | ID)
With each progressive model, goodness-of-fit statistics such as log likelihood, R-squared (marginal and conditional), Akaike information criterion (AIC), Bayesian information criterion (BIC), and Deviance trended downward which suggests that the additional models were providing better insight into the data (Table 6). Model comparison data and results for preliminary Model 1 and Model 2 are shown in Table 6; however, only the results of Model 3, the random intercept and random slopes model, will be discussed in detail and all Figures and graphics refer to this model. Conditional R2 for Model 3 suggests that the combination of both fixed and random effects reduces the error of approximation by 14% (R2cond = .144).
Model specifications.
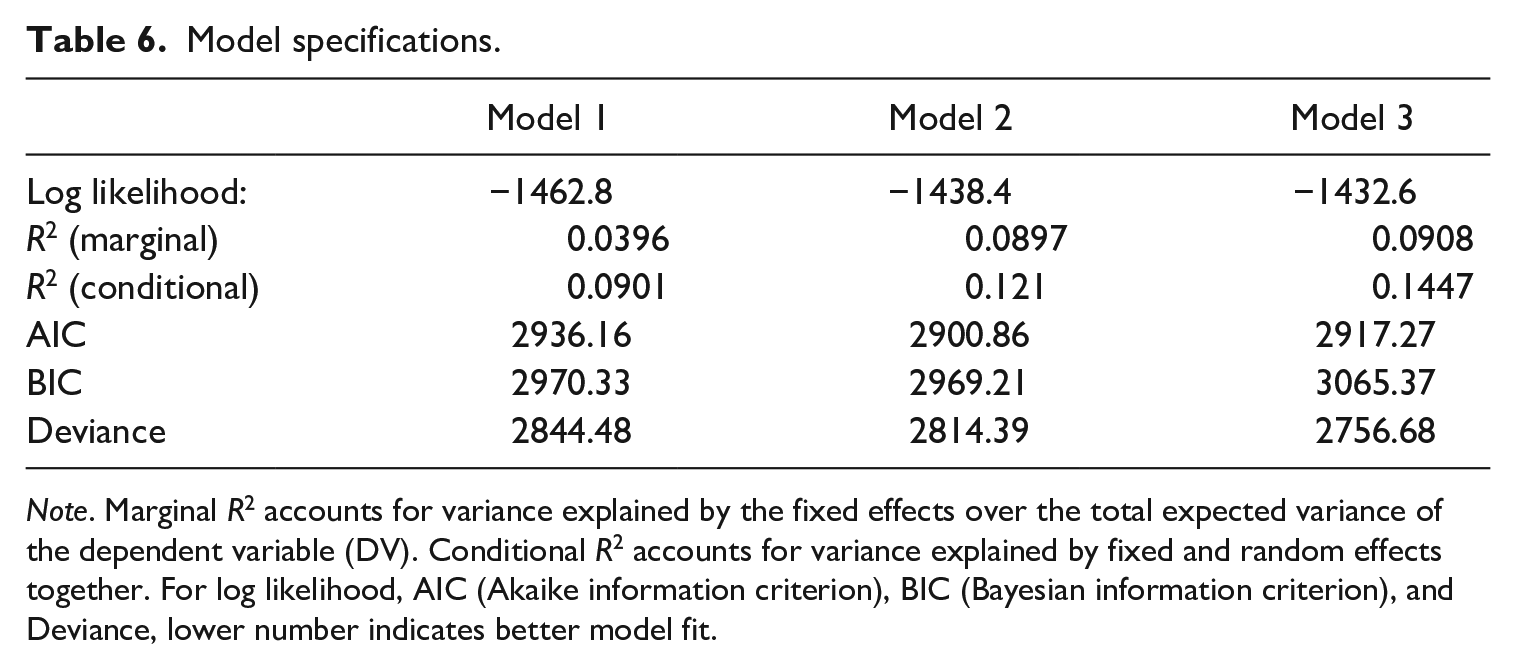
Note. Marginal R2 accounts for variance explained by the fixed effects over the total expected variance of the dependent variable (DV). Conditional R2 accounts for variance explained by fixed and random effects together. For log likelihood, AIC (Akaike information criterion), BIC (Bayesian information criterion), and Deviance, lower number indicates better model fit.
Main effects were considered significant at p ⩽ 0.05. The omnibus Chi-squared results for the main effects and their interactions in Model 3 (Table 7) suggest that there were significant differences in outcomes on the dialogue tasks when intercepts are allowed to vary randomly across individuals even when accounting for other predictor variables. This result was consistent with the descriptive statistics. Further exploration of the data and the random effects structure allowed a more nuanced description of how these participants completed the listening tasks.
Fixed effect omnibus test.

Note. 2,200 observations, 44 groups (ID).
A simple coding factor was used within Jamovi to compare different levels of the factor (Dialogue) to the initial level (Dialogue A). In this case, as can be seen in Table 8, performance on Dialogue B, C, D, and E were compared in contrast to performance on Dialogue A. A positive parameter estimate and z-statistic for this contrast suggests that participants were more likely to get higher scores on that task than Dialogue A; whereas a negative estimate and z-statistic suggests that the participants were less likely to achieve a higher score on that task than on Dialogue A. This type of contrastive comparison is useful in this case because Dialogue A should have been the easiest task as it contained the highest level of lexical coverage, 98%. Table 8 shows that there are significant differences in performance between Dialogue C and Dialogue A (estimate = 0.7192, SE = 0.178, exp(B) = 2.053, 95% CI [1.45–2.91], z = 4.03, p < .001). Participants were approximately twice as likely to score higher on Dialogue C than on Dialogue A. In contrast, participants were significantly less likely to get higher scores on Dialogue E than on Dialogue A (estimate = −0.404, SE = 0.166, exp(B) = 0.66, 95% CI [0.48–0.93], z = −2.43, p = .015). This result was to be expected from the design of the study. Dialogue A should have been much easier than Dialogue E, this is also evident from the descriptive statistics.
Fixed and random effects parameter estimates for random intercept and random slope model.
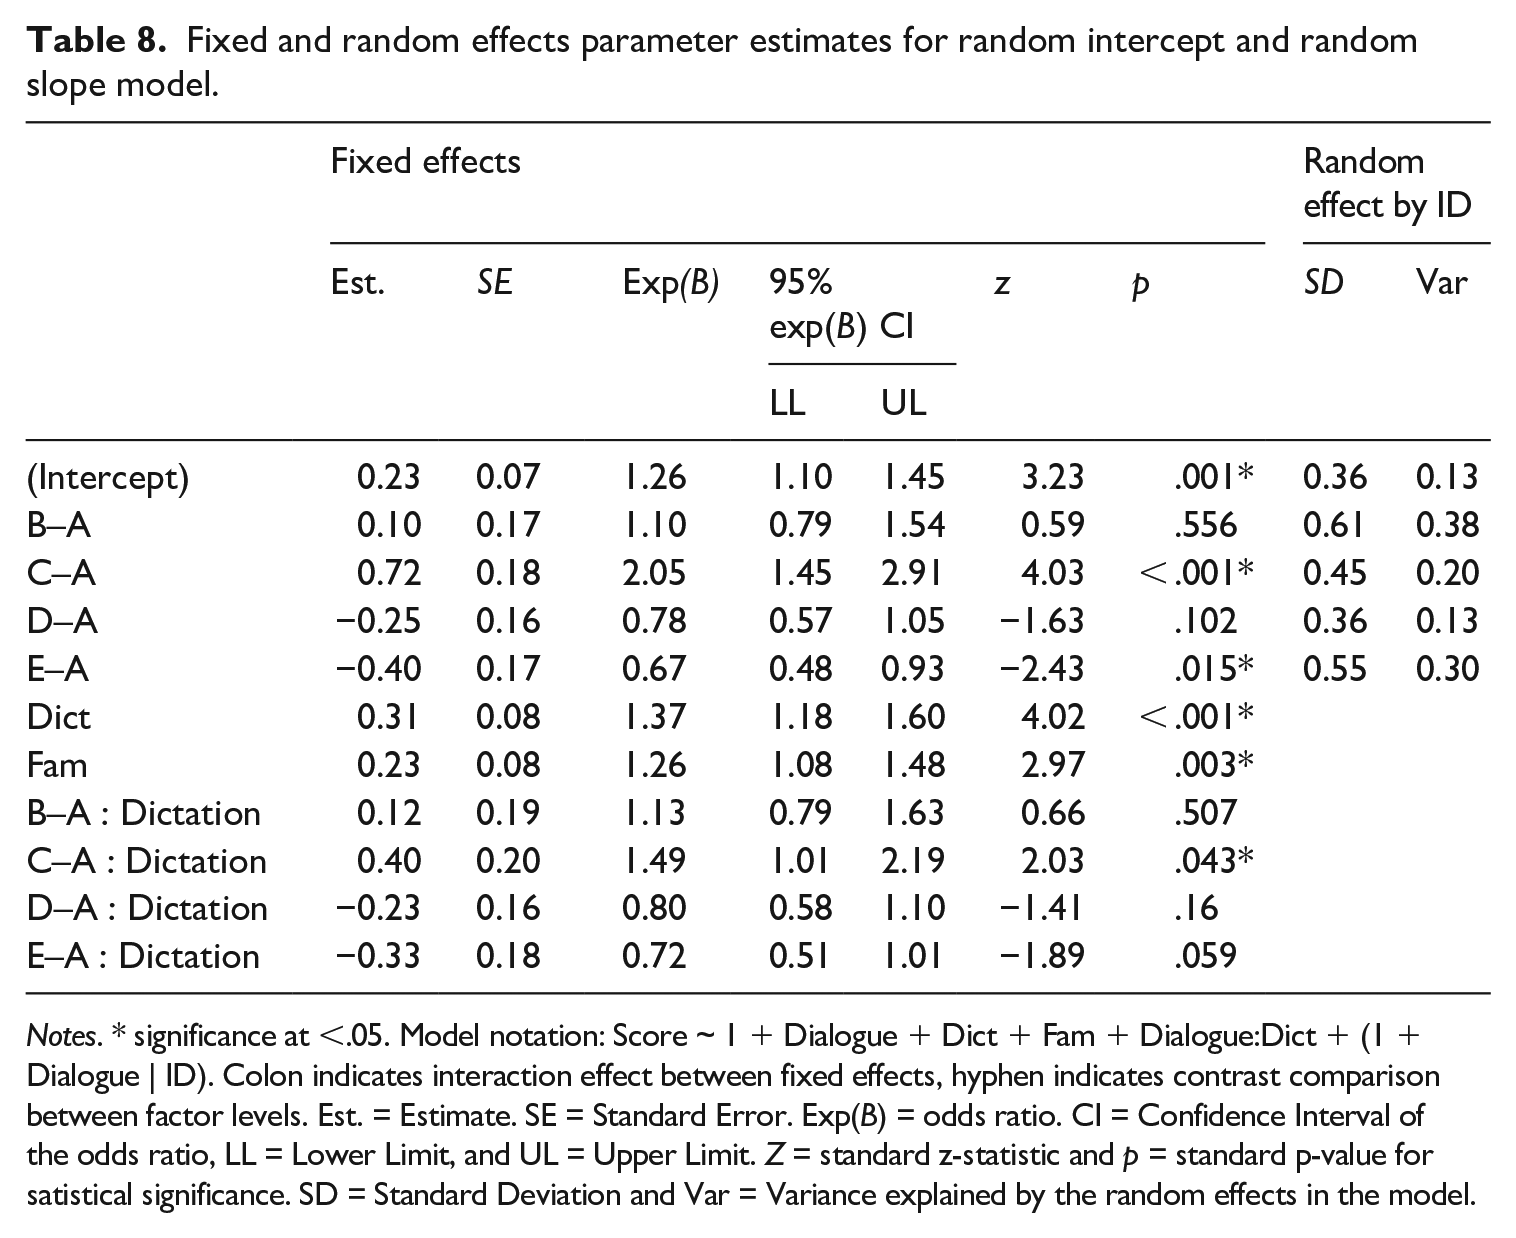
Notes. * significance at <.05. Model notation: Score ~ 1 + Dialogue + Dict + Fam + Dialogue:Dict + (1 + Dialogue | ID). Colon indicates interaction effect between fixed effects, hyphen indicates contrast comparison between factor levels. Est. = Estimate. SE = Standard Error. Exp(B) = odds ratio. CI = Confidence Interval of the odds ratio, LL = Lower Limit, and UL = Upper Limit. Z = standard z-statistic and p = standard p-value for satistical significance. SD = Standard Deviation and Var = Variance explained by the random effects in the model.
Participants who scored higher on the dictation proficiency test had approximately 1.3 times increased probability of scoring higher on all five tasks (estimate = 0.31, SE = 0.08, exp(B) = 1.37, 95% CI [1.18–1.60], z = 4.02, p < .001). These results suggest, unsurprisingly, that students who are able to score higher on a more cognitively challenging dictation task (a proxy proficiency test), are more likely to score higher on these dialogues. Figure 2 shows the fixed and random effects plot for the performance on the five dialogues separated by dictation scores. Scores for dictation are separated into three predictive lines, low (mean –1SD), the mean, and the high (mean +1SD). From this Figure, it is evident that for the Dialogues A, B, and C, there is a performance difference for those participants who have higher and lower abilities. Participants with dictation scores one standard deviation above average had a stronger increase in probability to score well on Dialogue C. There could be a variety of explanations for this difference, such as more automatic bottom-up skills such as decoding and word recognition, and better top-down processing skills such as listening strategy implementation and guessing from context. However, these explanations are outside the purview of the current research project.

Effects plot for Dialogue tasks separated by dictation scores.
What is also clear is that this advantage for proficiency seems to disappear for Dialogues D and E. Considering that Dialogue D represented a text with approximately 85% lexical coverage and Dialogue E represented a text with approximately 83% lexical coverage, it is likely that these tasks lacked necessary lexical detail for participants to understand the gist of the dialogue regardless of their proficiency. Table 8 also shows a significant interaction between dialogue and dictation. This interaction is only significant in the contrast between Dialogue C and Dialogue A (estimate = 0.40, SE = 0.20, exp(B) = 1.49, 95% CI [1.01–2.19], z = 2.03, p = .043). This significant interaction suggests that more proficient English users were associated with an increased probability of scoring higher on Dialogue C than Dialogue A than average. Figure 3 shows the effects plot for this interaction. The graph shows the same flat regression slope for Dialogues D and E which suggests that the probability of scoring well on those tasks does not change much depending on proficiency as estimated by the dictation test. The increasing slopes for Dialogues A, B, and C suggests that as proficiency increases, the likelihood of scoring higher on these tasks also increases and this predicative effect is more pronounced for Dialogue C.
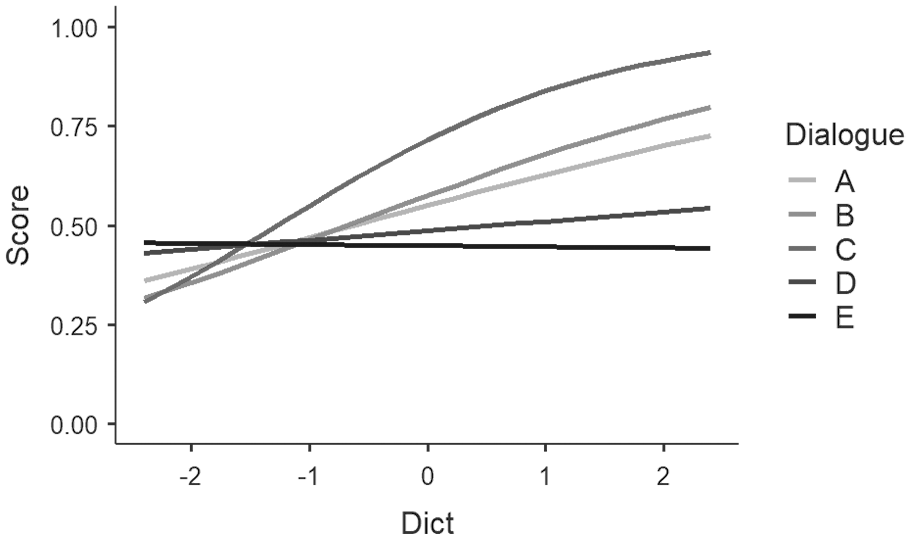
Effect plot for score predicted by dictation scores.
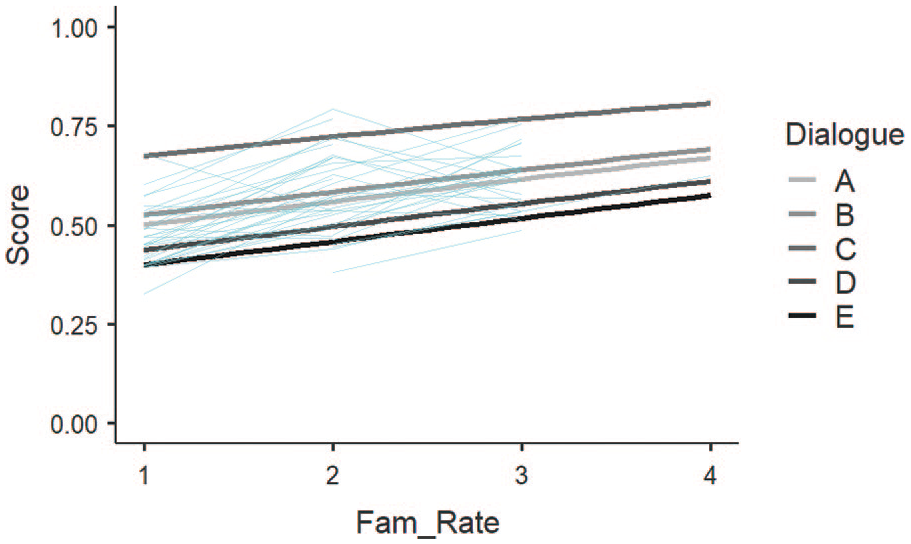
Turning attention to familiarity as a predictor for success on the dialogue tasks, Table 8 shows that participants who rated the tasks as being more familiar were associated with increased probability of scoring higher on dialogues (estimate = 0.23, SE = 0.08, exp(B) = 1.26, 95% CI [1.08–1.48], z = 2.97, p = .003). These results can be visualized in Figure 4 and Figure 5. Figure 4 shows the fixed and random effects for the dialogue scores accounting for participants familiarity rating. A similar, but less pronounced, peak in likelihood scores for Dialogue C is evident; however, the difference in the low, mean, and high standard deviation values are parallel across all five tasks because there is no significant interaction effect between Familiarity ratings and Scores (Figure 5). This result suggests that familiarity with the topic could have a significant predictive effect on successful comprehension of the dialogue which might help a listener overcome higher numbers of unknown vocabulary.
Effect plot for Dialogue scores separated by familiarity rating.
Effect plots for familiarity scores separated by dialogue task.
This interpretation is consistent with the informal interviews with participants regarding Dialogue C. After noticing the trend in scores for Dialogue C in comparison to the first two tasks, I briefly interviewed three random participants about why they did so well on the third task but did so poorly on the first two tasks. They responded by saying that Dialogue C was easier to imagine, easier to follow, and more concrete. A one-question Likert-type survey and an ad hoc interview is not an ideal way of testing background knowledge or topic familiarity. There are better ways to remove this variable from the discussion including, including better methodological planning using multiple groups and a switching replication design. That said, these GLMM results suggest that individual proficiency and familiarity with the topic significantly affected participants’ ability to score well on the dialogue tasks. No other lexical coverage study has attempted to account for the differences in comprehension taking topic familiarity into account.
V Conclusions
The results of this study confirm those found in previous lexical coverage in listening studies (Noreillie et al., 2018; Van Zeeland & Schmitt, 2013) in that a majority of L2 learners are able to achieve adequate listening comprehension scores at 90% lexical coverage level. This study is novel in that it evaluated L2 listeners’ ability to comprehend dialogues rather than monologues and similar results suggest that discourse structures (monologic or dialogic) might not prove to be significant factors in listening comprehension. Future research comparing discourse structure and lexical coverage should include both monologic and dialogic versions of the same listening texts at different lexical coverage levels presented in a counter-balanced design to ensure participants’ familiarity with the topic does not affect listening comprehension. The results of this study suggest an unexpected outcome involving the third dialogue in the series. Dialogue C, the text with 90% lexical coverage, was significantly easier for participants to understand and the possible reasons for this unusual result include proficiency and topic familiarity.
There are a number of limitations to the current study, many of which have already been discussed. First, convenience sampling, sample size, and text choice limit the generalizability of these results, thus generalizing the results of these analyses to other contexts should be done carefully. The freshman students at this university and in this department are not representative of Japanese university students in general. Second, it is important that researchers attempt to control representation of pseudo words across all texts, lexical coverage levels, and parts of speech – nouns, adjectives, verbs – to ensure that each text is as similar as possible. This distribution of pseudo words in lexical coverage studies is an unknown factor in this type of research and should be planned carefully. Lastly, the choice to use different texts at different lexical coverage levels introduces a confounding variable which many lexical coverage studies do not address. Additional steps to counter-balance texts and lexical coverage levels should be taken in the research study design stage to ensure that the topics and background knowledge do not affect listening comprehension results.
Although there are clear limitations to the current study, it is hoped that it adds to the body of research and encourages other researchers to continue investigating lexical coverage in listening. This topic is underresearched and more information is required to provide detailed practical instructions to language teachers. Extensive reading has a set of prescriptions and suggestions for material difficulty and lexical coverage in order to get the most benefit out of the practice. The general guideline for lexical coverage of a text used for extensive reading is between 95%–98% (Hu & Nation, 2000; Laufer & Ravenhorst-Kalovski, 2010). However, the guidelines for amount of unknown words required for beneficial extensive listening practice is more nebulous. Teachers and researchers have few empirical studies on which to base their pedagogical decisions. If the current study in conjunction with Noreillie et al. (2018) and Van Zeeland and Schmitt (2013) are used to make pedagogical decisions, teachers have a much wider range of texts (90%–98% lexical coverage) at their disposal than the extensive reading and lexical coverage research would suggest.
Footnotes
Appendix 1. Dialogue A: 98% coverage
Note. Bolded words indicate pseudo words.
Appendix 2. Dialogue E: 83% coverage
Note. Bolded words indicate pseudo words.
Appendix 3. Story E: Listening comprehension questions
Appendix 4. Google form layout
Acknowledgements
I would like to thank Paul Leeming, David Beglar, and other colleagues for piloting help and providing advice while conducting and preparing this study for publication. Without their assistance, this project could not have happened.
Funding
The author received no financial support for the research, authorship, and/or publication of this article.