




Abstract
Understanding the factor structure of autistic symptomatology is critical to the discovery and interpretation of causal mechanisms in autism spectrum disorder. We applied confirmatory factor analysis and assessment of measurement invariance to a large (N = 9635) accumulated collection of reports on quantitative autistic traits using the Social Responsiveness Scale, representing a broad diversity of age, severity, and reporter type. A two-factor structure (corresponding to social communication impairment and restricted, repetitive behavior) as elaborated in the updated Diagnostic and Statistical Manual of Mental Disorders (5th ed.; DSM-5) criteria for autism spectrum disorder exhibited acceptable model fit in confirmatory factor analysis. Measurement invariance was appreciable across age, sex, and reporter (self vs other), but somewhat less apparent between clinical and nonclinical populations in this sample comprised of both familial and sporadic autism spectrum disorders. The statistical power afforded by this large sample allowed relative differentiation of three factors among items encompassing social communication impairment (emotion recognition, social avoidance, and interpersonal relatedness) and two factors among items encompassing restricted, repetitive behavior (insistence on sameness and repetitive mannerisms). Cross-trait correlations remained extremely high, that is, on the order of 0.66–0.92. These data clarify domains of statistically significant factoral separation that may relate to partially—but not completely—overlapping biological mechanisms, contributing to variation in human social competency. Given such robust intercorrelations among symptom domains, understanding their co-emergence remains a high priority in conceptualizing common neural mechanisms underlying autistic syndromes.
Introduction
A key constraint in efforts to elucidate the biology of autistic syndromes involves an (as yet) imperfect understanding of how and why the observed clinical features of the autistic syndrome—traditionally including deficits in reciprocal social behavior, communicative impairment, and stereotypic behavior/restricted interests—co-vary (i.e. “travel” together) in nature. Although some studies in the general population have suggested that inherited influences on the three classic domains of autism spectrum disorder (ASD) symptoms are substantially (Happe and Ronald, 2008) or partially independent of one another (Ronald et al., 2006a, 2006b, 2008), important caveats to such analyses are that they can be confounded by measurement methods that do not ascertain autistic symptoms and traits with adequate specificity (e.g. capturing social variation related to antisocial behavior or communicative variation related to Specific Language Impairment (SLI)), or across the full range in which autistic traits and symptoms manifest themselves in nature.
Furthermore, heterogeneity in the mechanisms that confer susceptibility to autistic symptomatology can give rise to disparate estimations of both heritability and symptom structure, depending on the characteristics by which a given sample is ascertained. Although it is now estimated that a substantial proportion of cases of autistic syndromes are familial (Constantino et al., 2013; Klei et al., 2012)—and that familial autistic syndromes share causal influences with milder (subclinical) manifestations of autistic symptomatology (Constantino et al., 2006, 2010; Piven et al., 1997; Robinson et al., 2011)—sporadic autistic syndromes influenced by rare, highly penetrant, de novo mutations account for at least 10%–15% of cases, many of which reflect symptom patterns that are uniquely influenced by their respective (and disparate) genetic origins. Thus, samples preferentially incorporating sporadic (simplex) autism versus familial (multiplex) autism or general population subjects might understandably manifest some elements of contrasting factor structure (Virkud et al., 2009).
The Social Responsiveness Scale (SRS) is a quantitative measure of traits and symptoms that, in aggregate, distinguish autistic syndromes from other variations in human behavior, and that are highly heritable. SRS measurements of the traits that have historically characterized the “autism triad” have exhibited—consistently and across cultures (Bolte et al., 2008; Constantino et al., 2004; Kamio et al., 2012)—very strong intercorrelations. These and other studies, using other measures, have supported the collapse of separate social and communication criterion domains featured in DSM-IV to a single criterion set (“social communication”) in DSM-5. However, this change comes at a time of rapid discovery in elucidating the diversity of causal influences on ASD (Constantino et al., 2013; Klei et al., 2012; Sanders et al., 2012). New pathways involving single gene mutations, co-occurring variation in small groupings of risk genes, or the joint effects of numerous common variations in specific combinations are being identified. Given that autistic syndromes may arise as a function of monogenic versus polygenic causation, or may occur with versus without intellectual disability, motor impairment, epilepsy, or physical dysmorphism, the interpretation of parsimonious factor structures takes on new meaning. If, across the diversity of autistic syndromes, there exist relatively robust intercorrelations among symptom domains, the continued pursuit of a biological understanding of their co-emergence in the development of many or most autistic syndromes remains a high priority in conceptualizing common underlying neural mechanisms.
Given the possibility that, because of the diversity of causal pathways, factoral separation or parsimony in autism may only be relative (rather than absolute), or may be distinct for subpopulations of subjects (e.g. representing simplex versus multiplex autism as discussed above), it is important to continue to examine data from large populations encompassing the full diversity of manifestations of this axis of human social variation. The availability of quantitative indices of such variation furthermore makes it possible to move beyond the question of “how many factors are there” to consider the magnitude of overlap/separation that exists between factors. “Fine-grained” separation of factors or sub-factors becomes increasingly possible (in a mathematical sense) in samples of large size that have progressively higher statistical power to differentiate subtle factoral separations. These are potentially relevant when the samples and measures are reasonably representative of the range of autistic trait variations that occur in nature. Previous studies involving the SRS have emphasized analysis based on the use of a total score that reflects variation in a single underlying factor empirically derived from exploratory factor analyses of data incorporating sample sizes in the range from several hundred to 1000 subjects (Constantino et al., 2004, 2007; Constantino and Todd, 2000) focused primarily on general population subjects and children in multiplex (familial) autism samples. The present study, however, capitalizes on the availability of data from much larger sample sizes that now include substantial proportions of simplex (sporadic) ASD cases, with the goal of refining and clarifying what has been learned about factor structure from previous studies.
Several recent studies have helped motivate our analytic approach. Using quantitative data from the Interactive Autism Network (IAN) National Volunteer Register, Frazier et al. (2012) demonstrated the ability of two empirically separable yet highly correlated factors (recapitulating the two DSM-5 criterion sets defining ASD) to jointly differentiate children diagnosed with ASD from their undiagnosed siblings, with a level of precision that exceeded that of single-factor scores. Other factor analytic studies using distinct measures have further supported the existence of two primary symptom dimensions (Snow et al., 2009; van Lang et al., 2006); however, there are exceptions (Norris et al., 2012). The recent work of Duku et al. (2013) featured a focus on ASD-affected children during a specific developmental period, examining data on 48- to 60-month-old children with new autism diagnoses (n = 339) who were assessed using the SRS by parent-report. Confirmatory factor analysis originally yielded an unsatisfactory fit to a unidimensional model; however, Rasch analysis elucidated a subset of 30 items with a unidimensional factor structure; the items in this subset represented a broad array of ASD symptoms encompassing deficits in social awareness, social cognition, social communication, and autistic mannerisms. Illustrating potential effects of very large sample sizes for the identification of subtler elements of factoral separation, Beuker et al. (2013) applied confirmatory factor analysis to developmental screening questionnaire data on ASD symptoms completed by mothers of 11,332 18-month-old children, and concluded that a three-factor model had a significantly better fit then the two- and one-factor models of ASD symptoms in this age group; a potential caveat is that the screening items may have tapped a range of developmental disability symptoms that extend beyond those that share causal influences with ASD (to include, for example, the many forms of SLI).
The present study
The primary aim of the present study was to conduct confirmatory factor analysis of the SRS–Second Edition (SRS-2) and test for measurement invariance of its structure across age (age < 10 years vs age ≥ 10 years, child vs adult), sex, ASD diagnosis within autism-affected families (ASD vs non-ASD siblings), and across methods of adult report (self-report vs other report). A second exploratory aim was to examine sex differences and age-related changes in the factors derived from the SRS-2.
The present study employed exploratory and confirmatory factor methods to evaluate single-factor, two-factor, and multifactor models in an attempt to elucidate the broad (single- vs two-factor solution) and specific (possible multifactor solution) constructs measured by the SRS-2. The broad structure of the SRS-2 addresses whether variation in autism symptom ratings can be parsimoniously described using a single factor or whether two factors corresponding to proposed DSM-5 symptom domains more accurately capture symptom variation. The specific structure of the SRS-2 examines whether, in a large and well-powered sample, additional facets of autism symptoms can be identified. The SRS-2 is unchanged from the original SRS for 4- to 18-year-old children; however, its manual provides updated norms and validation data, and the SRS-2 extends the age range through adulthood—by virtue of a separate version for adults (with separate forms for self-report and other adult informant). In this study, we implemented analysis of a large number of SRS reports using the original form for 4- to 18-year-olds and the new forms for adults in order to further explore whether SRS factors are robust across major developmental intervals and across reporters. Multigroup confirmatory factor analytic models permit evaluation of measurement invariance (consistency of measurement) across groups. These models also permit examination of specific situations in which differences in factor structure across groups may be conceptually important. For example, differences in measurement between ASD-affected and unaffected individuals may imply that an autism trait has a different meaning after an individual crosses the threshold into affected status. Similarly, age differences in measurement may imply that specific symptoms show different patterns of endorsement across ages. It is important to keep in mind that measurement invariance analyses do not attempt to identify novel subgroups. Rather, they are useful for determining whether autism symptom structure is stable across prespecified groups such as demographic (e.g. males vs females) or diagnostic groups (e.g. ASD vs non-ASD siblings).
Stability of measurement is a precondition to evaluating the effects of demographic factors, such as age and sex, on autism symptom factors. Previous studies, including the original standardization studies of the SRS, have suggested significant influences of sex (females have lower scores) but minimal influence of age on SRS scores. More recent studies have suggested significant sex and age effects modified by diagnostic status (ASD vs non-ASD). The present study attempts to advance this literature by evaluating the effects of age, sex, and ASD diagnosis on empirically identified broad and specific SRS-2 factors.
Methods
Participants
SRS-2 data were obtained from three distinct samples—the IAN (N = 7921; ASD siblings: n = 4891, non-ASD siblings: n = 3030) with a single rating on each child provided by the caregiver, a child general population sample (N = 1012) rated by a parent, and an adult general population sample (N = 702) with most subjects having a self-report (n = 637) and at least one report from a relative or other close acquaintance (n = 195 parent, n = 519 sibling/other relative, n = 338 spouse, and n = 521 close friend). The IAN clinical sample represents an Internet-based registry for families with one or more ASD-affected children (IAN Data Export ID: IAN_DATA_2010-07-06). Families were eligible for enrollment in IAN if the parent or legal guardian who provided information was English-speaking, the family lived in the United States, and their child was diagnosed with an ASD by a professional. To be included in the present study, caregivers must have reported ASD symptom data for at least one ASD-affected child. A subset of IAN caregivers (usually the mother) completed the SRS; this measure was added to the data collection strategy approximately 9 months after the initial launch of IAN. The present analyses are based on the SRS subset of IAN which includes all registered families for whom at least one child (ASD-affected or non-ASD sibling) had completed SRS data. Because IAN represents a clinically ascertained sample, we hereafter refer to the IAN sample as the clinical child sample. The child and adult general population samples are ethnically representative standardization samples described in full detail in the SRS-2 manual (Constantino and Gruber, 2012). Supplementary Table 1 provides a sample accounting and rationale by research question.
The Washington University Human Research Protection Office reviewed the protocol (HRPO number: 201209133) and deemed it appropriate and not subject to Institutional Review Board (IRB) oversight because it involved exclusively anonymized data.
Symptom measurement
The SRS-2 is a 65-item, ordinally scaled (1 = “not true” to 4 = “almost always true”) quantitative assessment of the severity of autism traits. Its predecessor, the SRS, has been one of the most frequently used quantitative measures of autism symptoms, with very strong measurement properties in healthy and autism-affected samples (Constantino and Gruber, 2005). For 4- to 18-year-olds, the SRS-2 represents exactly the same item set as the SRS. The present study capitalizes, in part, on the availability of data derived from the self-report and other-report versions of the Adult form which were newly released in the instrument’s second edition.
Statistical analyses
Packet development
It is challenging to identify a parsimonious factor solution using 65 ordinally scaled items because many small item clusters (overlaps in content between only 2 and 3 items) will contribute minor common variance, resulting in high-dimensional solutions with little theoretical or clinical value. For this reason, we developed an a priori strategy for developing item packets, which reflect collections of items that share similar content and can be submitted as indicators to subsequent factor analyses. Packets are advantageous for evaluating the broad structure of autism symptoms by reducing the probability of identifying factors that are difficult to replicate. Using packets as indicators in factor analyses also increases the likelihood that any fine-grained factors or sub-factors generalize beyond specific item content or wording. Empirical studies have supported the use of item packets in similar contexts (Little et al., 2002; Nasser and Takahashi, 2003; Nasser and Wisenbaker, 2003). To develop item packets, we conducted an exploratory factor analysis using all 65 SRS-2 items. The analysis used principal axis factoring with promax rotation in SPSS version 20 (IBM Corporation, 2011). It should be noted that ordinally scaled items typically require a weighted least squares estimation with missing value (WLSMV) estimator to appropriately correct for bias in the use of items with ordinal distributions. However, the WLSMV estimator is computationally intensive, particularly when higher factor number solutions (>3 factors) are applied to a large number of items (65). Because the focus of this procedural step was not on identification of autism symptom structure but rather to reduce the item set into conceptually similar packets, a principal axis factoring approach was implemented.
Packet development was conducted in a combined child clinical and child population sample (combined child sample). This combined sample was used because this afforded the largest sample size and greatest variance in SRS-2 scores. Having sufficient score variance is crucial to identifying the number and specificity of factors (Floyd and Widaman, 1995). To develop packets, 10 factors were extracted and rotated. The 10 factors were chosen based on initial inspection of eigenvalues suggesting that little common variance remained after extracting 8–10 factors. The number of factors extracted was then progressively decreased until the final factor solution included factors with at least 3 items with primary loadings (>.30). This process resulted in an eight-factor solution with every SRS-2 item showing at least one primary loading. The eight factors had at least 3 distinct item loadings that were easily interpreted (factor 1: emotion recognition (ER), factor 2: odd behavior/perseverative thinking, factor 3: social avoidance (SA), factor 4: repetitive mannerisms (RM), factor 5: separation anxiety, factor 6: interpersonal relatedness (IR) items, factor 7: insistence on sameness (IS), factor 8: conversational impairment). SRS-2 items were then assigned to one factor based on their highest loading. Using this procedure, each factor consisted of 4–13 items, all with salient loadings. Next, within each factor, items were randomly selected for the first packet until the packet consisted of at least 3 total items (the number of items per packet was dependent on the total number of items available for each factor). After the first packet had at least 3 items, subsequent packets were created by randomly selecting any remaining items until the second packet had at least 3 items. The procedure continued until all of the items assigned to that factor were placed into packets. Across the eight factors, 19 item packets were created with 3–5 items per packet. Internal consistency of item packets was good to excellent (α = .72–.93), particularly given the small number of items per scale.
Exploratory and confirmatory factor analyses
The 19 item packets were submitted to exploratory and confirmatory factor analyses using maximum likelihood estimation in Mplus version 5.2 (Muthén and Muthén, 2007). Exploratory factor analyses were conducted to examine the relative improvement in fit with additional factors extracted. Exploratory factor analyses tend to provide a more conservative estimate of whether additional factors provide sufficient reliable variance to yield useful clinical and research information (Fabrigar et al., 1999; Frazier and Youngtrom, 2007). After evaluating exploratory solutions to determine the relative increment in variance explained across additional factors, a set of confirmatory factor models was estimated. These a priori models included a single-factor model, a two-factor model dividing all of the social communication/interaction (SCI) packets and the restricted/repetitive behavior (RRB) packets (DSM-5 model), a three-factor model that separated SA packets from the remaining SCI packets (SCI, SA, RRB model), a four-factor model that broke the RRB factor from the two-factor model into IS and RM factors (SCI, SA, IS, RM model), and a five-factor model that removed the IR packets from the SCI factor leaving the residual SCI factor as a more narrowly defined factor with predominant loadings from items evaluating ER (ER, SA, IR, IS, RM model). Thus, successive models moved from positing two primary factors representing DSM-5 domains (SCI and RRB) to five factors that split out SCI into three factors (ER, SA, and IR) and RRB into two factors (IS and RM). The two-factor model was derived a priori based on current views of autism symptom structure represented in proposed DSM-5 (American Psychiatric Association—DSM-5 Development, 2011) and validated for the SRS by Frazier et al. (2012). To test whether packet assignments to factors improved fit over random assignment, we also estimated confirmatory factor models with the same structures as above except that each of the 19 packets was randomly assigned to one factor.
Measurement invariance
To examine measurement equivalence across ages (age < 10 years vs age ≥ 10 roughly contrasting prepubertal children from those representing preadolescence and higher, and caregiver-report of children vs adult other-report), sexes, ASD diagnosis within families affected by ASD (ASD-affected siblings vs unaffected siblings of ASD-affected children) and reporters (adult self-report vs adult other-report), a series of multigroup confirmatory factor analyses were computed. To elaborate, multigroup confirmatory factor analyses permit simultaneously estimating factor structure in two prespecified groups (e.g. males and females). In the simplest model (often called the baseline or configural model), separate estimates of factor loadings, intercepts (corresponding to indicator/packet means), and residual variances (corresponding to measurement error and specific variance attributed to each indicator/packet) are generated for each group. This model assumes that the factor structure is not equivalent across groups. After this model is estimated, a series of increasingly more restrictive models representing gradually more equivalent structures between groups are estimated in a stepwise fashion. If at any step a substantial decrease in model fit is observed, then the groups are determined to be nonequivalent on the parameters fixed at that step. For example, if in the second step (weak invariance), model fit decreases after fixing factor loadings across groups, then the groups do not have equivalent relationships between indicators and factors.
As stated above, the baseline model for these analyses estimated separate factor loadings, indicator (packet) intercepts, and residual variances. This model evaluated configural invariance—whether factors are represented by the same sets of items across groups—and served as a comparison to more restrictive models. The next model restricted factor loadings across groups to examine weak or metric invariance—whether groups show a similar pattern of relationships between indicators (packets) and the latent constructs they measure. The next model restricted both factor loadings and indicator/packet intercepts (means) across groups to examine strong or scalar invariance. This model tested whether the constructs were measured on the same scale across groups. The final model restricted factor loadings, indicator/packet intercepts, and residual variance to examine strict invariance. While generally viewed as too restrictive, the strict invariance model provides the additional test of whether indicators show similar residual variance across groups. Scalar measurement invariance is preferred prior to making group mean comparisons to ensure that any observed differences are truly a function of group membership. Partial scalar invariance—representing only small reductions in fit due to one or two indicators with different intercepts—may be sufficient for group comparisons because this implies that highly significant group differences are not likely entirely due to measurement nonequivalence (Horn and McArdle, 1992).
Model fit
Confirmatory factor models were evaluated using six indices: chi-square, the comparative fit index (CFI), the Tucker–Lewis Index (TLI), the root-mean-square error of approximation (RMSEA), the Akaike Information Criterion (AIC) (Akaike, 1987), and the Bayesian Information Criterion (BIC) (Schwarz, 1978). CFI and TLI values from .90 to .92 were considered adequate fit, .92 to .95 good fit, and >.95 excellent fit (Marsh et al., 2004). RMSEA values <.10 were considered adequate fit and <.08 were judged as good fit (Kline, 1998). AIC and BIC are useful for comparing the relative fit of non-nested models, with lower values indicating better fit. For model comparison, differences between models were considered significant if the difference in BIC was >5 (Kass and Raftery, 1995).
Model comparisons for measurement invariance analyses were based on empirical work indicating that a drop in CFI or TLI >.01 or an increase in RMSEA >.01 implies measurement nonequivalence (Chen, 2007; Cheung and Rensvold, 2002; Vandenberg and Lance, 2000). For the present study, if any of these indices fell beyond this cutoff, the more restrictive model was considered to have reduced fit. Chi-square differences tend to be overly sensitive to group differences resulting in false rejections of measurement invariance (Cheung and Rensvold, 2002; Little, 1997). For this reason, chi-square difference was not evaluated.
Age and sex effects on SRS-2 factors
To examine age and sex effects, confirmatory factor models were reestimated with factors regressed on age and sex in a combined child and adult population sample. Additionally, in the child clinical sample, factors were regressed on age, sex, ASD diagnosis, and the interactions of age and sex with ASD diagnosis. The latter terms evaluate whether age and sex effects on symptom levels differ across non-ASD and ASD-affected siblings. These analyses were conducted using both the two-factor model based on DSM-5 domains and a five-factor model showing best absolute fit. Statistical significance for all parameters was determined using p < .05.
Results
Exploratory factor analysis
Exploratory factor analysis of the 19 item packets in the combined child clinical and population sample indicated that the largest improvement in fit occurred from 1 to 2 factors (Δχ2(18) = 9362.21, p < .001; ΔCFI = −.044, ΔTLI = −.043, and ΔRMSEA = .028). Fit continued to improve up to the five-factor solution (smallest Δχ2(15) = 2123.49, p < .001), although inspection of each solution indicated that only minor factors with three salient packet loadings were being extracted. The difference between the five-factor and six-factor solutions was significant in terms of absolute fit (Δχ2(14) = 1107.35, p < .001), but decreases in CFI and TLI and increases in RMSEA were minimal (ΔCFI = −.005, ΔTLI = −.007, and ΔRMSEA = .009). Additionally, the six-factor solution included a factor with only one salient loading and factor intercorrelations increased in the six-factor solution relative to the five-factor solution, implying that limited additional information was extracted. These results imply that extracting a second factor is useful and that additional minor factors may be present, representing specific facets of autism symptom structure.
Confirmatory factor analysis
Table 1 presents results of confirmatory factor analyses across selected models in the combined child sample (clinical plus population), adult other-report, and adult self-report samples. Results of the combined child sample indicated that the two-factor DSM-5 domain model showed adequate to good fit across indices with the exception of RMSEA where fit was poor. The latter observation is due to the fact that almost all packets had low but nontrivial cross-loadings, a typical finding in studies of symptom data where many psychopathological constructs show residual relationships. Fit of the five-factor model was quite good, with the CFI and TLI indicating excellent fit and the RMSEA indicating adequate fit. AIC and BIC continued to decrease to the five-factor model indicating relative improvements in fit with this model over all previous models. Supplementary Figure 1 depicts item/factor correspondence (DSM-5) and five-factor solutions, and contrasts these with the item correspondence for the theoretically derived “treatment scales” that are described in the SRS manual. We note that each of the five factors in the five-factor model corresponds exclusively with one or the other of the two DSM-5 factors. Factors based on random assignment of packets fit substantially worse than corresponding a priori factor models for all comparisons (all ΔCFI ≤ −.011, ΔTLI ≤ −.012, ΔRMSEA ≥ +.015).
SRS-2 confirmatory factor analytic model results in children, adults other-report, and adults self-report.
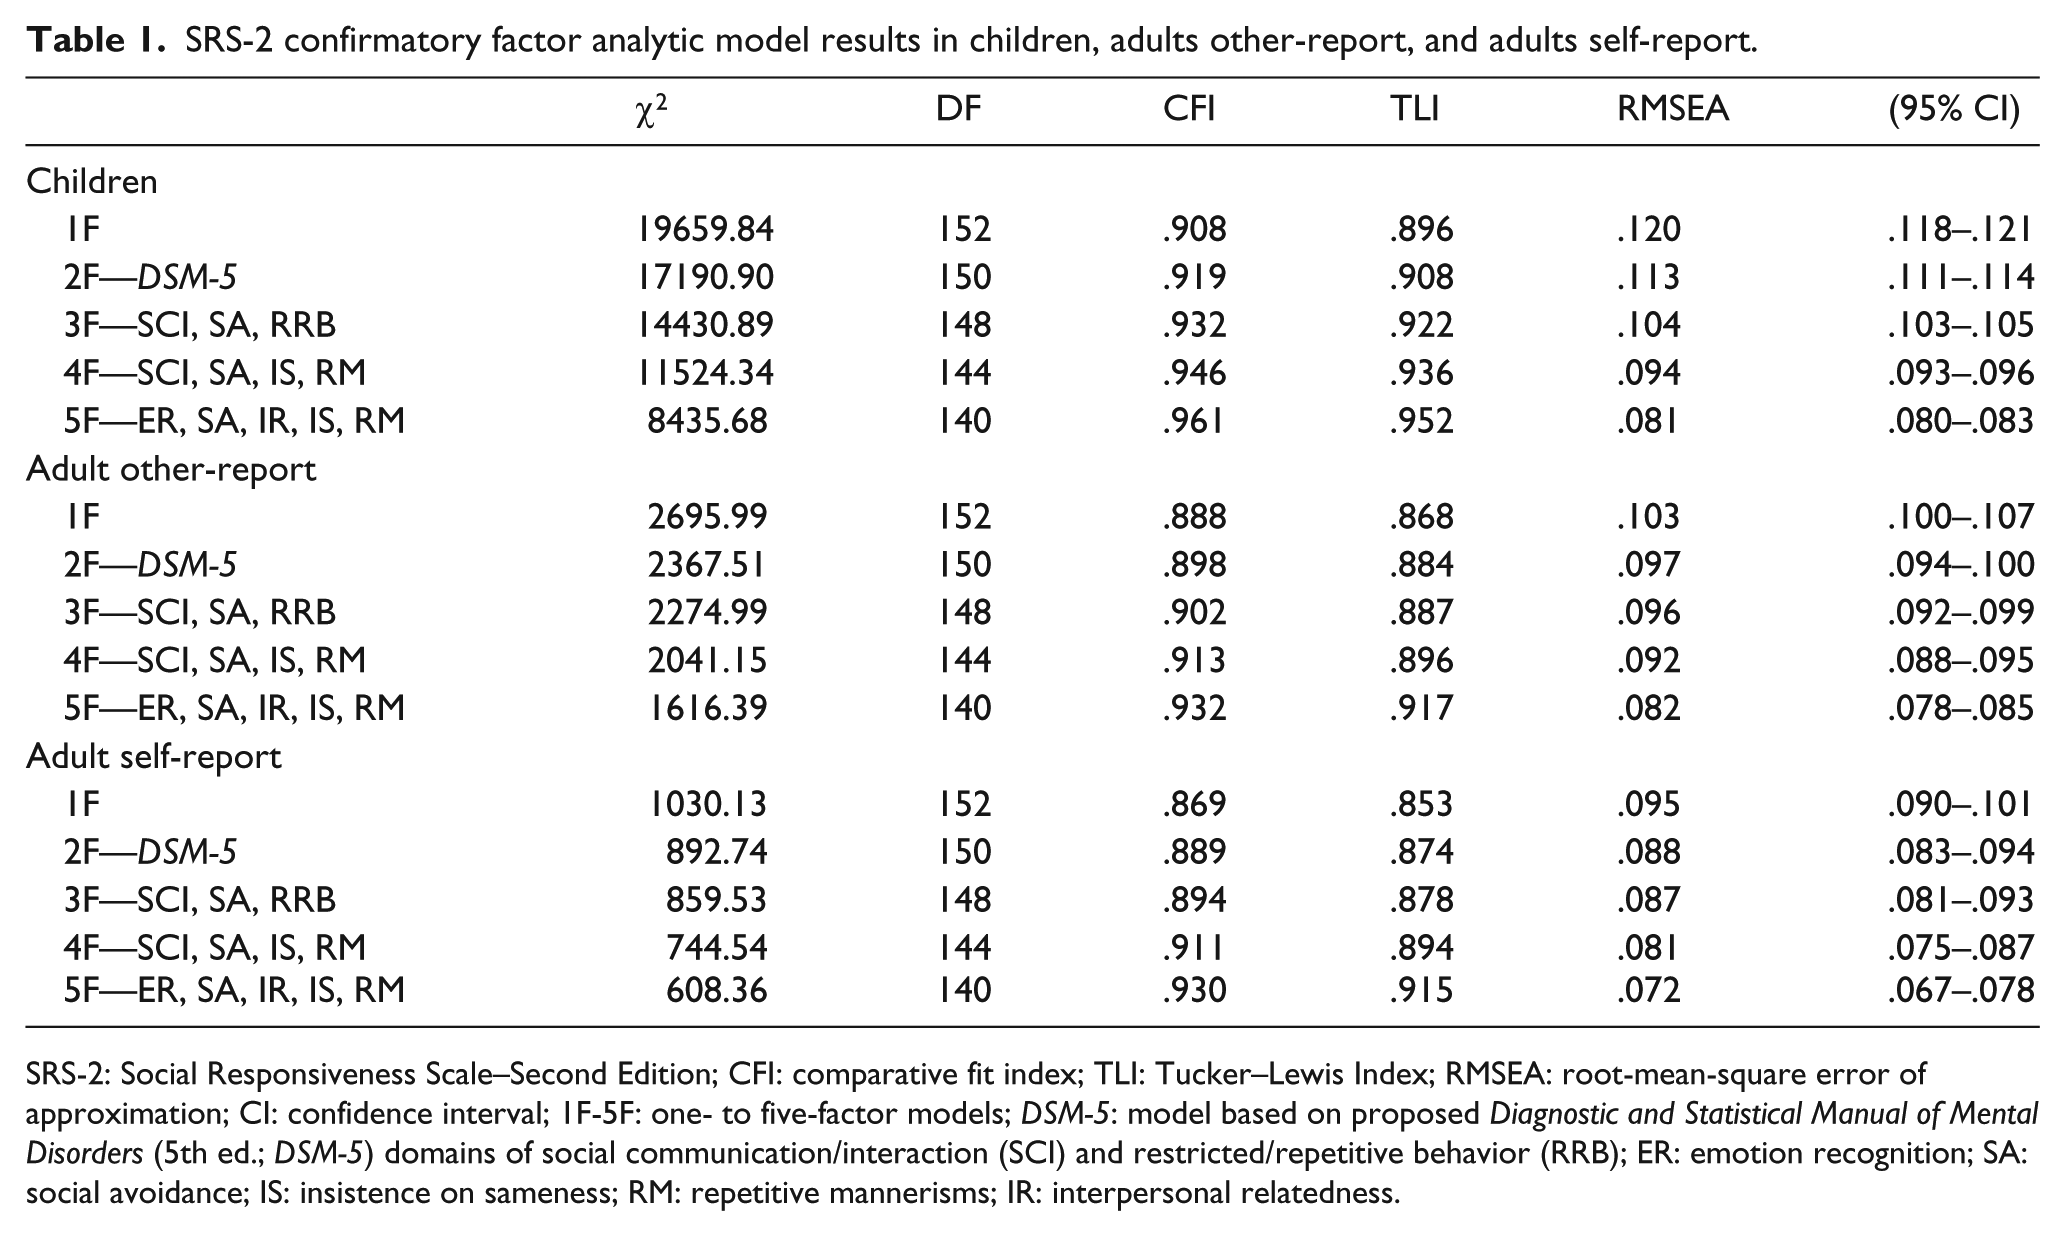
SRS-2: Social Responsiveness Scale–Second Edition; CFI: comparative fit index; TLI: Tucker–Lewis Index; RMSEA: root-mean-square error of approximation; CI: confidence interval; 1F-5F: one- to five-factor models; DSM-5: model based on proposed Diagnostic and Statistical Manual of Mental Disorders (5th ed.; DSM-5) domains of social communication/interaction (SCI) and restricted/repetitive behavior (RRB); ER: emotion recognition; SA: social avoidance; IS: insistence on sameness; RM: repetitive mannerisms; IR: interpersonal relatedness.
Two additional hierarchical post hoc models were estimated. The first model (Hierarchical—1F) specified a single hierarchical factor measured by the five specific factors. The second model (Hierarchical—2F) specified two hierarchical factors, corresponding to DSM-5 domains; one measured by the social factors (ER, SA, IR) and the other measured by the repetitive behavior factors (IS, RM). Fit of the Hierarchical—2F model was improved over the Hierarchical—1F model (ΔBIC = 17). However, it is important to note that the five-factor model fits better than both hierarchical models. In the adult other-report and self-report samples, fit of the two-factor DSM-5 model fell just below the adequate range for the CFI and TLI, while the RMSEA fell in the adequate range. The five-factor model also fit best in these samples (ΔBIC > 10), with the CFI, TLI, and RMSEA indicating adequate to good fit.
Inter-trait correlations
Very high correlations were observed between SCI and RRB domains in the two-factor DSM-5 model for the combined child and adult population (r = .95; 95% confidence interval (CI) = .94–.96), non-ASD sibling subsample (r = .94; 95% CI = .93–.95), and adult self-report sample (r = .95; 95% CI = .94–.96). The correlation was slightly lower but still substantial in ASD siblings (r = .87; 95% CI = .86–.88). For the five-factor model, correlations remained high, but variable for the combined adult and child population sample (r = .83–.94), non-ASD siblings (r = .66–.89) and adult self-report (r = .68–.97). Correlations for the five-factor model were slightly lower and variable, but still substantial, in ASD siblings (r = .66–.84) (see Supplementary Table 2). Inspection of intercorrelations among the five factors reveals that social factors (ER, SA, and IR) often had different patterns of relationships with repetitive behavior factors (IS and RM). Furthermore, intercorrelations between the two repetitive behavior factors were consistently high, but intercorrelations among the social factors were more variable. This is the likely reason for superior fit of the five-factor model, which estimates each correlation, over the hierarchical models which assume uniform relationships between the specific social and repetitive factors.
Measurement invariance
Because of the utility of the two-factor model in measuring DSM-5 domains and the technical difficulty in simultaneously estimating measurement invariance in models with high indicator (19) and factor number (>3), measurement invariance models focused on the simpler two-factor DSM-5 model. Table 2 presents results of measurement invariance models across age (age < 10 vs age ≥ 10, child- vs adult-report forms), sex, ASD diagnosis (non-ASD siblings and ASD-affected siblings), and adult reporter (self vs other). Metric invariance held across comparisons of age <10 versus age ≥ 10. Partial scalar invariance held but full scalar invariance was not met, as the CFI fell just beyond the rule (ΔCFI = −.013). Inspection of item intercepts indicated that the lack of scalar invariance was likely due to different patterns of age differences across item packets within the SCI and RRB factors. Thus, we anticipated that age effects would be more informative when examined using a five-factor solution (see below for age effects across specific SRS-2 factors). Non-ASD siblings and ASD-affected siblings did not show measurement equivalence, even at the metric level, indicating that item packets had different relationships with DSM-5 factors in youth with and without ASD. Strict invariance held across all other group comparisons (child- vs adult-report forms, sexes, and self vs other adult report), indicating that measurement was highly comparable across these groups.
Measurement invariance of the two-factor DSM-5 model across age, sex, and reporter (SRS-2 adult self- vs other-report).

DSM-5: Diagnostic and Statistical Manual of Mental Disorders (5th ed); SRS-2: Social Responsiveness Scale–Second Edition; ASD: autism spectrum disorder; CFI: comparative fit index; TLI: Tucker–Lewis Index; RMSEA: root-mean-square error of approximation.
Age effects
Table 3 presents the effects of age, sex, and their interaction with ASD diagnosis on DSM-5 domains (two-factor model) and specific SRS-2 factors (five-factor model) in the child clinical sample. Overall, SCI and RRB symptom levels did not significantly differ as a function of age. However, examination of specific SRS-2 factors indicated that the actual pattern for age differed across sub-constructs, and the effects of age were further moderated by ASD diagnosis. Specifically, older ASD and non-ASD siblings had less difficulty with ER. Endorsement of RM also decreased with age, regardless of ASD diagnosis. However, higher levels of SA and IR difficulties through childhood and adolescence were largely driven by the presence of ASD. Older ASD-affected youth had higher levels of IS, but IS did not differ across age in non-ASD youth.
Relationship between age, sex, ASD diagnosis, and their interaction with DSM-5 domains and specific SRS-2 factors in the child clinical sample.
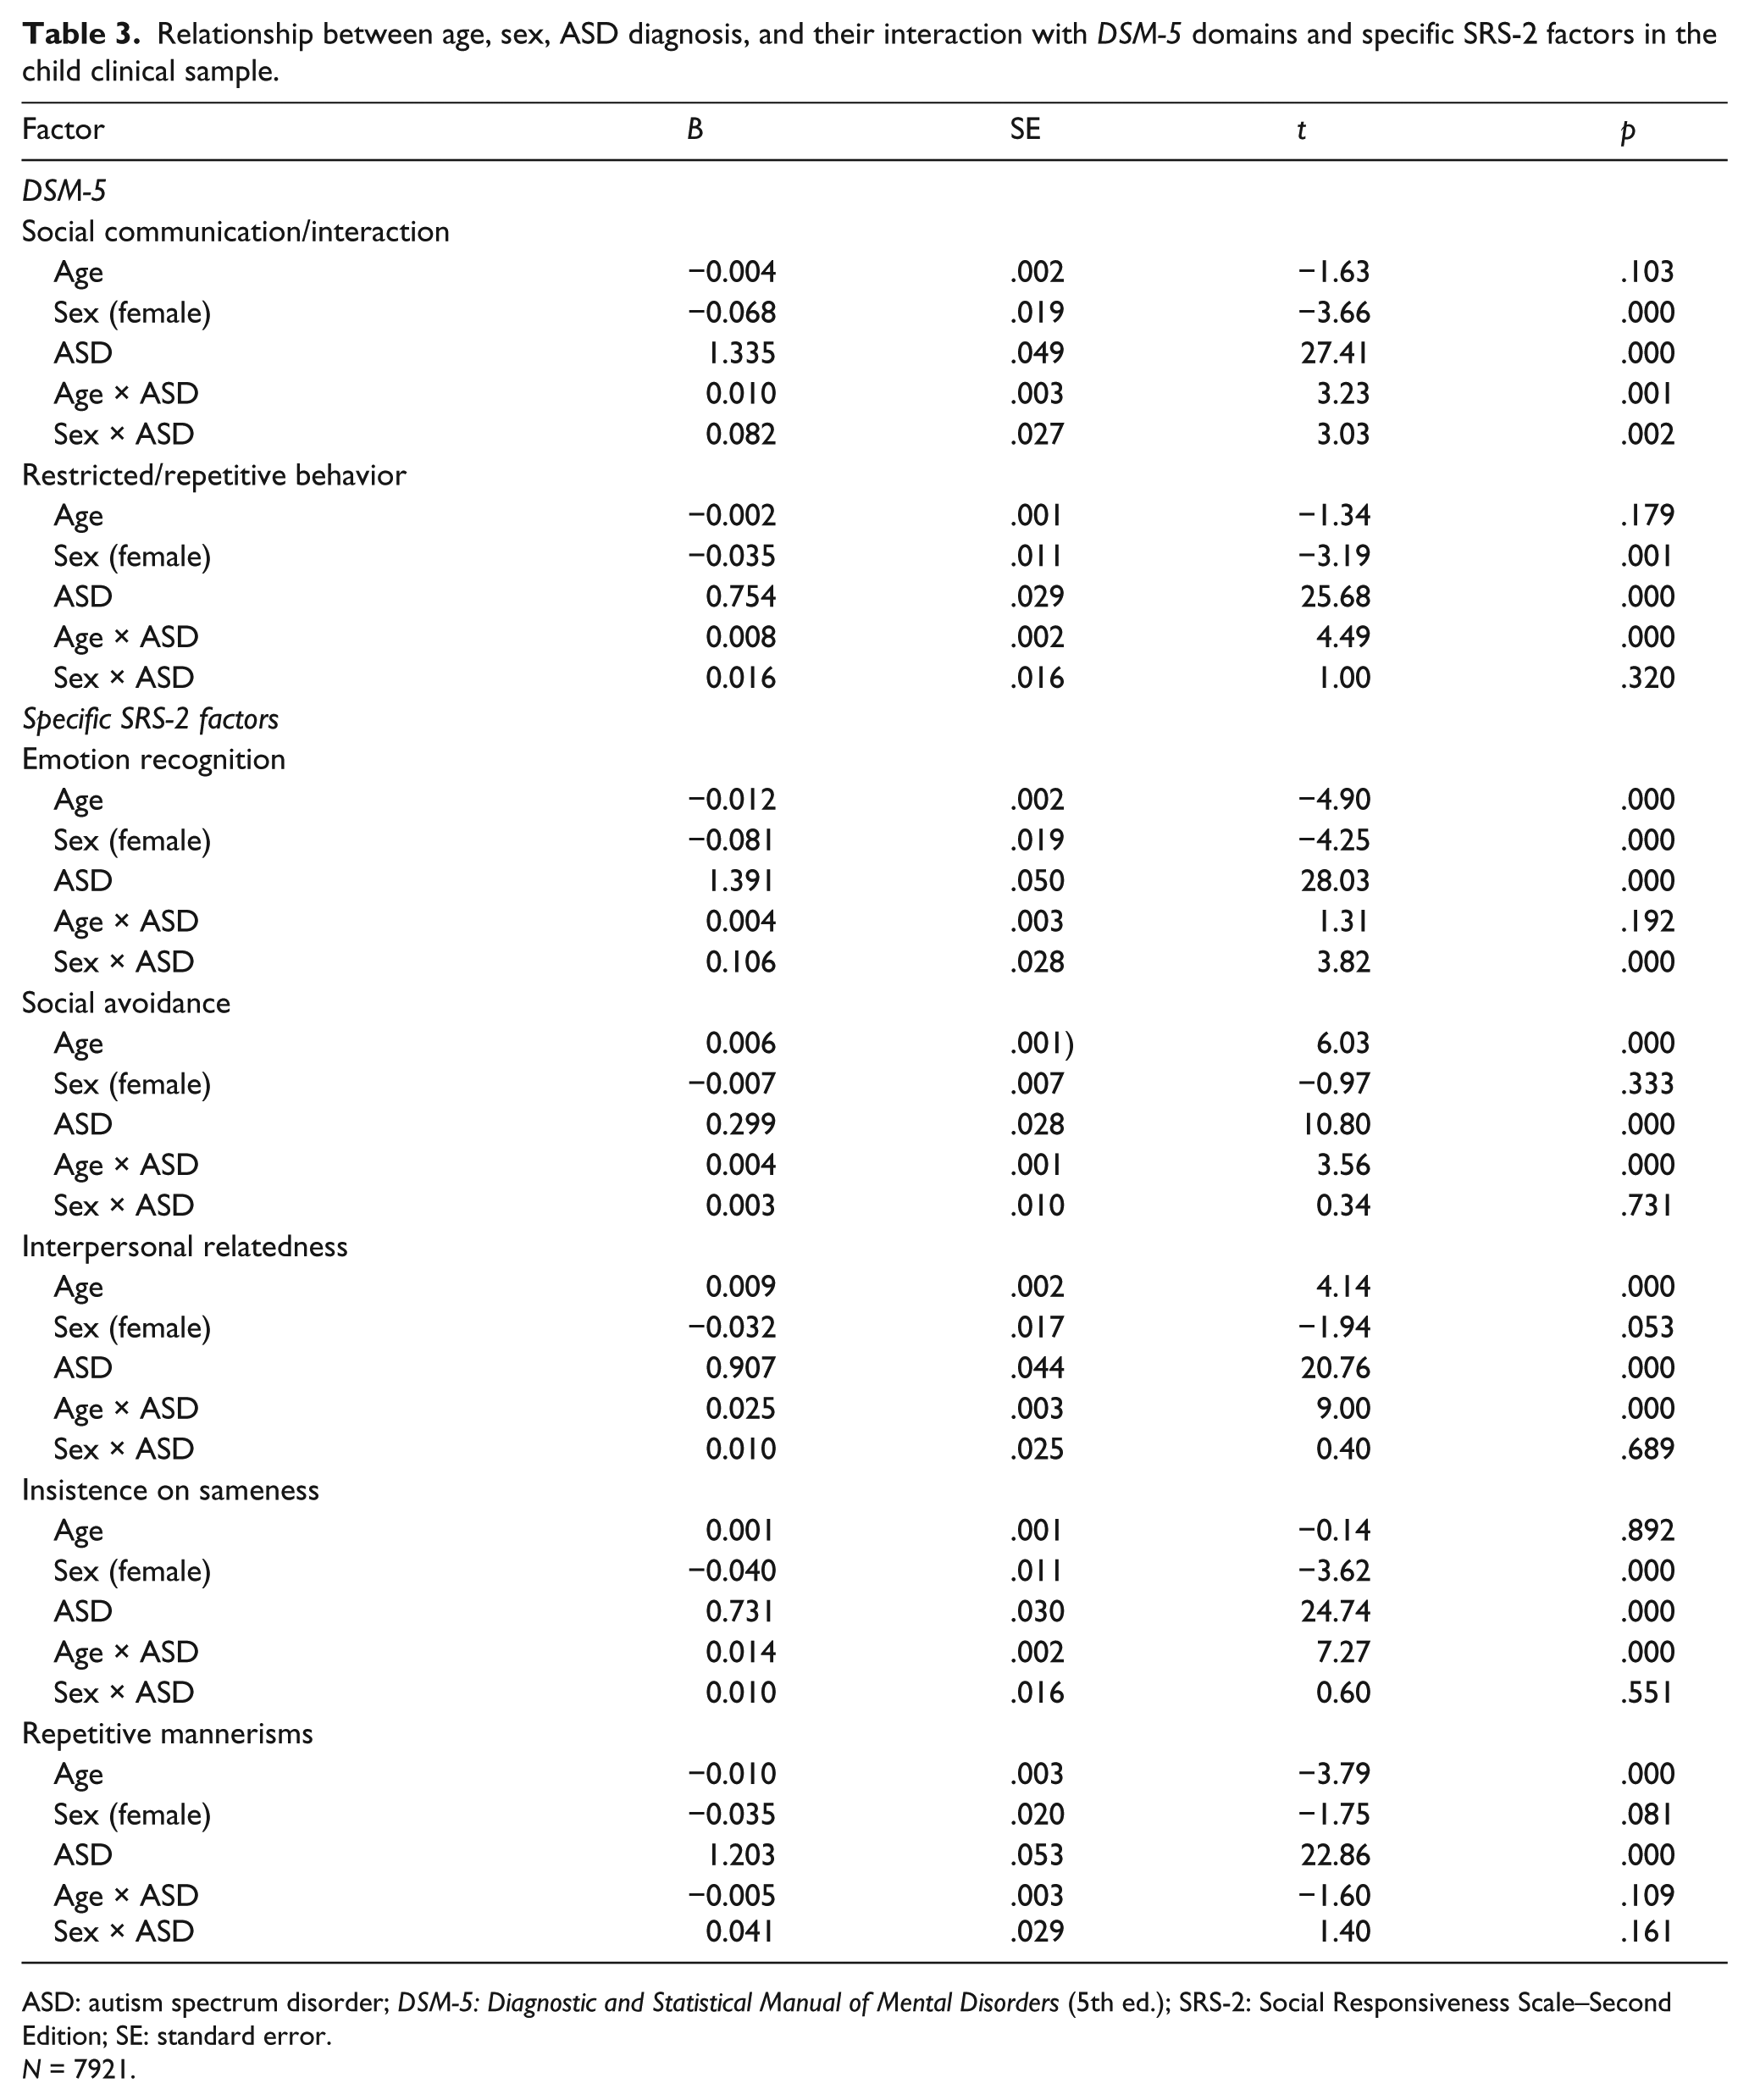
ASD: autism spectrum disorder; DSM-5: Diagnostic and Statistical Manual of Mental Disorders (5th ed.); SRS-2: Social Responsiveness Scale–Second Edition; SE: standard error.
N = 7921.
Figures 1 and 2 present age and sex effects on DSM-5 domain factors and specific SRS-2 factors in the combined child and adult population sample. SCI and RRB traits and specific SRS-2 factor levels were higher in older individuals (B = .002–.004 across all factors; r = .12–.24). Regression coefficients represent the average item score increase for a 1-year increase in age. These effects are small to medium in magnitude, and appear very small in the context of individual item scores, but can be meaningful across scales. For example, coefficients for age indicate that a 1-year increase in age is associated with a .004 increase in SCI item scores. The SCI factor has 38 items. Assuming that this scale was unit weighted with each item contributing equally (raw score range = 0–114), a 20-year difference in age would be associated with an average 3-point difference in raw score on this scale.
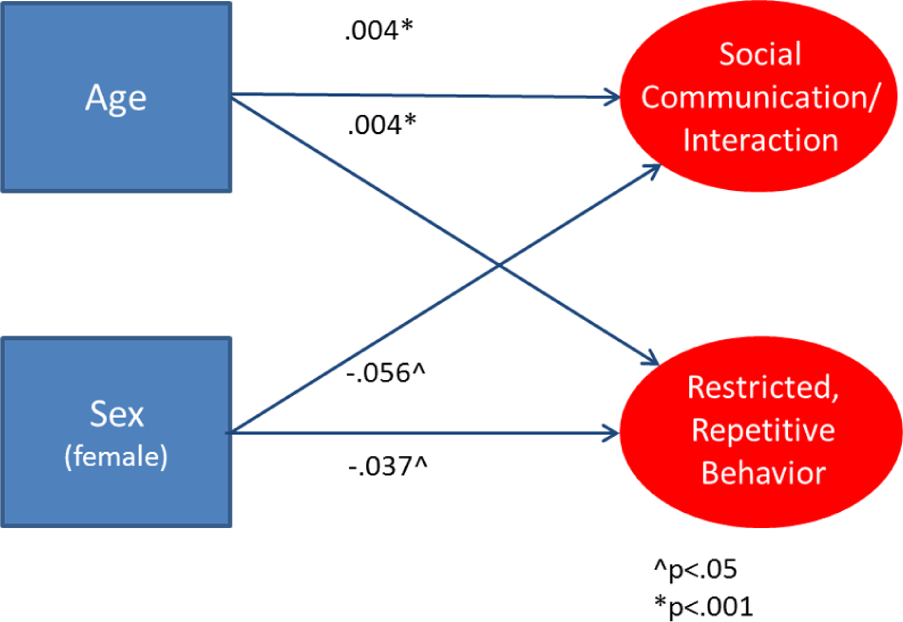
Influence of age and sex on DSM-5 factors in the population sample.
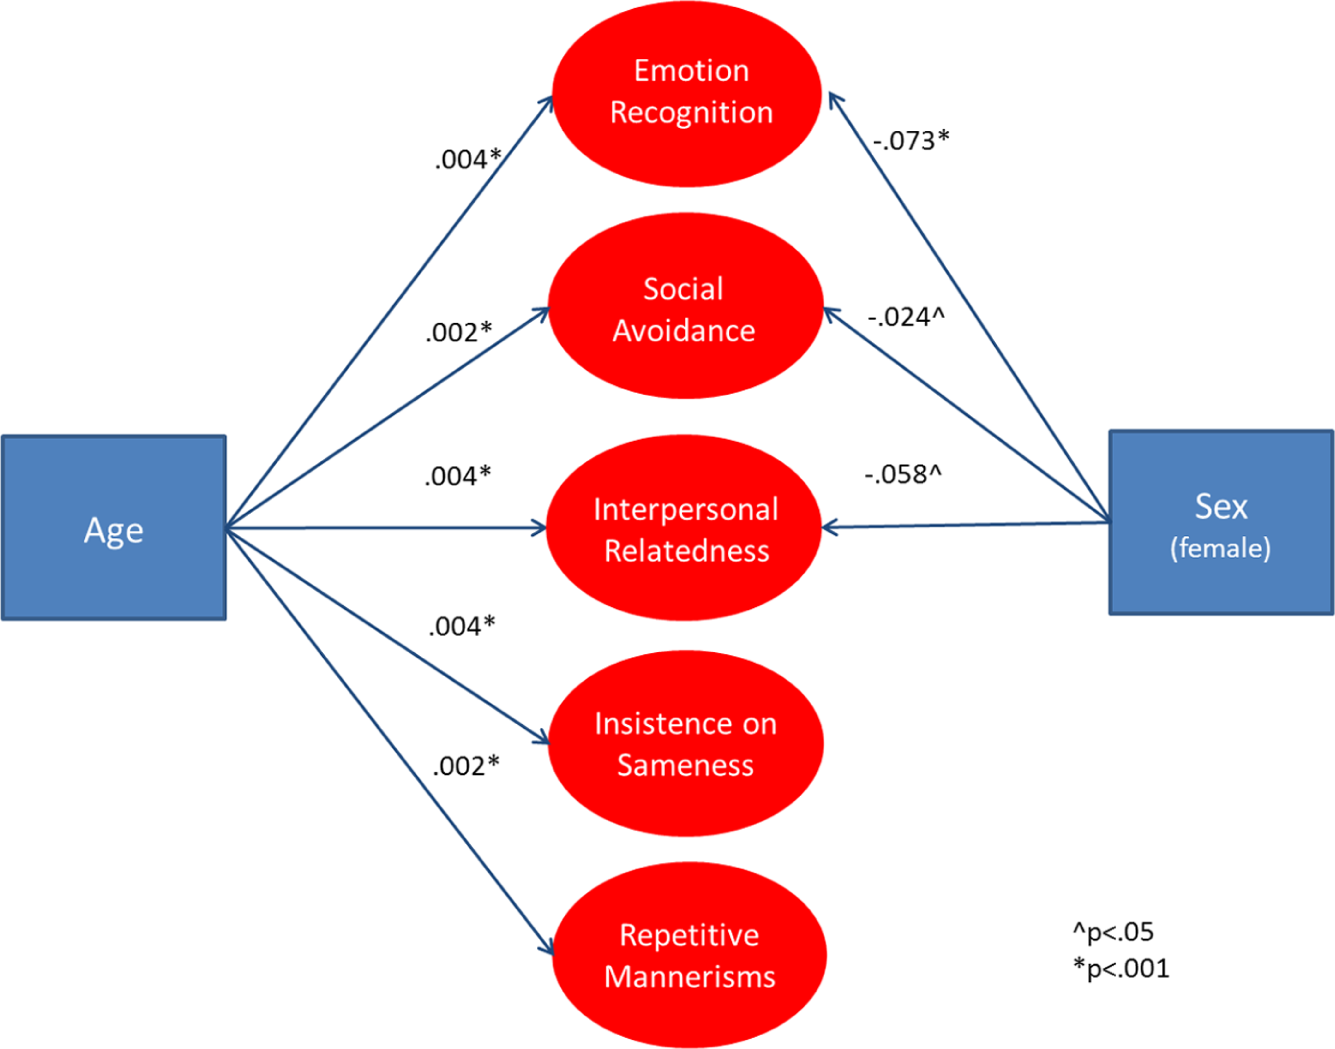
Influence of age and sex on specific SRS-2 factors in the population.
Sex effects
Overall, females had lower SCI symptom levels than males. However, ASD-affected females show higher SCI symptom levels than ASD-affected males, whereas non-ASD siblings show the opposite pattern. Higher SCI symptom level in ASD-affected females was driven by substantially worse ER. No significant differences in SA or IR difficulties were observed. Overall, females had lower RRB symptom levels than males, and this was largely attributable to significantly lower levels of IS. No sex differences were observed for RM and there were no interactions with ASD diagnosis for either IS or RM.
In the combined child and adult population sample, females had lower overall SCI (r = −.06) and RRB (r = −.04) symptom levels. The magnitude of these effects is small, but could be meaningful in determining clinical cut scores. For example, the coefficient for SCI (B = −.056) implies that females would show an average raw score 2.1 points lower than males. Females also had significantly lower levels for each of the specific SCI construct (ER, SA, and IR difficulties). RRB sub-constructs (IS and RM) levels were lower as well, but did not reach statistical significance.
Group heritability and sibling scores
In order to place these results in the context of previously published data that involved use of the total SRS score, we reanalyzed SRS data originally published with respect to total SRS score in Constantino et al. (2007) and in Constantino and Todd (2000), for neither of which there was any overlap with the primary data analyzed in this report. Table 4 presents mean item scores for affected versus unaffected children in ASD-affected families, including total SRS scores (as previously published for those data sets in Constantino et al., 2007) and scores for each of the DSM-5 factors and specific SRS-2 factors derived from our analyses in this report. In general, the magnitude of contrast between affected and unaffected children was highly consistent across the various factors and highly consistent with what was originally reported for the total SRS score. Supplementary Table 1 presents twin–twin correlations, separately for the monozygotic (MZ) and dizygotic (DZ) twin pairs whose total SRS scores were described in Constantino and Todd (2000). In general, twin correlations were consistent with previous research; MZ twin–twin correlations were significantly larger than DZ correlations for DSM-5 domains and specific SRS-2 factors, suggesting relative uniformity in the heritability of autistic trait measurement across the factors derived from the present analysis.
Average item scores for DSM-5 domains and specific SRS-2 factors, separately for ASD and non-ASD siblings from Constantino et. al. (2007).
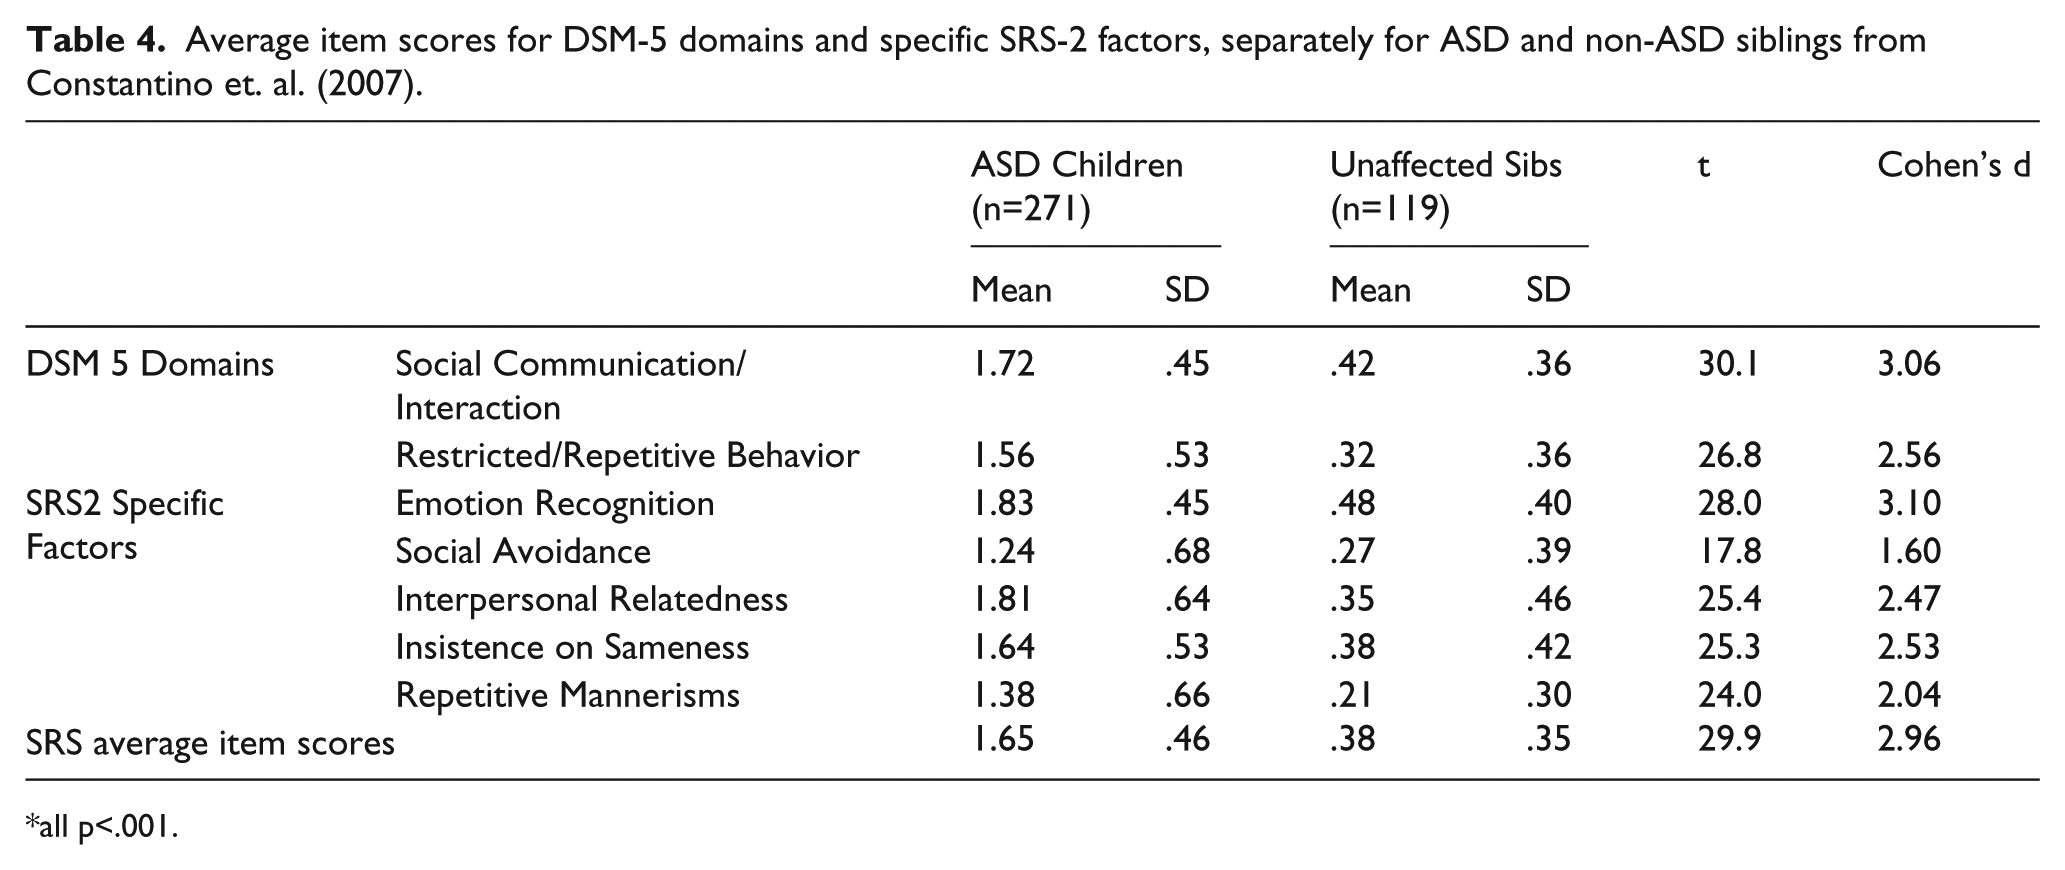
all p<.001.
Discussion
The present study extends previous findings on the factor structure of autism, using some of the largest samples harnessed to date for examination of quantitative autistic traits. The results provide strong evidence of separable, but highly correlated, autistic traits corresponding to the DSM-5 criteria domains for ASD and specific factors encompassed by those respective domains. The SRS-2 exhibited measurement invariance across age (four through adult), sex, and reporter (adult data, self vs other), with lower levels of measurement equivalence in clinical populations, suggesting that the structure and meaning of autistic trait measurements may change for at least a subset of individuals who cross into categorically affected status. In this study, a substantial proportion of such individuals were affected by simplex autism. Recent data from clinically affected families have supported a highly similar two-factor structure, with separate SCI and RRB factors consistent with proposed DSM-5 domains (Frazier et al., 2012). Additionally, the finding of reduced measurement equivalence in ASD and non-ASD siblings is conceptually congruent with the previously identified categorical distinction between ASD and non-ASD siblings using taxometric procedures (Frazier et al., 2010) and factor mixture modeling. It is important to point out though that measurement inequivalence does not necessarily support a categorical distinction between ASD and non-ASD, as this finding may simply be due to idiosyncrasies in the scales or changes in the reliability of scales across ranges of the latent trait.
Regardless of the most appropriate interpretation, observations of measurement nonequivalence and categorical distinctions between ASD and non-ASD siblings will require confirmation in additional samples. These findings may indirectly reflect the role of diverse, individually rare, de novo mutations suspected of strongly influencing the development of a significant minority of clinical autistic syndromes (10%–15%) (see Sanders et al., 2012), but having less of a role in quantitative trait variation in unaffected individuals and in familial forms of ASD. Although the genetic causes of subclinical autistic traits profoundly overlap with those of familial autistic syndromes (Constantino et al., 2010; Klei et al., 2012; Robinson et al., 2011), they do not necessarily overlap with those of sporadic forms of autism (Virkud et al., 2009). As our understanding of the causes of autism evolves, it is likely time to move from positing categorical or dimensional models to conceptualizing the autism spectrum as a hybrid influence both by categorical and dimensional components.
The statistical power afforded by the present study permitted identification of specific SRS-2 factors which are respectively encompassed by the broader SCI and RRB domains—including what we have termed in this report as ER, SA, IR, IS, and RM. Interestingly, these facets did not have straightforward relationships with one another, indicating that a simple hierarchical structure with specific factors measuring broad SCI and RRB domains may not be tenable. Additional research with multiple instruments may be needed to further understand the complexity of these relationships. Even with this important caveat, empirically derived factors may complement use of the SRS total score and the original theoretically derived SRS treatment scales. For example, additional facets of autism that exhibit subtle factoral separation may be helpful in etiologic and neurobiologic research for identifying specific risk or protective factors or neural circuit abnormalities. Empirically derived factors may be particularly useful in treatment settings where treatment effects may differentially influence one aspect of SCI or RRB but not all, or show specific temporal patterns. For example, social skills programs for high-functioning ASD may improve ER and decrease SA more rapidly, but IR difficulties may only subside slowly after critical improvements in the other domains have occurred. Social skills interventions may yield less improvement to IS or RM unless these are also specifically targeted.
Sex and ASD diagnosis moderated symptom levels across specific SRS-2 factors, highlighting the complexity of autism trait emergence and reaffirming literature identifying sex differences in the manifestation of autistic symptoms in diagnosed populations (Carter et al., 2007; Hartley and Sikora, 2009; Lord et al., 1982). For example, poorer ER in ASD-affected females may prove to be a critical underlying factor in the observation that girls who garner an ASD diagnosis tend to exhibit more severe phenotypes than their male counterparts (Carter et al., 2007; Dworzynski et al., 2012; Lord et al., 1982), and the observation of increasingly disparate sex ratios at higher cognitive levels in ASD (Lord and Schopler, 1985). Similarly, lower RRB levels in females are congruent with recent empirical work using both interview-based and observational methods (Mandy et al., 2012). Lower RRB levels in females are not likely accounted for by under-identification, particularly given that proportionally more females are identified at lower cognitive levels. Investigations that carefully sample males and females with ASD across the range of cognitive severity are needed to determine whether sex differences in symptom levels are independent of ascertainment and diagnostic biases, and may provide important clues to specific biological pathways through which many (but not all) females are spared full phenotypic expression of genetic liability to many forms of familial autism (Constantino and Charman, 2012).
Age also had a complex relationship with SRS-2 factors. Most prominently, SA and IR difficulties appear to be more prevalent in older youth, but these effects were much more pronounced in ASD-affected youth than in their unaffected siblings. The pattern of findings suggests that the accumulation of negative social experiences as a result of impaired ER and perspective taking may lead to greater SA and IR difficulties with age. However, it is important to keep in mind that developmental inferences are tenuous with cross-sectional data and these effects may simply represent sampling differences across age. RRB constructs also showed a complex relationship with age. Levels of IS were higher in older youth with ASD, but levels of RM were lower with age in ASD-affected youth.
Examination of these phenomena in prospective longitudinal data sets involving children with autism and their unaffected siblings is under way, and can provide further clarification of these findings. Specifically, the DSM-5 SCI symptom criterion (A3) focuses on relationship impairment and social interest, which encompass both IR difficulties and SA factors. The other two DSM-5 SCI symptom criteria (A1 and A2) involve social/emotional reciprocity and nonverbal communication, which relate to items which comprise the ER factor. If the five-factor structure identified in this analysis is replicated, future revisions of diagnostic criteria may wish to realign symptom criteria accordingly. Separation of ASD-affected children and their unaffected counterparts was quite strong across DSM-5 domains and specific SRS-2 factors.
Resolution of empirically derived SRS-2 factors presents an opportunity to provide more nuanced behavioral phenotypes with which to associate genetic and/or neurobiologic variation, and to derive refined estimates of heritability. Twin correlations in DSM-5 domains and specific SRS-2 factors were highly consistent with that of the total SRS-2 score when computed from the original twin data reported by Constantino and Todd (2000). The possibility that specific SRS-2 factors tap distinct patterns of genetic and environmental influence (as may be true in the case of SA) merits further study. Relating this also to age, we previously reported suggestive evidence for both overlapping and non-overlapping genetic influences between childhood and adolescence on variation in reciprocal social behavior in the general population (Constantino et al., 2010).
Age and sex effects reinforce the development and application of demographically corrected normative scores, which have proven critical in measuring the familial aggregation of quantitative autistic traits (Constantino et al., 2010), and which contextualize the derivation of diagnostic boundaries across sex, age, and culture (see Kamio et al., 2013). The parsimonious nature and adequate fit of the two-factor model implies that scoring these broad autism traits in the SRS-2 may be helpful in diagnostic contexts where separate measurements of DSM-5 domains are desired. However, the high correlation between these trait dimensions suggests that use of the total raw or demographically adjusted T-score will still suffice for most clinical and many research settings. In lower-base-rate environments where a simple, highly reliable measure of autism traits severity is needed, the total score would almost certainly be preferred. Studies evaluating the incremental validity of separate SCI and RRB domain scores, over and above the total score, are needed to ensure that this added complexity engenders increased precision.
Limitations and future directions
As with all factor analytic studies, results were limited by the available indicators submitted for analysis. Fortunately, the SRS-2 contains a diverse array of autism-associated traits that are widely sampled in a unimodal distribution in the general population; thus, the likelihood that primary constructs were missed or under-identified is relatively low. For example, use of SRS-2 item packets identified many of the SCI and RRB constructs that have been identified in previous literature. Use of item packets may also lead to loss of minor factors. However, the large size and diverse nature of the item pool, as well as careful attention to higher dimensional factor solutions, mitigates this risk.
While inter-trait correlations were quite high, even for specific SRS-2 constructs obtained from the five-factor solution, it is always important to consider whether these relationships are free of rater bias. This was directly tested for total SRS scores and found to be absent in the general population twin sample reported by Constantino and Todd (2003). Furthermore, in SRS research in clinical populations, subtle rater contrast effects—which operate in a direction opposite of rater bias—have been observed (Constantino et al., 2010; Virkud et al., 2009). The possibility of inflation of cross-trait correlations for factors or sub-factors should continue to be explored in treatment settings (Frazier et al., 2004); ways in which this can occur include the phenomenon of “response sets” (rating most items the same way) and the halo effect (different facets of an individual rated similarly). Multi-trait/multi-method/multi-rater studies are useful in examining intra-trait correlations across different instruments. Natural next steps in SRS-2 evaluation will be to replicate the present findings in additional clinical and population samples, use item response theory methods to examine measurement properties across each trait, and employ mixture models to identify whether distinct classes of individuals exist within ASD-affected youth, including those representing familial and nonfamilial forms of ASD.
Given the very large sample sizes examined (total N = 9635), we conclude that these data support the overarching structure of the DSM-5 diagnosis of ASD, and provide initial evidence for resolution of five highly intercorrelated factors (three relating to the SCI domain and two to the RRB domains defined by DSM-5) that were not statistically discernible in prior studies of lower sample size. Etiologic studies may consider moving beyond the total SRS score by incorporating broad DSM-5 factors and specific SRS-2 factors to provide a more nuanced approach to relating behavioral variation to genetic and/or neurobiologic data; however, the degree to which this will meaningfully improve the precision of measured associations is not yet known. These results suggest that characterization with respect to this structure is both feasible and carries potential to yield important insights into the biology of autistic syndromes.
Footnotes
Acknowledgements
This work was also supported by grants HD 068479 and HD 042541 to Dr. Constantino, as well as grant 8370 from Autism Speaks. IAN, the Interactive Autism Network is a web project of Kennedy Krieger Institute, sponsored by the Autism Speaks Foundation, Inc.
Funding
This work was made possible in part by the Case Western Reserve University/Cleveland Clinic CTSA Grant Number UL1 RR024989 provided by the National Center for Research Resources and the National Center for Advancing Translational Sciences, National Institutes of Health. Its contents are solely the responsibility of the authors and do not necessarily represent the official views of NIH.
References
Supplementary Material
Please find the following supplemental material available below.
For Open Access articles published under a Creative Commons License, all supplemental material carries the same license as the article it is associated with.
For non-Open Access articles published, all supplemental material carries a non-exclusive license, and permission requests for re-use of supplemental material or any part of supplemental material shall be sent directly to the copyright owner as specified in the copyright notice associated with the article.
