
Abstract
Autism spectrum disorder is a complex condition that requires specialised care. Knowledge of the costs of autism spectrum disorder, especially in comparison with other conditions, may be useful to galvanise policymakers and leverage investment in education and intervention to mitigate aspects of autism spectrum disorder that negatively impact individuals with the disorder and their families. This article describes the services and associated costs for four groups of individuals: adolescents with autistic disorder, adolescents with other autism spectrum disorders, adolescents with other special educational needs and typically developing adolescents using data from a large, well-characterised cohort assessed as part of the UK Special Needs and Autism Project at the age of 12 years. Average total costs per participant over 6 months were highest in the autistic disorder group (£11,029), followed by the special educational needs group (£9268), the broader autism spectrum disorder group (£8968) and the typically developing group (£2954). Specialised day or residential schooling accounted for the vast majority of costs. In regression analysis, lower age and lower adaptive functioning were associated with higher costs in the groups with an autism spectrum disorder. Sex, ethnicity, number of International Classification of Diseases (10th revision) symptoms, autism spectrum disorder symptom scores and levels of mental health difficulties were not associated with cost.
Introduction
Autism spectrum disorder (ASD) is a complex condition which presents both difficulties and strengths for the individual and both challenges and opportunities for society. A number of recent studies have estimated the economic costs associated with ASD. While the value of an individual cannot and should not be considered in terms of monetary costs, estimating the economic costs associated with ASD may be useful to galvanise policymakers and leverage investment in education and intervention to mitigate aspects of ASD that negatively impact individuals’ and families’ adaptation and choices.
Previous research has found that the costs of autism in childhood are borne primarily by both publicly funded services (health, education, social services) and families (Barrett et al., 2011; Jarbrink et al., 2003). One study estimated that the total costs of supporting children with ASD in the United Kingdom was approximated at £2.7 billion per year, of which 95% was accounted for by services funded by the state with the remaining 5% falling to families (Knapp et al., 2009). The cost of ASD to the health care, social care and education systems is high compared with other childhood illnesses such as diabetes and asthma (Flanders et al., 2006) and intellectual disabilities (Mandell et al., 2006). Health-care costs are substantial; the estimated mean cost of medical expenditure for people with ASDs in the United States ranges between US$2100 and $11,200 per individual per year with costs highest for young children (Amendah et al., 2011). Research in the United States has found that health-care utilisation costs are substantially higher for children with ASD than for those without ASD (Croen et al., 2006). Education costs also are considerable; children with ASD are significantly more likely to use special education services than those without ASD (Lavelle et al., 2014). The costs that fall to families are made up of out-of-pocket costs such as additional non-funded treatments, informal care and lost productivity. These costs are difficult to estimate; one study in the United States found that childhood ASDs are associated with substantial loss of household income (Montes et al., 2008) and informal care costs were found to account for 5% of total costs of young adults with high functioning autism (Cidav et al., 2012).
People with ASD, their families and the professionals responsible for their care and education seek to maximise their well-being within the resources that are available to them. Ultimately, this can be achieved through knowledge of the cost-effectiveness of programmes and interventions. Where this information is limited, a first step is to capture how resources are currently used and to investigate the associations between individual characteristics and costs. To this end, in this article, we describe the service use and service costs for four groups of individuals: adolescents with autistic disorder, adolescents with other ASDs, adolescents with other childhood special educational needs (SEN) 1 and typically developing adolescents. We first compare the service use and associated costs of these groups; comparing the cost of ASD and SEN to a typically developing control group allows meaningful conclusions to be made about the incremental costs of ASD and other SEN in adolescence and provides a baseline against which the economic impact of new interventions can be assessed.
In the second part of this article, and for the ASD groups only, we conduct a regression analysis in order to explore the associations between individual characteristics and costs. Knowledge of the characteristics of young people who require high-cost services can support planning in health, social care and education systems. In addition, it can also influence the direction of future economic evaluations, which should be focused on areas of high cost in order to ensure that the resources cannot be better spent elsewhere.
Methods
Participants and measures
We analysed data from a large, well-characterised cohort of adolescents with ASDs and other special needs who had been assessed as part of the UK Special Needs and Autism Project (SNAP) at the age of 12 years (range 9.8–14.4 years) (Baird et al., 2006). Expert consensus on International Classification of Diseases (10th revision; ICD-10) (World Health Organization, 1993) clinical diagnosis (authors G.B., E.S., T.C.) of ASDs (including pervasive developmental disorder–other and atypical autism) was based on the Autism Diagnostic Interview–Revised (ADI-R; Lord et al., 1994) and the Autism Diagnostic Observation Schedule–Generic (ADOS-G; Lord et al., 2000). The total number of ICD-10 autism symptoms was recorded. In addition, intelligence quotient (IQ) using Wechsler Abbreviated Scale of Intelligence–UK (WASI-UK; Wechsler, 1999), adaptive behaviour using the Vineland Adaptive Behaviour Scale (VABS; Sparrow et al., 1984) and mental health difficulties using the Strengths and Difficulties Questionnaire (SDQ; Goodman, 1997) were measured. The SEN group consisted of children who had not met criteria for an ASD but who had a range of primary ICD-10 diagnoses, including intellectual disability (IQ < 70) (n = 19), language delay/language disorder (n = 2), learning difficulties (n = 2) and attention deficit hyperactivity disorder (ADHD) (n = 2). A later phase of SNAP revisited children with ASD and SEN in adolescence for a thorough cognitive assessment (Charman et al., 2011) and included an additional sample of typically developing adolescents. The typically developing group was recruited from mainstream schools and had no psychiatric or developmental disorder, had no statement of SEN and were not taking any psychotropic medication. Data about service use and cost were collected at this second time point.
Service use and costs for whole sample
Resource use data were collected at the follow-up interview using the Child and Adolescent Service Use Schedule (CA-SUS), designed in previous research with young people and adapted for the purpose of this study (Byford et al., 2007). The CA-SUS collects data on the young person’s use of a range of services for the 6 months preceding interview and includes information on contacts with primary and secondary health-care services, social services, non-statutory services and education including type of education (specialist or mainstream), classroom support, education support and school-based health and social services. For the autism, broader ASD and SEN groups, the data were collected via interview with a parent. For the typically developing group, the participants themselves were interviewed.
Total costs were calculated by multiplying each resource use item by an appropriate unit cost. All unit costs, in UK pound sterling, were for the financial year 2007–2008, the period over which the data were collected, and were obtained from a number of sources (British Medical Association and Royal Pharmaceutical Society of Great Britain, 2007; Curtis, 2008; Department of Health, 2008) (www.ofsted.gov.uk).
The pattern of service use is described. Total costs are presented as mean cost per participant, and the average costs for each of the childhood autism, broader ASD and SEN groups are compared with the typically developing group using standard parametric t-tests, despite the skewed nature of the cost data. The validity of the t-tests was confirmed using bias-corrected, non-parametric bootstrapping (repeat re-sampling), a recommended approach in the analysis of skewed cost data because the arithmetic mean is maintained (Barber and Thompson, 2000).
Regression analysis for the autism and broader ASD sample
Subjects from the autism and the broader ASD groups were combined in the regression analysis. The following participant characteristics from the SNAP interviews were included in this analysis.
Age, sex, ethnicity and parent’s occupational class – these demographic factors have been found to be significant predictors of costs in a study of pre-school children with autism (Barrett et al., 2011), adolescents with mental health problems (Byford et al., 2008) and adolescents with complex mental health-care needs (Clark et al., 2005).
Diagnosis – the sample included young people with a diagnosis of core autism and also those with broader ASD, and we hypothesised that costs would be higher in those with core autism.
IQ at the age of 12 years – we hypothesised that individuals with a lower IQ would have higher service costs.
Severity of autism symptoms at the age of 12 years – measured using current ADI scores, ADOS scores and the number of ICD-10 symptoms. These measures have been found to be significant predictors in a younger sample (Barrett et al., 2011).
Functioning at the age of 12 years – we hypothesised that individuals with higher levels of functioning as measured by the VABS would incur lower costs.
Mental health difficulties at the age of 12 years – we hypothesised that costs would be higher for those with more mental health difficulties measured using the SDQ.
Statistical associations between each of these variables and total service costs were estimated using linear regression, and then, adjusted associations were calculated using multiple regression. A significance level of 5% was used. The results of the model were subject to two checks: first, they were compared with the results from a non-parametric bootstrap regression in order to assess the robustness of the confidence intervals and p values given the non-normality of the cost distribution (Efron and Tibshirani, 1993). Second, the results from the ordinary least-squares (OLS) regression were compared with the results obtained from a generalised linear model (GLM) where a non-normal gamma distribution was assumed for costs (Blough et al., 1999). Statistical analyses were performed using Stata 11 (StatCorp, 2009).
Results
The CA-SUS was administered to 148 of the 157 participating families; missing data were due to limited parent availability or time constraints.
Participant characteristics
The young people in the study were on average aged 15 years (range 14–17 years), and predominantly male (92%) and white (83%) (Table 1). Further details of participant characteristics can be found in Baird et al. (2006) and Charman et al. (2011).
Participant characteristics.

ASD: autism spectrum disorder; SEN: special educational needs; SD: standard deviation; IQ: intelligence quotient; ADI: Autism Diagnostic Interview; ADOS: Autism Diagnostic Observation Schedule; ICD-10: International Classification of Diseases (10th revision); SDQ: Strengths and Difficulties Questionnaire.
Data not collected.
Service use
Service use for the 6 months prior to interview is detailed in Table 2. Respite care was used by a fifth of the subjects with autistic disorder and by 7% and 4% of the broader ASD and SEN groups, respectively. Mainstream schools were attended by all the adolescents in the typically developing group and 73% of the adolescents in broader ASD group, but by less than half of the individuals in the childhood autism and SEN groups, who were more likely to be in special or residential education. Hospital inpatient stays were rare in all groups; outpatient appointments were common in the childhood autism, broader ASD and SEN groups and were also accessed by typically developing adolescents. Around half of the adolescents with SEN and typical development had one or more contacts with their general practitioner (GP). Medications (both prescribed and those purchased over the counter) were taken by between a quarter and a half of the young people in the sample.
Service use (% with at least one contact) over 6-month follow-up.
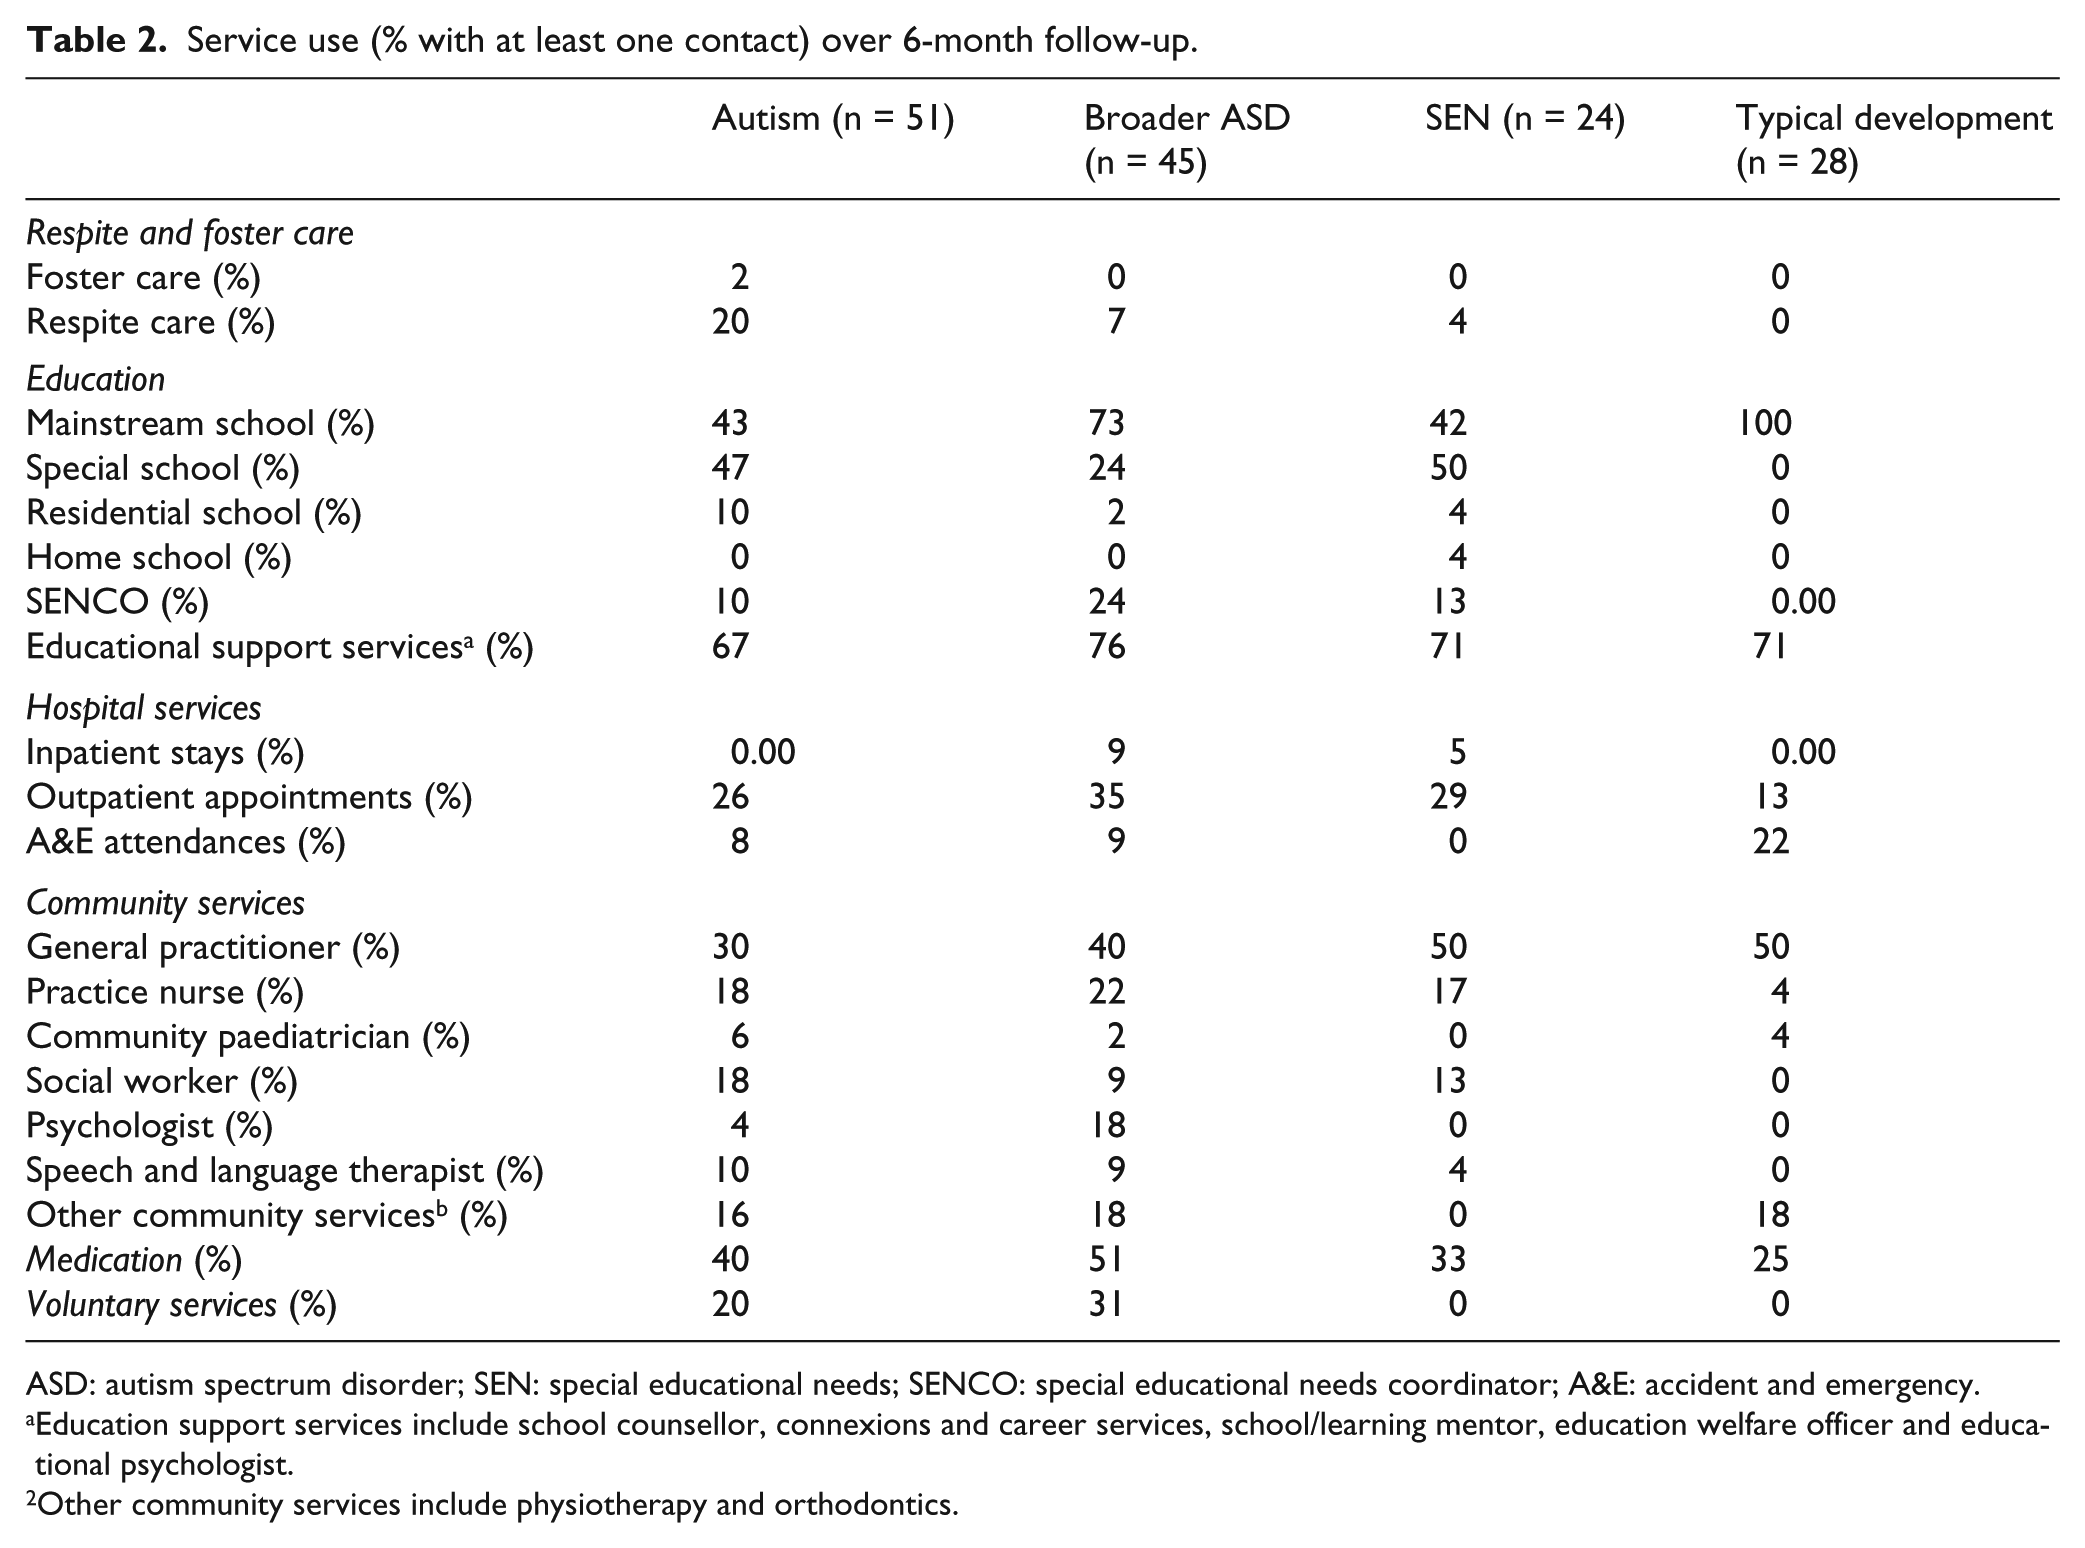
ASD: autism spectrum disorder; SEN: special educational needs; SENCO: special educational needs coordinator; A&E: accident and emergency.
Education support services include school counsellor, connexions and career services, school/learning mentor, education welfare officer and educational psychologist.
Other community services include physiotherapy and orthodontics.
Total costs
Table 3 details the total costs by service sector. Average total cost per participant over the 6-month study period was highest in the childhood autism group (£11,029), followed by the SEN group (£9268), the broader ASD group (£8968) and finally the typically developing group (£2954). The costs of education services constituted almost 90% of total costs in all groups. The average total cost per participant was significantly higher in the childhood autism (p < 0.001), SEN (p < 0.001) and broader ASD groups (p < 0.001) than among typically developing youth. There were no significant differences in total costs among the autism, broader ASD and SEN groups.
Total cost (£, mean (SD)) range per adolescent over 6-month follow-up.
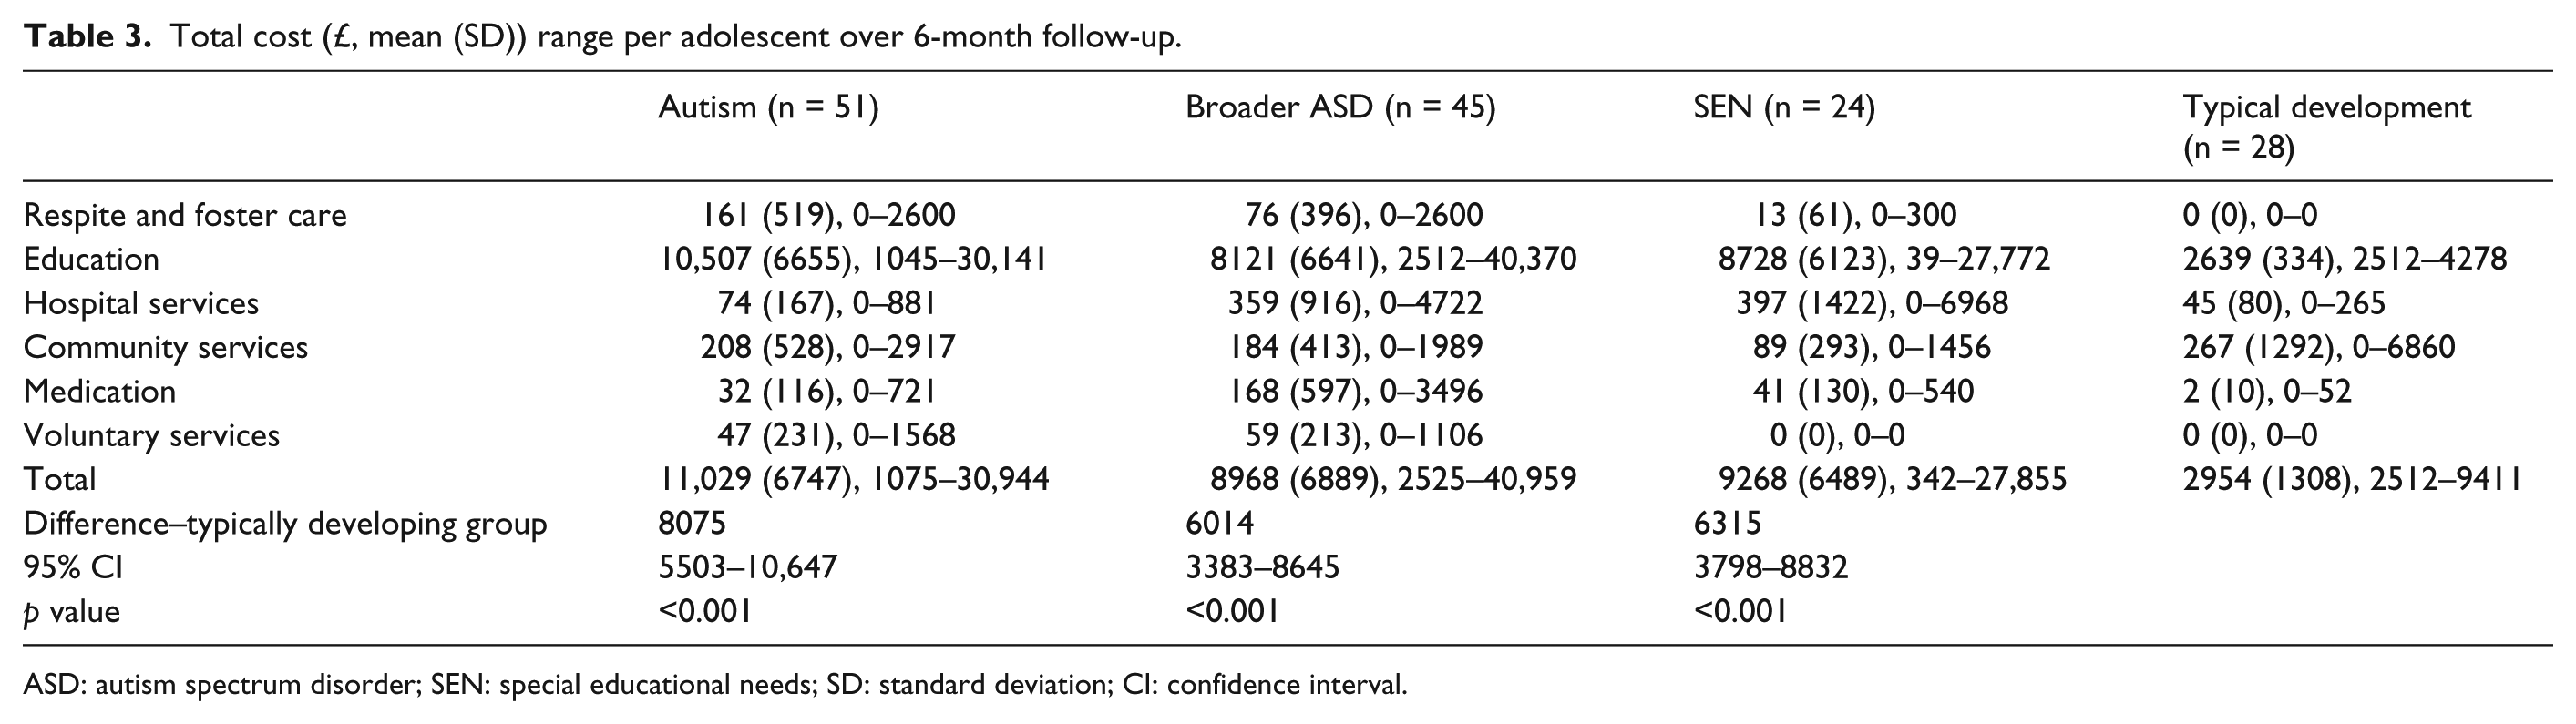
ASD: autism spectrum disorder; SEN: special educational needs; SD: standard deviation; CI: confidence interval.
As is common in cost data, the distribution of costs was highly skewed, with a small number of participants driving up the mean cost of the group (Thompson and Barber, 2000); this is demonstrated by the range in costs detailed in Table 3.
Regression analysis
The results of regression analysis are reported in Table 4, which details the direction of cost change and the p value for each regression. For continuous variables while analyses were carried out on the continuous data, for ease of presentation, the difference in cost is shown in two groups split at the median. Significant predictors of cost were age, IQ, ADI–current communication score (poorer communication), ADOS–communication score (poorer communication), ADOS repetitive behaviour score (more repetitive behaviours) and Vineland composite standard score (poorer adaptive behaviour). There was no significant difference in service costs by sex, ethnicity or parent’s occupational class. Interestingly, the difference in cost between those with autism and broader ASD was not significant, which suggests that there are more nuanced and subtle condition-related explanations for service use. In addition, ADI–current restrictive and repetitive behaviour score, ADOS–social score, ICD total symptoms and SDQ score were not significant predictors of cost.
Associations with cost for autism/broader ASD sample only.

ASD: autism spectrum disorder; IQ: intelligence quotient; ADI: Autism Diagnostic Interview; ADOS: Autism Diagnostic Observation Schedule; ICD-10: International Classification of Diseases (10th revision); SDQ: Strengths and Difficulties Questionnaire; PDD: pervasive developmental disorders.
For continuous variables while analyses were carried out on continuous data, for ease of presentation, the difference in cost is shown in two groups split at the median.
The results of the multivariate regression are detailed in Table 5. This table shows that for every yearly increase in age, costs fall by £4917, and for every unit increase in Vineland score, costs fall by £156. The final model was able to account for around a quarter of the variation in cost (adjusted R2 = 0.25). Results from the bootstrap and GLM analyses were not substantially different from the OLS regression and are thus not reported here, but are available from the first author (B.B.) on request.
Multivariate model for autism/broader ASD sample.

ASD: autism spectrum disorder; IQ: intelligence quotient; ADI: Autism Diagnostic Interview; ADOS: Autism Diagnostic Observation Schedule.
Adjusted R2 = 0.2464.
Discussion
While a number of studies have estimated the service use and costs associated with autism in the United Kingdom (Barrett et al., 2011; Knapp et al., 2009), this is the first study to make the comparison with other special needs and typically developing controls. We have therefore been able to establish that childhood autism is a costly condition in adolescents; over 6 months, the total costs of services for adolescents with childhood autism were over £8000 more than those for typically developing adolescents. A comparable result was established in the United States; Cidav et al. (2013) found that health service expenditures among children with autism were substantial and increased with age. However, we have also demonstrated that the cost of childhood autism is not uniquely high and that costs were not statistically different over 6 months than for adolescents with other special needs such as intellectual disability. For young people who do not meet the criteria for a clinical diagnosis of childhood autism yet have broader ASD, total costs were more than £2000 lower than for those with childhood autism.
In common with the results found in an investigation of the costs of pre-school children with autism in the United Kingdom (Barrett et al., 2011) and in a sample of children aged 3–17 years in the United States (Lavelle et al., 2014), in this adolescent population, the key cost driver was education; costs were highest in those with childhood autism and SEN because of the specialist day and residential schooling that their needs require. In those with a broader ASD, average costs were lower because a greater proportion of the sample was able to attend a mainstream school (73% compared to 43% in the childhood autism group).
In adjusted analysis, lower age and poorer adaptive behaviour were associated with higher costs. While the sample consists of individuals in a narrow age band, we found that costs were significantly higher among slightly younger participants. Examination of the data suggests that this is due to a reduction in the intensity of classroom support and specialist provision in post-16 education. The strong association between costs and the Vineland composite standard score suggests that daily functioning is likely to be a strong and important indicator of a need for specialist or residential schooling. However, given the size of the R2, it is likely that there are also non-identified factors driving high costs.
There are a number of limitations to this study. First, the cost of informal care by family members, parental productivity losses and out-of-pocket costs were not measured. These indirect costs have been proven to be high in children with autism (Jarbrink et al., 2003), and it is therefore likely that there is a substantial additional cost for the families of adolescents with childhood autism, broader ASD and other SEN. Second, service use data were collected retrospectively by participant self-report (typically developing group only) or parental report (other groups); therefore, costs may not be completely accurate. Although there is no evidence that alternative methods of data collection are more precise (Byford et al., 2006), the different approaches for the collection of data for the typically developing group means there may be some systematic bias. Third, the data reflect English service configurations; therefore, relevance to other settings will depend on similarities between health systems. Finally, these analyses are based on service use over 6 months during adolescence; lifetime costs of people with childhood autism, ASD and other SEN are likely to be higher, and the relationship between their costs and those of their typically developing peers may change over time.
A key strength of this article is inclusion of comparison groups of other SEN and of typically developing controls. With this, we have been able to make firm conclusions regarding the additional cost of ASD rather than just the absolute cost of the condition, which was the focus of previous UK-based studies (Barrett et al., 2011; Jarbrink et al., 2003; Knapp et al., 2009).
The study has highlighted the importance of education as a key cost driver for those with childhood autism and other special needs and the very high financial implications of specialist and residential schooling. Further research could consider the relative cost-effectiveness of mainstream provision with support compared to specialist or residential provision in young people with ASD and other SEN and the possibility for early intervention that could facilitate the move to supported mainstream education. Clearly, the value of services to young people and families cannot be estimated solely in financial terms, but this study provides important data on financial costs.
Footnotes
Acknowledgements
The authors are grateful to the adolescents and families who took part in the study.
Declaration of conflicting interest
The views expressed are those of the author(s) and not necessarily those of the NHS, the NIHR or the Department of Health.
Funding
The study was funded by the Medical Research Council (G0400065). The study was also supported by the National Institute for Health Research (NIHR) Mental Health Biomedical Research Centre at South London and Maudsley NHS Foundation Trust and King’s College London.