
Abstract
A total of 32 studies comprising 238 simple reaction time and choice reaction time conditions were examined in individuals with autism spectrum disorder (n = 964) and controls (n = 1032). A Brinley plot/multiple regression analysis was performed on mean reaction times, regressing autism spectrum disorder performance onto the control performance as a way to examine any generalized simple reaction time/choice reaction time slowing exhibited by the autism spectrum disorder group. The resulting regression equation was Y (autism spectrum disorder) = 0.99 × (control) + 87.93, which accounted for 92.3% of the variance. These results suggest that there are little if any simple reaction time/choice reaction time slowing in this sample of individual with autism spectrum disorder, in comparison with controls. While many cognitive and information processing domains are compromised in autism spectrum disorder, it appears that simple reaction time/choice reaction time remain relatively unaffected in autism spectrum disorder.
The literature on autism spectrum disorder (ASD) suggests a wide variety of cognitive, social and behavioral deficiencies (Schmitz et al., 2007). Central to many of these deficiencies is that reaction time (RT) would also be compromised, as RT (simple reaction time (SRT) as well as choice reaction time (CRT)) and speed of processing are critical underlying mechanism tying various cognitive abilities and functions together. SRT involves the participant making a single response to a stimulus, and the instructions in such a task would state that when the participant sees or hears the stimulus, they need only press the spacebar on the computer. CRT, on the other hand, involves the participant making a decision with regard to which key on a keyboard to press. A typical CRT task may instruct the participant to press the “z” key when a red stimulus appears on the computer screen and to press the “m” key when a green stimulus appears on the computer screen. Thus, they have to make a decision (or choice) on which key to press. No such decision is involved in the SRT task. While RT is a fundamental component of information processing, results with individuals with ASD are often at odds with regard to what aspects of RT slow and what aspects do not slow.
For instance, individuals with ASD are faster at processing visual-spatial information than controls (Kaland et al., 2007). Likewise, the attentional system of individuals with ASD operates differently such that individuals with ASD are also faster at certain visual search tasks (Landry et al., 2009) than controls. At higher conceptual levels of information processing (i.e. word meaning), however, individuals with ASD are typically much slower than controls (Spiers et al., 2011). Since RT forms the basis of many cognitive tasks, abilities, and processes, and given that individuals with ASD do not always show evidence of information processing impairments on some processes that involve RT, further investigation of the role RT plays in individuals with ASD seems important.
One methodology to examine RT similarities and differences within and between groups is the so-called Brinley (1965) plot analysis. Such Brinley plots often compare younger and older adults, for instance, across several experimental conditions in which both groups of subjects participated in Myerson et al. (1994). Additionally, several conditions from many experiments are combined into a single Brinley plot to show the extent of RT slowing. Much like multiple regression, Brinley plots result in a mathematical function represented by the equation Y = mX + b (where Y represents the RT latencies for younger adults, X represents the RT latencies from older adults, m represents the coefficient of slowing, also referred to as the slope value, and b indicates where this best fit regression line crosses the Y axis). Like regression, an R2 value is also calculated and represents the amount of variance accounted for by the specific bet-fit regression line through the various group data points. Thus, the slope value can be used as an index of slowing and has been used widely in studies of aging and closed-head injury to name but a few. A slope of 1.0 would indicate, for instance, no slowing between two groups of subjects, while a slope of 1.5 would indicate that one group was 1.5 times slower than another group. Likewise, a slope of 1.6 would indicate that one group was 1.6 times slower than another group. For instance, Ferraro (1996) examined mean RTs from 13 studies which included n = 353 closed-head-injury subjects and n = 329 control subjects and found that Y (CHI) = 1.54X (control) − 59, which suggests that for this specific sample, the CHI subjects were approximately 1.54 times slower than the control subjects across RT conditions in which both groups participated. This function accounted for 89% of the variance. Thus, the Brinley plot methodology can be applied to groups of subjects to further investigate the extent (or lack thereof) of what has been termed general slowing.
In this study, we applied the Brinley plot methodology to the ASD literature to test the hypothesis that there is a general slowing accompanying ASD in cognitive tasks that require RT as a dependent variable. No such Brinley plot analysis has been performed in the ASD literature, and its use in this literature may shed light on more recent developments suggesting that some cognitive processes are spared in ASD, while others are not.
Methods
A total of 32 studies (see Table 1) comprising 238 SRT and CRT conditions were examined in individuals with ASD (n = 964) and controls (n = 1032). Google Scholar was employed as the search engine and was searched for the time frame 1997–2014 using the following search terms: Autism, ASD, RT, and reaction time. The following criteria were used to select studies: (1) studies chosen used either SRT or CRT as the dependent variable, (2) RTs could not be faster than 250 ms or slower than 5000 ms, (3) a comparable control group (non-ASD) was included that participated in the same set of experimental conditions, (4) at least 1 experimental condition common to both subject groups, and (5) RT values appeared in table form in the manuscript. Table 1 lists each study, the type of task (SRT, CRT), number of experimental conditions in which the ASD and control groups each participated, sample characteristics, and how the diagnosis of ASD was made based on the search criteria listed above.
Characteristics of studies used in the present Brinley plot analysis.

DSM-III: Diagnostic and Statistical Manual of Mental Disorders (3rd ed.); DSM-II-R: Diagnostic and Statistical Manual of Mental Disorders (2nd ed. rev.); DSM-IV: Diagnostic and Statistical Manual of Mental Disorders (4th ed.); DSM-IV-TR: Diagnostic and Statistical Manual of Mental Disorders (4th ed., text rev); ICD-10: International Classification of Diseases, Tenth Revision; ADOS: Autism Diagnostic Observation Schedule; ADOS-G: Autism Diagnostic Observation Schedule-Generic; AD: Alzheimer’s Disease; M RSPM: Raven’s Standard Progressive Matrices.
Results and discussion
Across the 32 studies, the mean SRT/CRT for each of the 238 experimental conditions was tabulated between ASD and non-ASD groups. These points were then plotted as (X, Y) coordinates and the best-fitting regression equation (ASD data regressed onto the corresponding non-ASD/control data) was fitted to these 238 points (see Brinley plot in Figure 1). The best-fitting equation that resulted was the following: Y (ASD) = 0.99X (non-ASD) + 87.93, R2 = 92.3%. Our results show that, in the sample of studies included in this analysis, there is little if any SRT/CRT slowing associated with individuals with ASD.
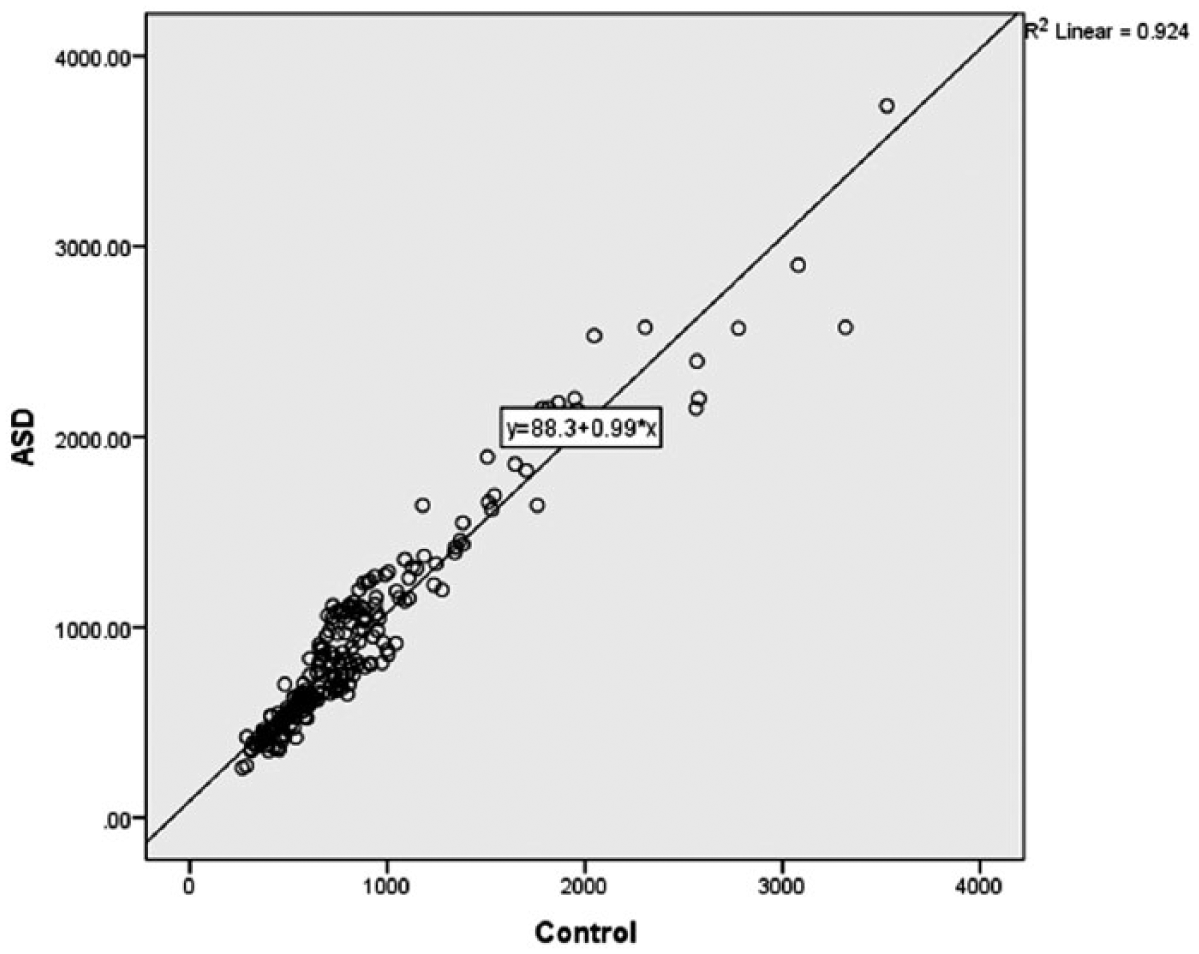
Mean SRT/CRT response times (in milliseconds) of individuals with ASD as a function of control individuals across 238 conditions.
This is the first study to use Brinley plot methodology to examine RT (SRT and CRT) slowing issues in ASD individuals. It supports the notion that not all cognitive abilities decline in ASD, especially as they relate to RT. The Brinley plot methodology has been used in developmental and aging studies for many decades, as well as in the examination of studies examining slowing in age-related diseases such as Alzheimer’s diseases (ADs). Such studies have been influential in the literature and have shown that slowing ratios often differ depending on which specific cognitive abilities are being examined and come to the conclusion that slowing is not a general consequence of aging and/or disease. Some processes slow with age and disease, while others do not. In other words, slowing is not general, but rather specific to the task at hand.
While this study only examined RT (SRT and CRT) slowing in individuals with ASD and did not examine specific tasks above and beyond whether they included SRT and CRT conditions, these results suggest little if any slowing in individuals with ASD. This is an important and relevant contribution to the ongoing discussion and debate regarding aspects of cognitive function that are impacted by ASD. ASD results in deficits in social communication, social interaction (American Psychiatric Association (APA), 2013) and many non-social perceptual and cognitive abnormalities. That RT is relatively preserved (based on the present Brinley plot analysis with the resulting slope of 0.99) is suggestive that the cognitive declines often observed in individual with ASD are not general and all-encompassing. That is, the RT components of the underlying cognitive processes appear preserved, based on the present analysis, and it is likely that processes beyond RT are those that are potentially compromised in individuals with ASD.
Future studies employing Brinley plot analysis could examine the slowing ratios of individuals with ASD across a wider range of tasks covering the entire information processing sequence, and not just RT. It may be that the slowing ratio in individuals with ASD varies as a function of type of information processing system or sequence being engaged by a specific task. Likewise, only 32 studies were used in this study, although typical criteria from other similar studies were employed. A more fine-grained article selection process could also have been used.
Despite these limitations, this study is the first to explore RT slowing in individuals with ASD. It was observed that there appears to be very little RT slowing in this group, based on Brinley plot methodology and analysis (e.g. slope value equals 0.99). These results can stand as a starting point to further investigate the impact ASD has on slowing (or lack thereof) across various cognition domains, thereby adding to the accumulating evidence of cognitive processing in individuals with ASD. These results also add to the discussion of assessment issues with individuals with ASD such that inclusion of RT tasks (SRT, CRT) in batteries of cognitive tasks would be helpful with regard to clinical assessment and clinical precision in psychological and neuropsychological investigations (see Mahurin and Pirozzolo, 1986). Such SRT and CRT measures would add valuable information with regard to clinical assessment and diagnostic issues.
Footnotes
Funding
This research received no specific grant from any funding agency in the public, commercial, or not-for-profit sectors.