



Abstract
Utilizing surveillance data from five sites participating in the Autism and Developmental Disabilities Monitoring Network, we investigated contributions of surveillance subject and census tract population sociodemographic characteristics on variation in autism spectrum disorder ascertainment and prevalence estimates from 2000 to 2008 using ordinal hierarchical models for 2489 tracts. Multivariable analyses showed a significant increase in ascertainment of autism spectrum disorder cases through both school and health sources, the optimal ascertainment scenario, for cases with college-educated mothers (adjusted odds ratio = 1.06, 95% confidence interval = 1.02–1.09). Results from our examination of sociodemographic factors of tract populations from which cases were drawn also showed that after controlling for other covariates, statistical significance remained for associations between optimal ascertainment and percentage of Hispanic residents (adjusted odds ratio = 0.93, 95% confidence interval = 0.88–0.99) and percentage of residents with at least a bachelor’s degree (adjusted odds ratio = 1.06, 95% confidence interval = 1.01–1.11). We identified sociodemographic factors associated with autism spectrum disorder prevalence estimates including race, ethnicity, education, and income. Determining which specific factors influence disparities is complicated; however, it appears that even in the presence of education, racial and ethnic disparities are still apparent. These results suggest disparities in access to autism spectrum disorder assessments and special education for autism spectrum disorder among ethnic groups may impact subsequent surveillance.
Introduction
Autism spectrum disorder (ASD) is defined in the Diagnostic and Statistical Manual of Mental Disorders, 5th ed. (DSM-5) by persistent impairments in social communication and restricted, repetitive patterns of behavior manifested across multiple contexts that are present in early childhood development and cause clinically significant deficits in function (American Psychiatric Association (APA) 2013). Recent surveillance studies estimate the current prevalence of ASD in the United States to be over 1% (Autism and Developmental Disabilities Monitoring (ADDM) Network Surveillance Year 2008 Principal Investigators, 2012; ADDM Network Surveillance Year 2010 Principal Investigators, 2014) while another recent study of parent-reported ASD found a prevalence of 2% (Blumberg et al., 2013). Over the past few decades, measured ASD prevalence has steadily increased (Atladottir et al., 2007; Gal et al., 2012; Newschaffer et al., 2005; Rosenberg et al., 2009; Wazana et al., 2007), but the cause for this increase is unknown. Some have suggested that factors such as improvements in case ascertainment (Blumberg et al., 2015; Parner et al., 2011), greater awareness (Keyes et al., 2012; Parner et al., 2008; Wazana et al., 2007), and changes in diagnostic criteria (Gal et al., 2012; Williams et al., 2006) may play a role.
Many health conditions are under-diagnosed in lower-income communities and non-Caucasian populations, as these populations tend to seek diagnosis and services less frequently (Matthews and Hughes, 2001). Minority racial groups often experience greater rates of poverty and limited access to education and resources (Gradin, 2012). People with lower income also tend to cluster in areas while persons with medium and higher incomes often have the resources to move to more desirable locations with better access to services including private practice clinics (Yen and Kaplan, 1999). Limitations in access to diagnostic and treatment services for people with ASD have previously been attributed to this geographic clustering (Mazumdar et al., 2013; Van Meter et al., 2010).
Previous studies have investigated associations between higher socioeconomic status (SES) characteristics and increased ASD diagnosis or prevalence and have consistently described differences across ethnic and socioeconomic groups with prevalence being lower in groups with lower income and education (Bhasin and Schendel, 2007; Croen et al., 2002; Durkin et al., 2010; Fountain et al., 2011; Hertz-Picciotto et al., 2010; King and Bearman, 2011; Liptak et al., 2008; Rahbar et al., 2013; Rosenberg et al., 2009; Sasanfar et al., 2010; Windham et al., 2011). This positive association has also been observed in cumulative incidence (Van Meter et al., 2010) and with geographic clustering (Bakian et al., 2014; Hoffman et al., 2012; Mazumdar et al., 2010; Yeargin-Allsopp et al., 2003). Studies have also shown lower ASD prevalence among traditionally underserved populations including Blacks and Hispanics (Windham et al., 2011; Yeargin-Allsopp et al., 2003). However, although Bhasin and Schendel (2007) observed an association between ASD diagnosis and sociodemographic characteristics, including race and median household income (MHI), these patterns were only apparent before the model was adjusted for diagnostic records source (i.e. school source only, non-school sources only, and both school and non-school sources). This finding may be due to a greater ability of more educated individuals to navigate the complex medical system to seek a diagnosis for their children (Windham et al., 2011), differences in presentations of symptomatology of ASD, cultural perceptions of atypical behavior (El-Ghoroury and Krackow, 2012; Mandell et al., 2009), or greater access to services for families with higher SES and closer residential proximity to clinical specialists (Bakian et al., 2014; Kalkbrenner et al., 2011; Tek and Landa, 2012).
Public school systems are required to meet the educational needs of children with ASD at no cost to their families, in accordance with amendments to the Individuals with Disabilities Education Act (IDEA) (1997). Previous studies have reported that approximately 70% of children with developmental delays (Glascoe, 2000) and 20% of children with ASD (Blumberg et al., 2015) were undiagnosed prior to primary school. Furthermore, analysis of surveillance data from the Centers for Disease Control and Prevention (CDC) revealed that more than 75% of ASD cases were ascertained through school systems with school records being the only record source for 40% of children (Yeargin-Allsopp et al., 2003). Therefore, schools play an important role in the identification of children with ASD who might otherwise go undiagnosed (Palmer et al., 2005). The aim of this study is to investigate the contribution of census tract-level ASD case surveillance subject characteristics, as well as area-based characteristics of census tract populations from which cases were drawn, on variation in sources of ASD diagnostic records (school, health, or both school and health records) available for case ascertainment from 2000 to 2008.
Methods
Study participants
The Autism and Developmental Disabilities Monitoring (ADDM) Network is a multi-state public health surveillance system for ASD and other developmental disabilities established by the CDC in 2000. This system was developed to monitor prevalence trends of ASD and other developmental disabilities in the United States through identification of 8-year-old children with various neurodevelopmental diagnoses. Case ascertainment is record-based, and data were obtained from healthcare and education service providers such as primary care clinics, hospitals, schools, and diagnostic and treatment centers. ASD case status is determined by the number and pattern of autism characteristics described in comprehensive reports, consistent with criteria for autistic disorder, Asperger’s disorder, and pervasive developmental disorder not otherwise specified (PDD-NOS), according to the Diagnostic and Statistical Manual of Mental Disorders 4th ed., text rev. (DSM-IV-TR) (APA, 2000). Although the fifth edition of the DSM was released in 2013 (APA, 2013), the use of DSM-IV-TR criteria in this study reflects the period of case ascertainment that preceded the use of DSM-5. Information on methodology and case ascertainment for this public health surveillance system has been previously published (Rice et al., 2007; Van Naarden et al., 2007).
Aggregate data at the census tract level for 8-year-old children with an ASD classification in surveillance years 2000, 2002, 2004, 2006, and 2008 were acquired from the following ADDM sites: Arizona, Maryland, New Jersey, South Carolina, and Utah. Data obtained were de-identified and aggregated by census tract, yielding a total of 2558 tracts. Census tract residence for ASD cases was based on residence at the time of surveillance (at 8 years of age). Tract-level variables provided for this study included the total number of ASD cases, the number of years each census tract was included in surveillance, percentage of male cases, percentage of cases that were White, Black, and other races (including Asian, Native American, Asian Pacific, and Alaskan Native), percentage of cases that were of Hispanic ethnicity, percentage of cases with an IQ ⩽ 70, and the percentage of cases with mothers having at least a bachelor’s degree (according to available birth certificates).
Information on tract-level area-based population characteristics was obtained from 2000 US Census data using American FactFinder® (http://factfinder.census.gov). Variables obtained from census data included population of children 0–9 years of age, percentage of the census tract residents of White, Black, or other race in each census tract, percentage of tract residents with Hispanic ethnicity, percentage of the tract population living below poverty, MHI for each census tract, and census tract geographic classification (urban vs rural). To maintain confidentiality, these tract-level data were sent to ADDM sites, where aggregate surveillance data were linked based on tract numbers. Also, the ADDM sites rounded the count of children with ASD to the nearest 5 (e.g. tracts with 12 children were rounded to 10 while those with 24 children were rounded to 25) and MHI to the nearest $5000. ADDM and census data were then de-identified and returned for analysis.
Statistical analyses
The outcome variable was the number of ASD cases in each census tract and analyzed as count data. After examining the distribution of ASD cases by census tract, we analyzed ASD case counts using negative binomial regression. This model was determined to have the best fit according to the Akaike Information Criterion (AIC). Additionally, because the structure of the data is hierarchical, with census tracts (level 1) nested within counties (level 2), which are further nested into states (level 3), we used multi-level modeling (Bryk and Raudenbush, 1992). Due to aggregation of surveillance data for 5 years (2000, 2002, 2004, 2006, and 2008) with no indication of which surveillance year individual cases were ascertained in, we assumed a uniform distribution of cases ascertainment for this analysis. Therefore, we also assumed a uniform age distribution of children in each tract for our population calculation. We calculated population estimates by first dividing the total tract population of children 0–9 years of age, according to the 2000 census, by 10 to account for each age group (i.e. 0, 1, 2, … , 9 years old). This number was then multiplied by the total number of years each tract was included in ADDM surveillance to estimate the number of children ages 0, 2, 4, 6, and 8 years old during the 2000 census, and thus 8 years of age during ADDM surveillance years, as follows: (total population 0–9 years of age/10) × (number of surveillance years).
First, we investigated associations of demographic and SES distributions of ASD cases, including percentage of male cases, percentage of cases of White, Black, or other race, percentage of Hispanic ethnicity, percentage with an IQ ⩽ 70, and percentage of cases with mothers having at least a bachelor’s degree, and estimated tract ASD prevalence. We also examined area-based demographic and SES distributions of populations according to 2000 census data, including percentage of White, Black, or other race residents, percentage with Hispanic ethnicity, percentage of residents with at least a bachelor’s degree, MHI in the highest 25th percentile, percentage of families below the poverty line, and geographic classification (urban vs rural), of each census tract and their potential associations with tract-level ASD prevalence using multi-level negative binomial models. All race and ethnicity variables were scaled to 10% increments (i.e. 1–10%, 11–20%, …, 91–100%) along with education and percentage below poverty variables. Additionally, proportions for all three race categories were modeled as individual variables with neither serving as a reference for the other, as aggregation of data prevented categorization of race for independent subjects.
We examined differences in sources of records (school, healthcare, or both school and healthcare sources) for ASD ascertainment based on demographic and SES characteristics of ADDM surveillance subjects and residential tract populations from which ASD cases were drawn. Proportion of cases ascertained through records from school sources only and proportion of cases ascertained from both school and healthcare records were categorized into quartiles. Because only 46% of the tracts had any cases ascertained through healthcare sources only, this variable was categorized into a dichotomous variable indicating that at least one case was ascertained through healthcare sources only versus no cases were ascertained through healthcare sources only. The first stage examined associations of each predictive variable separately in univariable models with ascertainment outcomes modeled as follows: multi-level ordinal logistic regression to examine the proportion of cases ascertained through school records only, multi-level binary logistic regression to examine the binary outcome of any cases ascertained through healthcare records only, and multi-level ordinal logistic regression to examine the proportion cases ascertained through both school and healthcare records, the most favorable outcome. The second stage examined a combination of ADDM case characteristics as covariates and their associations with ascertainment record sources in multivariable ordinal hierarchical models. Additionally, percent male and percent with IQ ⩽ 70 were included in multivariable analyses of ADDM case characteristics, as these variables have been previously shown to be associated with identification of children with ASD even when disparities are apparent (Mandell et al., 2009). Third, we examined associations of area-based population distributions with ascertainment through school records only, healthcare sources, or both school and healthcare sources. Variables with a p value of 0.20 or less for univariable analyses were included in a final multivariable model (Hosmer et al., 2013). Rural tract classification was included in the multivariable model of area-based measures, as this has been found to be associated with access to health services and subsequent ASD identification (Kalkbrenner et al., 2011). Due to a high correlation between percentage of White and Black race variables, these were not modeled together as predictive variables to avoid multicollinearity. Additionally, percent of tract residents below the poverty line and tract MHI were also not modeled together for the same reason. All analyses were completed using SAS Version 9.3 statistical software (SAS Institute Inc., 2011).
Results
Of the data provided for 2558 census tracts from five ADDM study sites, 644 tracts were located in Arizona, 631 in Maryland, 588 in New Jersey, 368 in South Carolina, and 327 in Utah. However, considering that the highest estimated prevalence among these sites was 1 in 50, 69 (2.7%) tracts with populations of less than 40 children ages 0–9 years old were excluded from analyses. These included 17 tracts in which the population of children was rounded to zero. The remaining 2489 tracts were used for this analysis, comprising a total of 6583 cases. There were 802 tracts with no reported ASD cases.
Regarding demographic distributions of ASD cases, an average of 81.6% of ASD cases for tracts were male. For race distribution, a greater proportion of cases were White (57.5%), followed by Black and other race (20.0% and 4.8%, respectively). Demographic distributions for tract populations from which cases were drawn differed from that of the cases themselves. The average portion of males in the estimated census tract child population was 48.9%. Additionally, the greatest proportion of tract residents were of White race (70.1%), followed by Black (20.9%) and other race (11.5%). A large majority of the tracts (90.3%) were categorized as urban. More information on demographic and descriptive statistics is shown in Table 1.
Descriptive statistics for census tracts (n = 2489 tracts).
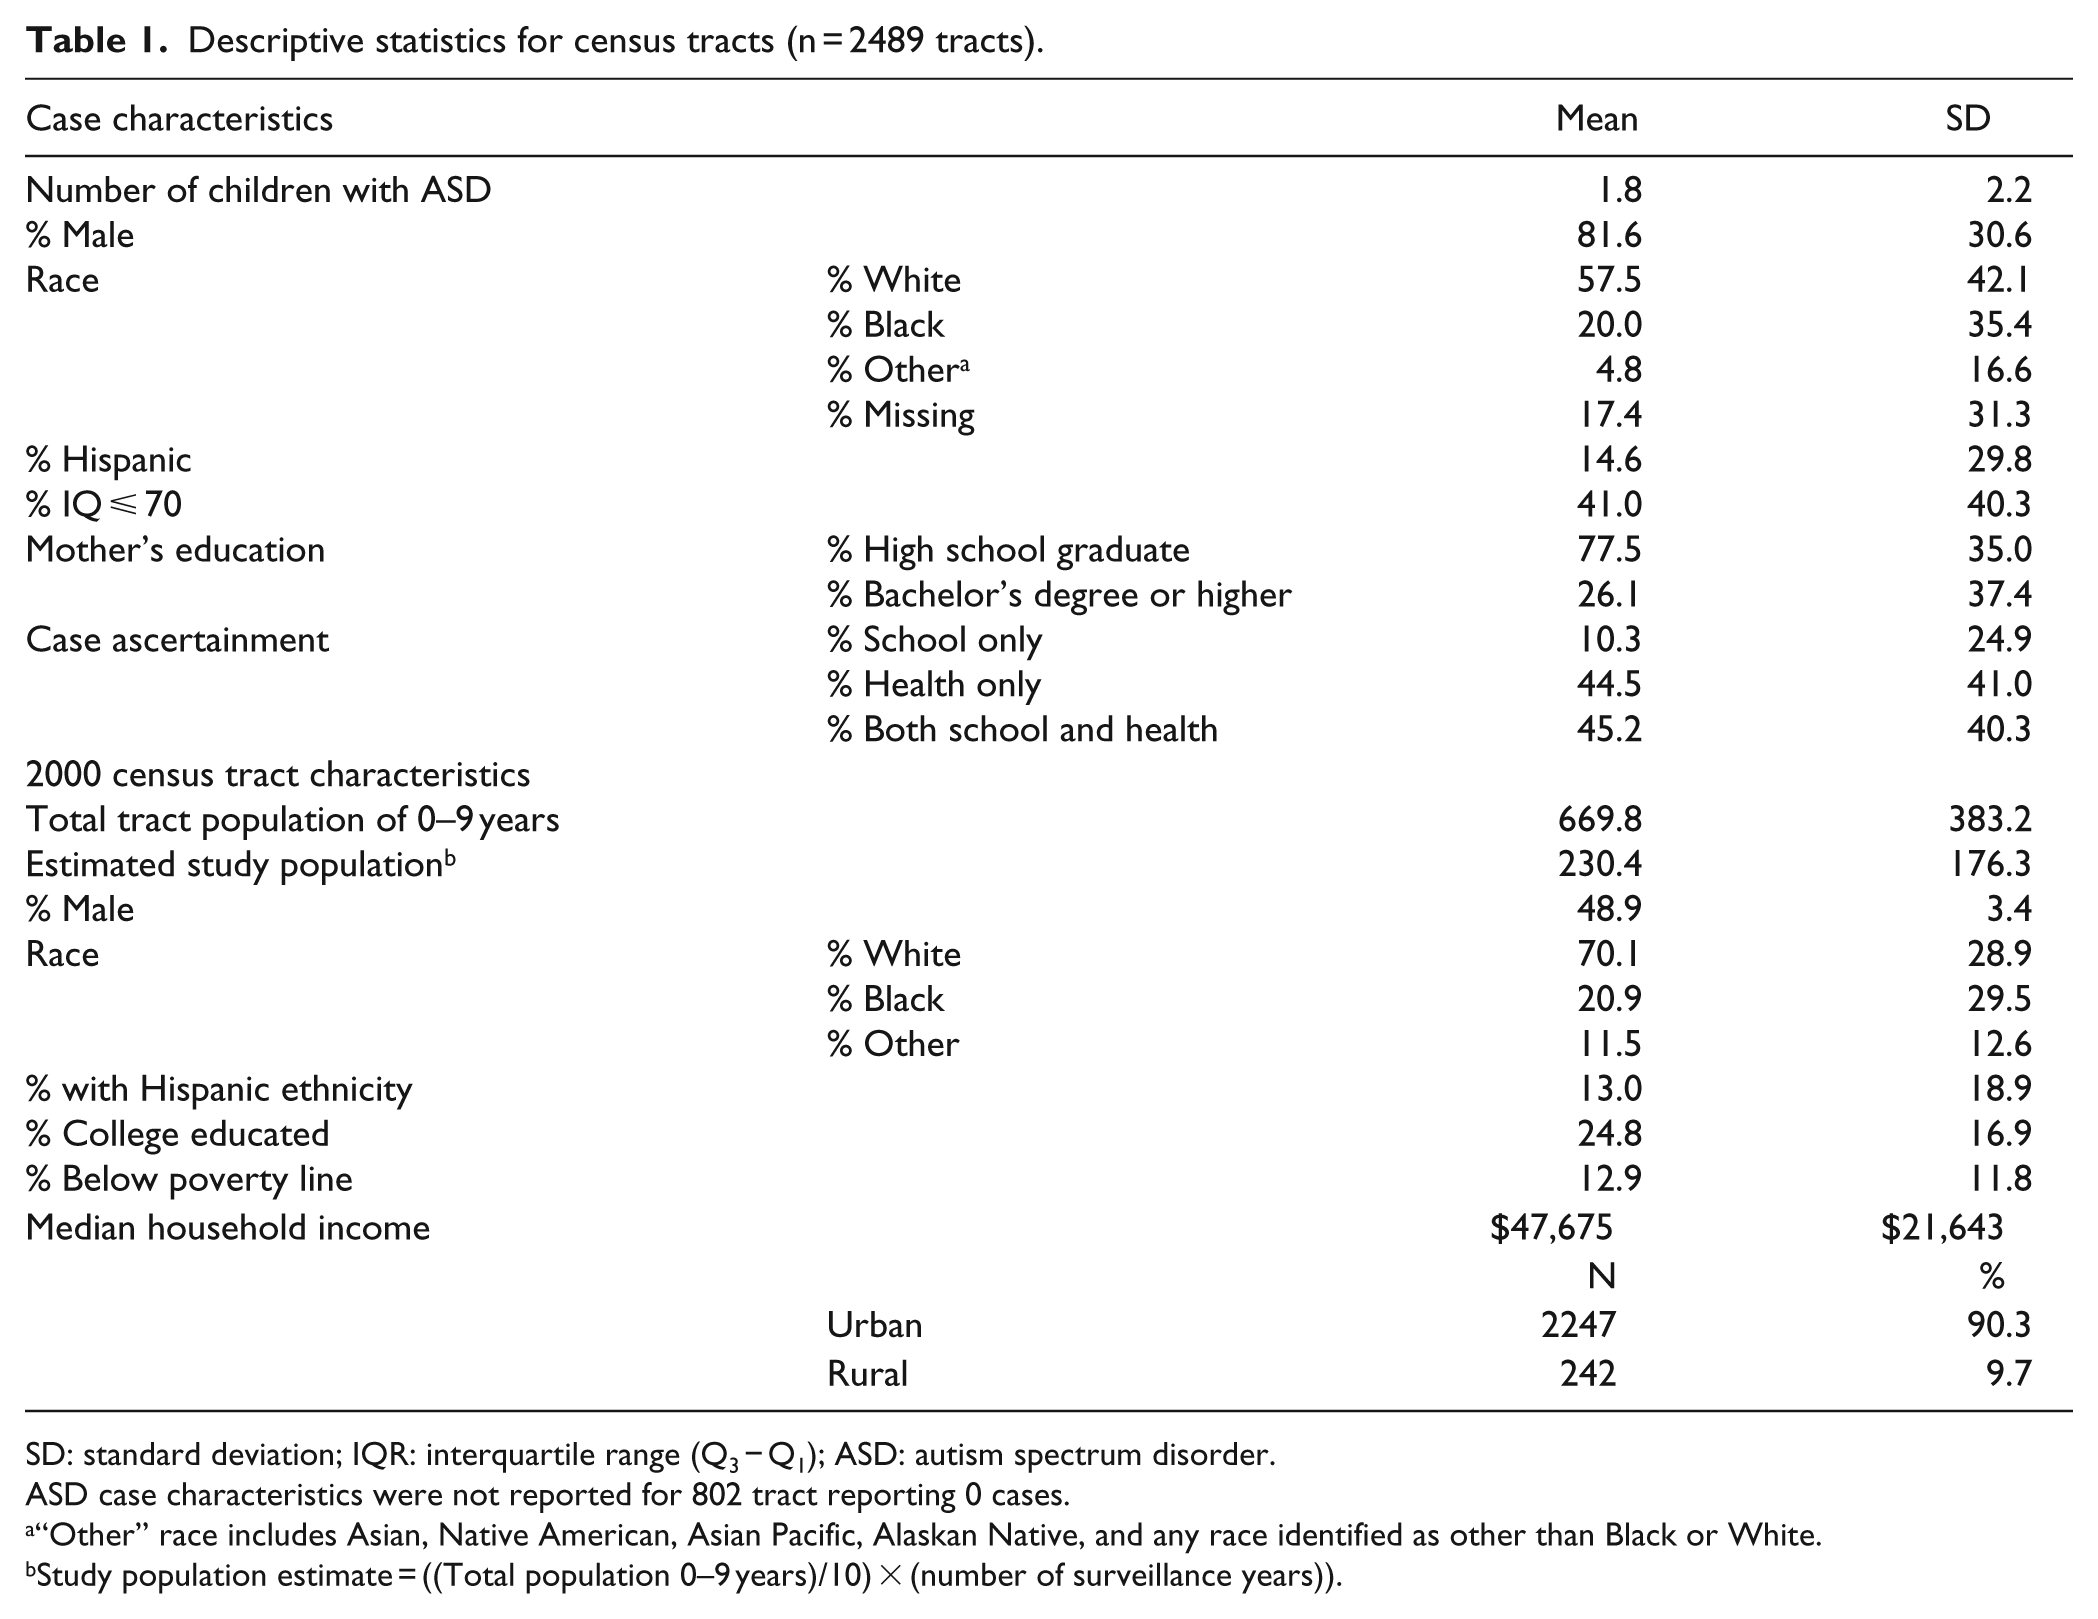
SD: standard deviation; IQR: interquartile range (Q3 − Q1); ASD: autism spectrum disorder.
ASD case characteristics were not reported for 802 tract reporting 0 cases.
“Other” race includes Asian, Native American, Asian Pacific, Alaskan Native, and any race identified as other than Black or White.
Study population estimate = ((Total population 0–9 years)/10) × (number of surveillance years)).
Initial analysis of the association between estimated ASD prevalence and optimal ascertainment (not displayed) revealed that expected prevalence was higher per 10% increase in percentage of ASD cases with both school and healthcare records (prevalence ratio (PR) = 1.10, 95% confidence interval (CI): 1.08–1.11). Univariable analyses identified positive associations between tract-level ASD prevalence and percentage of White cases (PR = 1.11, 95% CI: 1.10–1.12), percentage of Black cases (PR = 1.06, 95% CI: 1.04–1.07), percentage of cases of other races (PR = 1.06, 95% CI: 1.03–1.09), percentage with an IQ ⩽ 70 (PR = 1.18, 95% CI: 1.15–1.21), and percentage of cases with college-educated mothers (PR = 1.07, 95% CI: 1.05–1.08). All tract-level population characteristics were significantly associated with ASD prevalence. Specifically, reported ASD prevalence increased with increasing proportions of White residents (PR = 1.09, 95% CI: 1.08–1.11) and college-educated residents (PR = 1.07, 95% CI: 1.04–1.10), and with MHI within the highest 25th percentile compared to income in the 0 to 75th percentile (PR = 1.39, 95% CI: 1.28–1.51). In contrast, ASD prevalence decreased with increasing proportion of Black residents (PR = 0.94, 95% CI: 0.92–0.96) and other races (PR = 0.81, 95% CI: 0.78–0.84), Hispanic ethnicity (PR = 0.86, 95% CI: 0.84–0.88), rural geography (PR = 0.50, 95% CI: 0.40–0.63), and proportion of residents below the poverty line (PR = 0.79, 95% CI: 0.75–0.82). Detailed results from analyses are displayed in Table 2.
Univariable associations between ASD prevalence and demographic factors using negative binomial, multi-level regression.

Case factors missing for 802 tracts.
Scale = 10%.
In our investigation of the association between records source and demographic and SES case characteristics, we observed a statistically significant association between presence of records from schools only and Hispanic ethnicity in univariable analysis (odds ratio (OR) = 1.05, 95% CI: 1.02–1.09); however, in multivariable analysis, after adjusting for percentage of male cases, percent White cases, percentage of cases whose mothers had at least a bachelor’s degree, and percentage of ASD cases with an IQ ⩽ 70, the observed association was no longer statistically significant (adjusted odds ratio (aOR) = 0.97, 95% CI: 0.92–1.02). For the optimal ascertainment outcome of records from both school and healthcare sources, percent White cases and percentage of cases with mothers with at least a bachelor’s degree were significant in both the univariable and multivariable models. Specifically, in multivariable analysis, there was a 6% increase in the odds of having records from both diagnostic sources for every 10% increase in percentage of White cases in a tract (aOR = 1.04, 95% CI: 1.01–1.08) and a 6% increase in optimal ascertainment per 10% increase in percentage of mothers with at least a bachelor’s degree (aOR = 1.06, 95% CI: 1.02–1.09). Other results of analyses of records sources and case-related factors are in Table 3.
Associations of ascertainment sources with demographic and SES characteristics of ADDM cases using multi-level logistic regression models.
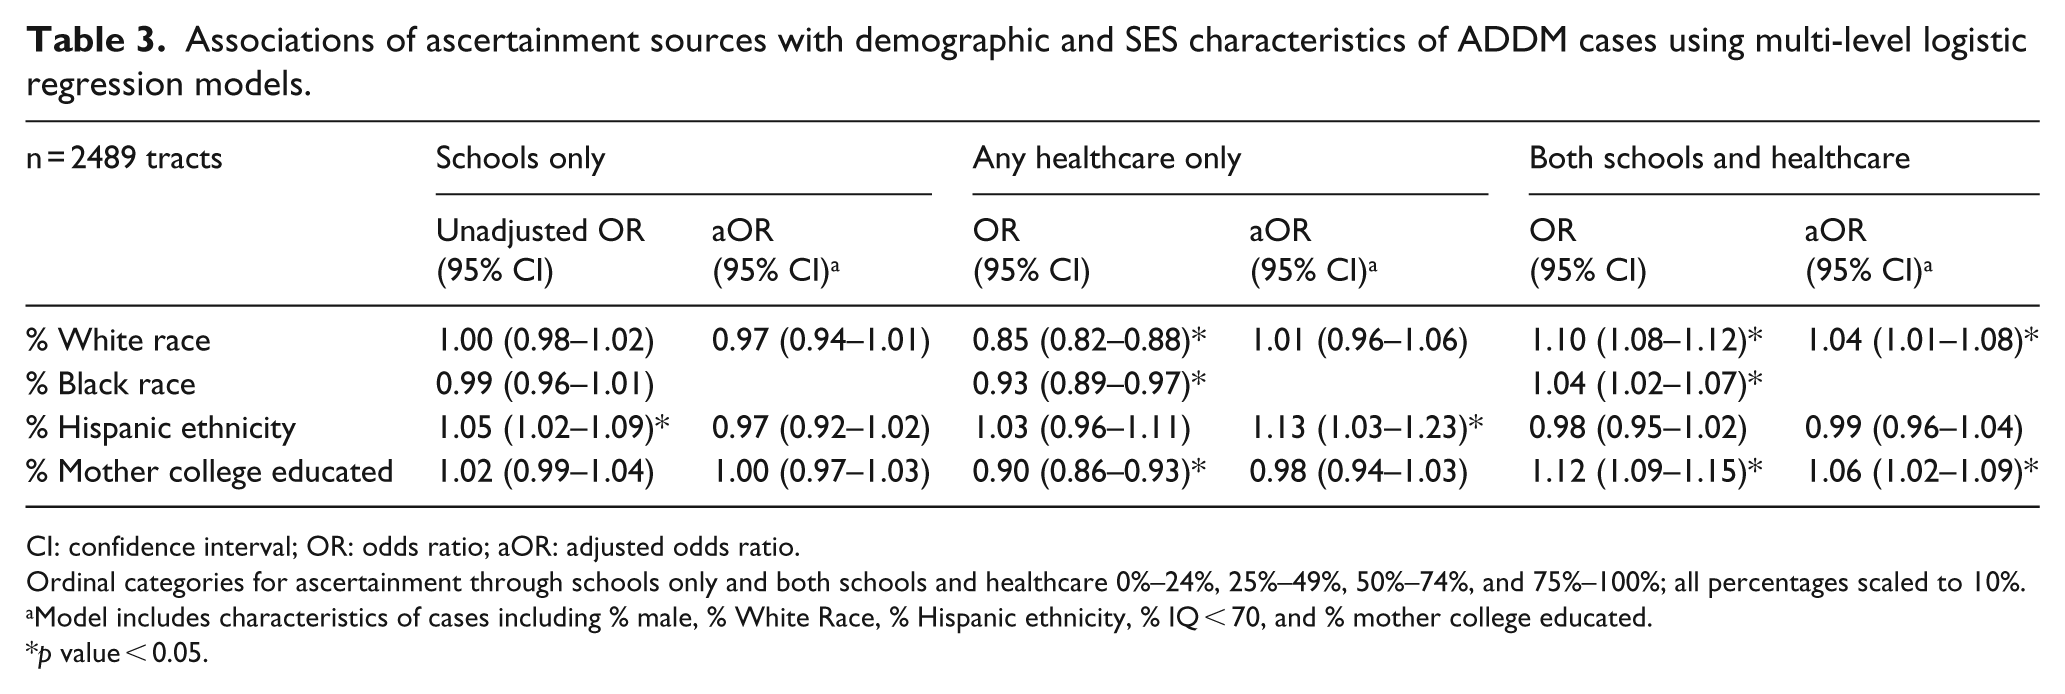
CI: confidence interval; OR: odds ratio; aOR: adjusted odds ratio.
Ordinal categories for ascertainment through schools only and both schools and healthcare 0%–24%, 25%–49%, 50%–74%, and 75%–100%; all percentages scaled to 10%.
Model includes characteristics of cases including % male, % White Race, % Hispanic ethnicity, % IQ < 70, and % mother college educated.
p value < 0.05.
Results from our examination of demographic and SES factors of tract populations from which cases were drawn showed that presence of records from schools only was lower for tracts with increased percentage of Hispanic residents in both the univariable (OR = 0.93, 95% CI: 0.89–0.98) and multivariable (aOR = 0.92, 95% CI: 0.87–0.97) analyses controlling for urbanicity, percentage of White resident, residents with at least a bachelor’s degree, and percent living below the poverty line. In contrast, increase in Hispanic residents along with Black residents and percent below poverty were all positively associated with presence of records from healthcare sources only in univariable analysis, while increase in White residents, college-educated residents, and tract MHI greater than the 75th percentile were inversely associated with ascertainment through healthcare sources only. However, none of these factors were statistically significant in multivariable analysis. When evaluating the optimal ascertainment outcome in univariable analyses, tracts with a greater percentage of White tract residents, college-educated tract residents, and MHI greater than the 75th percentile had a greater portion of ASD cases ascertained through both school and healthcare records. Additionally, univariable analyses showed that optimal ascertainment was significantly lower for tracts with a higher percentage of Hispanic residents and higher percentage of residents living below the poverty line. After controlling for previously mentioned factors, statistical significance remained for associations between optimal ascertainment and percentage of Hispanic residents (aOR = 0.93, 95% CI: 0.88–0.99) and percentage of tract residents with at least a bachelor’s degree in census tracts (aOR = 1.06, 95% CI: 1.01–1.11). Detailed results for both univariable and multivariable analyses are shown in Table 4.
Associations of ascertainment sources with demographic and SES characteristics of tract populations using multi-level logistic regression models.
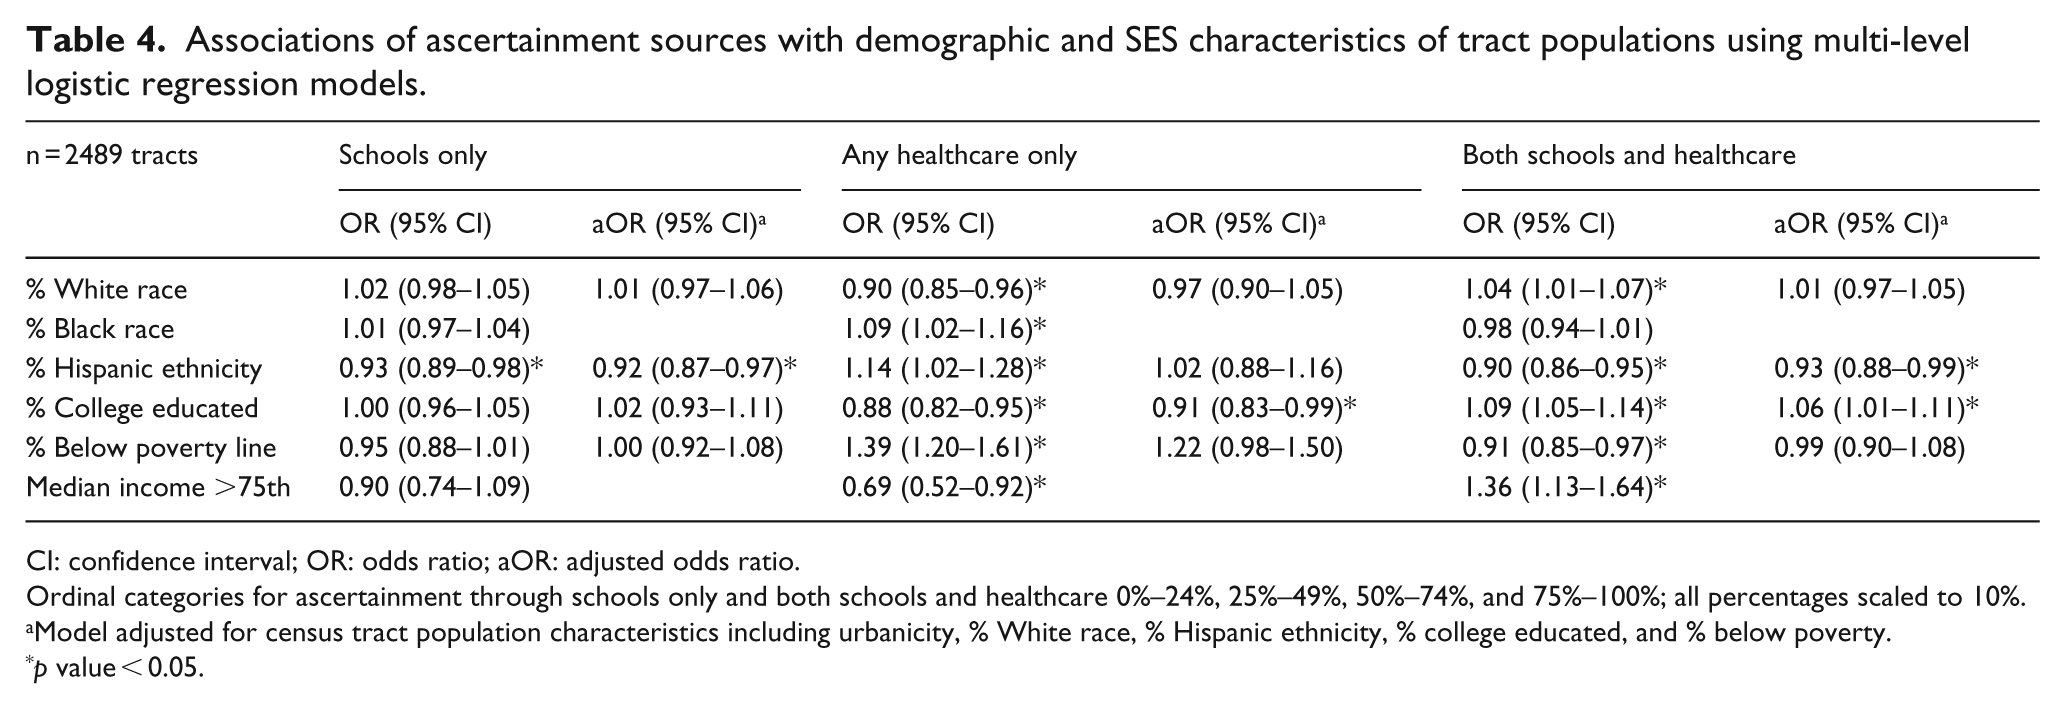
CI: confidence interval; OR: odds ratio; aOR: adjusted odds ratio.
Ordinal categories for ascertainment through schools only and both schools and healthcare 0%–24%, 25%–49%, 50%–74%, and 75%–100%; all percentages scaled to 10%.
Model adjusted for census tract population characteristics including urbanicity, % White race, % Hispanic ethnicity, % college educated, and % below poverty.
p value < 0.05.
Discussion
Our initial analysis demonstrated higher ASD prevalence in tracts with a greater percentage of cases with both school and healthcare records (PR = 1.10), which is consistent with the reported prevalence seen in the 2008 ADDM report for site with access to both school and healthcare records (ADDM Network Surveillance Year 2008 Principal Investigators, 2012). Results from our examination of demographic and SES factors of census tract populations from which cases were drawn showed that optimal ascertainment, access to both school and healthcare records, was significantly lower for tracts with a greater percentage of Hispanic residents and more residents living below the poverty line. After adjustment for other covariates, statistical significance remained for the negative association between optimal ascertainment and percentage of Hispanic tract residents and the positive association for percentage of census tract residents with at least a bachelor’s degree, suggesting health disparities in ASD diagnosis and subsequent prevalence estimates.
Differences in race
When considering results of our analysis of race distributions of ASD cases in our study, our findings support those from prior literature that reported ASD prevalence is higher in Whites compared to non-Whites (Durkin et al., 2010; Windham et al., 2011; ADDM Network Surveillance Year 2008 Principal Investigators, 2012; ADDM Network Surveillance Year 2010 Principal Investigators, 2014). However, our results also showed prevalence was not lower in tracts with a greater percentage of Black residents, which supports the results of another study using data from the Metro Atlanta Developmental Disabilities Surveillance Program (MADDSP), a surveillance study of a five-county metropolitan area in Georgia, that reported higher prevalence of ASD in Blacks living in these areas (Bhasin and Schendel, 2007). Disparities observed in other studies may be due to the influence of various other factors. One possibility to consider is the potential for decreased ascertainment of ASD in these children, which was also demonstrated in the positive associations seen between Black race of ASD cases and presence of records from schools only, although our results were less than significant. Although in multivariable analysis, we observed no statistically significant association between proportion of Black cases obtained through schools only, in contrast to prior reports that have shown that Black children were more likely to be identified through schools only than through both schools and healthcare sources (Bhasin and Schendel, 2007; Yeargin-Allsopp et al., 2003) or through provision of state-funded services (Windham et al., 2011). However, similar to our observations, Bhasin and Schendel (2007) also reported no significant risk of under-ascertainment through health source only for Blacks. Considering that the federal government requires that school systems provide educational services to children with ASD at no charge in accordance with IDEA (1997), schools serve as a major source of ASD identification for low-income children, many of whom are not recognized until enrollment in school (Palmer et al., 2005).
Regarding the potential influence of area-based racial distribution of tracts from which cases are drawn, another possible reason that lower ASD prevalence may be seen in areas with a greater percentage of Black residents in other studies could be access to care. Our results demonstrated that there was no statistical association between proportion of Black cases or Black residents and risk of under-ascertainment through healthcare sources only, which is in agreement with MADDSP results that also showed no significant association between Black race and healthcare only ascertainment (Bhasin and Schendel, 2007). On the other hand, a study from the National Survey of Children’s Health reported that Black children with ASD had less access to specialists (Liptak et al., 2008), which would reduce the probability of identification through healthcare sources. Other studies have demonstrated that Black children are also often diagnosed later than White children (Fountain et al., 2011; Mandell et al., 2002). Additionally, research has shown that Black children identified through ASD surveillance were more likely to have prior documentation of intellectual disability (ID) than ASD (Mandell et al., 2009). These differences in diagnosis times and classifications have contributed to ethnic differences in perceptions of abnormal behavior and subsequent recognition of ASD symptomatology (Tek and Landa, 2012).
Hispanic ethnicity
Our results indicated that ascertainment through school sources only or through the optimal ascertainment, both school and healthcare sources, decreased with proportion of Hispanic residents in tracts from which cases were drawn. This result coincides with those of a study in Texas school systems that reported that schools with more Hispanic students reported lower ASD prevalence in school systems (Palmer et al., 2005). Furthermore, Mandell et al. (2009) reported that surveillance data of Hispanic children with ASD were more likely to come from areas with access to school records, which has also been shown to be an important source of identification for low-income children (Palmer et al., 2005). In our study, prevalence was noticeably lower in areas with a greater Hispanic population (PR = 0.86). These differences seen in identification of Hispanics with ASD may contribute to the lower prevalence in Hispanics previously reported in other studies (Rosenberg et al., 2009; Windham et al., 2011). Specifically, Windham et al. (2011) reported that prevalence was lowest for Hispanics in the San Francisco Bay area, where Hispanics make up over 20% of the population according to the 2010 census. Additionally, a study in Philadelphia, a study in California, and another study in Wisconsin showed that Hispanics were also diagnosed at later ages than non-Hispanics (Fountain et al., 2011; Mandell et al., 2002; Magana, 2013). Some have suggested that lower rates of ASD seen in Hispanics may be due to language barriers (Zaroff and Uhm, 2012). Contrary to our results, others have shown that Hispanics have less access to healthcare (Liptak et al., 2008). Maternal education, which has been established as an important factor in diagnosis of children with ASD, was also reported to be lower in Hispanics (Mandell et al., 2009; Magana, 2013). These combined factors of language barriers, access to services, and maternal education may have contributed to a recently published report demonstrating that less than half of Hispanic children initially screened for ASD returned for follow-up visits to confirm diagnosis (Windham et al., 2014). Thus, deciphering what factors determine why ASD reporting in Hispanics is lower may require further investigation, and creating programs to target this population may be challenging.
Parental education
In terms of relationships between parental education and ASD diagnosis, our results echo prior reports. Our analysis showed that not only was the proportion of cases with college-educated mothers statistically lower in areas with more cases identified in schools only, but the proportion of college-educated mothers was higher in areas with more children obtained through both school and healthcare sources, the most favorable ascertainment outcome. This suggests that parents with more education may be more able to navigate care systems in order to secure services for their children (Windham et al., 2009). Several other studies have published results indicating that reported ASD prevalence is higher in children with more educated mothers (Liptak et al., 2008; Mandell et al., 2009). Additionally, studies have demonstrated that children with more educated parents received earlier ASD diagnosis (Bickel et al., 2015; Fountain et al., 2011). Bhasin et al. (2007) reported significantly higher maternal college education in children with ASD with no ID, but maternal education was not associated with identification through schools only (Bhasin and Schendel, 2007). On the other hand, another study of children in the Atlanta metropolitan area reported that mothers with less than 12 years of education were more likely to have children identified as having ASD through schools only (Yeargin-Allsopp et al., 2003), which is in accordance with our results. Our study also showed that areas with more educated residents in the population from which cases were drawn had a greater percentage of ASD cases identified through both school and healthcare sources, which also agrees with the results of a study using data from 12 ADDM sites in 2002 and 2004 showing more children with ASD in census blocks with higher-educated residents (Durkin et al., 2010).
Access to care
Our analysis showed that proportion of tract residents living below the poverty line was negatively associated with ASD ascertainment through both school and healthcare records (optimal ascertainment), suggesting that access to care in census tracts may also play a role in ASD prevalence estimates. We attempted to control for access to care by adjusting for urban geographic classification, which has previously been indicated as influencing administrative prevalence (Palmer et al., 2005) and access to care (Kalkbrenner et al., 2011). After this adjustment, neighborhood income, as measured by percent below the poverty line, was no longer related to optimal ascertainment. The positive association we observed between increased tract MHI and ASD prevalence is similar to that reported from MADDSP data indicating higher ASD prevalence in neighborhoods with higher MHI in metropolitan Atlanta and higher proportion of children with ASD ascertained through both school and non-school sources in tracts with higher MHI (Bhasin and Schendel, 2007). Fountain et al. (2010) also reported earlier diagnosis in children from neighborhoods with higher property values. These results support reports that children from low-income families have decreased access to ASD services (Kogan et al., 2008; Liptak et al., 2008). Notably, a study in California showed that areas with higher income also had a greater number of pediatricians and ASD diagnostic clinics (Mazumdar et al., 2013). Our results also indicated that ascertainment through healthcare records only was higher in areas with a greater percentage of tract residents living below poverty. This could, however, be attributed to provision of Medicaid in this population. The literature has shown that Medicaid is commonly used to fund services for children with ASD (Semansky et al., 2013; Shaw et al., 2013). A recent study showed that poverty-eligible Medicaid patients were diagnosed earlier than disability-eligible patients; however, the same study showed earlier diagnosis for children from counties with a greater MHI (Daniels and Mandell, 2013). Additionally, Mandell et al. (2002) also demonstrated that Black and Hispanic children receiving services through Medicaid were diagnosed later than White children. Therefore, factors associated with access to care may be more complex than a simple relationship with income. Data on private insurance of children in our study were not provided, but previous research has shown that a lack of health insurance is associated with reduced access to care (Kogan et al., 2008). However, deciphering how income directly or indirectly affects access to services and healthcare may be difficult.
Limitations
These study results are subject to several limitations. First, in order to prevent identification of cases from the ADDM study, aggregate data were provided for a total of five surveillance years (2000, 2002, 2004, 2006, and 2008). Because this is aggregate data, no assumptions can be made for characteristics of individual children. Additionally, population estimates used to account for prevalence were based on 2000 census data under the assumption of equal age distributions, and not the exact population of 8-year-old children for each surveillance year, as details on which years surveillance was conducted in census tracts were not provided. Thus, there may be a potential for measurement error. Data for other races, including Asian, Asian Pacific, Native American, Native Alaskan, and any race identified as other than Black or White was condensed into one group due to lower frequency of data; however, we recognize that language barriers and cultural differences may influence ASD ascertainment between these racial groups, and that further investigation of these groups is needed. Furthermore, data used for surveillance in the ADDM study were drawn from clinical and education sources; thus some information of symptomology of children may have been missing and could have led to misclassification and missing information on manifestation of symptoms that may have been useful in differentiation of racial and ethnic variances. We also acknowledge that education level of mothers of cases was missing for approximately 25% of ASD cases. Moreover, we had no information on availability of private insurance or provision of Medicaid, which may have influenced cost and provision of services for children and subsequently confounded the results. However, future analysis at the city and county level could utilize Area Resource File data as proxies for this information.
Conclusion
Even with the prior mentioned limitations, we believe our results have important public health implications. Using aggregate data from a multi-state surveillance study over five surveillance years, we identified demographic and socioeconomic factors associated with ASD prevalence estimates including race, ethnicity, education, and income. Specifically, children of Hispanic ethnicity do not experience optimal ascertainment through both school and healthcare sources as often as children of other ethnicities. Furthermore, maternal education and median income of neighborhoods increase the likelihood of case ascertainment through both sources. Determining which specific factors influence disparities is complicated; however, it appears that even in the presence of education, racial disparities are still apparent. Future research should further evaluate whether these patterns are still apparent after adjustment for private insurance. Furthermore, development of interventions for diagnosis of ASD should focus on targeting populations at greater risk of going unnoticed.
Footnotes
Acknowledgements
The authors acknowledge the assistance of the National Center of Birth Defects and Developmental Disabilities of the CDC, particularly that of Jon Baio and Lin Hui Tian for their guidance and support in these obtaining data.
Funding
The authors also acknowledge the support provided by the Biostatistics/Epidemiology/Research Design (BERD) component of the Center for Clinical and Translational Sciences (CCTS) for this project funded by the NIH Centers for Translational Science Award (NIH CTSA) grant (UL1 RR024148) awarded to University of Texas Health Science Center at Houston in 2006 by the National Center for Research Resources (NCRR) and its renewal (UL1 TR000371) by the National Center for Advancing Translational Sciences (NCATS). The content is solely the responsibility of the authors and does not necessarily represent the official views of the NCRR, NCATS, or the CDC.