
Abstract
It has been recently theorized that atypical sensory processing in autism relates to difficulties in social communication. Through a series of tasks concurrently assessing multisensory temporal processes, multisensory integration and speech perception in 76 children with and without autism, we provide the first behavioral evidence of such a link. Temporal processing abilities in children with autism contributed to impairments in speech perception. This relationship was significantly mediated by their abilities to integrate social information across auditory and visual modalities. These data describe the cascading impact of sensory abilities in autism, whereby temporal processing impacts multisensory information of social information, which, in turn, contributes to deficits in speech perception. These relationships were found to be specific to autism, specific to multisensory but not unisensory integration, and specific to the processing of social information.
Keywords
Introduction
The inclusion of atypical sensory processing in the diagnostic criteria for autism spectrum disorder (ASD) reflects growing evidence that sensory difficulties are some of the most ubiquitous symptoms of the disorder, impacting upward of 87% of autistic individuals 1 (Le Couteur et al., 1989; Lord, 1995). Although the vast majority of this evidence comes from subjective reports (Baranek et al., 2006; Dawson and Watling, 2000; Kasari and Sigman, 1997; Kern et al., 2007; Kientz and Dunn, 1997; O’Neill and Jones, 1997; Rogers et al., 2003; Talay-Ongan and Wood, 2000; Watling et al., 2001; Wing and Potter, 2002), emerging recent empirical evidence supports the notion of atypical sensory processing in autism across all sensory modalities (for review, see Baum et al., 2015a). Most germane to this report, sensory disturbances have been empirically shown across vision and audition (Baum et al., 2015a, 2015b; Bebko et al., 2014; De Boer-Schellekens et al., 2013; Iarocci et al., 2010; Kwakye et al., 2011; Stevenson et al., 2014b, 2014c, 2014d, 2014e, 2015b; Woynaroski et al., 2013). How atypical sensory processing fits within the broader behavioral profile of the disorder, however, has yet to be established. The ability to process sensory information from the external world is a foundational building block on which many, if not most, cognitive operations are based. As such, altered sensory information processing may have cascading effects on cognitive functions and clinical symptomatology (Baum et al., 2015a; Bebko et al., 2006; Stevenson et al., 2014; Wallace and Stevenson, 2014). Indeed, there is evidence for this idea from several studies that used subjective measures, such as self-report or parent questionnaires. For example, atypical sensory processing in autism has been linked to a number of clinical issues, including anxiety and repetitive behaviors (Glod et al., 2015; Lidstone et al., 2014). Little work, however, has tested such hypotheses with objective behavioral data.
One aspect of sensory processing that has garnered much attention in autism is temporal perception, specifically temporal perception across sensory modalities. Autistic individuals have consistently been found to have less precise multisensory temporal perception of social stimuli (for reviews, see Stevenson et al., 2015b; Wallace and Stevenson, 2014). Changes in temporal perception may influence social communication in autism (Stevenson et al., 2014b). Specifically, multisensory temporal perception may affect an individual’s ability to integrate auditory and visual speech information, subsequently impacting speech perception.
The link between temporal perception and the ability to integrate auditory and visual sensory information is based on a wealth of research across all levels of analyses, from single cell recordings (Meredith and Stein, 1986; Meredith et al., 1987, 1992; Royal et al., 2009), to electrophysiology (Schall et al., 2009; Senkowski et al., 2007), to blood-oxygen-level dependent (BOLD) responses as measured by functional magnetic resonance imaging (fMRI; Macaluso et al., 2004; Miller and D’Esposito, 2005; Stevenson et al., 2010, 2011), to human behavior (Conrey and Pisoni, 2006; Dixon and Spitz, 1980; Hillock et al., 2011; Keetels and Vroomen, 2005; Powers et al., 2009; Van Atteveldt et al., 2007; Van Wassenhove et al., 2007; Wallace et al., 2004; Zampini et al., 2005). In short, the more the temporally aligned two sensory signals are, the more likely they are to be integrated into a single, unified perceptual Gestalt. These two sensory signals need only to fall within a certain temporal distance from each other in order to be integrated into a single, unified percept—a construct referred to as the temporal binding window (TBW). The width of the TBW varies considerably between individuals (Stevenson et al., 2012b; Stevenson and Wallace, 2013). Importantly, this variability correlates with typically developing (TD) adults’ abilities to integrate auditory and visual speech information: the more precise an individual’s multisensory temporal perception (i.e. the narrower their TBW), the stronger his or her ability to integrate audiovisual sensory information (Stevenson et al., 2012b). Autistic children have been shown to exhibit less precise temporal perception than their TD peers (i.e. wider TBWs), particularly with social stimuli (De Boer-Schellekens et al., 2013; Kwakye et al., 2011; Stevenson et al., 2014c; Wallace and Stevenson, 2014; for reviews, see Stevenson et al., 2015b). To our knowledge, only one study has investigated the impact of temporal processing on sensory integration in autism (Stevenson et al., 2014c) 2 . Importantly, temporal precision was predictive of audiovisual integration of speech signals in autism. Interestingly, this relationship was seen not only between audiovisual integration and temporal precision with social stimuli but also for temporal precision of simple flash-beep stimuli.
Integrating sensory inputs across modalities provides behavioral benefits, most notably improvements in speech perception, particularly in noisy environments (Stevenson et al., 2012a, 2015a; Sumby and Pollack, 1954). Generally, in TD individuals, being able to see a speaker’s face while hearing what they are saying results in more accurate and less effortful speech perception, compared to when only auditory information is available (Fraser et al., 2010). In contrast, autistic children benefit less from receiving speech information from multiple sensory modalities than their TD peers (Foxe et al., 2013; Irwin et al., 2011; Smith and Bennetto, 2007; Stevenson et al., 2017). The decreased benefit for autistic children, particularly in noisy conditions (Foxe et al., 2013; Stevenson et al., 2017), directly impacts their ability to communicate with others, reflecting the diagnostic symptomatology. This reduction in behavioral benefit of perceiving speech through multiple modalities may be the result of disrupted integration. Mixed results have been reported in relation to autistic children’s perception of the McGurk effect, with many studies showing decreased integration (e.g. Bebko et al. 2014; De Gelder et al., 1991; Irwin et al., 2011; Mongillo et al., 2008; Stevenson et al., 2014c, 2014d; Williams et al., 2004) and others showing intact integration (Iarocci et al., 2010; Woynaroski et al., 2013). In the McGurk effect, an individual hears a speaker say “ba” and sees the speaker articulate “ga” but perceives the syllable “da” (McGurk and MacDonald, 1976). Given that “da” was contained in neither the auditory nor the visual sensory inputs, the perception of “da” is indicative of integration (Calvert and Thesen, 2004; Stevenson et al., 2014d). Autistic children, on average, perceive the integrated “da” percept less often than their peers.
In this study, we specifically tested the hypothesis that the decrease in multisensory temporal processing leads to reduced sensory integration and that, in turn, reduced sensory integration negatively impacts audiovisual speech perception in autism (Figure 1). Temporal processing was tested with a temporal order judgment (TOJ) task with flash-beep stimuli (Baum et al., 2015b; Stevenson and Wallace, 2013) and speech perception with a speech-in-noise task (Stevenson et al., 2015a). Four separate measures of sensory integration were tested, varying sensory modality (unisensory visual–visual or multisensory audiovisual integration) and socialness (social or non-social). These four sensory integration tasks thus included the McGurk task (audiovisual/social; McGurk and MacDonald, 1976), the sound-induced flash illusion (SIFI; audiovisual/non-social; Shams et al., 2000), a composite-face task (visual/social; Cheung et al., 2008; Young et al., 1987), and a composite-letter task (visual/non-social; Navon, 1977). Using this design allowed us to test whether the relationship between temporal perception and speech perception is mediated by integration that is specific to multisensory stimuli or specific to social stimuli.
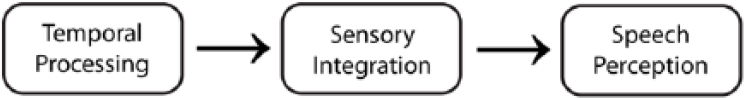
Hypothesized model.
Materials and methods
Participants
In total, 76 children aged between 7 and 16 years were assigned to groups based on autism diagnosis (ASD: n = 38, f = 6, mean age = 12.3 years, standard deviation (SD) = 3.1 years) and self-report indicating the absence of clinical or neurological disorder (TD: n = 38, f = 25, mean age = 11.1 years, SD = 2.7 years). Caregivers in the autism group provided official documentation of their child’s diagnosis from a licensed practitioner. Diagnosis was also verified through the administration of the Autism Diagnostic Observation Schedule (ADOS; Lord et al., 2012) by a research-reliable administrator. All participants’ cognitive abilities were estimated with a two-subtest Wechsler Abbreviated Scale of Intelligence-2 (WASI-II; Wechsler and Hsiao-pin, 2011), with the vocabulary subtest and the matrix reasoning subtest. Additionally, all participants’ caregivers completed the autism quotient (AQ; Baron-Cohen et al., 2001), a well-validated measure of autistic symptomatology, in order to ensure that TD participants were not at high risk of an ASD diagnosis.
General procedures
Participants completed six behavioral paradigms. One paradigm assessed audiovisual temporal processing via a TOJ task that allowed for the calculation of TBWs) and a second assessed speech perception via a speech-in-noise task. The remaining four tasks measured sensory integration with the hypothesis that sensory integration mediates the relationship between temporal perception and speech perception. These integration tasks varied sensory modality (visual/audiovisual) and socialness (social/non-social), allowing us to test whether this mediation effect is specific to multisensory stimuli or specific to social stimuli. Details of each are given below.
Data from all tasks and measures were completed on the same day. The six behavioral tasks were presented in a counterbalanced order. The ADOS and two WASI subtests were interleaved as breaks between behavioral tasks, in counterbalanced orders across participants.
Experimental protocols were approved by the University of Toronto Ethics Board. All stimuli throughout the study were presented using MATLAB 2012b (MathWorks, Inc., Natick, MA) software with the Psychophysics Toolbox extensions (Brainard, 1997; Pelli, 1997). Audio stimuli were presented through noise-cancelling headphones. Participants were seated approximately 50 cm from the computer screen in a light- and sound-controlled room.
Measurement of temporal processing (temporal binding windows)
Participants were presented with white visual rings on a black background (visual angle = 17.3°, duration = 10 ms) paired with auditory pure-tone beeps (1000 Hz, duration = 13 ms) and were required to perform a TOJ task (“which came first?” Figure 2(a)). Stimulus pairs were presented with parametrically varied stimulus onset asynchronies (SOAs), ranging from −300 ms (auditory leading) to 400 ms (visual leading), and including offsets of ±300, ±200, ±100, ±50, and 0 ms. In total, 15 trials of each SOA were presented in a random order. Participants were asked to respond via button press as to whether the flash or the beep came first. Trials began with a fixation cross presented for 500 ms, plus an additional pause randomly jittered between 0 and 1000 ms. A response screen appeared 250 ms after stimulus offset, with the next trial beginning immediately following the participant’s response. The task took approximately 8–10 min in total.
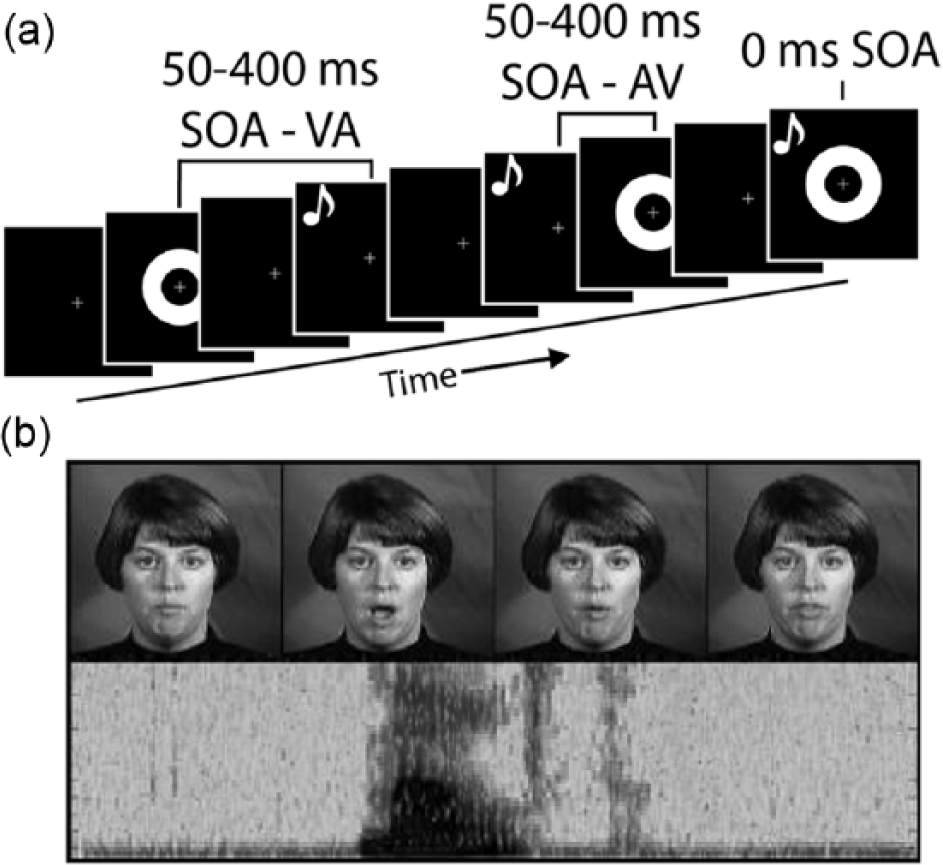
(a) The temporal order judgment (TOJ) task that was used to assess temporal processing. Participants were presented with flash-beep pairs with varying stimulus onset asynchronies and indicated which stimulus came first. (b) An example of the visual and auditory speech stimuli.
Responses from the TOJ task were used to calculate a TBW for each subject in four steps: (1) a response rate was calculated for each SOA using the percentage of trials in a given condition in which the participant reported that the visual stimulus was first; (2) a psychometric sigmoid function was fit to the response rates across all SOAs using the glmfit function in MATLAB; (3) individual left (auditory leading) and right (visual leading) TBWs were then, respectively, estimated as the SOA at which the best-fit sigmoids’ y-value equaled a 25% and 75% response rate; and (4) each participant’s left and right TBWs were then summed to produce their overall TBW. Finally, group TBWs were calculated by taking the arithmetic mean of the left, right, and whole TBWs from each participant.
In regard to temporal processing, studies have commonly reported less precise temporal processing in autism (including but not limited to wider TBWs) with social stimuli (Bebko et al., 2006; De Boer-Schellekens et al., 2013; Grossman et al., 2009, 2015; Patten et al., 2014; Stevenson et al., 2014c; Woynaroski et al., 2013), but results have been mixed with simple stimuli as used in the current paradigm (Collignon et al., 2013; De Boer-Schellekens et al., 2013; Foss-Feig et al., 2010; Kwakye et al., 2011; Stevens, 1946; Stevenson et al., 2014c). Importantly though, the widths of TBWs even with simple stimuli have been shown to relate to multisensory integration of social stimuli (Stevenson et al., 2014c).
Measurement of speech perception (speech in noise)
Participants completed a speech-in-noise task involving speech stimuli that consisted of audiovisual recordings of a female speaker saying 216 tri-phonemic nouns (Figure 2(b)). Stimuli were selected from a previously published stimulus set, The Hoosier Audiovisual Multi-talker Database (Sheffert et al., 1996). All stimuli were spoken by speaker F1. The stimuli selected were monosyllabic English words that were matched across sets for accuracy on both visual-only and audio-only recognition (Lachs and Hernandez, 1998) and were also matched across sets in lexical neighborhood density (Luce and Pisoni, 1998; Sheffert et al., 1996). This set of single-word tokens has been used successfully in previous studies of multisensory integration (Stevenson et al., 2007, 2009, 2010, 2011, 2012a, 2015a; Stevenson and James, 2009). Audio signal levels were measured as root mean square (RMS) contrast and equated across all tokens. Visual stimuli were 200 × 200 pixels and subtended 10° × 10° of visual angle. All tokens lasted 2 s and included all pre-articulatory gestures.
Stimuli were presented in three conditions: (1) audiovisual, (2) visual only, and (3) audio only. In the visual-only condition, the visual component of each stimulus, or viseme, was presented. Auditory stimuli were presented at 66 dB SPL and overlaid with eight-channel multitalker babble at 72 dB SPL. The presentation of auditory babble presentation began 500 ms prior to the beginning of the stimulus token and ended 500 ms following token offset. The RMS of the auditory babble was linearly ramped up and down, respectively, during the pre- and post-stimulus 500 ms periods, and was presented with the first and last frames of the visual token, respectively.
In each condition, participants were presented with 24 single-word presentations. Run orders were randomized across participants. Word lists were counterbalanced between participants and randomized across runs with no words repeated. Participants were instructed to attend to the speaker at all times and to report the word they perceived by typing it out on a keyboard. After each trial, the experimenter confirmed the participant’s report to correct for spelling errors and then presented the next word. No time limit was given for participant responses. Each run lasted approximately 5 min.
Responses were scored for accuracy by phoneme—given that each word was tri-phonemic, participants could score from 0 to 3 phonemes correct. Mean accuracy was calculated for (1) each participant and (2) each run. Speech perception has been an area where consistent findings of decreased ability have been found in autism (Foxe et al., 2013; Irwin et al., 2011; Smith and Bennetto, 2007; Stevenson et al. 2017), and as such, we predicted reduced recognition levels.
Measurements of sensory integration
Audiovisual integration of social stimuli: McGurk effect
Visual, auditory, congruent audiovisual, and “McGurk” stimuli were derived from digital video clips of a female speaker uttering the syllables “ga” and “ba” (Quinto et al., 2010). Syllable presentations were 2 s in duration, with each presentation comprising the entire production of the syllable, including pre-articulatory gestures (Figure 3(d)).
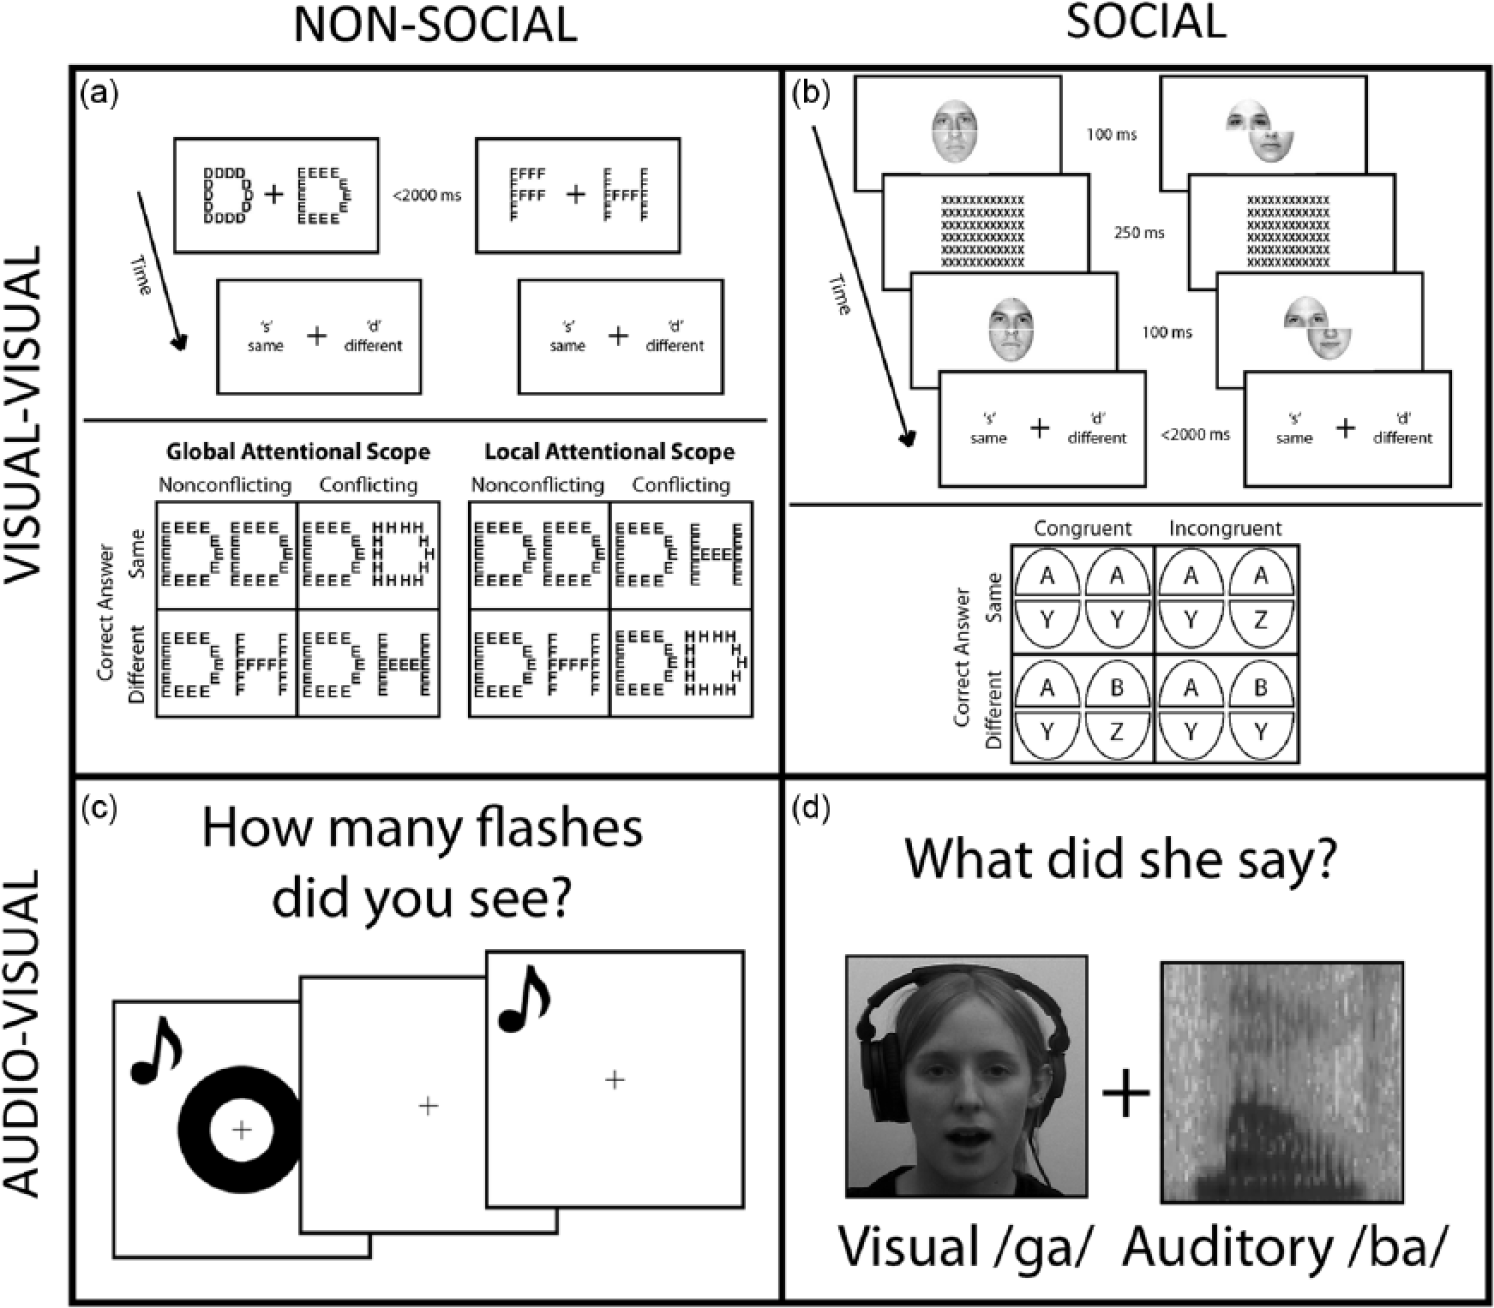
(a) The composite-letter task (CLE) that measures visual–visual integration of nonsocial information, (b) the composite-face task (CFE) that measures visual–visual integration of social information, (c) the sound-induced flash illusion (SIFI) that measures audiovisual integration of non-social information, and (d) the McGurk effect that measures audiovisual integration of social information.
The task began with an instruction screen prompting participants to indicate what syllable the speaker said by pressing the letter on a keyboard corresponding to the first letter of the syllable they perceived (i.e. “b” for “ba,” “g” for “ga,” “d” for “da,” and “t” for “tha”). For simplicity, we will refer to illusory perceptions (i.e. reports of “da” or “tha”) only as “da.” Trials began with a fixation screen for 500 ms plus a random jitter ranging from 1 to 1000 ms followed by a stimulus presentation, a 250-ms fixation screen, and then a response screen. Following the response, the next trial began immediately. Participants were presented with auditory only (with the fixation cross remaining on the screen), visual only, and congruent audiovisual versions of the “ba” and “ga” stimuli. Additionally, an incongruent audiovisual McGurk stimuli was presented: In this case, the visual “ga” was paired with the auditory “ba.” Thus, a total of seven stimulus conditions were presented, with 20 trials in each condition. The order of trial types was randomly generated for each participant for each experiment. Responses for each condition were recorded, with the percentage of “da” responses to the incongruent McGurk stimuli used as a measure of multisensory integration of social stimuli.
Audiovisual integration of non-social stimuli: SIFI
Stimuli for the SIFI were simple flashes and beeps, identical to those described in the TOJ task. In total, four conditions were presented: (1) 1-flash/1-beep, (2) 1-flash/2-beep, (3) 2-flash/1-beep, and (4) 2-flash/2-beep. When two stimuli were presented, onsets were always 50 ms apart. For both 1-flash/2-beep and 2-flash/1-beep conditions, the single presentation was always temporally aligned with the first presentation of the other modality. Participants were asked to report how many flashes they saw and to ignore the beeps. In total, 20 trials of each condition were presented in a randomized order. Mean numbers of perceived flashes were calculated for (1) each condition and (2) each participant. Importantly, the number of flashes perceived in the 1-flash/2-beep condition was recorded as a measure of multisensory integration with non-social stimuli (Figure 3(c)).
Visual–visual integration of social stimuli: composite-face task
Composite-face stimuli consisted of grayscale faces (Stevenson et al., 2016). A set of 288 unique composite faces (top/bottom pairs) were created from 96 original face images (48 male, 48 female). For each of these 288, there were an aligned version and a misaligned version (576 total images; Figure 3(b)). The face tops and bottoms were randomly paired, and the same pairings were used for every participant. Gender was always matched. When aligned, stimuli were 2 cm wide × 3 cm tall (1.91° × 2.86° visual angle). The top and bottom halves of the misaligned faces were offset by 1 cm, resulting in a stimulus 3 cm wide × 3 cm tall (2.86° × 2.86° visual angle). To avoid aftereffects, within trials, each first presentation of a composite-face stimulus was followed by a centrally presented mask. Masks were 4 cm wide and 3.5 cm tall (3.82° × 3.34° visual angle) and consisted of an array of Xs. Each individual “X” was 0.2 cm wide and 0.3 cm tall (0.19° × 0.29° visual angle).
Participants were told that they would see a pair of faces, each made up of a separate top and bottom half, one after another, and their job was to decide whether the top halves of each image in the pair were the same or different. Next, participants were shown an example of an image pair in which the top halves of the faces were different, but the bottom halves were the same. Participants were instructed that the correct answer, in this case, should be “different.” Participants were then shown a pair of misaligned faces and instructed that regardless of whether the faces were aligned, their task was to identify whether the top halves of the faces were the same or different. Following 8 practice trials, participants completed 24 trials in each of four conditions for a total of 96 trials: (1) aligned/congruent (AC), (2) aligned/incongruent (AI), (3) misaligned/congruent (MC), and (4) misaligned/incongruent (MI). Trial orders were randomized across conditions. Each trial sequence included (1) a 500-ms fixation cross, (2) the 200-ms presentation of the study face, (3) a 200-ms inter stimulus interval, (4) the 100-ms mask, (5) a 200-ms inter stimulus interval, and (6) and the second test face. The second test face always remained present until the participant responded.
Mean response times were calculated for each condition, and the composite-face effect (CFE) was calculated as
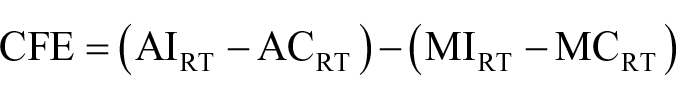
Thus, the larger the CFE, the more a participant integrated the visual features of the bottom and top half of a face image and, thus, the greater integration of visual social stimuli.
Visual–visual integration of non-social stimuli: composite-letter task
Stimuli consisted of black composite letters (Navon, 1977) on a white background, presented to the left and right sides of a central fixation cross (Figure 3(a)). Each local letter element was 0.2 cm wide × 0.3 cm high (0.19° × 0.28°). Each global letter was 1.0 cm wide × 1.5 cm high (0.96° × 1.43°). The center of each letter was 4.5 cm to the left and right of fixation. The letters were presented in black Helvetica bold font and consisted of “S” and “H” in all possibilities of their local and global combinations, making four distinct composite-letter stimuli.
Participants were provided with an example of a pair of composite letters (the letter “H” composed of local “S” elements on either side of fixation). Participants were asked to respond as to whether the two letters were the same or different, with their focus on either the big (“same”) or small (“different”) letters. Following 8 practice trials, participants completed 48 trials in each of four conditions for a total of 192 trials: (1) global/congruent (GC), (2) global/incongruent (GI), (3) local/congruent (LC), and (4) local/incongruent (LI). Trials were blocked based on task (i.e. global or local), with block order counterbalanced between participants, and eight practice trials given before each block. Trial orders within blocks were randomized. Trials each included (1) a 500-ms fixation cross; (2) the pair of composite letters presented until participant response; and (3) a 500-ms inter trial interval, after which the next trial began.
Mean response times were calculated for each condition, and the composite-letter effect (CLE) was calculated as
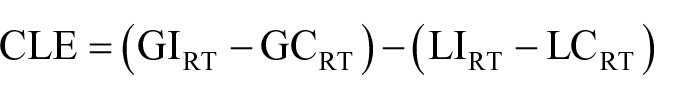
Thus, the larger the CLE, the more a participant defaults toward global perception and, thus, the greater integration of visual non-social stimuli.
Predictions
Within our sensory integration paradigms, previous results have been mixed with all sensory integration paradigms currently employed. This includes paradigms with audiovisual integration of social stimuli (McGurk effect; Bebko et al. 2013; De Gelder et al., 1991; Iarocci et al., 2010; Irwin et al., 2011; Mongillo et al., 2008; Stevenson et al., 2014c, 2014; Williams et al., 2004; Woynaroski et al., 2013), audiovisual integration of non-social stimuli (SIFI; Foss-Feig et al., 2010; Keane et al., 2010; Stevenson et al., 2014; Van der Smagt et al., 2007), visual–visual integration of social stimuli (CFE; Gauthier et al., 2009; Nishimura et al. 2008; Teunisse and De Gelder 2003), and visual–visual integration of non-social stimuli (CLE; Mottron et al., 2003, 2006; Plaisted et al., 1999). Although results from previous research are equivocal on each individual paradigm, here we expected to see significant relationships between sensory integration and both temporal processing and speech perception, with wider TBWs associated with weaker sensory integration (Stevenson et al., 2014c) and weaker sensory integration related to decreases in speech perception (Stevenson et al., 2014b).
Data analysis and predictions
Analyses were conducted for each individual experiment as described above; however, our primary focus here will be on the relationship of behavioral results between experiments—that is, how temporal processing (TBWs) influences sensory integration and how sensory integration influences speech perception in autism. This was assessed through a three-step process. First, correlations between TBWs and each measure of sensory integration were calculated in both groups. Concurrently, each measure of sensory integration was correlated with speech perception (speech-in-noise results). These correlations were used to identify directional pathways from temporal processing → sensory integration → speech perception. The second and third steps were used to assess possible mediation effects within these relationships. As such, these analyses were conducted when a significant relationship was found between a TBW and a given measure of sensory integration, and a significant relationship was found between that measure of sensory integration and the speech-in-noise measure. Failure to meet these criteria obviates the need for further analysis, as a mediation effect is not possible without such conditions. The second step in this process was a hierarchical regression predicting speech-in-noise scores, with the first model including TBWs, and second model containing measures of sensory integration. This tests for partial mediations, where TBWs are significant predictors in Model 1 but not in Model 2, where sensory integration is included. In the third and final steps, full mediations were tested for using a mediation bootstrap procedure with 5000 resamples to measure direct and indirect pathways.
We expected temporal processing to be correlated with measures of sensory integration and with measurements of speech perception. Specifically, we expected sensory integration to mediate the relationship between temporal processing and speech perception. We expected this relationship to prove stronger for multisensory integration than visual–visual integration and stronger for social stimuli than for non-social stimuli.
Results
Participants
Participants were matched for age and matrix reasoning scores (see Table 1 for detailed descriptive statistics). As is typical with autism, autistic participants on average showed lower vocabulary scores than their TD peers (p < 0.001, t(74) = 3.81, d = 0.89), were predominantly male (p < 0.001, Fischer’s exact test), and scored higher on the AQ (p = 7.02e−21, t = 16.92, d = 2.79), reflecting their autism symptomatology and ensuring that the TD sample was not at high risk of ASD.
Participant demographics.
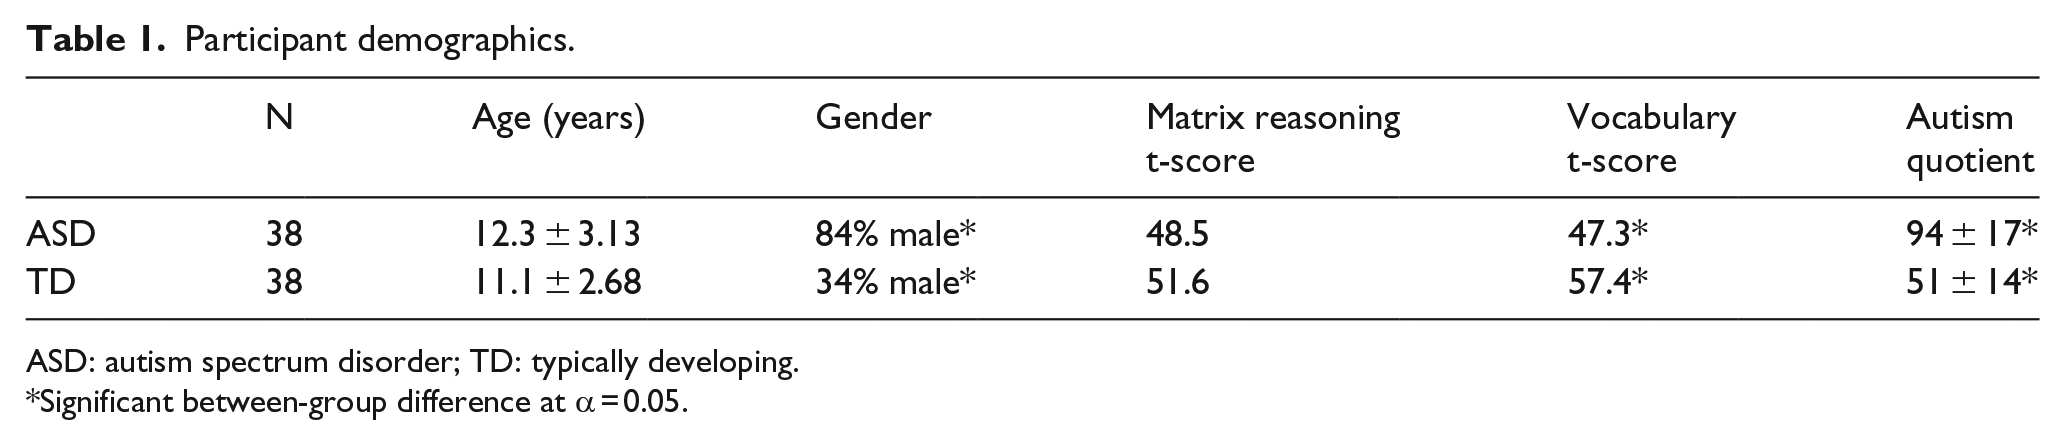
ASD: autism spectrum disorder; TD: typically developing.
Significant between-group difference at α = 0.05.
Temporal processing
Participants’ TBWs were calculated as described in the “Materials and methods” section and compared across groups. Autistic participants exhibited a TBW of 307 ms on average (SD = 176 ms), with TD participants averaging 317 ms (SD = 189 ms). Consistent with previous reports, TBWs as measured with simple flash and beep stimuli did not statistically differ between diagnostic groups (p = 0.80, t(74) = 0.26, d = 0.06).
Speech perception
Speech perception was measured for each participant as the percentage of accurately perceived phonemes. A 3 × 2 repeated measures analysis of variance (ANOVA) was conducted with modality as a within-subject factor (audiovisual, auditory, and visual), and diagnosis (TD and ASD) as a between-subject factor. The main effect of diagnosis was observed, with autistic participants showing lower scores on phoneme perception collapsed across modalities (p = 0.008, F(1, 74) = 7.47, partial-η2 = 0.09). A main effect of modality was also observed, with accuracy highest for audiovisual speech and lowest for visual speech (p < 0.001, F(1, 74) = 480.08, partial η2 = 0.87). No interaction between diagnosis and modality was observed (p = 0.20, F(1, 74) = 1.61, partial η2 = 0.02). As such, subsequent analyses using speech in noise will use the average score collapsed across modalities.
Acknowledging the lack of a two-way interaction, an exploratory analysis of differences between diagnostic groups within modalities was conducted using two-sided Student’s t-tests. Autistic participants showed significantly lower speech perception abilities than their TD peers in the audiovisual (p = 0.002, t(74) = 3.16, d = 0.73) and visual (p = 0.036, t(74) = 2.14, d = 0.50) conditions but not in the auditory condition (p = 0.29, t(74) = 1.06, d = 0.25).
Sensory integration
Audiovisual integration of social stimuli: McGurk effect
Audiovisual integration of social stimuli was measured using the McGurk effect. Perceptions of “da” in the McGurk effect were compared across diagnostic groups. Autistic participants perceived the illusion 47% of the time, whereas TD participants perceived the illusion 50% of the time, a non-significant difference (p = 0.64, t(74) = 0.46, d = 0.11).
Audiovisual integration of non-social stimuli: SIFI
Audiovisual integration of non-social stimuli was measured using the SIFI. Rates of illusory perception of a second flash in the 1-flash/2-beep condition were compared across diagnostic groups, with autistic participants perceiving the illusion in 19% of trials and TD participants on 20% of trials, a non-significant difference (p = 0.82, t(74) = 0.23, d = 0.05).
Visual–visual integration of social stimuli: composite-face task
Visual–visual integration of social stimuli was measured using the CFE. Autistic participants showed a CFE of 20 ms; that is, they were, on average, 20 ms faster in the aligned conditions to correctly respond same/different for the top half of the face when the bottom of the face was congruent than when it was incongruent, accounting for the same comparison when faces were misaligned. TD participants also showed the effect, with an average of 18 ms and did not statistically differ from the autism group (p = 0.98, t(74) = 0.03, d = 0.01).
Visual–visual integration of non-social stimuli: composite-letter task
Visual–visual integration of non-social stimuli was measured using the CLE. Autistic participants showed a CLE of 40 ms, whereas TD participants averaged 25 ms. A comparison between groups revealed no significant difference (p = 0.68, t(74) = 0.41, d = 0.10).
Relationships between timing, integration, and speech perception
The primary focus of this study was to explore the relationship between temporal processing, sensory integration, and speech perception. The first stage involved running simple exploratory correlations between participants’ temporal processing as measured by the TBW and the four metrics of sensory integration, followed by correlations between each metric of sensory integration and speech perception abilities as measured in the speech-in-noise task (Figure 4).
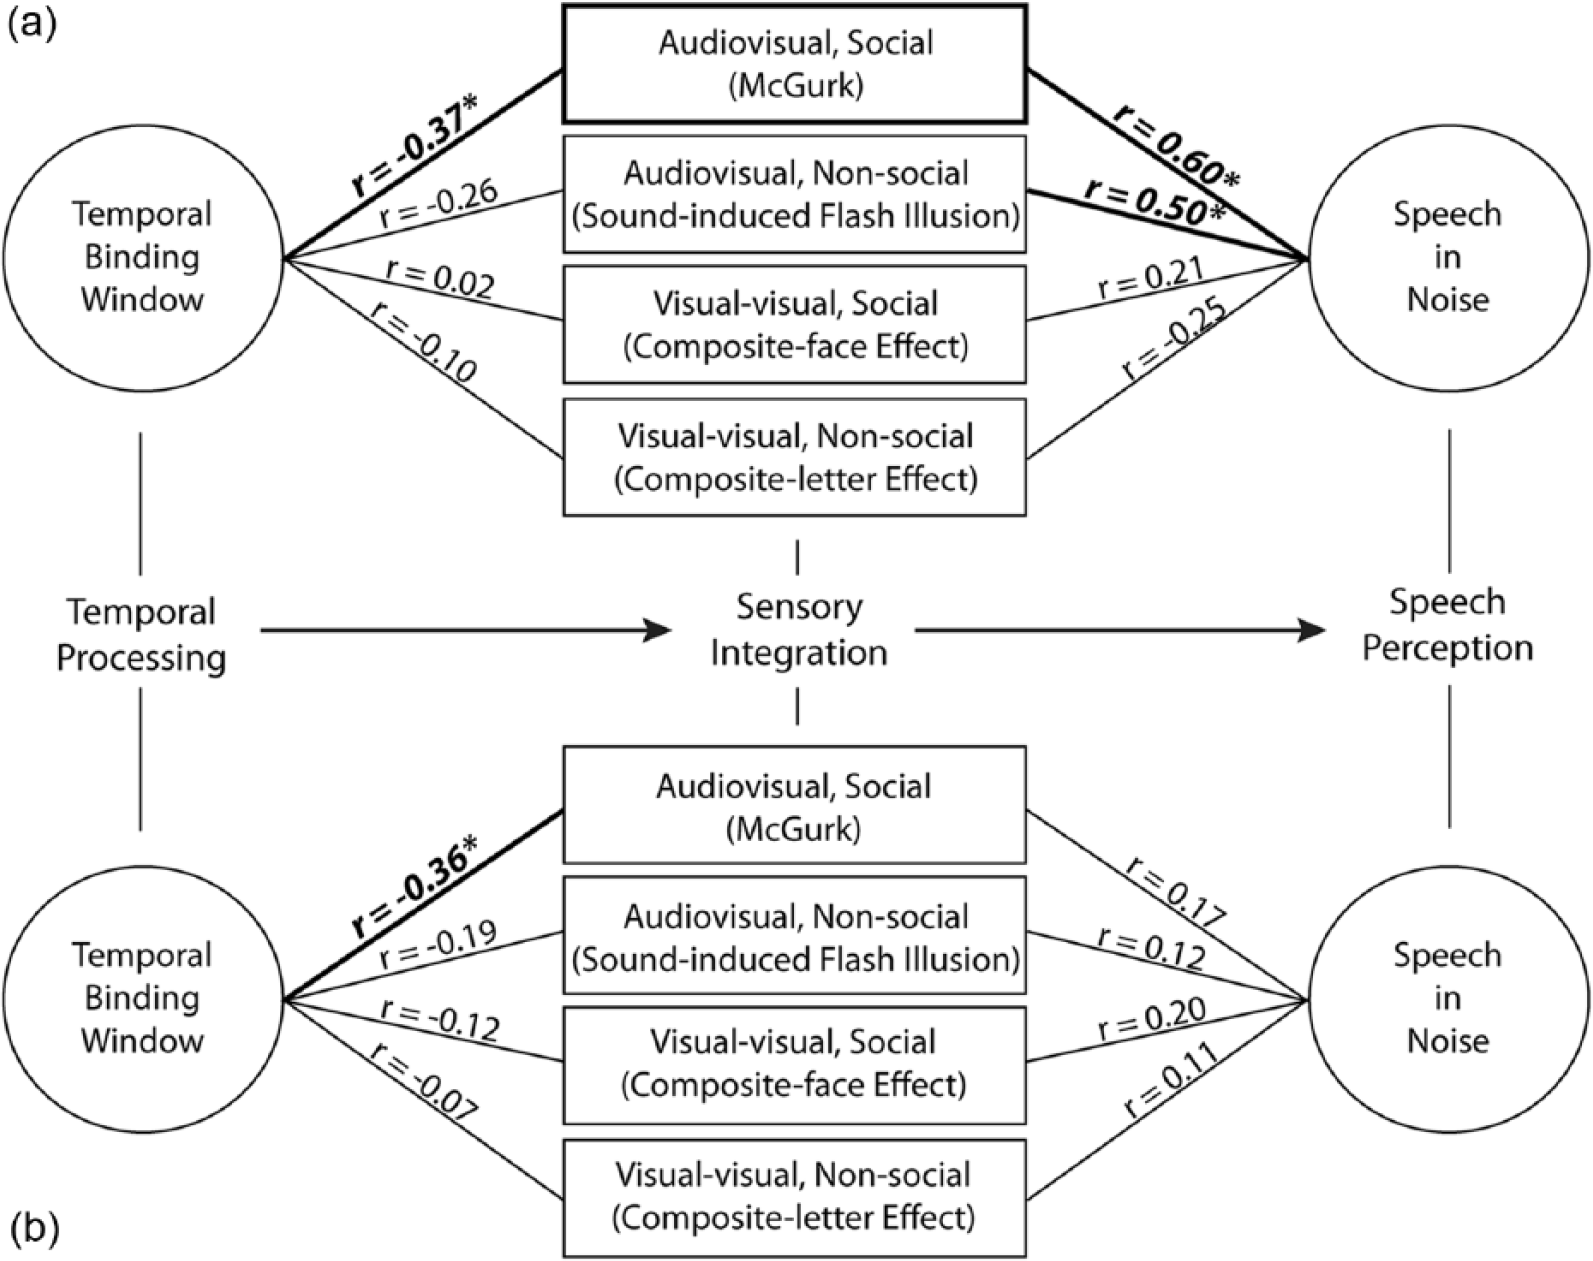
Correlational relationships between temporal processing (temporal binding windows), sensory integration, and speech perception (speech in noise). A significant pathway was identified in autism only, from temporal processing through multisensory integration of social stimuli to speech perception: (a) autism spectrum disorder and (b) typical development.
In the autism group, TBWs were significantly negatively correlated with audiovisual integration of social stimuli (McGurk; p = 0.021). That is, narrower TBWs indicating more precise temporal perception were associated with greater integration of audiovisual social information. No relationship was observed between TBWs and the integration of audiovisual non-social stimuli (SIFI; p = 0.12), visual–visual social stimuli (CFE; p = 0.93), or visual–visual non-social stimuli (CLE; p = 0.56). Results from the speech-in-noise task correlated with sensory integration for both audiovisual social stimuli (McGurk; p < 0.001) and non-social stimuli (SIFI; p = 0.002) but not sensory integration of visual–visual social stimuli (CFE; p = 0.19) and non-social stimuli (CLE; p = 0.13). Thus, there was a significant correlational pathway between temporal processing, through sensory integration of audiovisual social stimuli, to speech perception in the autism group. For r-values, see Figure 4.
In the TD group, the width of participants’ TBW was significantly negatively correlated with their ability to integrate audiovisual social stimuli (McGurk; p = 0.03), as was seen in the autism group. The TBW was not otherwise correlated with measures of integration, including integration of audiovisual, non-social stimuli (SIFI; p = 0.24), visual–visual social stimuli (CFE; p = 0.49), or visual–visual non-social stimuli (CLE; p = 0.66). No measures of integration in the TD group were significantly correlated with results from the speech-in-noise task, including integration of audiovisual social stimuli (McGurk; p = 0.30), audiovisual non-social stimuli (SIFI; p = 0.49), visual–visual social stimuli (CFE; p = 0.21), or visual–visual non-social stimuli (CLE; p = 0.50). Thus, there was no significant correlational pathway between temporal processing, through sensory integration, to speech perception in the TD group—while temporal processing was correlated with the audiovisual integration of social stimuli as assessed by the McGurk effect, this integration was not, in turn, correlated with speech perception as assessed by the speech-in-noise test. For r-values, see Figure 4.
The second stage of analyzing the relationship between temporal processing, sensory integration, and speech perception, was to conduct mediation analyses on all directional pathways showing significant correlations between measures. Based on the correlational responses reported above, the only pathway in which both the relationships from temporal processing (TBWs) to sensory integration and from sensory integration to speech perception were significantly correlated was in the autism group, specifically with audiovisual integration of social stimuli (McGurk effect), and thus, this pathway (i.e. TBW → McGurk → speech in noise) was the focus of our analysis here. It should be explicitly noted here that the lack of a significant correlation between the McGurk and speech-in-noise measure in the TD group precludes the possibility of there being a mediation effect in the TD data. However, to be conservative in our ability to identify a group difference here, the correlations between the McGurk effect and speech-in-noise task were compared across groups (rASD = 0.60, rTD = 0.17), which showed that the correlation in the autism group was significantly greater than that observed in the TD group (p = 0.029, z = 2.18).
Thus, a hierarchical regression predicting speech-in-noise scores in the autistic group was performed, with the TBW as a predictor in Model 1, and the McGurk effect scores added in Model 2. In Model 1, the TBW was significantly predictive of speech-in-noise scores (p = 0.028, t = 2.29). In Model 2, the McGurk effect was significantly predictive of speech-in-noise scores (p = 0.002, t = 3.72), but the TBW had dropped out as a significant predictor (p = 0.289, t = 1.08). This suggests that audiovisual integration of social information (measured with the McGurk effect) mediated the relationship between temporal processing (TBWs) and speech perception (speech in noise). For detailed statistics, see Table 2.
Hierarchical regression predicting speech perception.
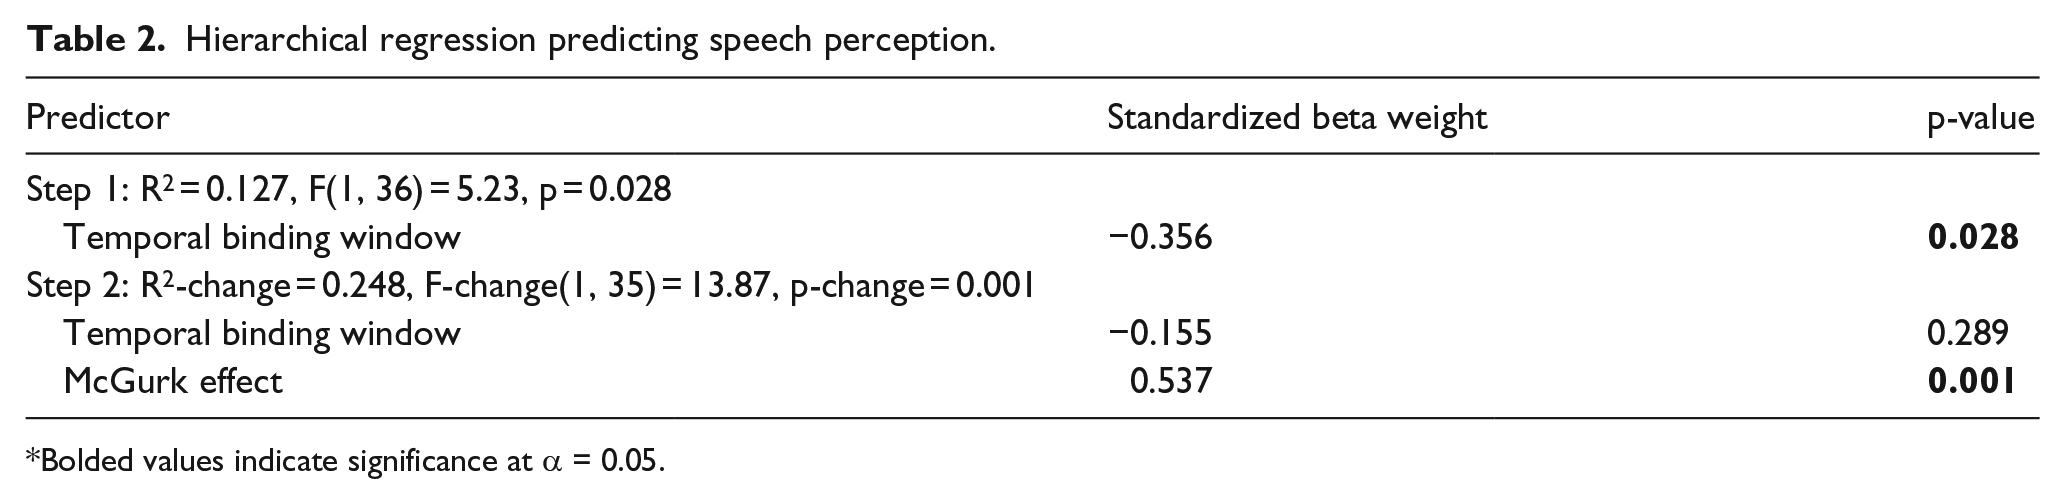
*Bolded values indicate significance at α = 0.05.
The likely mediation in the autism group was then tested using a mediation bootstrap procedure with 5000 resamples (Figure 5; Preacher and Hayes, 2004). All predictor variables were centered around their mean. As observed in the hierarchical regression, TBWs were directly predictive of speech-in-noise measures (c = −0.18, standard error (SE) = 0.07, 95% confidence interval (CI) = −0.32 to −0.04, p < 0.01), with multisensory integration (measured with the McGurk effect) contributing 57% of the variance in the model. The mediation analysis further revealed a significant indirect pathway from temporal processing (TBWs) to speech perception through multisensory integration (ab = −0.11, SE = 0.05, 95% CI = −0.23 to −0.02, p < 0.01). The direct path accounting for the contribution of temporal processing to speech perception, independent of multisensory integration, was not significant (c′ = −0.08, SE = 0.06, 95% CI = −0.20 to 0.04, p = 0.18). Two additional models were run testing alternative directional pathways, neither of which revealed significant mediations: multisensory integration → temporal processing → speech perception (ab = 0.01, SE = 0.02, 95% CI = −0.01 to 0.05, p = 0.19), and multisensory integration → speech perception → temporal processing (ab = −0.06, SE = 0.05, 95% CI = −0.18 to 0.03, p = 0.19).
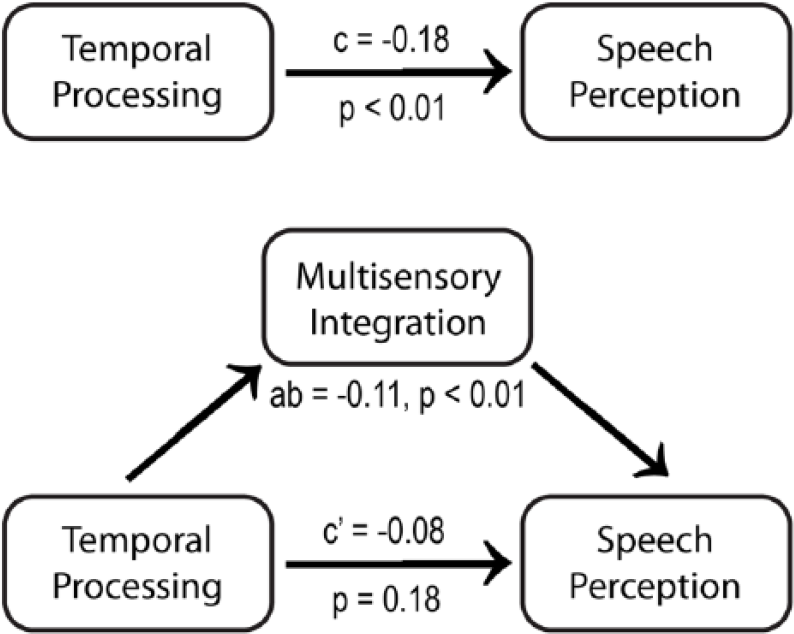
In autism, temporal processing, as measured by temporal binding windows, was significantly predictive of speech perception as measured with a speech-in-noise task. This relationship was fully mediated by multisensory integration of audiovisual social information, as measured by the McGurk effect.
In sum, within the autism group, temporal processing as measured by TBWs was significantly predictive of multisensory integration of social information. In turn, multisensory integration of social information was significantly predictive of speech perception abilities as measured through the perception of speech in noise. Multisensory integration appeared to play a mediating role, linking temporal processing and speech perception in the autism group.
Discussion
It has previously been postulated that atypical temporal processing and sensory integration in autism may have cascading effects that impact autism symptomatology. The findings reported here provide novel evidence that temporal processing in autism impacts multisensory integration, which subsequently impacts speech perception. Furthermore, this relationship is distinctly seen in autistic children but not in their TD peers. These findings are, to our knowledge, the first behavioral evidence of a directional pathway in which sensory perception abilities in autistic children cascade to deficits in high-level functioning that directly relates to autism symptomatology: impairments in social perception and communication.
Temporal processing is a known predictor of the ability to integrate sensory information across modalities in the general population; the temporal coincidence of auditory and visual sensory inputs is a salient cue to bind, and thus, sensory inputs that that occur within close temporal proximity are more likely to be integrated into a unified perceptual gestalt (Stevenson et al., 2012b). Integrating sensory inputs across modalities subsequently provides behavioral benefits, most notably improvements in speech perception, particularly in noisy environments (Sumby and Pollack, 1954). Autistic children have previously been shown to exhibit difficulties in each of these three stages of processing: temporal processing (Bebko et al., 2006; De Boer-Schellekens et al., 2013; Foss-Feig et al., 2010; Grossman et al., 2009, 2015; Irwin et al., 2011; Kwakye et al., 2011; Noel et al., 2017; Patten et al., 2014; Stevenson et al., 2014c; Woynaroski et al., 2013), multisensory integration (e.g. Bebko et al., 2013; De Gelder et al., 1991; Mongillo et al., 2008; Irwin et al., 2011; Stevenson et al., 2014c, 2014d, 2014e; Williams et al., 2004), and speech perception in noise (Foxe et al., 2013; Irwin et al., 2011; Smith and Bennetto, 2007). The relationships observed here suggest that these three processes are related in a directional manner, as other possible directional pathways (e.g. multisensory integration → temporal processing → speech perception) were found to be statistically non-significant. Thus, temporal processing abilities impact multisensory integration, which, in turn, cascades to impact speech perception in noise.
The impact of sensory modality
The relationship between temporal processing (TBWs) and sensory integration found in both TD and autistic children was confined to multisensory integration and did not extend to visual–visual integration. There are two possible explanations for this finding. First, temporal processing may influence audiovisual integration to a greater extent than it does visual–visual integration. This explanation is corroborated by previous studies demonstrating that multisensory integration issues in autistic children cannot be fully explained by changes in unisensory processing (Stevenson et al., 2014c; for review, see Baum et al., 2015a). Second, temporal processing was tested in an audiovisual paradigm where participants judged the relative timing between an auditory and a visual stimuli. Therefore, it may be that audiovisual temporal processing selectively influences audiovisual integration, leaving the possibility that visual-only temporal processing may impact visual–visual integration.
It is important to emphasize the pivotal mediating role that multisensory integration played. While temporal processing (TBWs) was significantly predicted speech perception directly (speech in noise), the relationship between the two is primarily explained through their mutual relationship with multisensory integration of social stimuli. That is, when multisensory integration is accounted for, the significant relationship between temporal processing and speech in noise disappeared. Furthermore, this mediation analysis was only significant with this particular directionality; only multisensory integration of social stimuli exhibited such a mediating effect.
The impact of socialness
In the autism group, multisensory integration of both social and non-social stimuli was strongly related to speech perception, suggesting that multisensory integration in general is linked to speech perception in autistic children. This effect was not observed in the TD group. Multisensory temporal processing (TBWs) was significantly related to the integration of audiovisual social stimuli for both TD and autistic children. This finding aligns with previous research: social stimuli have been consistently related to differences in multisensory integration in autism (Bebko et al., 2013; De Gelder et al. 1991; Iarocci et al., 2010; Irwin et al., 2011; Mongillo et al., 2008; Stevenson et al., 2014c, 2014d, 2014e; Williams et al., 2004; Woynaroski et al., 2013) where results have been more mixed with non-social stimuli (Bebko et al., 2006; De Boer-Schellekens et al., 2013; Foss-Feig et al., 2010; Keane et al., 2010; Stevenson et al., 2014c, 2014; Van der Smagt et al., 2007). The relationship between temporal processing (TBWs) and multisensory integration of non-social information (SIFI) was non-significant (p = 0.12). It should be noted that this does not allow us to claim that there is definitively no relationship but that this relationship is relatively weak.
The relationship between temporal processing and multisensory integration of social stimuli was observed despite the fact that temporal processing and multisensory integration were measured with two very different types of stimuli. Although multisensory integration here was measured with voice and face stimuli, temporal processing was measured with very simple stimuli (pure tones and white circles). This also suggests that while the clinical manifestations of autism present most commonly in the social domain, the underlying sensory issues that contribute to these issues may not be so circumscribed but may extend to sensory processing in general.
The relationship between temporal processing and multisensory integration of social stimuli was observed despite the fact that there were not significant differences in the TBWs as measured with simple flash-beep stimuli. These results reflect the mixed previous findings in the literature where TBWs measured with simple stimuli often do not show a between-group difference, but TBWs measured with social and speech stimuli typically do show a between-group difference (Collignon et al., 2013; De Boer-Schellekens et al., 2013; Foss-Feig et al., 2010; Kwakye et al., 2011; Stevens, 1946; Stevenson et al., 2014c).
Theoretical implications
Sensory symptoms were described in Kanner’s original description of the disorder (Kanner, 1943), yet researchers have only recently begun to empirically explore the correlates of atypical sensory processing, leading to their inclusion in the most recent Diagnostic and Statistical Manual of Mental Disorders (DSM; APA, 2013). Theoretical accounts of autism have predominantly focused on the more “high-level” issues commonly associated with autism, including Theory of Mind (Baron-Cohen, 1989) and Executive Functioning (Corbett et al., 2009; Ozonoff et al., 1991). More recently, however, there has been a burgeoning of theoretical accounts of autism that focus on more “low-level” issues (for review, see Baum et al., 2015a), beginning with the weak central coherence model (Burnette et al., 2005; Frith and Happe, 1994; Happe, 1999). Weak central coherence, in terms of sensory processing, posits that autistic individuals focus more on small-scale details of sensory input, while not attending to the broader scope, which requires integration of sensory information.
A second example, the temporal binding hypothesis, is a neurobiological account of autism which proposes that the processes used to synchronize activity within and between neural networks are impacted in autism (Brock et al., 2002). In terms of sensory integration, synchronized activities between processing modules in the brain is a prerequisite process for sensory integration, particularly multisensory integration, in which multiple cortical areas are recruited and must work in concert. As another example, the more recent predictive-coding hypothesis suggests that autistic individuals fail to build probabilistic representations of past events in a Bayesian sense (Pellicano and Burr, 2012; Sinha et al., 2014; Van Boxtel and Lu, 2013; Van de Cruys et al., 2014). While TD individuals would learn to associate auditory and visual information based on their statistical regularity (including their timing), this would be diminished in autism.
While these theoretical accounts predict decreased multisensory integration, it should be noted that this does not imply sensory impairments in all facets of perception. Indeed, the Enhanced Perceptual Functioning Theory has described a number of enhanced perceptual abilities (Mottron and Burack, 2001; Mottron et al., 2006). Enhancements in perceptual performance are seen most commonly in fist-order, domain-specific auditory and visual tasks. As such, this theory postulates that these enhancements lead to a default perceptual tendency to default focus on local aspects of a laboratory task or real-world situation. This theory also postulates that this perceptual enhancement may lead to an over-reliance on simple perceptual operations (Mottron et al., 2006) and their underlying neural architecture (Samson et al., 2006).
The results of this study suggest that a theoretical move toward incorporating both high- and low-level approaches in the study of autism is appropriate. These data show that one such example, sensory perception, may have downstream effects that present as cognitive or clinical difficulties in autism.
Clinical implications
In addition to the theoretical implications, there are a number of clinical implications that may be derived from these findings. In a broad sense, identifying directional pathways to atypical development provides multiple targets for intervention. Specifically, where the outcome measure is speech perception and communication, targeting speech perception and communication itself would be the typical remediation strategy. The directional pathway identified here from temporal processing to sensory integration to speech perception, provides two new targets for intervention: temporal processing and sensory integration. Indeed, remediation focused on temporal processing has been discussed in the literature (Baum et al., 2015a; Stevenson et al., 2014b, 2014c, 2015b; Wallace and Stevenson, 2014). These treatments adapt temporally focused perceptual learning strategies that have been successfully used with TD populations (Powers et al., 2009, 2012; Schlesinger et al., 2014; Stevenson et al., 2013) into an autism-specific remediation. The overall concept is that improved audiovisual temporal processing will have a cascading impact, inducing positive changes in multisensory integration and speech communication (Baum et al. 2015a; Stevenson et al., 2014b, 2014c, 2015b; Wallace and Stevenson, 2014). Additionally, multisensory integration itself could be targeted which, to our knowledge, has not been investigated. 2
While the focus of this study was on the impact of temporal processing difficulties in autism, it is not the only sensory issue that could be targeted. Recent work from our laboratories and others has shown a strong link between sensory sensitivity and anxiety (Black et al. in press; Green and Ben-Sasson, 2010; Green et al., 2012; Lidstone et al., 2014), for example. As the developmental pathways from atypical sensory processing to changes in cognition and clinical symptoms are elucidated, more targets for sensory remediation will emerge.
Conclusion
This work provides the first empirical evidence of atypical sensory perception in autism cascading into autism symptomatology. We found that temporal processing in autism influences multisensory integration, which, in turn, influences speech perception abilities, which were confirmed to be impaired in a group of autistic children. These data support hypotheses that sensory perception abilities in autism may contribute to core diagnostic features of the disorder. These data further support the premises of many modern theoretical accounts of autism that commonly acknowledge the role of atypical sensory processing in clinical presentation. Finally, these findings provide possible targets for remediation within the population, though considerable research is needed in this area.
Supplementary Material
Supplementary Material, AUT704413_Lay_Abstract – The cascading influence of multisensory processing on speech perception in autism
Supplementary Material, AUT704413_Lay_Abstract for The cascading influence of multisensory processing on speech perception in autism by Ryan A Stevenson, Magali Segers, Busisiwe L Ncube, Karen R Black, James M Bebko, Susanne Ferber and Morgan D Barense in Autism
Footnotes
Acknowledgements
The authors would like to thank first and foremost all the children and families who participated in this study, who have contributed their time and energy to helping others. Acknowledgements also to Pam Stoll, Robin E. Jones, MA, CCC-SLP, and Beatrice Bwalanda for recruiting the majority of these families for this study, and Whitewater Crossing and Brampton Christian Family Church for providing testing space.
Declaration of conflicting interests
The author(s) declared no potential conflicts of interest with respect to the research, authorship, and/or publication of this article.
Funding
R.A.S. was funded through the Social Sciences and Humanities Research Counsel of Canada Insight Grant R5502A07, the Natural Sciences and Engineering Research Counsel of Canada Discovery Grant, the University of Western Ontario’s Faculty Development Research Fund, and the Autism Research Training Program (![]() ). K.R.B. was funded through the Kay Sansom Scholarship from the Ontario Association on Developmental Disabilities, a University of Toronto Excellence Award-Natural Sciences and Engineering, and the University of Toronto Undergraduate Research Award. S.F. was funded through NSERC grant 216203-13 and Canadian Institutes of Health Research (CIHR) grant 106436. M.D.B. was funded through a Scholar Award from the James S McDonnell Foundation and an NSERC Discovery grant and accelerator supplement. J.M.B. was funded through a CIHR Emerging Team Grant.
). K.R.B. was funded through the Kay Sansom Scholarship from the Ontario Association on Developmental Disabilities, a University of Toronto Excellence Award-Natural Sciences and Engineering, and the University of Toronto Undergraduate Research Award. S.F. was funded through NSERC grant 216203-13 and Canadian Institutes of Health Research (CIHR) grant 106436. M.D.B. was funded through a Scholar Award from the James S McDonnell Foundation and an NSERC Discovery grant and accelerator supplement. J.M.B. was funded through a CIHR Emerging Team Grant.
Notes
References
Supplementary Material
Please find the following supplemental material available below.
For Open Access articles published under a Creative Commons License, all supplemental material carries the same license as the article it is associated with.
For non-Open Access articles published, all supplemental material carries a non-exclusive license, and permission requests for re-use of supplemental material or any part of supplemental material shall be sent directly to the copyright owner as specified in the copyright notice associated with the article.