




Abstract
Children with autism spectrum disorder from low-income, minority families or those with limited English proficiency are diagnosed at a later age, or not at all, compared with their more advantaged peers. The Developmental Check-In is a new tool that could potentially be used to screen for autism that uses pictures to illustrate target behaviors. It was developed to enhance early identification of autism spectrum disorder in low literacy groups. The Developmental Check-In was tested in a sample of 376 children between the ages of 24 and 60 months, from underserved communities. It showed good ability to discriminate autism spectrum disorder from non-autism spectrum disorder (area-under-the-curve = 0.75) across the full age range represented in the sample. Twenty-six of the 28 Developmental Check-In items predicted the presence of autism spectrum disorder. Findings suggest that this pictorial tool may reduce linguistic and health literacy demands when screening for autism among vulnerable populations.
Early detection and diagnosis of autism spectrum disorder (ASD) is critical for connecting children to intervention and maximizing developmental outcomes (Dawson et al., 2010). While an experienced clinician can diagnose ASD in children as young as 18 months (Ozonoff et al., 2015), the median age of diagnosis in the United States is about 50 months (Christensen et al., 2016). This is very close to the median age previously reported by the Centers for Disease Control and Prevention (CDC) in 2000 and 2002, suggesting that increased awareness has not resulted in earlier autism diagnosis (Christensen et al., 2016). Diagnosis is even later or missed altogether among children living in poverty and those from racial or ethnic minorities (Durkin et al., 2010, 2017; Fountain et al., 2010; Mandell et al., 2002, 2009).
Factors contributing to delayed and missed diagnosis among poor children and children from racial and ethnic minorities are complex and not well understood, but could, in part, be the result of cultural, language, social support, religious or literacy issues (Colbert et al., 2017). In a large prospective study of toddlers (Herlihy et al., 2014), minority children were neither more nor less likely to be diagnosed with ASD. However, parental reading level, understanding of questions, and frame of reference for comparison to other children affected screening and evaluation results. Tek and Landa (2012) suggest that culture influences parents’ expectations for and interpretation of child behavior, as well as communication with healthcare providers. When minority children are identified early, their symptoms often are more severe than those of white children identified at the same age (Liptak et al., 2008; Tek and Landa, 2012), suggesting that minority parents are less likely than other parents to view more subtle symptoms of ASD as indicating atypical development. For parents for whom English is a second language, language differences may impede all phases of ASD identification, from awareness and communication of developmental concerns to monitoring and screening. Taken together, these findings support the need for targeted strategies to increase identification of ASD in minority communities (Christensen et al., 2016; Liptak et al., 2008).
An important part of screening for ASD involves the use of standardized screening tools. Two of the most commonly used autism screening tools are the Modified Checklist for Autism in Toddlers—Revised (M-CHAT-R; Robins et al., 1999) and the Social Communication Questionnaire (SCQ; Rutter et al., 2003). Some studies find that the M-CHAT and its revision, the M-CHAT-R (Robins et al., 2014), result in many false positives when completed by racial minority parents with low income or low level of education (Khowaja et al., 2015; Windham et al., 2014). Scarpa et al. (2013) also question the M-CHAT’s accuracy among low-income, minority, and less educated parents or those from rural communities. While using the M-CHAT’s recommended follow-up interview reduces false positives, implementing it may be unrealistic due to limited staff resources (Windham et al., 2014) and challenges reaching families for follow-up (Khowaja et al., 2015). Khowaja et al. (2015) further note that clarifying wording of items and providing written examples did not improve accuracy for families with lower maternal education, suggesting that literacy may be a factor, even though the M-CHAT-R requires only a fourth-grade reading level. They speculated that reading items aloud to the parents may help, but note that this also is labor intensive. Furthermore, some translated M-CHAT items were found to be confusing to Spanish-speaking parents (Kimple et al., 2014; Windham et al., 2014). These challenges are not limited to the M-CHAT. Moody et al. (2017) found that the specificity of the SCQ decreased for non-white mothers and for mothers with less education or lower family income. This decrease in specificity occurred regardless of whether the SCQ cut-off score was 15, as recommended in the SCQ manual, or a lower cut-off of 11 or 13 was used for children under 48 months. The authors concluded that there is a need for ASD screeners that better identify ASD across cultures and socio-economic strata.
In the authors’ experience, garnered serving a low-income, urban population, the literacy demands of the M-CHAT and the SCQ may affect their accuracy in underserved groups. Specifically, initial parental response on the screening tools frequently is inconsistent with parent descriptions provided during follow-up interviews, particularly among parents with limited English proficiency or formal education. Many parents report confusion about the meaning of the items, despite the tools being provided in their primary language. Parents suggested that pictures of behaviors are easier to understand than written descriptions.
There are few examples of pictorial-based parent-report screening tools. Two tools were created for families outside of the United States and one tool focuses on only one domain that is associated with ASD. Perera et al. (2017) developed a visually-based ASD screening tool for use in a Sri Lankan population but the validation sample was relatively small, and it is unclear whether it is culturally valid in the United States. An Argentinian study described a general developmental screener completed by parents or healthcare staff that included illustrations (Lejarraga et al., 2013). Reported sensitivity was weak, and the tool was not ASD specific. The Pictorial Infant Communication Scale (PICS) is a parent-report tool to screen for joint attention that includes photos to aid caregivers in understanding and identifying behaviors of interest (Ghilain et al., 2017). PICS scores were correlated with ASD severity in a sample of primarily white preschoolers who had previously been diagnosed with ASD. Study limitations, however, included focus on joint attention alone, parents’ awareness of their child’s diagnosis which possibly influenced their responses on the tool, and photos that depicted only infants, even though the tool was used to screen preschool-aged children.
In response to the need for a visually-based ASD screening tool and the limitations of existing tools, we developed a visually-based ASD screening tool, the Developmental Check-In (DCI). In this study, we describe its development and its initial testing in a sample that combined children with developmental concerns at high risk for ASD and children recruited through community daycare centers at low risk for ASD.
Methods
This study received approval from the Rutgers Biomedical Health Sciences Institutional Review Board.
Development and design of the DCI
The DCI is an autism screening tool that uses pictures rather than written descriptions of behavior to reduce literacy demands and improve the clarity of the target behaviors. It includes visual depictions of key language, social-developmental milestones, and red flag behaviors.
To develop the DCI, a pool of 39 items was created based on (a) known red flags for ASD in young children and (b) items from the Autism Diagnostic Observation Schedule—Second Edition (ADOS-2) or the Screening Tool for Autism in Toddlers (STAT; Stone and Ousley, 2008) that differentiated between children with and without autism. Each item was then depicted as both a line drawing and a photograph. When necessary to promote clarity, brief labels were added to the items. For example, a bubble coming from the mouth of the adult with the name of a child was added to the item “Responds to name.” Separate versions of the screening tool were created with English and Spanish item labels (see Figure 1 for a sample DCI item).
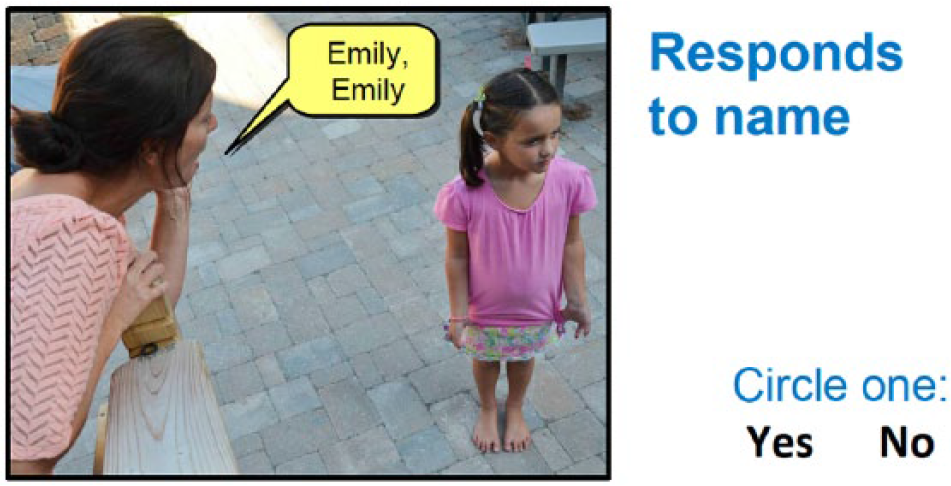
Sample DCI item (“Response to name”).
Interviews were conducted with parents of children with ASD (n = 16) and parents of typically developing children (n = 8). Both English and Spanish-speaking parents from Puerto Rico and other Caribbean islands were included. Parents were shown both the line drawing and photograph versions of the DCI, with order of presentation randomized, and were asked to name the skill/behavior depicted. If the response was not on target for the intended skill/behavior, the interviewer asked “we were trying to show a child (performing skill/behavior). What would help it look like that?” Parents were also asked their preference for drawings or photos in terms of item clarity. Interviews were conducted until a consistent pattern of responses emerged. Parents demonstrated better understanding as well as a general preference for the photographs versus the line drawings. Items that were confusing to the parents or were considered duplicative (e.g. multiple items depicting imitation skills) were deleted. The resulting tool consisted of 28 photographs depicting communication (four items), play (seven items), social (eight items), and behavior (nine items). Items were grouped by domain. Brief descriptors were added for each item. For example, a photo of a young child looking away from adult who is holding her was labeled “Avoids eye contact.”
Other screening measures: M-CHAT-R, SCQ
The M-CHAT-R (Robins et al., 2014) is a 20-item parent-report checklist used to examine children’s developmental milestones. The M-CHAT-R has been validated as a screening tool for children ages 16–30 months. Previous studies have extended the M-CHAT age range to 48 months (Snow and Lecavalier, 2008). A score of 0–2 is considered low risk, a score of 3–7 is considered medium risk, and scores of 8 or higher are considered high risk. It is suggested that scores within the medium-risk range receive a follow-up interview for further clarification. In this study, the follow-up interview was not given to high-risk subjects because they were evaluated regardless of screening status. Community daycare children were administered the follow-up interview if their initial score was within the medium- or high-risk category.
SCQ (Rutter et al., 2003) is a 40-item parent-report screening measure for ASD based on the Autism Diagnostic Interview—Revised (ADI-R; Rutter et al., 2008). A cut-off score of 15 is considered at risk. The SCQ is designed for children ages 48 months and over; however, previous studies have extended the age range down to 24 months when screening for ASD and considered lower cut-off scores, although sensitivity and specificity were not strong (Allen et al., 2007; Corsello et al., 2007, 2013; Moody et al., 2017; Snow and Lecavalier, 2008).
Developmental assessment measures: ADOS-2, MSEL
The ADOS-2 (Lord et al., 2012) is a semi-structured, play-based assessment for ASD with standardized administration and scoring schema. Child behavior is sampled through the use of systematic probes for ASD symptoms in communication, social interaction, play, and restricted and repetitive behaviors. Algorithm criteria for ASD and autism classification are provided, based on Social Affect as well as Restricted and Repetitive Behavior summary scores. The measure of interest from the ADOS-2 used in analyses was overall algorithm classification (autism and autism spectrum were combined as “ASD”). This algorithm classification also helped inform clinical diagnosis.
Mullen Scales of Early Learning (MSEL; Mullen, 1995) were administered to measure cognitive and language functioning. The Mullen is a comprehensive assessment of development normed for children ages birth to 5 years, 8 months that includes the following scales: Visual Reception, Expressive and Receptive Language, and Fine and Gross Motor. The Mullen yields both standard T-scores and age equivalents for each scale. For this study, standard scores for all scales except Gross Motor were the measures of interest used to establish differential diagnosis.
Participants and procedures
The DCI data were collected from two different samples: a high-risk sample of children referred for developmental evaluation and a low-risk sample of children recruited from community daycare centers. The high-risk sample was selected from children seen at an outpatient developmental evaluation program either at a non-profit pediatric hospital or at Federally Qualified Health Centers (FQHCs) located in five medically underserved communities in a mid-Atlantic state. These children were referred for evaluation because the healthcare clinic staff or parent had developmental concerns about the child. Low-risk children were those who had not been referred for developmental concerns and were recruited through daycare centers located in underserved communities in the same state. The purpose of this sampling strategy was to create a sample that had a high proportion of children who were poor and for whom English was a second language, and to enrich the sample for children without autism. Including a low-risk sample is similar to the strategy used to validate the M-CHAT (Robins et al., 2001). Children were included in the sample if they were (a) 24–60 months of age and (b) met one or more of the following inclusion criteria: they were Medicaid enrolled or had no insurance, were non-white, were Hispanic/Latino, or English was not the primary language spoken in the home.
Participants recruited from the developmental evaluation clinic were screened for study criteria when they called to make an evaluation appointment. By definition, children receiving healthcare at FQHCs met demographic criteria for this study (Centers for Medicare & Medicaid Services, 2017). Participating FQHCs were asked to refer all children between the ages of 24 and 60 months for whom parents or healthcare staff had noted developmental concern. FQHC staff described the study to the parents (i.e. that parents would be asked to complete several forms, and that the child would receive a free developmental evaluation) and arranged an evaluation appointment for those parents who expressed interest.
Full evaluations were provided regardless of scores on screening tools for the high-risk children recruited from the developmental evaluation clinics and the FQHCs. Evaluations were provided at the hospital clinic site for those children seen through the pediatric hospital and at the FQHC site for those children referred from FQHCs. A packet was mailed to parents to complete and bring with them to the evaluation appointment. Packets were available in English or Spanish. The Spanish-Western Hemisphere version of the M-CHAT-R was used because those families with primary language Spanish were primarily from Puerto Rico or Caribbean countries. The packet consisted of the written consent form, the parent-report screening tools, and a demographic form. All parents were asked to complete the M-CHAT-R, the SCQ, and the DCI.
When families arrived for the evaluation, a bilingual research assistant reviewed the consent with the parent. Informed consent was obtained for all subjects in the study. The research assistant then conducted a structured parent interview to gather child and family health information and gave the completed demographic and health information to the evaluator for review. The evaluators administered the Mullen Scales of Early Learning (MSEL; Mullen, 1995) and ADOS-2 (Lord et al., 2012), scored the measures, and provided the parent with clinical diagnostic impressions and recommendations. Evaluators were developmental pediatricians, advanced practice nurses, or licensed psychologists and all were research reliable on the ADOS-2 and experienced in diagnosis of ASD and related disorders. The ADOS-2 classification helped inform the assigned ASD status, but the final ASD diagnosis was based on clinical judgment of the experienced evaluator who administered the ADOS-2 and directly observed the child. Clinical diagnosis of ASD was closely aligned to ADOS-2 classification: 99% of those diagnosed with ASD were classified as ASD on the ADOS-2 and 81% of those diagnosed as non-ASD were classified as non-ASD on the ADOS-2. Families received a gift card for their participation. In this group of children, final classification (ASD vs non-ASD) was determined by expert clinicians conducting an in-person evaluation assisted by the instruments described above.
Families recruited from daycare centers received the same packet described above; teachers sent the packet home with each child. Clinical evaluations were not provided for these low-risk children. In this sample, children were determined not to have ASD if they screened negative on both the M-CHAT-R and SCQ. Children who screened positive on either measure were excluded from analyses. Those who did not complete both screening measures were also excluded from analyses. Those who screened positive on any measure and who provided contact information were referred for evaluation and given resources.
One strategy that has been suggested to overcome the problem of absence of a gold standard (i.e. clinical diagnosis) in diagnostic research is to combine the outcomes of multiple tests for disease verification. Results from multiple tests can be combined through a fixed rule as in a composite reference standard (i.e. diagnostic decision rule (Alonzo and Pepe, 1999; Hadgu et al., 2012)). We think the strategy of using negative screens on multiple screening tools to determine the absence of diagnosis comprises a more rigorous strategy than that used in validation studies of other measures, which considered subjects to be non-ASD or “typically developing” based on lack of a diagnosis in a health chart (Perera et al., 2017) or parent report of lack of a diagnosis (e.g. Smith et al., 2013; Volker et al., 2010).
Data analysis
Our analytic goal was to assess the performance of the DCI in discriminating between children with ASD and those without ASD in a traditionally underserved population. First, we compared total DCI score and sub-scores for speech, play, social engagement, and behavior between groups using the Mann–Whitney U test. Non-parametric tests were used given the skewed distribution of the scores. Next, we performed an item analysis of the DCI to examine discriminant ability of each item using logistic regression. The odds of scoring at risk on each item were estimated for children with ASD compared with children without ASD.
We then examined diagnostic accuracy of the DCI in the overall sample of children and in demographic subgroups. A receiver-operating characteristic (ROC) area-under-the-curve (AUC) analysis was performed to assess the discriminant ability of the DCI in distinguishing children with ASD from those without ASD. ROC analysis does not assume a priori cut-off point, but describes the tool’s performance (sensitivity and specificity) for all possible cut-off values. The AUC value lies between 0.5 and 1; higher AUC suggests better discriminant ability. An accepted rule of thumb is that an AUC of 0.5 indicates no discrimination, an AUC of 0.7 indicates an acceptable discrimination, and an AUC of 0.9 indicates an excellent discrimination (Hosmer and Lemeshow, 2000).
In evaluating the diagnostic accuracy of a screener, a covariate can be a confounder if it is associated with both condition status (ASD, non-ASD) and screener results (DCI score) (Alonzo and Pepe, 2002; Janes et al., 2009; Janes and Pepe, 2008, 2009). For example, if the distribution of age differs between children with and without ASD and age is associated with the DCI score, then age could confound the association between DCI score and ASD. To account for potential confounding, covariate adjustment by regression model in ROC analysis was introduced (Hajian-Tilaki, 2013; Janes and Pepe, 2008; Pepe, 1998; Pepe et al., 2009; Tosteson and Begg, 1988). While adjustment for confounding is widely used in etiologic studies in epidemiology, it is rarely used to control for confounding in ROC analysis in medical literature of diagnostic studies (Hajian-Tilaki, 2013). If a variable confounds the association between DCI score and ASD status, different thresholds for different levels of that confounder should be established (Pepe, 2003).
In this study, we followed the guidelines (Janes et al., 2009; Janes and Pepe, 2008, 2009) on the ROC-regression methods to account for confounders and effect modifiers in the analysis of the diagnostic accuracy of the DCI. First, we explored associations between all measured covariates and the diagnostic status and DCI total score. If any significant associations were observed, the estimated ROC curve was adjusted for these covariates. The AUC for both the unadjusted and adjusted ROC curve was reported.
To determine if covariate-specific ROC analysis was needed, we examined the effect of the measured covariates on the estimated ROC curve. Covariates that affect the ROC curve are analogous to effect modifiers in the association setting (Janes and Pepe, 2008). The discrimination between ASD and non-ASD children varies with covariate value. A significantly positive effect of a covariate on the ROC curve suggests better discriminative power of the DCI, and vice versa. Such analyses enabled us to examine whether the performance of the DCI varied across demographic groups. For example, if the estimated coefficient for the indicator of female sex is significantly positive, it suggests that the DCI performs differently in girls than in boys. In such a case, separate ROC curves should be estimated for girls and boys (Janes et al., 2009; Janes and Pepe, 2008, 2009).
Finally, we estimated optimal cut-off points for the DCI using the Youden index, the Liu index and using the nearest point on the ROC curve closest to the (0, 1) point that corresponded with 100% sensitivity and 100% specificity (Fluss et al., 2005; Liu, 2012; Perkins and Schisterman, 2006). Since all three methods yielded almost identical results, we only reported cut-offs obtained via Youden index. For covariates identified as potential confounders, covariate-specific cut-off points were estimated (Pepe, 2003). We report specificity and sensitivity of the DCI at the optimal cut-off points.
Results
Of the 288 children evaluated in the high-risk group, 214 were diagnosed with ASD. Of the 88 children in the daycare group, 74 were considered not to have ASD based on passing both M-CHAT-R and SCQ. The non-ASD sample therefore consisted of 148 children. Demographic characteristics for the children with and without ASD are shown in Table 1.
Sample characteristics by ASD status.

ASD: autism spectrum disorder; SD: standard deviation.
Sample means, proportions, and corresponding standard deviations, and p values for the test of difference in variables between ASD and non-ASD groups.
The mean age of the children in the sample was 38 months. The sample was primarily low socio-economic status. While we did not collect income data, 92% were Medicaid enrolled, suggesting an income close to or below the poverty level. Most children were male and Hispanic; 42% came from families in which English was not the primary language spoken at home.
Compared with children without ASD, children with ASD were younger, more likely to be male and white, and less likely to be black or uninsured. The groups differed in age, gender, and race. Age and gender were significantly associated with DCI score, so we accounted for the confounding effect of age and gender in the evaluation of the DCI performance.
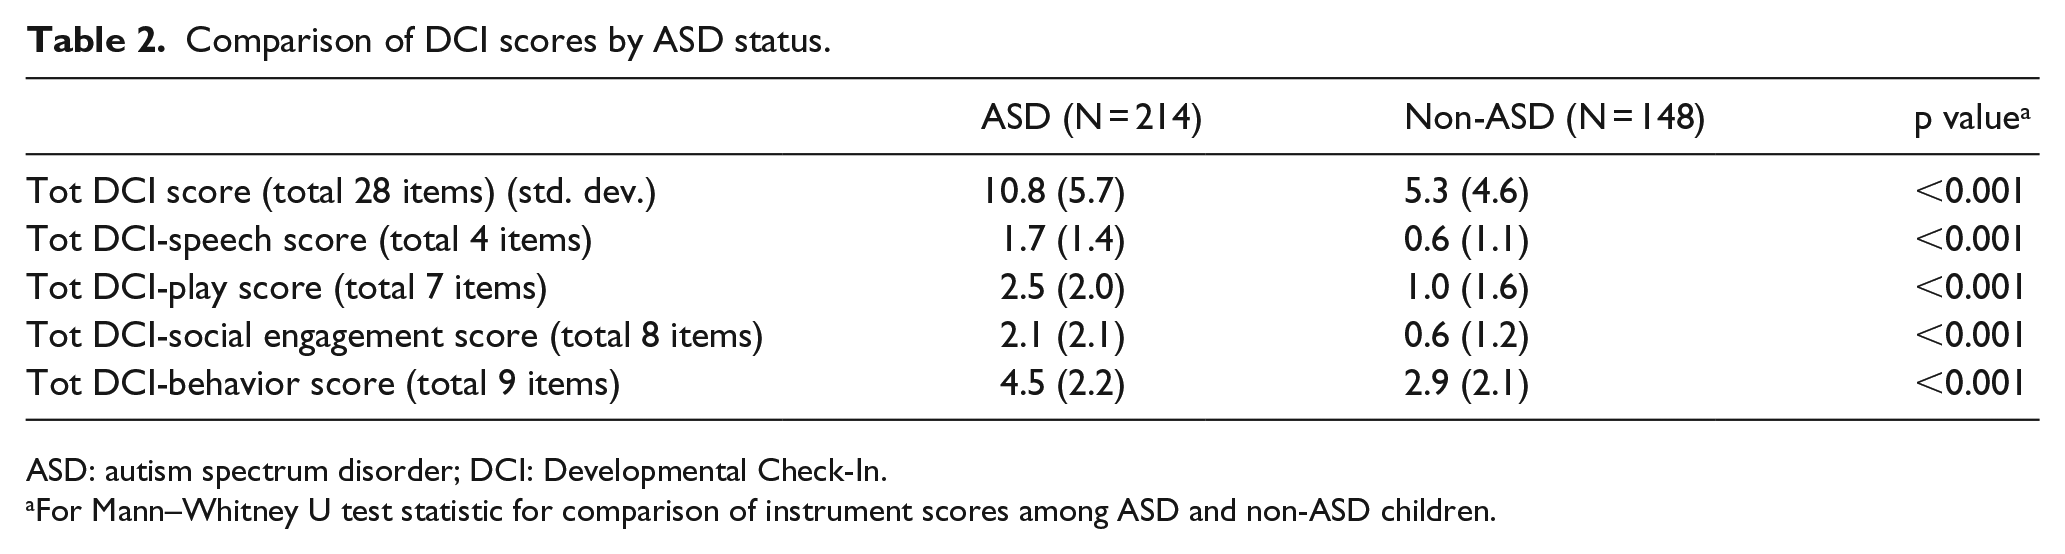
Table 2 shows DCI total and sub-scores for children with and without ASD. On average, children with ASD had a significantly higher total DCI score than children without ASD. Children with ASD scored positive on an average of 11 DCI items; those without ASD scored positive on an average of 5 DCI items. Speech, play, social engagement, and behavior scores for ASD children were all significantly higher than those for non-ASD children.
Comparison of DCI scores by ASD status.
ASD: autism spectrum disorder; DCI: Developmental Check-In.
For Mann–Whitney U test statistic for comparison of instrument scores among ASD and non-ASD children.
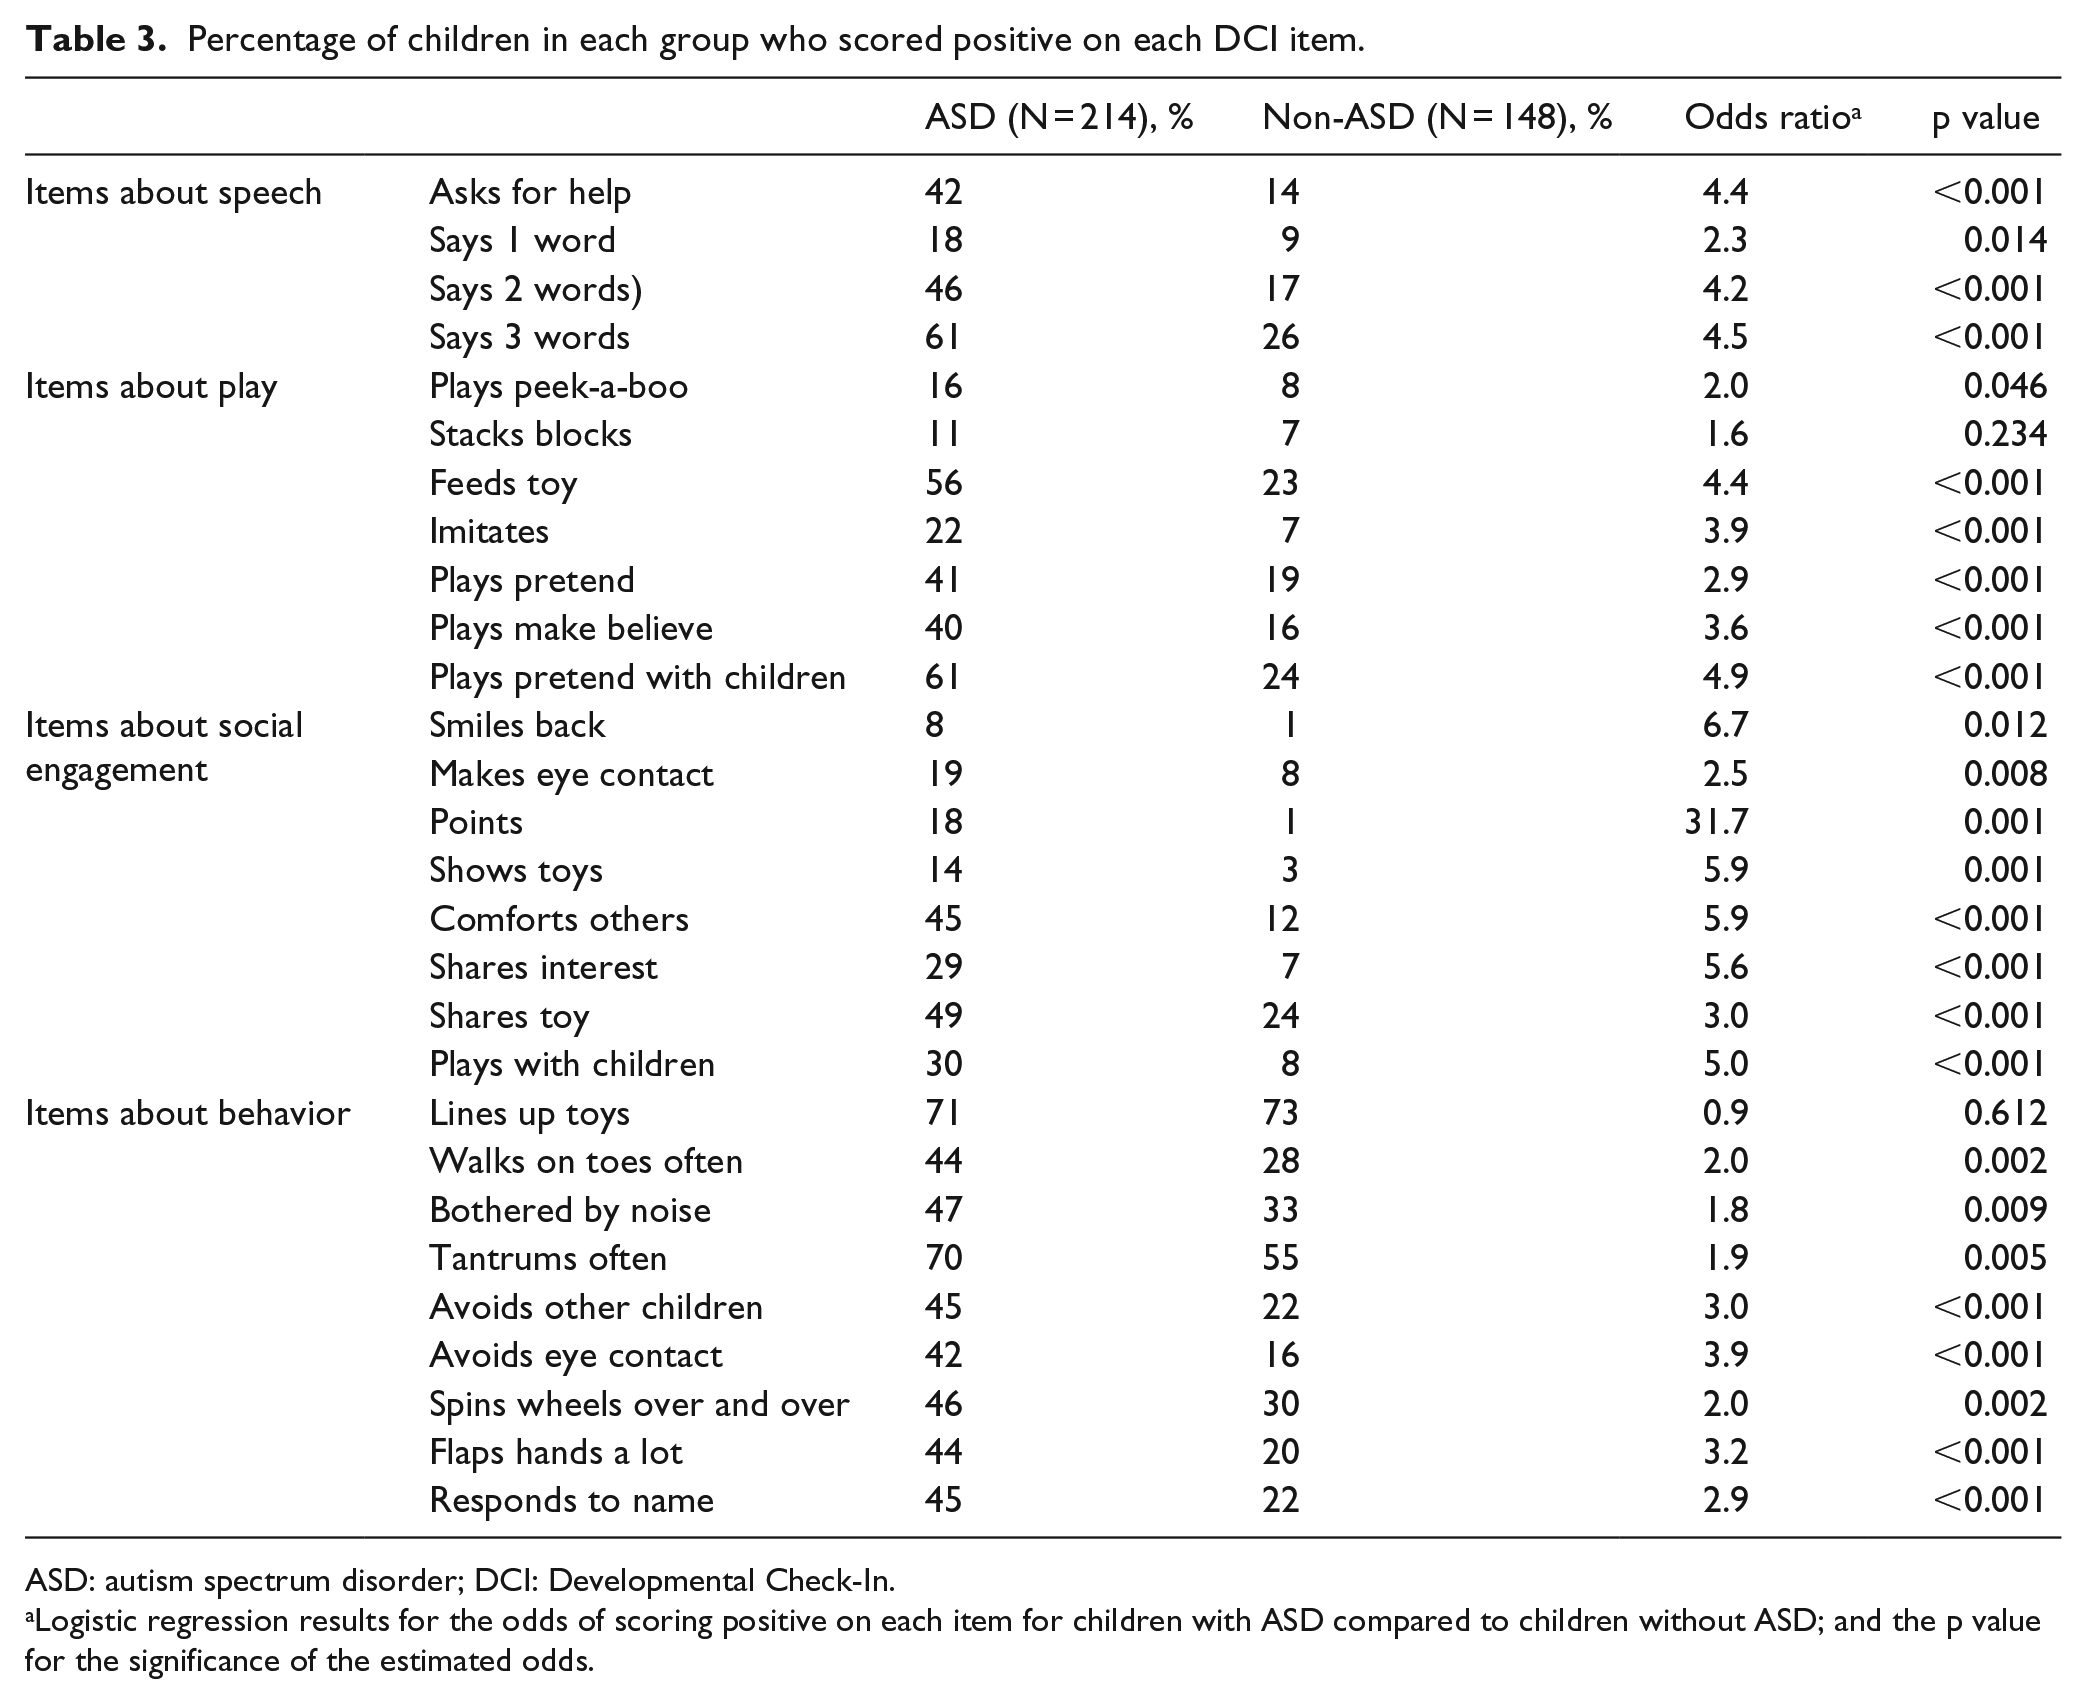
Table 3 presents the DCI item analysis. All items were statistically significantly different between children with ASD and without ASD, except the items Stacks blocks and Lines up toys. Items with the highest odds ratio for ASD were Smiles back, Points, Shows toys, Comforts others, Shares interests and Plays with children.
Percentage of children in each group who scored positive on each DCI item.
ASD: autism spectrum disorder; DCI: Developmental Check-In.
Logistic regression results for the odds of scoring positive on each item for children with ASD compared to children without ASD; and the p value for the significance of the estimated odds.
Discriminative performance of the DCI
The AUC for unadjusted ROC curve was 0.78 (95% CI: (0.73, 0.83)), and 0.75 (95% CI: (0.70, 0.81)) after adjusting for age and gender. Figure 2 shows ROC curve for the DCI adjusted for age and gender.
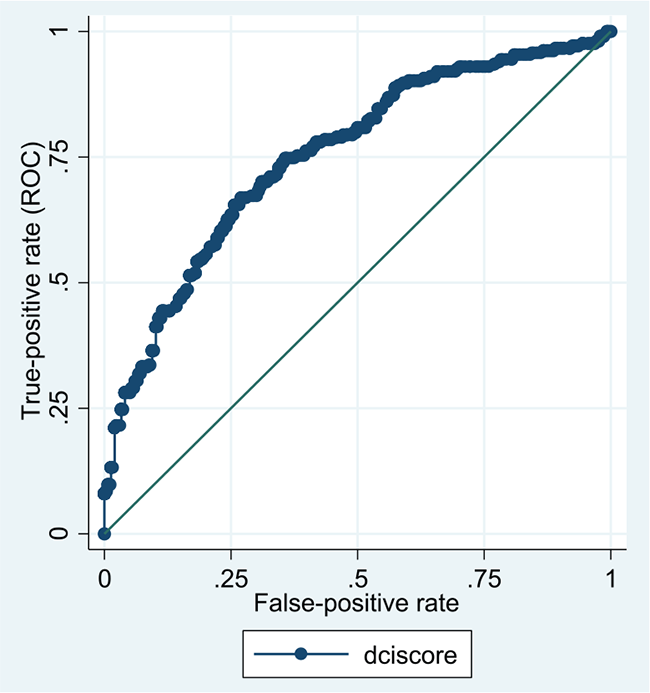
ROC curve for the DCI adjusted for age and gender.
The analysis of the effects of specific covariates listed in Table 1 on the discriminative performance of the DCI indicated no statistically significant effect for any covariate, meaning there was no evidence of varying accuracy of the DCI based on the specific covariate groups in this sample (data not shown).
Cut-off points for the DCI
Table 4 shows optimal cut-off points for the DCI in the overall sample as well as by age (for three age groups) and gender based on the ROC analysis. The Youden index yielded an empirical cut-off score of 7.5 for the DCI (sensitivity = 0.66, specificity = 0.76) for the overall sample. The optimal cut-off score declined with age and was higher for males than for females.
ROC analysis–optimal cut-offs for the DCI.
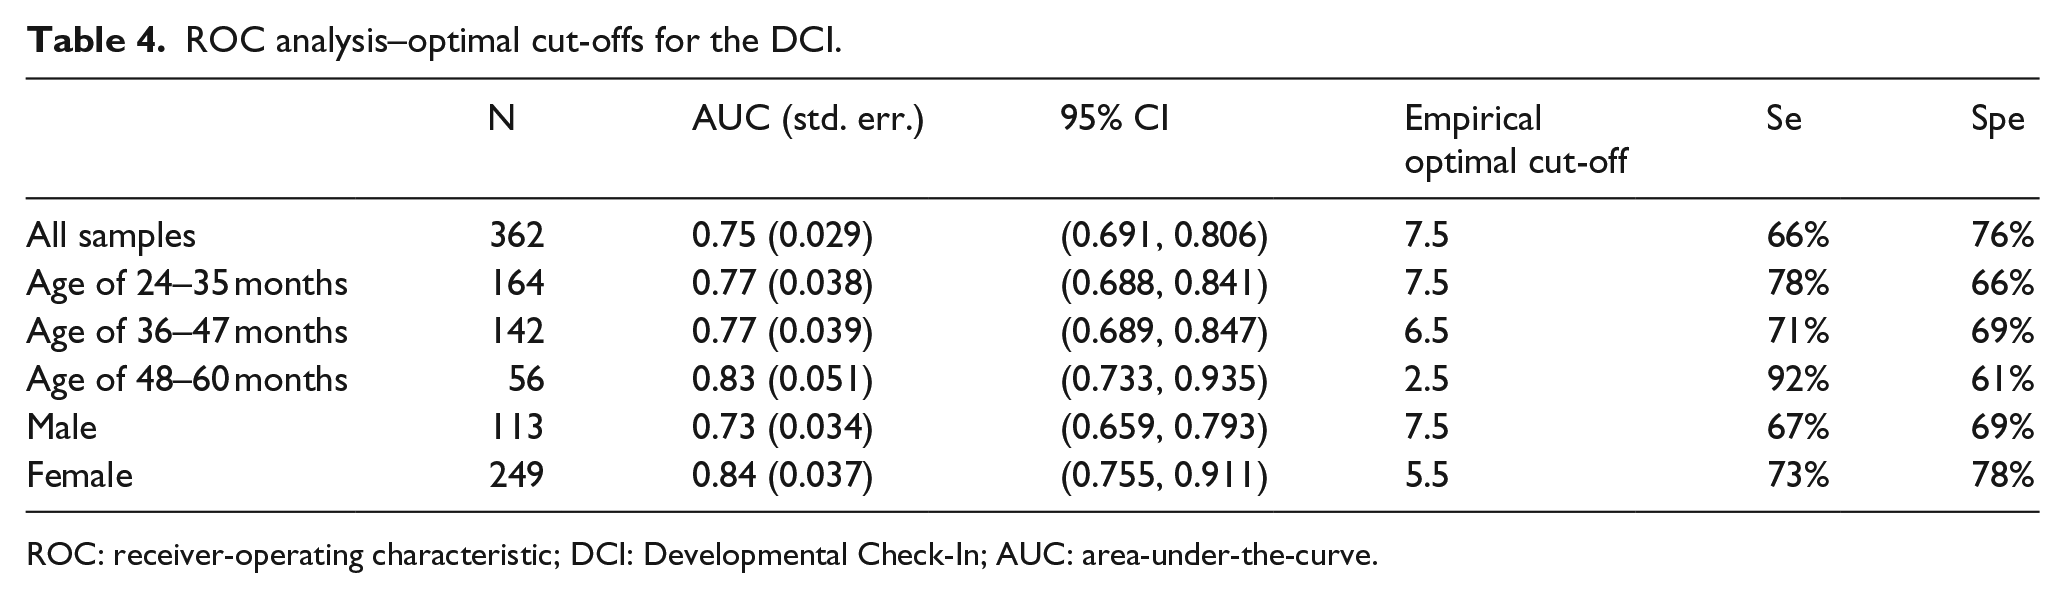
ROC: receiver-operating characteristic; DCI: Developmental Check-In; AUC: area-under-the-curve.
Discussion
Among this sample of predominantly low-socio-economic status, minority children, for many of whom English was not their primary language, the DCI demonstrated good ability to discriminate between children with and without ASD (AUC = 0.75). This is encouraging as the tool was designed specifically to enhance identification of young children at risk for ASD in underserved populations. The DCI performed well across all ages from 24 to 60 months, including children ages 36–47 months, for whom neither the M-CHAT-R nor SCQ has been validated. Although previous studies have suggested that both the M-CHAT and SCQ could be used in this age group, the sensitivity and specificity of both instruments may be compromised when used with children in this age bracket (Allen et al., 2007; Corsello et al., 2013; Snow and Lecavalier, 2008).
All DCI items except two significantly predicted the presence of ASD. While this is expected, given that items were chosen based on their predictive value on the ADOS-2 or other ASD screeners such as the STAT, our findings confirm that these items are predictive in pictorial form and with this underserved sample. Lines up toys was one of the items that did not discriminate ASD in this sample of underserved children. Our initial cognitive interviewing with parents suggested that this behavior can be depicted visually. Thus, the poor discriminative performance for this item may be related to different patterns of repetitive behavior for young underserved children with ASD. It also is possible that children without ASD also line up toys and this item may not discriminate meaningfully, particularly on parent-report measures.
Cut-off points for the DCI were determined empirically to maximize sensitivity and specificity. Ultimate cut-offs should be informed by clinical aim. For example, if it is important that no children at risk for ASD be missed, then specificity may be less important than sensitivity and a lower cut-off should be used. Different cut-offs also may be important to use for different demographics. For example, a lower DCI cut-off score was found to have better discriminant ability for older children and females in this sample.
The DCI adds to the limited examples of visually enhanced developmental or ASD screeners. Unlike those used only in non-US samples (Lejarraga et al., 2013; Perera et al., 2017) or that focus exclusively on one skill area (Ghilain et al., 2017), the DCI covers more developmental domains relevant to ASD and has demonstrated utility with underserved US populations. Our future research will cross-validate the DCI in different settings and with different samples.
Common to epidemiological studies, but often not done in ASD screener validation, we adjusted for potential confounders and explored effect modifiers, that is, whether specific covariates had an effect on the discriminant ability of the DCI. This enabled us to look at the accuracy of the DCI by demographic characteristics. While significant differences by demographic groups were not found, our sample was purposely homogenous, as we focused on children who were underserved. It is not known whether the DCI performs best for underserved groups, or if it may perform equally well across all populations. Future work with the DCI is planned in demographically heterogeneous at risk and low-risk groups in order to address these questions.
There are some study limitations. It is possible that some parents who participated in the pre-test interviews were not form underserved communities because although race, ethnicity and language were assessed, insurance status was not. The study did not monitor the rate of parent refusal of the research evaluation or the no-show rate. Families who agreed to participate in this study may not fully represent underserved young children at risk for autism. Formal assessment of parent literacy was considered, but ultimately not conducted due to the burden of an additional measure, as well as the concern that measuring parent literacy would promote mistrust toward the research team. Full clinical evaluation was not available for children in daycare centers. We believe using performance on two validated ASD screeners to determine ASD status is a more rigorous estimate of ASD status than relying on parent report that the child is typically developing or non-ASD (National Health Interview Survey, 2017; study two in Smith et al., 2013; Volker et al., 2010) or based on absence of ASD listed in health records (Perera et al., 2017). It should also be noted that the M-CHAT-R and SCQ have previously been used outside their originally intended age ranges as they were in this study for the community children, but accuracy of results may be compromised when this is done (Allen et al., 2007; Corsello et al., 2007, 2013; Moody et al., 2017; Snow and Lecavalier, 2008). We used a SCQ cut-off score of 15 for all ages in the daycare sample. It is possible that a lower cut-off for daycare children under 4 years old would have identified some children as at risk who were otherwise considered non-ASD.
Since a major value of using ASD screeners is to identify young children in order to implement effective early intervention, it would have been ideal to include children younger than 24 months of age. However, it was uncommon for children who met inclusion for the study and who were younger than 24 months to be referred to either the hospital developmental evaluation clinic or to be identified as at developmental risk within the FQHCs, suggesting that work is still needed to decrease the age of identification and referral of very young, underserved children.
Despite these limitations, there are important implications related to our findings. Reducing racial, ethnic, income and language disparities in early diagnosis of ASD is key to improving access to services and functional outcomes. The DCI may improve access to diagnosis by reducing the literacy and linguistics demand of a parent-report ASD screening tool. This is likely to be especially effective for families of young children from underserved groups who experience disparities in age of diagnosis of ASD (e.g. Durkin et al., 2017). While future work is needed to cross-validate the DCI in different settings, with different samples, and determine utility of the DCI in comparison to other validated ASD screening tools and in a general population of young children, these results are promising for this new measure.
Supplementary Material
Supplementary Material, AUT770430_Lay_Abstract – The Developmental Check-In: Development and initial testing of an autism screening tool targeting young children from underserved communities
Supplementary Material, AUT770430_Lay_Abstract for The Developmental Check-In: Development and initial testing of an autism screening tool targeting young children from underserved communities by Yvette M Janvier, Caroline N Coffield, Jill F Harris, David S Mandell and Zuleyha Cidav in Autism
Footnotes
Acknowledgements
The authors express special thanks to Marilyn Lopez, Natalia Gonzalez, and Rhiannon Luyster for their invaluable assistance with this project and to all the families involved in the study. An earlier version of this study was presented at IMFAR, May 2015 in Salt Lake City, Utah, USA.
Ethical approval
All procedures performed in studies involving human participants were in accordance with the ethical standards of the institutional and/or national research committee and with the 1964 Helsinki declaration and its later amendments or comparable ethical standards.
Funding
The author(s) disclosed receipt of the following financial support for the research, authorship, and/or publication of this article: This research was funded in part by The New Jersey Governor’s Council for Medical Research and Treatment of Autism and the New Jersey Department of Health.

References
Supplementary Material
Please find the following supplemental material available below.
For Open Access articles published under a Creative Commons License, all supplemental material carries the same license as the article it is associated with.
For non-Open Access articles published, all supplemental material carries a non-exclusive license, and permission requests for re-use of supplemental material or any part of supplemental material shall be sent directly to the copyright owner as specified in the copyright notice associated with the article.
