



Abstract
Meta-analyses of head circumference in autistic individuals exist; however, simple meta-analytic approaches are limited. Consequently, we gathered head circumference raw data of autistic (N = 2381) and typically developing participants (N = 994) by re-analysing the data from previously published studies together. The present study found no mean difference between head circumference of autistic and typically developing individuals, although simple effect analyses revealed smaller mean head circumference in autistic than typically developing females aged 12–17 months. However, compared to controls, the frequency of extreme head circumference in autistic males was greater at birth and between 60 and 100 months. In addition, the frequency of extremely small head circumference between 6 and 11 months, and extremely large head circumference between 12 and 17 months, was greater in autistic than typically developing males. For autistic females, compared to controls, extreme head circumference was more frequent between 36 and 59 months and less frequent at birth. We conclude that it is imperative to consider the effects of age and sex when investigating the relationship between autism diagnosis and head circumference. This variance was more effectively described via the approach of the present study than previous meta-analytic approaches.
Lay abstract
Summaries of studies that have measured head size in those with autism, known as meta-analyses, currently exist. However, this approach does not adequately explain extreme cases (such as those with extremely small, or extremely large, head size). Because of this, we obtained all available published data measuring head size (12 studies). The data from each study were then combined to make a larger dataset. We found that females with autism aged 12–17 months had, on average, smaller head sizes. Otherwise, average head size was not atypical in autism. However, we found that males with autism were more likely to have extreme head sizes at birth and between 60 and 100 months, a small head between 6 and 11 months, and a large head between 12 and 17 months. Females with autism were more likely to have extreme head sizes between 36 and 59 months and were less likely at birth. Our approach was able to measure the influence of age and biological sex on head size in autism, as well as the frequency of extreme cases of head size in autism. These results add to what we already know about head size in autism.
Keywords
Autism spectrum disorder (ASD) is a neurodevelopmental disorder, characterised by two domains: restricted and repetitive behaviours, and impaired social communication. Numerous reports have recently highlighted the rising global prevalence rate of autism (Baio et al., 2018). Consequently, researchers have sought early identification and treatment of autism diagnoses. One such method has been to measure head circumference (HC), where enlarged HC during early years of life was thought to be an early marker of autism (Sacco et al., 2015). Several theories exist relating to the causes of large HC in autism, including abnormal cell characteristics, nerve fibres, synaptic pruning, levels of proteins and chemicals and genetic structure (for a comprehensive review, see Sacco et al., 2015). While debate surrounds the neurobiological bases of a putative increase in HC in autism, this potential indicator of autism is appealing for clinicians, as it is simple and inexpensive to assess (Fein, 2011). Although HC has been heavily researched in the autism literature, results have been equivocal.
A recent meta-analysis concluded that age moderated the relationship between autism diagnosis and HC (Sacco et al., 2015). However, comparisons of HC between autism and typically developing (TD) groups were not analysed at distinct age ranges. It is important for clinicians to understand the age groups in which HC is different between autistic children and controls, should such an effect exist. The literature tends to conclude HC at birth is not different between autistic and TD individuals (Dissanayake et al., 2006; Libero et al., 2016; Torrey et al., 2004). HC becomes greater in autistic than in TD males at approximately 6 months of age (Dawson et al., 2007), in which this difference remains up until 36 months of age (Chawarska et al., 2011; Libero et al., 2016; Webb et al., 2007). However, HC is not different between autistic and TD participants between 9 and 36 months when including both males and females (i.e. Barnard-Brak et al., 2011). Hence, accounting for biological sex is imperative when investigating HC in autistic participants younger than 3 years of age. After 60 months of age, HC in autism tends to be similar to neurotypical controls (Cheon et al., 2011; Prigge et al., 2013; Valvo et al., 2016). Interestingly though, research is yet to investigate differences in mean HC between autistic and TD participants between 36 and 60 months.
Methodological issues have also reduced the clarity of some HC findings in the autism literature. Raznahan et al. (2013) pointed out that several studies have relied upon normative HC data for TD individuals obtained from the Centers for Disease Control and Prevention (CDC). Much of these CDC data are considerably out of date, particularly the data between 1929 and 1975 (Hamill et al., 1977), 1971 and 1994 (Kuczmarski, 2002) and 2003 and 2006 (McDowell et al., 2008). Looking at the CDC data year by year over an 80-year-period reveals HC has increased by 11 mm for boys and 7 mm for girls (Chaste et al., 2013). Hence, reliance upon the CDC normative data provides a downwardly biased standard for comparison to those with autism in several early studies (e.g. Courchesne et al., 2003; Dawson et al., 2007; Webb et al., 2007), leading to the conclusion that those with autism have larger HC, not because they do or do not, but because the standard to which they were compared was inappropriate.
HC studies in the autism literature are often piecemeal and largely based upon small to moderate samples. Hence, the findings of these studies may not explain overall trends in HC among those with autism. A meta-analysis of these data has advantages and some disadvantages. Typically, a meta-analysis reduces a study to a few statements of effect size. While meta-analyses have taken this collective approach (Raznahan et al., 2013; Sacco et al., 2015), a meta-analysis does not accurately depict extreme cases, which is precisely the matter at hand. Meta-analyses summarise effect sizes based on standard error, mean and sample size of individual studies. Because a meta-analysis relies on standard error, the predicted variance in the data does not properly account for outliers (Baker & Jackson, 2008). Considering that extreme head size is more common in autistic individuals than expected (Sacco et al., 2015), a meta-analytic approach may not be suitable to analyse HC in autism.
Greater understanding of HC in autism may be obtained by collectively analysing data. For instance, collection and re-analysis of raw data in a consistent format, rather than effect sizes of individual studies, is likely to improve our understanding of HC in autism. The present study has developed this approach, collecting raw HC and age data from many studies of HC among autistic participants and comparing these against each other, and against studies of neurotypical individuals. HC trends of autistic and TD participants are plotted in light of age for males and females, males separately and females separately. HC is then compared between groups at varying age ranges. In addition, extreme head size has been reported to be more common in autism than expected, especially during early childhood (Sacco et al., 2015). Amaral et al. (2017) suggest this may indicate a specific phenotype of autism. Consequently, we examined the rate of extreme head size in the autism and TD data. The proportion of head size cases above and below 1.5 standard deviation (SD) was compared between autism and TD groups in the present study.
In summary, the HC literature in autism suggests HC size to be greater in autistic males than in TD males between ages 6 and 36 months. Otherwise, HC is not different between autism and TD groups. Considering this predicted confounding influence of age on HC in autism, it is imperative to consider a data re-analysis approach rather than solely relying on meta-analytic outputs. Hence, it is hypothesised that between 6 and 36 months of age, HC will be greater in autistic males than in male controls. A greater frequency of cases with extreme head size is also expected to be evident in autistic than in TD participants during early childhood.
Method
The literature was systematically searched for all studies measuring HC in autistic participants. In circumstances where these studies measured HC in neurotypical controls, these data were also collected. Sources included books, peer-reviewed journal articles and theses of varying methodological quality. All sources were written in English, with no restrictions on publication date and status.
Study eligibility criteria
Criteria for inclusion into the present study necessitated that the authors provide raw HC and age data via email, or that it could be obtained from a publication using data capture techniques (n = 10; Tummers et al., 2006). The data capture approach involved viewing relevant figures via DataThief III. In this programme, we manually defined the axes and then recorded the coordinates of each data point in the figure. In some studies, authors provided data upon request (e.g. Dissanayake et al., 2006; Libero et al., 2016; Mills et al., 2007; Rommelse et al., 2011; Tsuchiya et al., 2007; Valvo et al., 2016; Whitehouse et al., 2011). In other studies, datasets were provided in the publication. Hence, we used data capture techniques to harvest the original data (e.g. Courchesne et al., 2003; Dawson et al., 2007; Zwaigenbaum et al., 2014). Where possible, the data of each study included were then re-analysed to confirm that we could obtain findings consistent with the original research. In no instance were we unable to replicate the original results.
A number of studies were based upon datasets utilised multiple times. To remove bias of these repeated datasets, all past studies within the present study included raw data that could be obtained or captured. Where more than one study utilising largely the same data was published, the one using the largest sample was used.
Information sources
A systematic database search was conducted on CINAHL Complete, Cochrane Library, CogPrints, Embase, INFORMIT, OAIster, OpenGrey, MEDLINE Complete, Proquest Dissertations and Theses Global, PsycEXTRA, PsycINFO, PubMed, PubMed Clinical Queries, Scopus and Web of Science to retrieve all relevant publications and theses. Databases were searched using the following search string: (( ‘head circumference’ OR ‘brain volume’ OR ‘head size’ OR ‘brain size’ OR ‘cerebral volume’ OR ‘cerebral cortex volume’ OR ‘cerebral hemisphere*’) AND (Autis* OR ASD OR ASC OR Asperger*) AND (farkas OR ‘measuring tape’ OR ‘plastic tape’ OR ‘occipital-frontal circumference’ OR ‘occipitofrontal circumference’ OR ‘occipital frontal circumference’ OR ‘occipital frontal head’ OR ‘occipital-frontal head’ OR ‘occipitofrontal head’ OR ‘medical record*’ OR ‘growth record*’ OR MRI OR ‘magnetic resonance*’)).
In addition, Google Scholar and reference lists of included sources, and review articles obtained in the systematic search, were searched for further journal articles and grey literature. Sources were obtained by scanning titles that included words relating to ‘Autism Spectrum Disorder’ and ‘Head Circumference’.
The systematic search was undertaken in January 2017. All decisions concerning which papers to include or exclude were made and confirmed by two authors (J.C. and C.H.). From a random subset of 361 articles, some articles were either initially disagreed upon before discussion between authors (n = 13) or were only agreed upon after the contribution of a third member (M.A.S.; n = 1). Nonetheless, eventual agreement between authors was strong (r = 1.00).
Study selection and data extraction
Each identified source was screened and then examined via full text for inclusion. Sources at the title and abstract stage were screened based on specific exclusion criteria: animal study, outcome variable not of interest, conference abstract, genetics or pharmacology study, study based on methodology or an intervention, included only TD participants, included only participants with another disorder or autistic participants with comorbid disorders, review or theoretical study and missing title or abstract. The exceptions to this criterion were abstracts which highlighted variables related to HC (i.e. macrocephaly) or brain volume (i.e. measures of brain activity). These abstracts were read at full text as HC or brain volume may have been measured and reported in these studies. From each paper that met eligibility criteria, the first author manually extracted the data to be included. All relevant descriptive information, demographic characteristics, study results and effect size data were summarised in tabular form (Table 1). All study search, selection and data extraction methods and results were reviewed by two of the authors independently.
Summary of included head circumference studies.
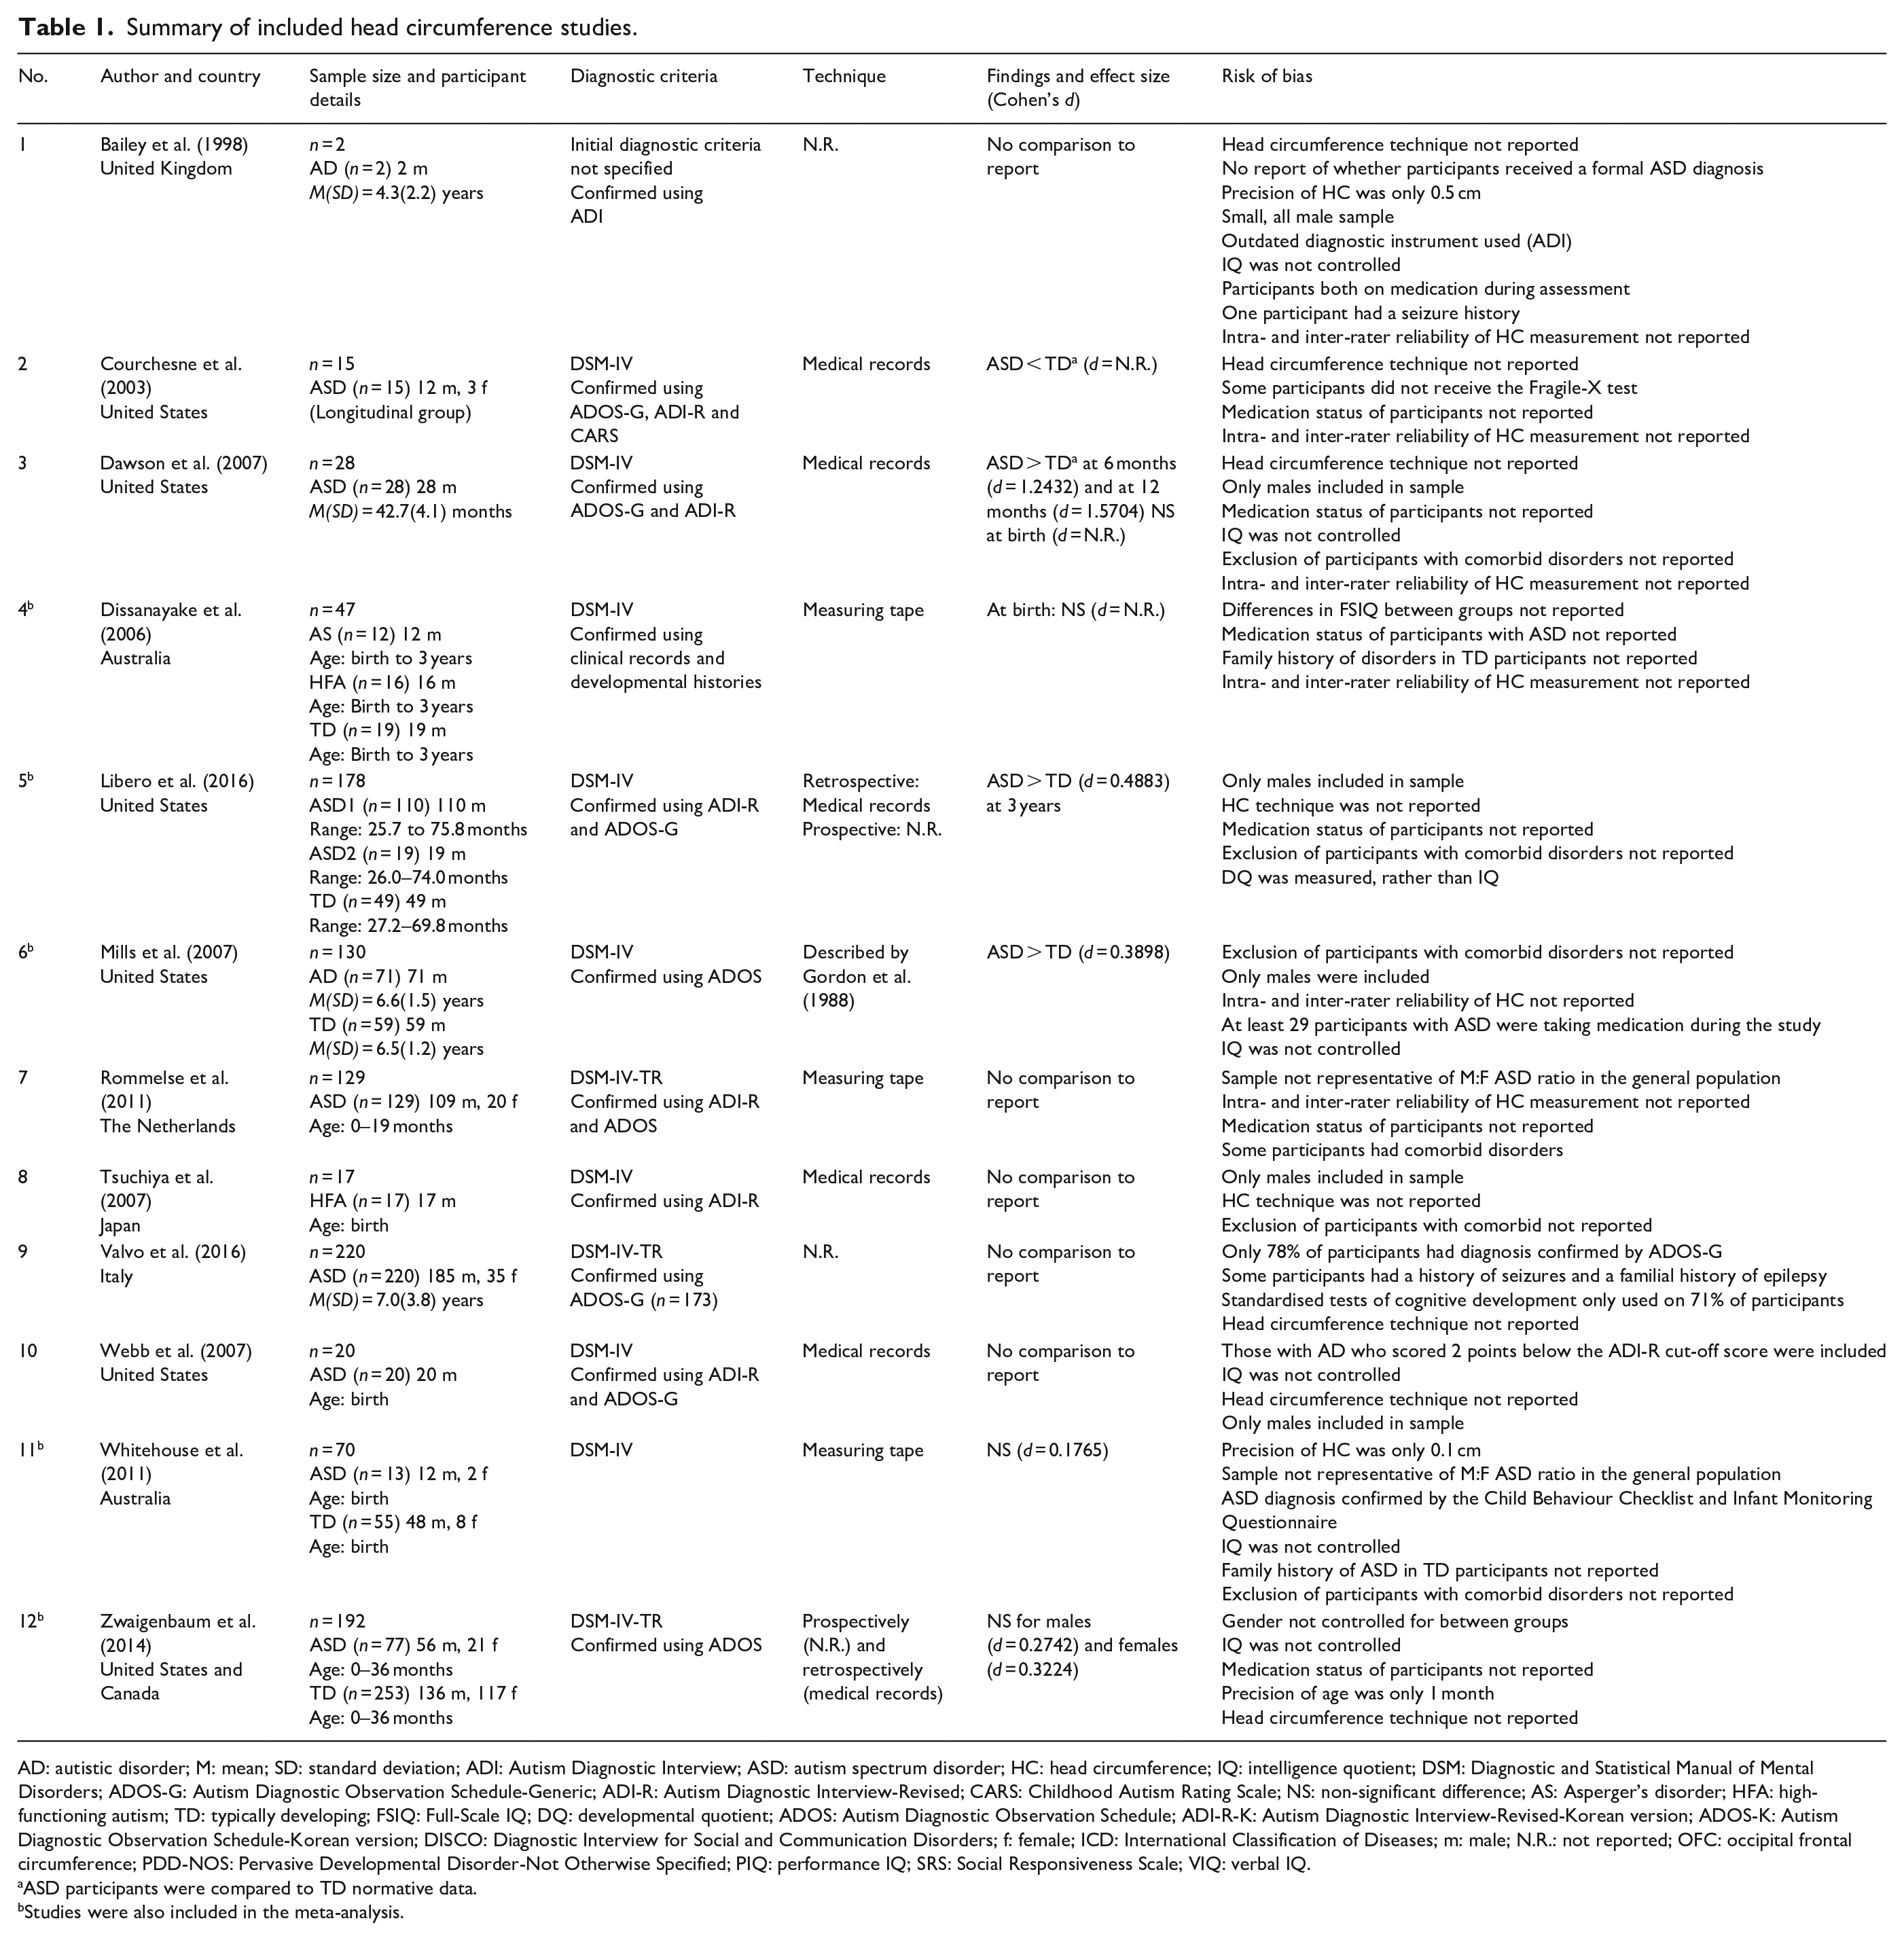
AD: autistic disorder; M: mean; SD: standard deviation; ADI: Autism Diagnostic Interview; ASD: autism spectrum disorder; HC: head circumference; IQ: intelligence quotient; DSM: Diagnostic and Statistical Manual of Mental Disorders; ADOS-G: Autism Diagnostic Observation Schedule-Generic; ADI-R: Autism Diagnostic Interview-Revised; CARS: Childhood Autism Rating Scale; NS: non-significant difference; AS: Asperger’s disorder; HFA: high-functioning autism; TD: typically developing; FSIQ: Full-Scale IQ; DQ: developmental quotient; ADOS: Autism Diagnostic Observation Schedule; ADI-R-K: Autism Diagnostic Interview-Revised-Korean version; ADOS-K: Autism Diagnostic Observation Schedule-Korean version; DISCO: Diagnostic Interview for Social and Communication Disorders; f: female; ICD: International Classification of Diseases; m: male; N.R.: not reported; OFC: occipital frontal circumference; PDD-NOS: Pervasive Developmental Disorder-Not Otherwise Specified; PIQ: performance IQ; SRS: Social Responsiveness Scale; VIQ: verbal IQ.
ASD participants were compared to TD normative data.
Studies were also included in the meta-analysis.
Summary measures and statistic analysis
Captured and supplied data were plotted into separate figures for autistic and TD participants over age. Loglinear model fits were found to be stronger than linear, quadratic or cubic alternatives, having larger effect sizes and more centrally fitting the data than the other options. Differences between the intercept and slope of each autism and TD line of fit were calculated (Zar, 1999). Furthermore, all age data had a value of 0.1 month added to enable the use of loglinear-based model fits.
Mean differences in HC were also calculated between autistic and TD participants at multiple age groups via analyses of covariance (ANCOVA), controlling for age and sex. The selected age groups (in months) reflected developmental milestones: birth, 0–1, 1–5, 6–11, 12–17, 18–35, 36–59 and 60–100. The first stage of Erikson’s model (0–18 months) was divided into smaller age groups as HC growth is rapid during this first stage of life (Dissanayake et al., 2006). Prior to analysis, we tested the two-way interaction between autism diagnosis and the two covariates (sex and age). In response to a significant two-way interaction, the covariate and the two-way interaction itself were included as predictors in the ANCOVA model. The simple main effect of sex was determined by additionally analysing males and females separately.
Given that the logistic model fits and the assessment of differences between groups may have hidden differences in numbers of cases who were extreme (extreme high scores that are balanced by extreme low scores do not affect the mean and other central measures), it was decided to explore the frequency of extreme cases, in line with results reported elsewhere (Amaral et al., 2017). Consistent with past research (Amaral et al., 2017), we defined extreme HC as 1.5 SD above the mean. HC 1.5 SD below the mean was also investigated. Because we did not control for height, these analyses are only a proxy of the original methodology previously described (Amaral et al., 2017). Separate mean HCs were calculated for specific age groups (Males: 0, 0.1, 0.2, 0.3, 0.4, 0.5, 0.6, 0.7, 0.8, 0.9, 1, 2, 3, 4, 5, 6, 7, 8, 9, 10–19, 20–29, 30–39, 40–49, 50–59, 60–69, 70–79, 80–89 and 90–100; Females: 0, 1, 2, 3, 4, 5, 6, 7, 8, 9, 10–11, 12–13, 14–15, 16–17, 18–23, 24–29, 30–35, 36–41, 42–47, 48–53, 54–59, 60–69, 70–79, 80–89 and 90–100). Mean HC was calculated at different age groups between males and females due to limited female data. The odds ratio for each comparison was then obtained. One-tailed tests of significance were assessed for specific groups: the frequency of those with HC > 1.5 SD and HC < 1.5 SD.
Results
The systematic search conducted produced 11,587 records, with an additional 119 retrieved through hand searching (see Figure 1). Once 2575 duplicates were removed, titles and abstracts were screened, resulting in exclusion of 8453 papers. After which, 769 articles were examined in full text. Studies were excluded for not having an available full text to access (n = 33), not measuring HC or not testing autistic participants (n = 425), measuring HC but not including raw HC and age data (n = 118) or analysing a dataset that was already included in the present study (n = 180). Thereafter, studies were excluded when they only included premature participants (n = 1). This resulted in 12 studies to be retained for the present study. Raw data, or the means and SDs of HC and age, were obtained from 12 studies of autistic participants (N = 2381) and five studies of TD participants (N = 994).

PRISMA flow chart.
All autistic individuals received a formal diagnosis before participating in the included studies. Each study’s initial diagnostic criteria for participants are presented in Table 1. Diagnoses were made by mental health or medical professionals using either Diagnostic and Statistical Manual of Mental Disorders (4th ed.; DSM-IV; n = 8) or Diagnostic and Statistical Manual of Mental Disorders (4th ed., text rev.; DSM-IV-TR; n = 3). One study did not specify the initial diagnostic criteria participants underwent to receive their formal autism diagnosis.
TD participants were also screened for inclusion in the present study. TD data from normative sources were excluded, due to the potential biases present in normative data regarding smaller estimates of HC (see Raznahan et al., 2013, for a review). Of the five studies with TD participants, four screened participants for psychiatric and neurologic disorders, while one study did not. Although Zwaigenbaum et al. (2014) did not specify whether TD participants were screened for comorbid conditions, they did not specify that any of the TD participants had disorders and so were thus included in the present study.
Of the studies that reported technique used to measure HC, four received HC data from medical records, three measured maximum occipital frontal circumference (OFC) with a non-stretchable measuring tape, two measured HC retrospectively via medical records and prospectively and one measured HC according to criteria by Gordon et al. (1988).
Raw HC data were plotted over age for autistic and TD participants (see Figures 2 to 7). Datasets are identified by number, as detailed in Table 1. Results described in Table 2 reveal a relationship between age and HC for both autism data (Figure 2(a)) and TD data (Figure 2(b)). At birth, although the autism line of fit is below the TD line of fit, the intercepts of these lines of fit were not different after accounting for multiple comparisons (Table 2). After birth, the lines of fit converge over age. When splitting the data into males and females (Figure 3), the lines of fit for both genders had a strong effect size and were similar between diagnostic groups (Table 2).
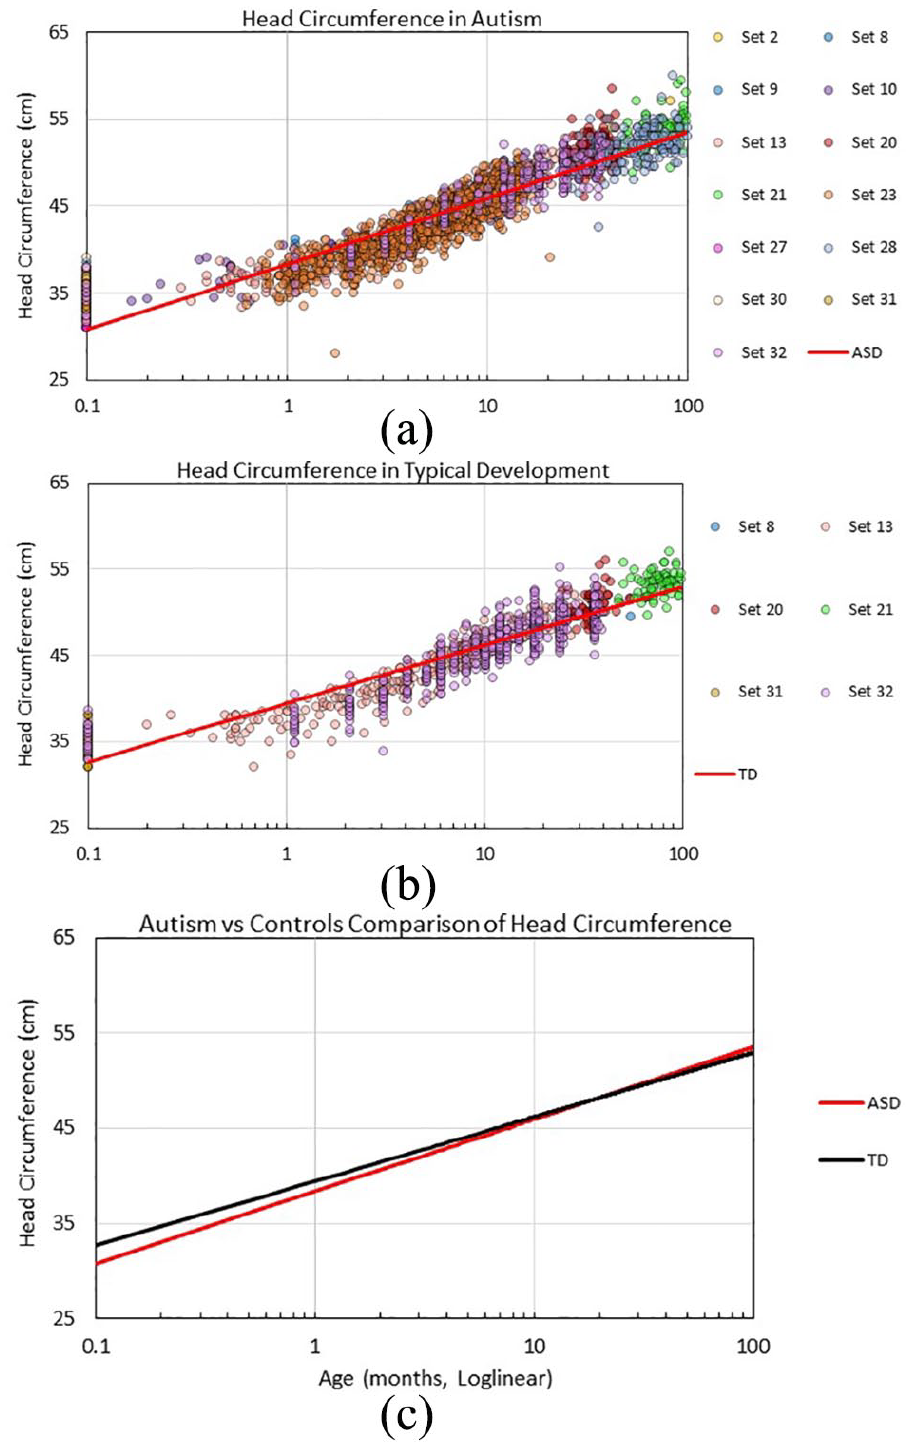
Head circumference data by age with loglinear fits: (a) for ASD; (b) for TD; and (c) comparison between ASD and TD loglinear models.
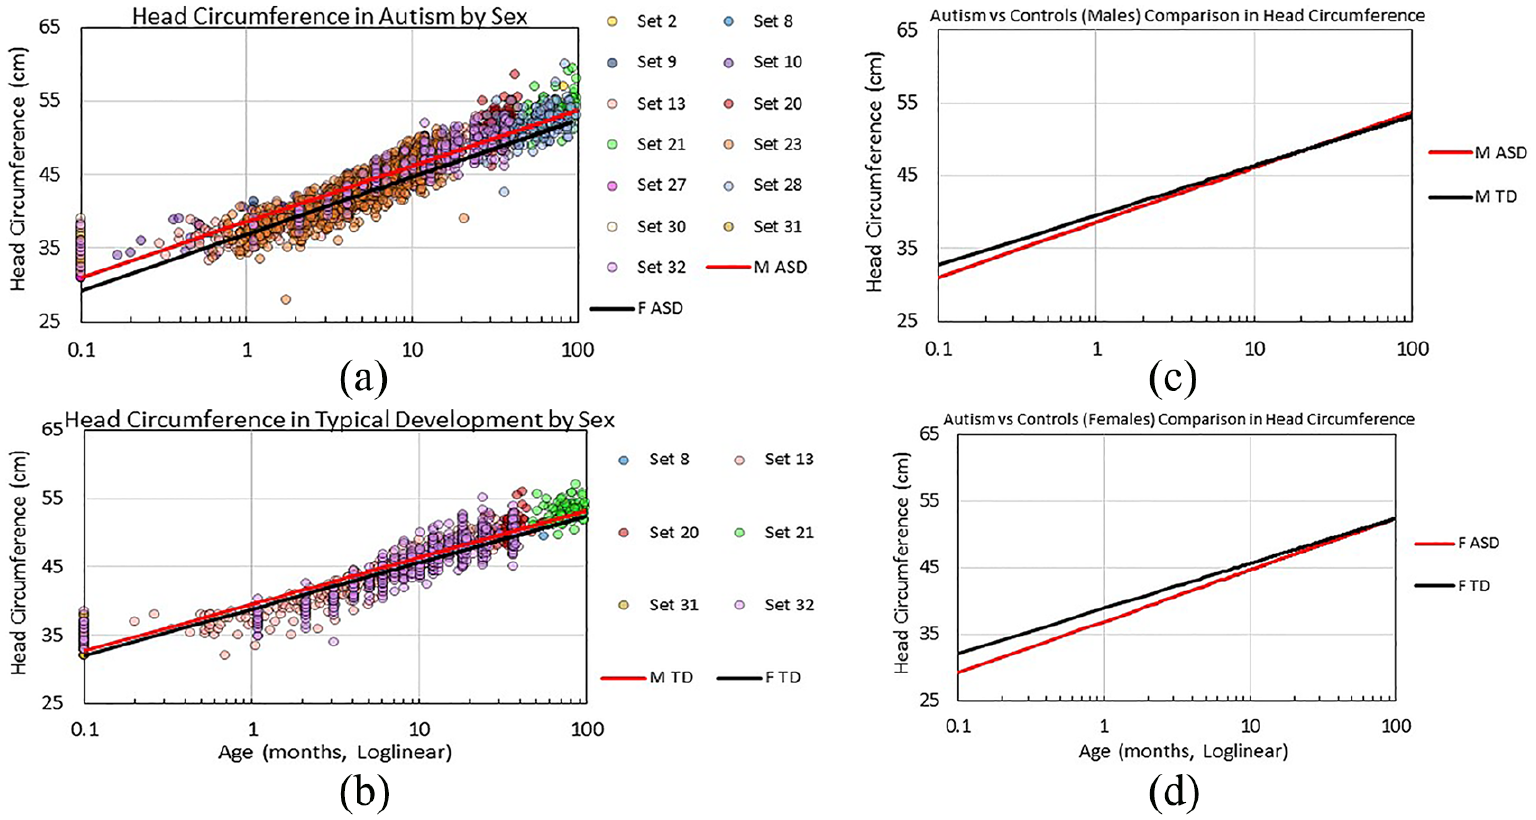
Head circumference data by age with loglinear fits: (a) for ASD; (b) for TD; (c) comparison between male ASD and TD models; and (d) comparison between female ASD and TD models.

Head circumference data by age younger than 1 month with loglinear fits: (a) for ASD; (b) for TD; and (c) comparison between ASD and TD models.
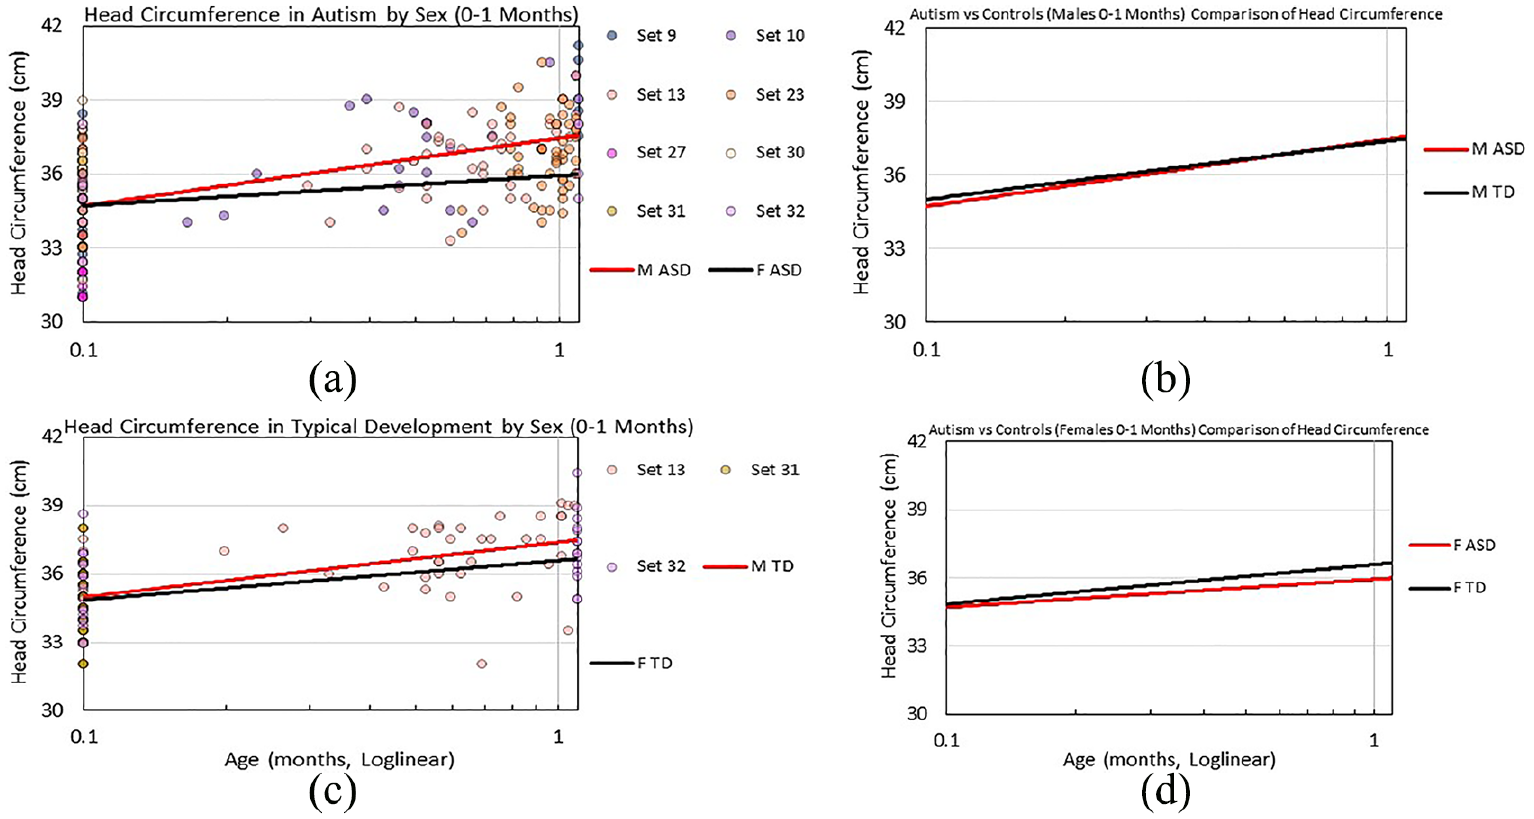
Head circumference data by age younger than 1 month with loglinear fits: (a) for ASD; (b) for TD; (c) comparison between ASD and TD models; and (d) comparison between female ASD and TD models.

Head circumference data by age older than 1 month with loglinear fits: (a) for ASD; (b) for TD; and (c) comparison between ASD and TD models.
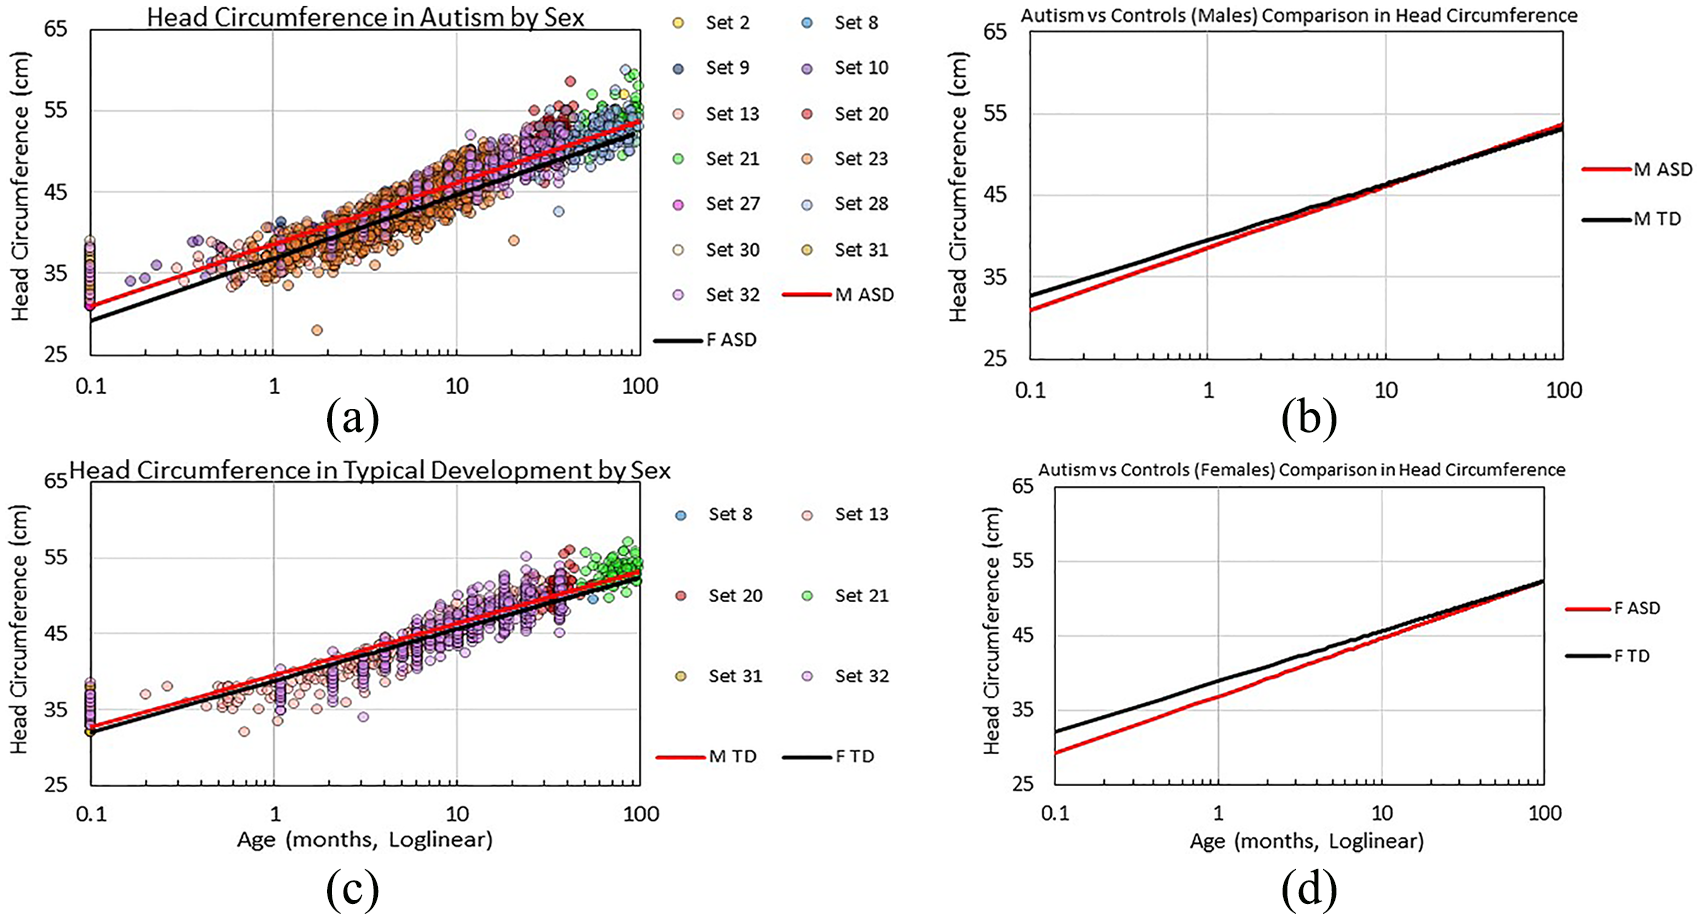
Head circumference data by age older than 1 month with loglinear fits: (a) for ASD; (b) for TD; (c) comparison between ASD and TD loglinear models; and (d) comparison between female ASD and TD models.
Loglinear fits R2 for head circumference data.

ASD: autism spectrum disorder; TD: typically developing.
Significant difference before Bonferroni adjustment (p < 0.05); shaded cell indicates significant difference following Bonferroni adjustment (p < 0.006).
Despite the strong effect sizes found in Figures 2 and 3, the lines of fit in these figures do not adequately fit the data. When examining the data collectively, and when separating them into males and females, these figures appear to have a discontinuity at or near 1 month of age, suggesting there may be separate trends below 1 month from that above 1 month of age. Consequently, we re-analysed the data, splitting data by this age cut-off (see Figures 4 to 7).
Figure 4(c) compares lines of fit of HC for autistic and TD participants between birth and 1 month of age. Although the fit for autism was lower than TD (Figure 4), the intercepts and slopes of these lines of fit were not different from each other (see Table 2). Male and female data provided slightly different trends (Figure 5). For male data, the autism and TD lines of fit were similar between birth and 1 month of age. For female data, the autism and TD line of fit were equivalent at birth. After birth, the TD line of fit diverges above the autism fit. Nonetheless, the intercepts and slopes of the autism and TD lines of fit of male and female data were not different from each other.
For those older than 1 month, the autism and TD fit models are located more centrally through the data, providing a more balanced description, though the fit values are slightly weaker (see Table 2, Figure 6(a) and (b)). The fits for autism and TD older than 1 month of age appear similar (Figure 6(c)); however, the intercepts were different between the fits (Table 2). Figure 7 presents data for males and females older than 1 month. Effect sizes were strong (Table 2), and examination of the fit models suggests a more centrally located fit model (Figure 7(a) and (b)). Figure 7(c) and (d), respectively, reveals similar trends between autistic and TD males and autistic and TD females for those older than 1 month. Although different slopes in the autism and TD lines of fit are evident in females older than 1 month (Table 2), this is likely due to the lack of female TD data between 1 month and 2 months. As would be expected, females consistently had smaller HC than males (Figure 7(a) and (b)).
Differences between autistic and TD participants are reported in Table 3. For each age group, mean differences in HC were not evident between autistic and TD participants. However, a sex by diagnosis interaction occurred between 12 and 17 months of age. Simple effects analyses at this age range revealed autistic females to have smaller HC than TD females (F(1,65) = 4.16, p < 0.05, η = 0.06).
Assessment of differences in head circumference between diagnostic groups.

ASD: autism spectrum disorder; TD: typically developing; N/A: not applicable.
Effect size calculated by partial eta-squared.
Sex by diagnosis interaction could not be tested.
Significant sex by diagnosis interaction.
Significant age by diagnosis interaction.
<0.05.
The frequency of autistic and TD participants with normal and extreme HC at various age groups can be seen for males (Table 4) and females (Table 5). Among those at birth, compared to controls, autistic males were 4.10 and 9.03 times more likely to have an HC 1.5 SD above and below the mean, respectively. Between 6 and 11 months, the frequency of extremely small head size was 4.80 times greater in the autism than in the TD male sample. Autistic, compared to TD, males between 12 and 17 months were 5.06 times more likely to have an extremely large HC. In addition, autistic males between 60 and 100 months were 5.28 and 6.31 times more likely to have an extremely large and extremely small HC than controls, respectively. For females at birth, autistic participants were 1.89 times less likely to have an HC 1.5 SD above and below the mean than controls. Between 36 and 59 months, autistic, compared to TD, females were 7.40 and 9.87 times more likely to have an extremely large HC and an extremely small HC, respectively.
Comparison of extreme head size between autistic and typically developing males.
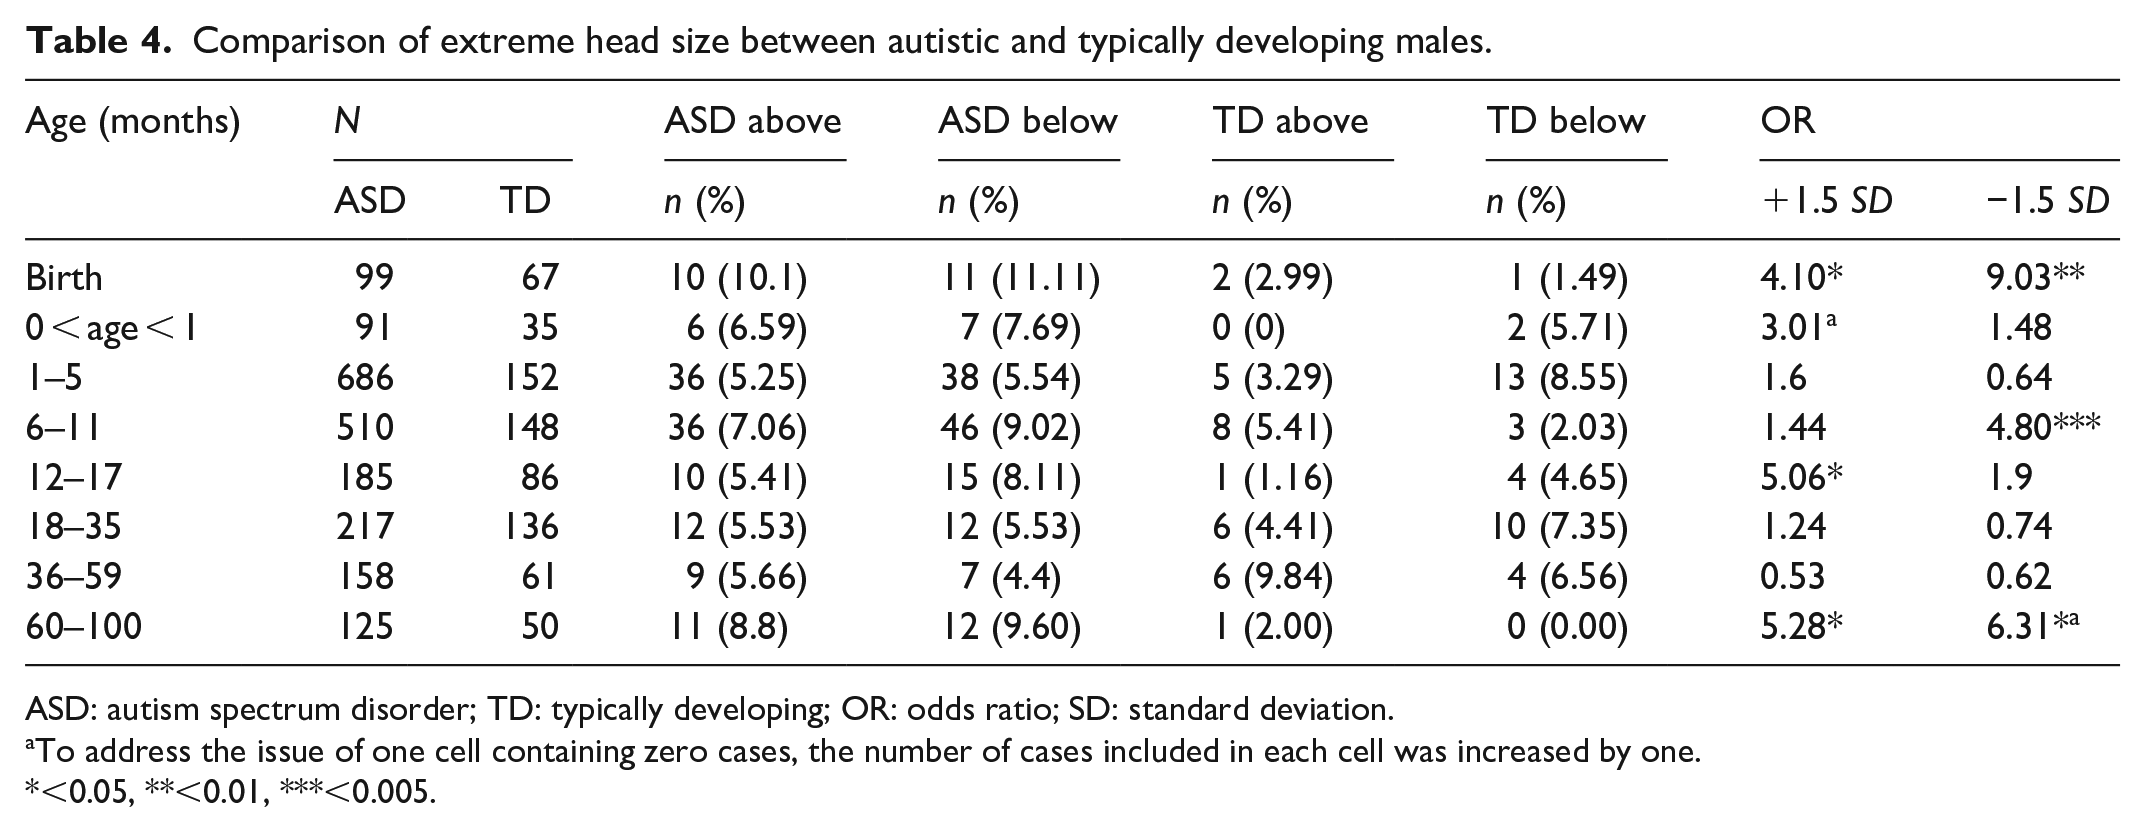
ASD: autism spectrum disorder; TD: typically developing; OR: odds ratio; SD: standard deviation.
To address the issue of one cell containing zero cases, the number of cases included in each cell was increased by one.
<0.05, **<0.01, ***<0.005.
Comparison of extreme head size between autistic and typically developing females.
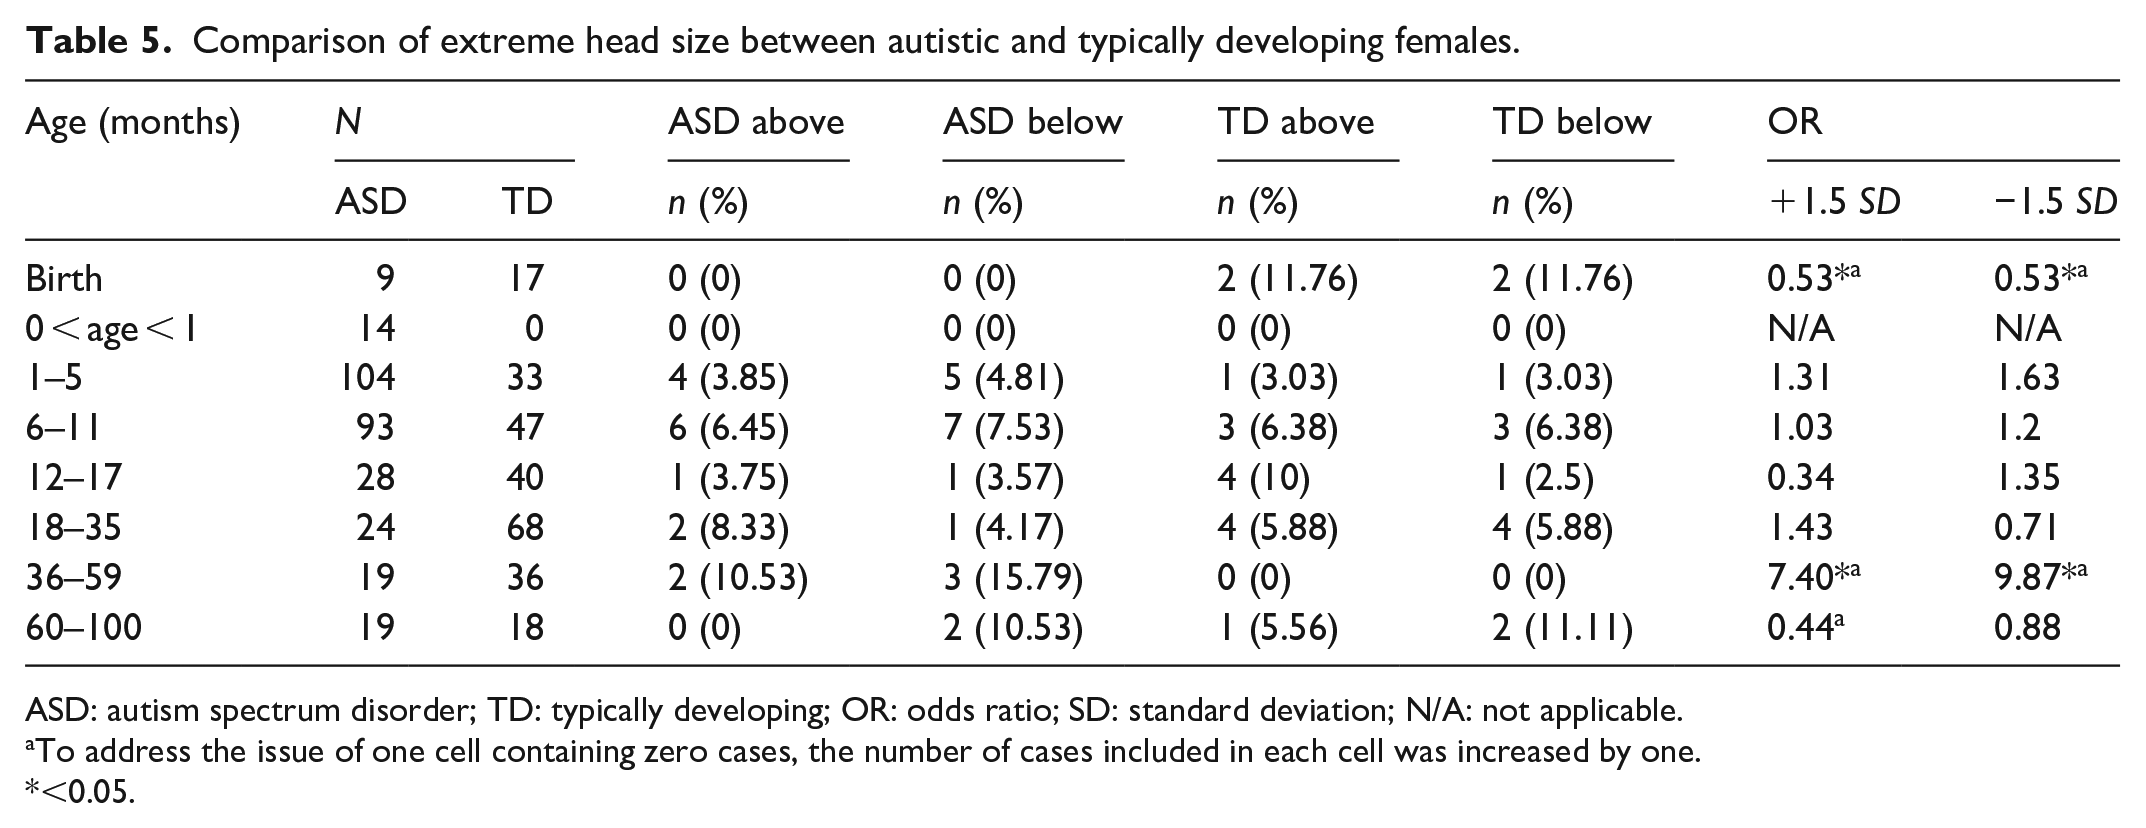
ASD: autism spectrum disorder; TD: typically developing; OR: odds ratio; SD: standard deviation; N/A: not applicable.
To address the issue of one cell containing zero cases, the number of cases included in each cell was increased by one.
<0.05.
Discussion
The aim of this analysis was to collect and compare raw HC and age to contrast the HCs of autistic and TD individuals. Consequently, the variance of HC in autistic participants can be more effectively compared to the neurotypical population than previous meta-analytic methods (Sacco et al., 2015). The present study found that autistic and TD participants did not differ in mean HC. A sex by autism diagnosis interaction was revealed between 12 and 17 months; simple effects analysis highlighted autistic, compared to TD, females to have greater mean HC. In addition, assessment of the frequency of extreme head size in males was found to be more common at birth and between 60 and 100 months. The frequency of extremely small HC between 6 and 11 months, and extremely large HC between 12 and 17 months, was also greater in autistic than in TD males. For autistic, compared to TD, females, extreme head size was more frequent between 36 and 59 months and less likely at birth. We conclude that the variability of HC, rather than mean HC, is different in autistic individuals compared to controls, and that future research should emphasise the variability of HC in autism, rather than comparing mean data.
Unlike the mean group comparisons, extreme head size cases varied between autistic and TD participants at birth. Compared to controls, while autistic males were more likely to have extreme head size, autistic females were less likely to have extreme head size. Studies investigating extreme head size at birth are scarce; Torrey et al. (2004) concluded greater rates of macrocephaly, but not microcephaly, in a limited sample of autistic participants (n = 15). Because of limited female data and a disproportionally high percentage of TD females with extremely small and extremely large head size, findings of the present study regarding female participants at birth should be interpreted cautiously. Nonetheless, such discrepant findings between males and females indicate the potential of sex and autism diagnosis when predicting extreme head size. The present study has shown that rather than focusing on mean HC in autistic infants at birth, the focus needs to shift to extreme head size. Future research should investigate the phenotype of these autistic infants with extremely head size. This investigation may provide clinicians with a feasible technique to identify a specific phenotype of autism.
Between 18 and 60 months, the frequency of extreme HC was not different between autistic and TD males in the present study. Reports of past studies regarding macrocephaly in autistic participants in this age range are inconsistent. While some studies report similar macrocephaly rates in autistic participants compared to controls, consistent with the present study (Cederlund et al., 2014; Davidovitch et al., 2011; Torrey et al., 2004), other past studies concluded a greater frequency of macrocephaly in autistic than in TD children (Fombonne et al., 1999; Lainhart et al., 2006). These past studies measuring macrocephaly in autistic children compared to TD children between 18 and 60 months, as well as the present study, did not control for height. Hence, these discrepant findings may be attributed to the height of the participants. Future studies should control for height when measuring macrocephaly in autistic individuals between 18 and 60 months.
Cases of extreme head size were more frequent in the autism than in the TD sample between 60 and 100 months in the present study. These findings highlight an important abnormality in autism that would not have been noted had only means been compared (aka traditional meta-analysis). The findings of extremely large HC confirm previous reports (Sacco et al., 2015). The literature also concludes that mean HC is not different between autistic and TD participants between 60 and 100 months (Cheon et al., 2011; Prigge et al., 2013; Valvo et al., 2016), despite increased rates of macrocephaly in autism within this age range (Sacco et al., 2015). Hence, the finding of the present study regarding increased rates of extremely small HC in autistic individuals is in line with literature. These findings may expand on the phenotype of autism macrocephaly previously identified at 3 years, and in 5- and 6-year old children (Amaral et al., 2017). Future research should, if possible, investigate the phenotype of autistic participants with extremely small heads in this age group, as well as the phenotype of older autistic individuals with extremely small and large head size.
The present study also highlighted differences in HC between autistic and TD females yet to be investigated in the autism literature. Compared to controls, autistic females had smaller mean HC between 12 and 17 months, and a greater frequency of extremely small, and extremely large, head size between 36 and 59 months. These findings have the scope to influence future diagnostic assessment of autism for female preschool children in a feasible and cost-effective manner. Considering that the male-to-female autism ratio is not as high as previously thought (Lai et al., 2017), it is imperative for clinicians to be provided with autism research of female data. It is critical for future research to confirm these findings of the present study in a larger sample of females controlling for confounding variables such as height.
The presence of autism-related genetic disorders may also influence outliers of HC in autism research. Although we did not screen participants for genetic disorders in the present study, past research studies have found autistic individuals with disorders such as DYRK1A and PTEN mutations to more likely be outliers of HC than expected (Butler et al., 2005; O’Roak et al., 2012). As familial studies conclude siblings and parents of autistic individuals to have larger HC than expected (Elder et al., 2008; Fidler et al., 2000), exploring the role of these genetic mutations is crucial when explaining HC trends in autism. The extent in which genetic mutations mediate the relationship between autism diagnosis and HC should be further pursued in future research.
Limitations
Despite the comprehensive nature of this dataset, it is limited by a lack of control for some important confounding variables when describing the relationship between HC and autism status: height, weight, cultural identity and intelligence quotient (IQ; Chaste et al., 2013). Consequently, we could not replicate past research (Amaral et al., 2017) when comparing rates of extreme HC between autism and TD data (i.e. control for height), use gestational age for participants at birth, investigate the presence of low-functioning autism in autistic children with large HC or match autistic cases by their population. Furthermore, data were lacking in some areas. For instance, due to an absence of raw data, analyses could not be conducted for participants over 9 years of age, and the fits to female TD data could not be interpreted with confidence. Hopefully, further data will be available in the near future. Finally, some past studies measuring HC in autistic individuals were not included in the present study for two reasons: other studies have been published since the systematic search was performed (e.g. Dinstein et al., 2017) and data of some studies that did not report relevant age and HC data were not available, despite requesting for this information via email. Hopefully, the provision of raw data upon request in line with an open science approach will become a more widely adopted standard in the future.
Conclusion
The alternative re-analysis approach presented in the current study captures the variance in the data more effectively than traditional meta-analytic methods. As opposed to summarising effect sizes, collecting raw HC data ensures outliers are properly accounted for. The present study cannot confirm HC to be greater in autistic than in TD participants between 0 and 100 months. Rather, we can conclude there exists a disproportionate frequency of extreme cases of HC in autistic than in TD males and females at varying age ranges. We conclude that future research should emphasise the variability of HC in autism, rather than comparing mean data.
Footnotes
Acknowledgements
We would like to thank the authors whom provided data to be included in the present study. Also, thank you to Professor David Amaral for providing comments and suggestions and to Dr David Skvarc for statistical analysis assistance.
Declaration of conflicting interests
The author(s) declared no potential conflicts of interest with respect to the research, authorship and/or publication of this article.
Ethical approval
All procedures performed in studies involving human participants were in accordance with the ethical standards of the institutional and/or national research committee and with the 1964 Helsinki declaration and its later amendments or comparable ethical standards.
Funding
The author(s) received no financial support for the research, authorship and/or publication of this article.
