




Abstract
Autism spectrum disorder and co-occurring symptoms often require lifelong services. However, access to autism spectrum disorder services is hindered by a lack of available autism spectrum disorder providers. We utilized geographic information systems methods to map autism spectrum disorder provider locations in Michigan. We hypothesized that (1) fewer providers would be located in less versus more populated areas; (2) neighborhoods with low versus high socioeconomic status would have fewer autism spectrum disorder providers; and (3) an interaction would be found between population and socioeconomic status such that neighborhoods with low socioeconomic status and high population would have few available autism spectrum disorder providers. We compiled a list of autism spectrum disorder providers in Michigan, geocoded the location of providers, and used network analysis to assess autism spectrum disorder service availability in relation to population distribution, socioeconomic disadvantage, urbanicity, and immobility. Hypotheses were supported. Individuals in rural neighborhoods had fewer available autism spectrum disorder providers than individuals in suburban and urban neighborhoods. In addition, neighborhoods with greater socioeconomic status disadvantage had fewer autism spectrum disorder providers available. Finally, statistically significant spatial disparities were found; wealthier suburbs had good provider availability while few providers were available in poorer, urban neighborhoods. Knowing autism spectrum disorder providers’ availability, and neighborhoods that are service deserts, presents the opportunity to utilize evidence-based dissemination and implementation strategies that promote increased autism spectrum disorder providers for underserved individuals.
Lay abstract
Autism spectrum disorder and co-occurring symptoms often require lifelong services. However, access to autism spectrum disorder services is hindered by a lack of available autism spectrum disorder providers. We utilized geographic information systems methods to map autism spectrum disorder provider locations in Michigan. We hypothesized that (1) fewer providers would be located in less versus more populated areas; (2) neighborhoods with low versus high socioeconomic status would have fewer autism spectrum disorder providers; and (3) an interaction would be found between population and socioeconomic status such that neighborhoods with low socioeconomic status and high population would have few available autism spectrum disorder providers. We compiled a list of autism spectrum disorder providers in Michigan, geocoded the location of providers, and used network analysis to assess autism spectrum disorder service availability in relation to population distribution, socioeconomic disadvantage, urbanicity, and immobility. Individuals in rural neighborhoods had fewer available autism spectrum disorder providers than individuals in suburban and urban neighborhoods. In addition, neighborhoods with greater socioeconomic status disadvantage had fewer autism spectrum disorder providers available. Finally, wealthier suburbs had good provider availability while few providers were available in poorer, urban neighborhoods. Knowing autism spectrum disorder providers’ availability, and neighborhoods that are particularly poorly serviced, presents the opportunity to utilize evidence-based dissemination and implementation strategies that promote increased autism spectrum disorder providers for underserved individuals.
Keywords
Socioeconomic health disparities predict inaccessibility to high-quality evidence-based care, and lead to adverse health outcomes for millions of Americans. Recently, attention has been paid to additional factors that may impact disparate healthcare access and outcomes of large subgroups of the population, including disability status (DeGuzman et al., 2018). Indeed, when applied to autism spectrum disorder (ASD) (Bishop-Fitzpatrick & Kind, 2017; Link & Phelan, 1995), the Fundamental Causes Model of Health Disparities asserts that ASD status interacts with additional determinants of health (i.e. race, neighborhood-level socioeconomic status) to influence health outcomes through multileveled proximal causal pathways. That is, individuals with ASD—who are additionally disadvantaged—experience further heightened risk for adverse health outcomes through the pathways of access to ASD evidence-based practices (EBPs) compared to both the general population and to individuals with ASD who are not members of disparity groups (Bishop-Fitzpatrick & Kind, 2017; Croen et al., 2015; Hirvikoski et al., 2016). EBPs are defined as treatments, services, or clinical practices found to be efficacious and/or effective through the integration of available research and clinical expertise in the context of patient characteristics, culture, and preferences (APA Presidential Task Force on Evidence-Based Practice, 2006; Chambless & Hollon, 1998).
Service disparities for individuals with ASD
Throughout their lives, individuals with ASD access services less frequently and receive care that is of lower quality compared with individuals with other disabilities (Bitterman et al., 2008; Chiri & Warfield, 2012; Montes et al., 2009; Tregnago & Cheak-Zamora, 2012). For example, families of children with ASD have greater difficulty accessing educational and healthcare services and have higher unmet service needs compared with families of children with other special health-care needs (Chiri & Warfield, 2012; Kogan et al., 2008). Furthermore, they are less likely to receive family centered care (Vohra et al., 2014) and experience greater dissatisfaction with services (Bitterman et al., 2008; Montes et al., 2009). In adulthood, differences in service utilization between autistic adults and adults with other developmental disabilities are largely driven by the presence of intellectual disability, which determines service eligibility in most U.S. states and makes comparison difficult (Roux et al., 2016). However, autistic adult Medicaid beneficiaries in Wisconsin without co-occurring intellectual disability utilize fewer health services compared with adults with intellectual disability alone, while autistic adults with co-occurring intellectual disability utilize similar levels of health services to adults with intellectual disability alone (Rubenstein & Bishop, 2019). Disparities in receipt of services in childhood and adulthood may mechanistically determine social functioning and health quality for autistic people in mid- to late-life (Bishop-Fitzpatrick et al., 2018; Woodman et al., 2016).
Research on service disparities in ASD has noted additional factors that influence an individual’s likelihood of receiving an ASD diagnosis and accessing quality ASD treatment services. For example, rural families of children with ASD experience greater service access difficulties due to limited service availability and transportation difficulties. Specifically, although population-based epidemiological studies have demonstrated that rates of ASD are similar in rural (1.6%) and urban areas (1.9%; National Survey of Children’s Health, 2011–2012), non-population-based studies have found rates of ASD in urban areas to be 2.5 times higher in urban than rural areas (Williams et al., 2006). Indeed, a later age of diagnosis is found in rural versus urban areas (Chen et al., 2007; Mandell et al., 2005), with age of diagnosis positively related to proximity to a medical school (Kalkbrenner et al., 2011). Furthermore, parents of children with ASD report greater challenges accessing trained physicians and professionals in their area than urban families (Murphy & Ruble, 2012) and express concerns regarding fewer choices for services, education placement, and personnel (Applequist, 2009; Mello et al., 2016).
Disparities in access to quality autism care are influenced by additional social determinants of health, including family-level and neighborhood-level socioeconomic status (SES) and racial and ethnic minority status (Durkin et al., 2010; Liptak et al., 2008; Pickard & Ingersoll, 2016). Children from low SES households and racial and ethnic minority families are less likely to receive a diagnosis of ASD, and experience a later age of diagnosis than higher SES and nonracial and ethnic minority families (Durkin et al., 2010; Mandell et al., 2002, 2009; Zuckerman et al., 2014). Since autism intervention services in the United States are usually tied to a diagnosis, delayed diagnosis results in delayed service access, which can lead to poorer long-term outcomes (Dawson, 2008). Furthermore, lower SES and racial and ethnic minority families utilize fewer early intervention and ASD-specific services (Broder-Fingert et al., 2013; Magaña et al., 2013; Pickard & Ingersoll, 2016), have more difficulty accessing services (Liptak et al., 2008; Stahmer et al., 2019), report a greater number of unmet service needs (Hodgetts et al., 2015), and experience a lower level of satisfaction with current services (Stahmer et al., 2019). Data also suggest that in adulthood, African American and low-income autistic adults are less likely to receive services than their White and middle- to high-income peers (Shattuck et al., 2011), suggesting that racial and socioeconomic disparities affect service access and utilization throughout life.
The mechanisms that account for lower access to quality services among low SES and racial and ethnic minority families are not completely clear; however, a number of structural and family-level barriers have been proposed. For example, the high cost of service, lack of health insurance, transportation difficulties, and inflexible work schedules have all been proposed as consumer-based structural barriers that drive access disparities in low SES families of children with ASD (Patten et al., 2013; Pickard & Ingersoll, 2016; Porterfield & McBride, 2007). These barriers may also impact racial and ethnic minority families who are overrepresented among low-income families in the general population (Williams et al., 2016). Family-level differences in health literacy (Pickard & Ingersoll, 2016; Porterfield & McBride, 2007), empowerment (Zuckerman et al., 2014), and parent–professional partnerships (Casagrande & Ingersoll, 2017) have also been used to explain lower levels of service access among low SES and racial and ethnic minority families. In addition, neighborhood-level socioeconomic disadvantage has been found in the general population to impact health over and above individual-level SES (Leventhal & Brooks-Gunn, 2003). The degree to which geographical availability and neighborhood-level socioeconomic disadvantage contributes to ASD service availability and access difficulties for low-income, rural, and/or racial and ethnic minority families has not yet been examined, however.
Characterizing the degree to which geographic availability of services contributes to service access difficulties is particularly urgent given that the prevalence of individuals diagnosed with ASD is rising in the United States (Steinbrenner et al., 2020; Baio et al., 2018; Christensen et al., 2018). To help guide the evaluation of the ASD service landscape, an empirically derived conceptual framework—the Patient Centered Access to Healthcare Conceptual Framework (Figure 1)—has recently been introduced into the service research literature. This framework defines service access as “the opportunity to reach and obtain appropriate health care services in situations of perceived need for care” (Levesque et al., 2013, p. 4). It identifies five healthcare provider (supply-side) and healthcare service consumer (demand-side) domains that are posited to influence access to needed services.
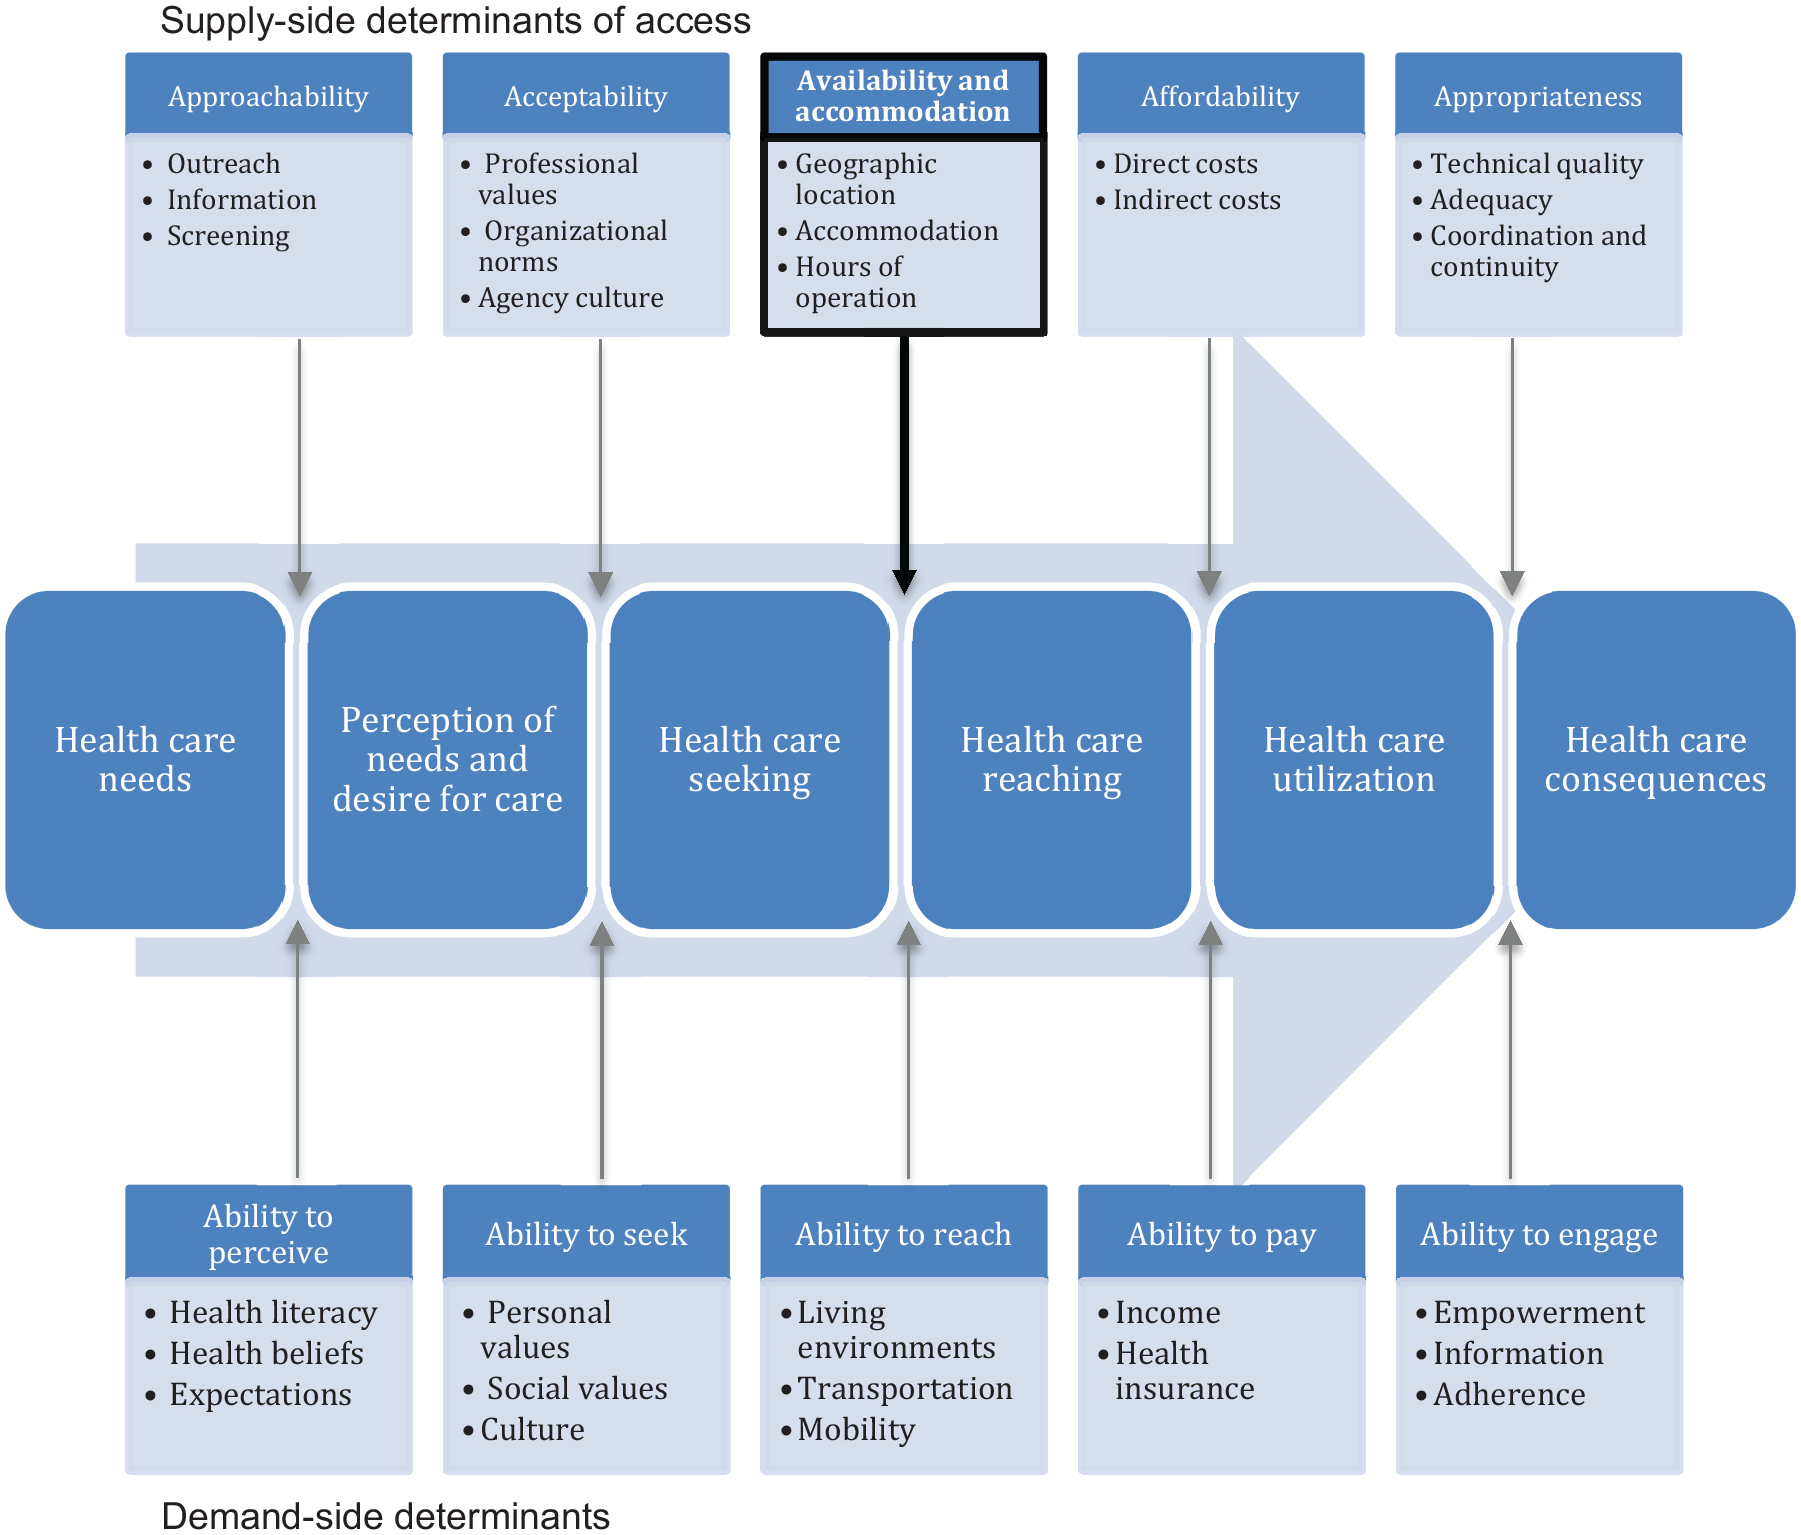
Patient-centered access to healthcare conceptual framework (adapted from Levesque et al., 2013).
As summarized above, much of the extant research has focused on the facilitators and barriers to service access by healthcare service consumers and their families. Few studies have investigated supply side ASD service access domains, and fewer yet have explored specific domains within this framework (Brookman-Frazee et al., 2010; Brookman-Frazee & Stahmer, 2018; Kerns et al., 2019; Locke et al., 2016; Stadnick et al., 2018). Specifically, factors that influence the supply of needed services include (1) approachability, (2) acceptability, (3) availability and accommodation, (4) affordability, and (5) appropriateness. Understanding supply side factors influencing ASD service access may be especially promising for system- or policy-level interventions. The purpose of this study is to evaluate community-based ASD service availability—services that can be reached physically and in a timely manner—by individuals with ASD and their families in a geographically and socioeconomically diverse Midwestern state of the United States of America.
GIS to evaluate availability of ASD services
The fields of geography and geographic information science (GISci) have been revolutionized by the rapid growth of geographic information systems (GIS). Before the advent of these computer-based mapping systems, geographical work required time-intensive manual digitizing of data points, overhead transparencies were the preferred method for “overlaying” data, and limited analytical possibilities existed. With GIS computer software, users can now easily create, modify, store, and analyze any data with a spatial reference point (Environmental Systems Research Institute, 2018). The power of GIS lies in its ability to layer information, and key analytic approaches include measuring proximity to features, looking for clusters in data, and examining coincidence of related spatial and aspatial factors.
While GIS has become widely available for use, methodological challenges and required technical knowledge have meant limited effective incorporation into subjects outside the traditional purview of geography (Sadler & Lafreniere, 2017), including health services research. Some such areas of relevance to this article include measuring access to grocery stores or healthcare facilities (Burns & Inglis, 2007; Langford & Higgs, 2006; Pearce et al., 2006), and then using that information to determine whether relationships exist between the composition of the built environment and, for instance, diet or healthcare utilization.
Likewise with work that identifies “food deserts” or “food oases,” the identification of service deserts or service oases (with respect to any number of amenities) can help practitioners, decision-makers, and researchers in understanding gaps in services and proposing meaningful ways forward. Yet, measuring these gaps must be done with rigor, paying special attention to best practices within GIS and not using arbitrary “bins.” Given that many resource gaps exist according to population density or neighborhood-level SES, it is important to examine such gaps rigorously with an eye toward enhancing equity and achieving social justice for people on the autism spectrum, especially individuals from low SES and who identify as racial and ethnic minorities (Bishop-Fitzpatrick & Kind, 2017).
Aim of study
As a response to the paucity of literature related to the availability of community-based ASD services, this study utilized GIS methods to map the locations of ASD agencies across the state of Michigan. Then, we layered census population and neighborhood socioeconomic disadvantage data to evaluate the influence of these sociodemographic factors—such as urbanicity, neighborhood SES, and immobility—on the map of ASD community-based service locations. Current prevalence estimates of ASD in youth in Michigan range from 1.12% to 2.8% (Child and Adolescent Health Measurement Initiative, 2016–2017; Division of Birth Defects, National Center on Birth Defects and Developmental Disabilities, Centers for Disease Control and Prevention, 2019). These estimates are highly similar to national estimates using these same datasets.
Hypotheses
We hypothesized that population, neighborhood SES, and a population by neighborhood SES interaction will be associated with the availability of ASD services as follows:
Population will be correlated with the availability of services such that fewer agencies will be located in less populated areas compared with more populated areas;
Neighborhood SES will be correlated with the availability of ASD services such that areas with low neighborhood SES will have fewer ASD services compared with neighborhoods with medium and high SES;
An interaction will be found between population and neighborhood SES such that areas with low SES and high population densities will have fewer available ASD services compared to areas with medium or high SES and high population densities.
Method
Geocoding ASD providers
We compiled a list of ASD providers within Michigan by conducting a systematic, iterative web-based search by county (search protocol available from first author). First, we searched specific provider databases, including (1) Autism Society of Michigan, (2) Autism Link, (3) MI Neighborhood Directory, and (4) Family Hope Foundation. Thereafter, we conducted specific searches for terms, including the following: (1) “ASD” OR “autism” OR “developmental disabilities” and (2) “special education” OR “agencies” OR “services” OR “resources” OR “therapies.” Providers were included in the database if the provider’s website specified the delivery of educational, behavioral, and medical care or treatment for individuals of any age with ASD. Excluded from entry into the database were parent groups, residential communities, respite services, chiropractors, dentists, dieticians, or animal therapies. Web-based searches for ASD providers within each Michigan County were conducted by two independent research team members and then compared. A third member of the research team reviewed any discrepancies and the final statewide dataset was verified. This was done until no new providers were found in each county.
This search occurred from November 2016 through October 2017. The final list included 352 Michigan ASD providers by provider or agency name, address, and ASD service type (as indicated on the provider website), which were then geocoded using ArcGIS 10.4.1. Almost all (98.9%) of the providers were geocoded to the exact street address. The remainder (1.1%) were geocoded to the finest available location based on available data (nine-digit ZIP code or municipality centroid).
Measuring availability
Many past GIS studies of service availability focus on Euclidean distance or container-based approaches, which involve the use of straight-line buffers (McLafferty, 2003; Moseley et al., 2013; Nicholls & Shafer, 2001). Such linear approaches only identify units that are within set distances, while container-based approaches (e.g. census units, municipalities) fail to account for facilities just outside the area of interest, a phenomenon known as the edge effect (Sadler et al., 2011). Neither approach accounts for natural features such as topographical or water-based features that can affect the placement and connectivity of roads and ultimately the accessibility of services (Nicholls & Shafer, 2001). While some standard containers can have some utility owing to their political status (e.g. states, counties, and cities), most buffers are unique to individual studies and thus incomparable with other known statistics. To account for this, we employed two measures of availability to services and calculated their relationship to urban, suburban, and rural populations. Both make use of network analysis with a 2016 Michigan street file collected from the U.S. Census Bureau.
The first measure uses census block group (CBG) centroids to determine the distance from each population unit to nearby ASD providers. The Closest Facility tool within ArcGIS 10.4’s Network Analyst extension (ESRI) was used to identify the net road distance to the nearest provider. This enables the calculation of averaged distance measures for urban, suburban, and rural populations based on the classification of each CBG, and these values can be aggregated to known container-based units like counties and municipalities.
The second measure used the Service Area tool within ArcGIS 10.4 to generate 10-mile service areas around each ASD provider. Identifying 10-mile service areas has been used in other studies to help measure accessibility to healthcare services (Croft et al., 2016; Gibson et al., 2014). Thereafter, we identified the total population within the CBGs whose centroids fell within these 10-mile service areas in order to identify the number of people within a reasonable distance to ASD services. This methodology also enabled us to identify how much of the Michigan population has easy access to specific ASD services, including behavioral, mental health, educational, and medical ASD services.
Classifying urbanicity
To test the hypotheses that (1) fewer ASD providers are located in rural areas than in more populated areas and (2) fewer providers are located in dense population areas with low neighborhood SES, we differentiated between urban, suburban, and rural areas in our GIS. 1 The 2017 Adjusted Census Urban Boundary (ACUB) file was obtained from the State of Michigan GIS Open Data (2018) portal. It identifies urban cluster areas with at least 5,000 people and urban areas with greater than 50,000 people but it does not specifically classify suburban areas. To correct for this, a Minor Civil Divisions layer was used to identify city boundaries as they existed prior to the postwar period. In Michigan, city boundaries are an excellent proxy for the urban/suburban divide because after the postwar period, cities were prohibited from unilaterally annexing suburbs. Most post-Baby Boom suburban development therefore exists outside center city limits (Sadler & Highsmith, 2016). The ACUB overlaps with current boundaries of identified center cities that were classified as urban, while the remainder of the ACUB file was classified as suburban. Rural boundaries made up the balance of the state of Michigan not inside an ACUB.
SES
To examine the relationship between neighborhood (SES) and ASD provider availability, we calculated the relative neighborhood SES of each CBG. Demographic census information from the latest 2016 American Community Survey (ACS) release was downloaded from the National Historical Geographic Information System (Minnesota Population Center, 2016). Neighborhood SES was calculated using a distress index wherein high positive values indicated more distressed areas (e.g. poor economic standing), whereas high negative values indicated less distressed areas (Larsen & Gilliland, 2008; Sadler et al., 2011). The four variables used to calculate the distress index included (1) the proportion of people at least 25 years old that have not graduated from high school, (2) the proportion of unemployed adults aged 16 and above who are eligible to work, (3) the proportion of single-parent families, and (4) the proportion of households with income below the federal poverty level. Distress index scores were calculated for each CBG by calculating and summing the z-scores for each variable. Distress index scores range from 20.61 (poorest economic standing) to −4.46 (best economic standing).
Immobility
Car ownership is significantly determined by household income (Potoglou & Kanaroglou, 2008). Even so, many people living in poor areas still use personal vehicles to get food, and many of those who do not own vehicles get rides from others rather than walking or using public transportation, if possible (Clifton, 2004). Public transit is substantially less available in rural than in urban and suburban areas (Mattson, 2017), and Michigan’s largest metropolitan area (Detroit) has particularly poor public transit, with few lines connecting the city to its massive sprawl of suburbs (Grengs, 2010; Marans & Kweon, 2011). Even in regions with public transit, the behavioral and cognitive challenges that many individuals with ASD experience can make public transit an untenable means of transportation (Dudley & Zwicker, 2016). Given that the majority of Michiganders live in rural or suburban areas where public transit is typically not available, we used car ownership rather than public transit availability as a measure of immobility. As such, we assume access to ASD services is contingent on automobile ownership. We therefore calculated the percent of households without vehicle ownership for each CBG.
Cluster analysis
Optimized Hot Spot Analysis was used in ArcGIS 10.4 (ESRI) to identify clusters of CBGs with statistically significant high (hot spot) or low (cold spot) concentrations of ASD providers. We then compared these values with similar analyses of CBG SES and immobility (Getis & Ord, 1992; Ord & Getis, 1995). This tool uses the Getis-Ord Gi* statistic to identify high or low values surrounded by similar values of the same extreme, which results in significantly high or low z-scores (Getis & Ord, 1992; Ord & Getis, 1995). Hot-spot analysis is commonly used in health studies, including topics ranging from cancer and pediatric appendicitis to utilization patterns of mobile medical clinics and demand in restricted parking zones (Aarabi et al., 2011; Gibson et al., 2014; Ibeas et al., 2011; Shah et al., 2014).
Results
State-level characteristics
Of the 9,862,663 residents of Michigan, 33.4% live in urban areas, 43.8% live in suburban areas, and 22.8% live in rural areas. By contrast, out of the 352 Michigan ASD providers, 36% are located in urban areas, 47.8% in suburban areas, and 16.2% in rural areas. Most notably, 17 of Michigan’s 83 counties—representing 258,374 residents—do not have a single ASD provider available. All 17 of these counties are more than 99% rural. Figure 2 highlights county-level population, urbanicity, and ASD providers.

Maps of county-level urbanicity and population with the total number of ASD providers.
Table 1 provides averaged statistics for CBGs by level of urbanicity. While rural CBGs have significantly fewer residents per acre, when compared with suburban CBGs, rural CBGs have significantly more people per ASD provider and a significantly greater average distance to reach available ASD providers. Almost 60% of the 2,053,918 rural Michiganders are greater than 10 miles from an ASD provider of any type, while only 3.34% urban and 4.79% suburban Michiganders are outside 10 miles from the nearest ASD provider. When examining availability by service provider type, as few as 2% of people are within 10 miles of medical ASD providers. By contrast, 23% of people are within 10 miles of educational ASD service providers (e.g., school building).
Area-based characteristics based on urbanicity and statistical significance in difference between levels of urbanicity.
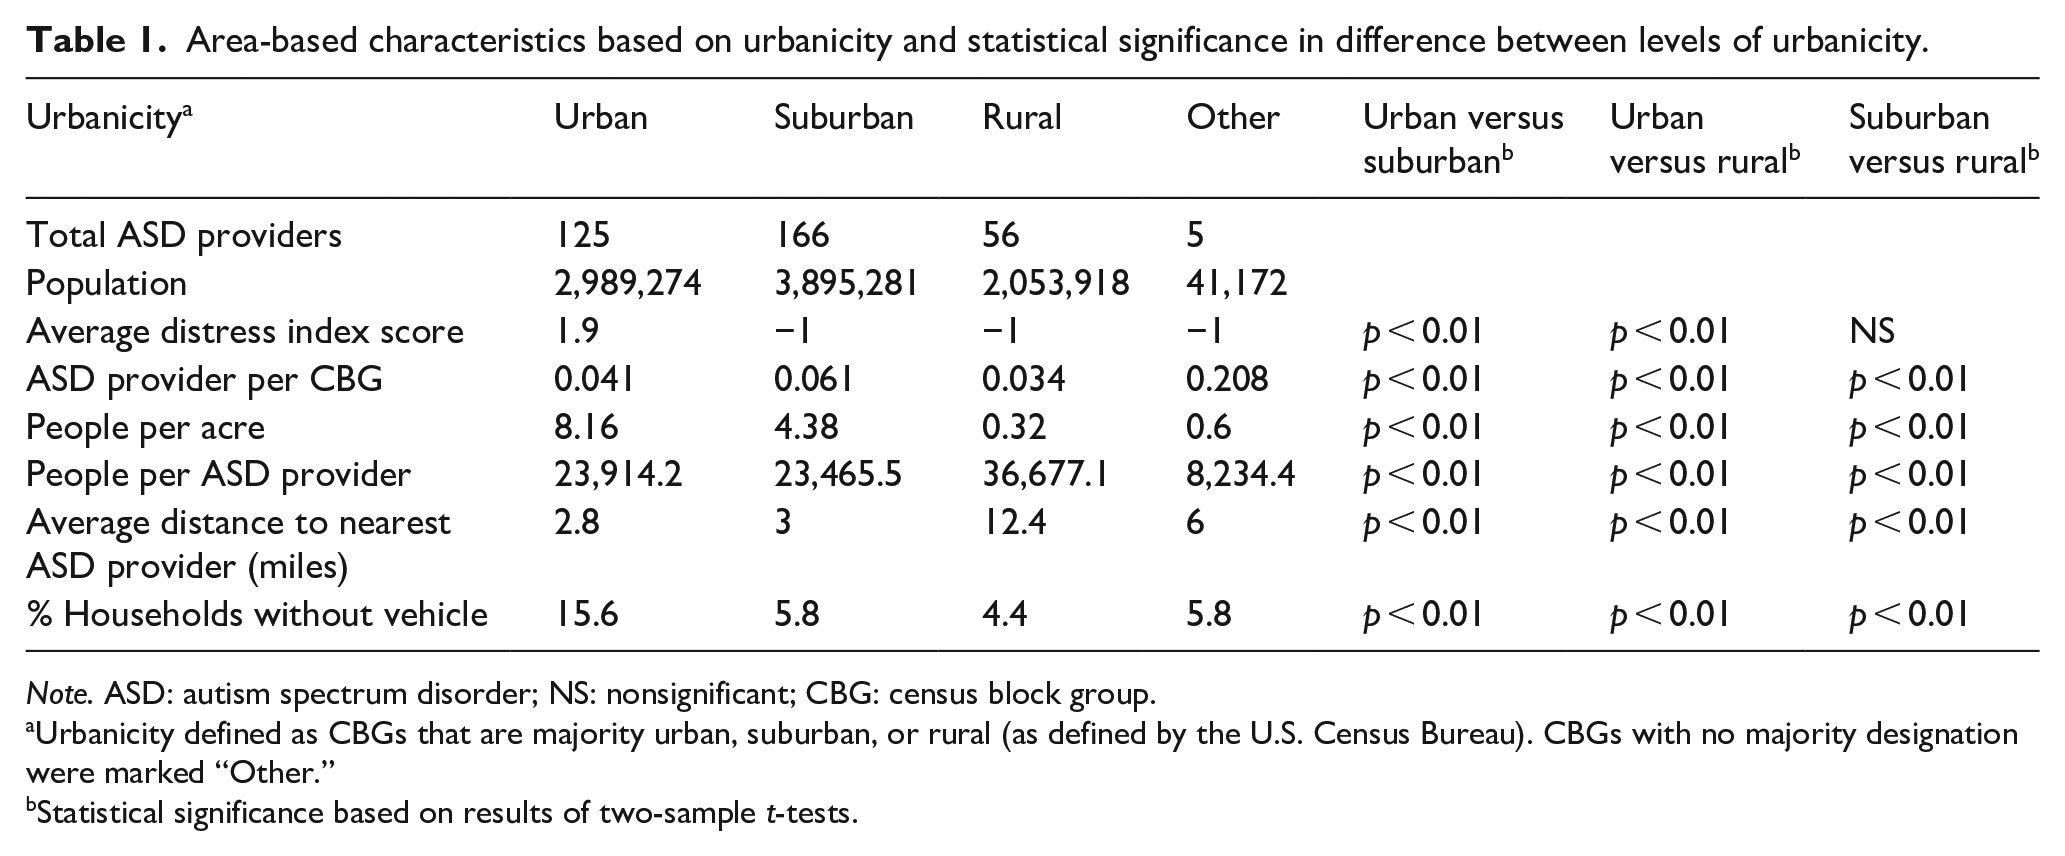
Note. ASD: autism spectrum disorder; NS: nonsignificant; CBG: census block group.
Urbanicity defined as CBGs that are majority urban, suburban, or rural (as defined by the U.S. Census Bureau). CBGs with no majority designation were marked “Other.”
Statistical significance based on results of two-sample t-tests.
Table 2 shows that the rural percentage of CBGs has a strong positive correlation with the distance to ASD providers (r = 0.654, p < 0.001).
Correlations among distress index score, ASD access measures, and urbanicity.

Note. ASD: autism spectrum disorder.
p < 0.001.
Yet while residents living in urban areas are generally closer to ASD providers (Table 1), inequities still exist within these areas. Urban populations have significantly higher distress index scores—indicating poorer neighborhood SES, significantly higher population density, and few (<16% of urban households) personal vehicles, which are all significant compared with both suburban and rural populations. According to Newman and Kenworthy (2006), 10 min is the amount of time most people will take to access local amenities within urban areas. In a study of normal walking speed, Bohannon and Andrews (2011) found a maximum walking speed of approximately 3.47 miles/hour. This suggests that fast walkers may be able to travel 0.58 miles in 10 min, far short of the urban ASD provider average distance of 2.38 miles.
In addition, due to vast differences in city-level SES and urban sprawl patterns within urbanized areas, we explored the relationship between low SES urban CBGs and high SES urban CBGs (inset in Table 1). Almost 58% of urban Michiganders live in low SES urban areas, yet almost 62% of urban ASD providers are in high SES areas.
Effectively, each low SES urban ASD provider must provide services for more than twice the population of providers located in high SES urban areas. In comparison, low SES urban areas have nearly the same dearth of providers as rural areas. Moreover, low SES urban CBGs also have a significantly higher number of people per acre and a significantly longer distance to travel to the nearest ASD provider when compared with high SES urban CBGs.
Spatial Autocorrelation (Moran’s I) was used to determine whether the spatial distribution of ASD providers was random. We discovered this distribution was not random and, in fact, skewed significantly toward wealthier suburban areas (p < 0.01, Moran’s Index < 0.01). Figure 3(a) displays Getis-Ord Gi* clustering analysis for ASD providers and focuses on the only statistically significant cold-spot (e.g., area with few ASD providers), while Figure 3(b) displays this analysis for neighborhood SES statewide. “Cold spot” and “hot spot” analyses provide outcomes related to neighborhoods that are significantly underserved (a service desert) or overserved (a service oasis).

Getis-Ord Gi* clustering analysis of (a) ASD providers near Detroit, Michigan and (b) socioeconomic distress in Michigan overall. In map (a), shades of red represent areas where ASD services are significantly more likely to be present, while shades of blue represent areas where ASD services are significantly more likely to be absent. In map (b), shades of red represent areas where socioeconomic distress is significantly more likely to be high, while shades of blue represent areas where socioeconomic distress is significantly more likely to be low.
As indicated in Figure 3(b), few spatial disparities were found to exist with respect to ASD service availability statewide. One cold spot in ASD service provision was identified, which indicated a statistically significant lack of available ASD service providers. This is particularly concerning because this significant cold spot in service provision covers almost the entire city of Detroit (see Figure 3(a)). From an equity perspective, it is even more troubling that this cold spot is located near a hot spot (which indicates an area with significantly more available ASD services) found in wealthier suburban Oakland and Wayne Counties to the northwest. This suggests that—while most urban regions had available ASD services—the region of Metro Detroit exhibited a significant disparity in the availability of ASD service providers such that the wealthier suburbs had good availability while the poorer urban area had low service availability. This is especially notable when viewing a hot spot map of socioeconomic distress for the State of Michigan (shown in Figure 3(b)). Most urban regions were significantly more distressed than suburban or rural regions, but Detroit was the only urban area that was also significantly less likely to have available ASD services (i.e., that it was a cold spot). High population and low SES alone did not seem to determine the distribution of ASD providers within Michigan, since other high population and low SES areas had a sufficient number of available ASD providers relative to the overall availability of ASD providers statewide.
Discussion
Previous research has found evidence of racial/ethnic and socioeconomic disparities in service receipt by individuals with ASD and their families; however, the extant literature does not provide sufficient information about why this phenomenon exists. Utilizing the Patient Centered Access to Healthcare Conceptual Framework (Levesque et al., 2013) to guide this research, we hypothesized that neighborhood-level socioeconomic disparities and population density would be negatively associated with availability of ASD service providers. Our findings did indeed confirm that there are fewer geographically proximal ASD service providers near urban socioeconomically disadvantaged neighborhoods and in rural areas. As hypothesized, this study found that fewer ASD agencies are located in less populated areas compared with more populated areas. That is, rural areas were found to be underserved with respect to available ASD services relative to urbanized areas. Based on population density, it is not surprising that there are fewer ASD services in rural areas and that rural families must travel further distances to access those services. Notably, however, we found that disparities in the availability of ASD services in rural areas were greater than would be expected by population density alone. Based on the population estimates of autism (and other measures of service provision being held equal), ASD providers in rural areas may need to serve a higher number of individuals with ASD than providers in urban and suburban areas. That is, rural areas were found to be inequitably underserved with respect to available ASD services relative to urbanized areas.
Furthermore, neighborhood SES—as measured by a distress index—predicted the availability of ASD services such that fewer ASD providers were available in areas with high socioeconomic distress compared with areas with low socioeconomic distress. This indicates that individuals with ASD who live in socioeconomically disadvantaged neighborhoods experience disparities in available geographically proximal ASD service providers. Disparities in the availability of services may indeed be a mechanism underlying poorer functional and health outcomes in adults with ASD from marginalized groups, per the Fundamental Causes Model (Bishop-Fitzpatrick & Kind, 2017).
Notably, this research provides a significant methodological advancement to the field of ASD services research. Most research investigating disparities in service availability among families with individuals with ASD from low SES backgrounds have focused on consumer-level barriers that negatively impact their ability to access available services (e.g. cost, transportation, limited flexibility in work schedules, low health literacy; Pickard & Ingersoll, 2016; Porterfield & McBride, 2007). Our data suggest, however, that autism services are not equally available for low and high SES families. This finding cannot be accounted for by any relationship between population density and neighborhood distress; decreased ASD provider availability was found in lower SES urban areas relative to higher SES urban areas. Thus, families that reside in lower SES urban neighborhoods have fewer service options available to them and must travel farther to access those services than families that live in higher SES urban neighborhoods, even when the population densities are similar. This finding is particularly troubling given the already-known disparities in access to healthcare services experienced by populations in highly distressed urban areas. That is, low SES urban families experience a compounded disadvantage when attempting to access needed services for a family member with ASD due to living in an ASD service desert.
Our data speak specifically of one domain of supply- side determinants of ASD services; namely, availability. Given that research suggests a negative relationship between caseload size and the use of EBPs (Becker-Haimes et al., 2017; Magidson et al., 2018), fidelity of implementation (Bertram et al., 2011), and family centered practice (Wright et al., 2010), we might expect that the higher ratio of available ASD service providers to individuals with ASD served in rural and low SES urban communities could negatively impact the appropriateness and quality of the services that are delivered. This may be particularly true among rural communities, whose providers have less access to training in EBPs (Dotson et al., 2014). It would be important to examine this hypothesis directly as it pertains to ASD services, as well as other supply side domains that influence the accessibility of ASD services.
Limitations
While this research provides important information on service availability and a novel methodological technique, this research is not without limitations. Notably, the ASD service provider database was derived from a systematic search of website information. It may be that ASD providers, especially in rural communities, utilize other methods of advertising their services, such as word-of-mouth or referrals from service providers outside of the area. Furthermore, it is possible that ASD service providers deliver home-based services and thus using a GIS methodology may not accurately reflect the areas in which the providers deliver ASD services.
Conclusion
Knowing the landscape of ASD availability (and the specific areas that are particularly poorly serviced) gives service providers and healthcare planners the opportunity to advocate for increases in ASD services in these underserved areas. This undertaking may be more important for some types of ASD services than others. For example, behavioral services, such as applied behavior analysis (ABA), are designed to be delivered at a high level of intensity, often 10–40 hours per week (Behavior Analyst Certification Board, 2014). Thus, a lack of availability might be expected to negatively influence access to these services more so than for services, such as medical care, which are utilized less intensively. While addressing gaps in urban and rural regions may be difficult (given that the healthcare industry is still profit-driven), more nimble options may help fill some of these gaps, such as greater outreach to communities that are further from provider offices, integration of behavioral health and primary care (Mazurek et al., 2017), school-based health centers (Kang-Yi et al., 2016), mobile autism clinics (Abrams, 2018), or telehealth services (Knutsen et al., 2016; Pickard et al., 2016; Sutherland et al., 2018). Moreover, policymakers may consider system-level interventions to reduce the ASD service disparities demonstrated in this research, such as policies to incentivize ASD service providers to relocate to socioeconomically distressed and rural areas. However, selection of organizational or system-level interventions must be made by considering specific barriers to the delivery of ASD services. Thus, future research must first better understand the influence of socioeconomic disadvantage and rurality on the availability of ASD services as well as the use of ASD EBPs. This is the critical first step necessary toward developing agency and/or system-level implementation interventions that aim to ultimately increase the availability of EBPs in ASD agencies that provide community-based services to individuals with ASD from health disparity populations.
Footnotes
Declaration of conflicting interests
The author(s) declared no potential conflicts of interest with respect to the research, authorship, and/or publication of this article.
Funding
The author(s) disclosed receipt of the following financial support for the research, authorship, and/or publication of this article: National Institute of Child Health and Human Development (U54HD090256); National Center for Advancing Translational Sciences (UL1TR002373; KL2TR002374; KL2TR000428); National Institute on Minority Health and Health Disparities (U54MD011227)
