



Abstract
Autistic people report difficulties with the demands of a neurotypical world, but little research has assessed the impact of the environment on such difficulties. We investigated the effect of ambient sounds on decision-making and heart rate variability. Adults without intellectual disability were allocated to autistic (n = 38) or neurotypical (n = 37) groups matched on age, intellectual functioning and self-reported gender. Participants completed a shopping decision-making task in three randomly ordered sound conditions: no sound, non-social shopping sound (e.g. fridges humming) and social shopping sound (e.g. people talking). Decision-making latency, decision-making consistency, and heart rate variability were measured. Participants also provided qualitative reports of their experiences. Qualitative analyses indicated that autistic participants experienced (1) the non-social and social sound conditions more negatively than the no sound condition and (2) the social sound condition more negatively than neurotypical participants. However, there were no statistically significant differences in decision-making latency, decision-making consistency, or heart rate variability across sound conditions and participant groups. Further research should consider alternative quantitative measures to explore subjective experience to help understand further which aspects of the environment autistic people are sensitive to, in turn, enabling more evidence-based autism-friendly changes to be made.
Lay abstract
Many autistic people report difficulties making decisions during everyday tasks, such as shopping. To examine the effect of sounds on decision-making, we developed a supermarket task where people watched a film shown from the shopper’s perspective and were asked to make decisions between different products. The task was divided into three sections and participants completed each section in a different auditory environment: (1) no sounds, (2) non-social sounds (e.g. fridges humming) and (3) social sounds (e.g. people talking). Thirty-eight autistic and 37 neurotypical adults took part. We measured decision-making by examining how long it took to make a decision and how consistent people were with their decisions. We also measured heart rate variability because this biological response provides a measure of anxiety. After the supermarket shopping task, participants told us in their own words about their experiences. Autistic participants said that they found the non-social and social sound conditions more difficult than the no sound condition, and autistic participants found the social sound condition more negative than neurotypical participants. However, decision-making and heart rate variability were similar for autistic and neurotypical participants across the sound conditions, suggesting that these measures may not have been sensitive enough to reflect the experiences the autistic participants reported. Further research should consider alternative measures to explore the experiences reported by autistic people to help us understand which specific aspects of the environment autistic people are sensitive to. This, in turn, may enable more specific and evidence-based autism-friendly changes to be made.
Keywords
Introduction
Difficulties in shopping environments
The ‘neurotypical (NT) world’ is challenging for autistic 1 people (Crane et al., 2019; Krieger et al., 2018) and shops are particularly difficult: about two-thirds of autistic individuals (n = not provided) across the United Kingdom report they avoid shopping (BBC, 2017). There are likely to be many reasons, including those reflecting the social difficulties of autism (American Psychiatric Association, 2013).
Shopping-related challenges may be exacerbated by the sensory sensitivities, including sound sensitivity (Lucker, 2013; Stiegler & Davis, 2010), and anxiety often experienced by autistic people. Self-reports suggest unpredictable and uncontrollable sounds, competing sounds from multiple inputs and sounds that are loud, distracting or are very high or low frequency (Smith & Sharp, 2013) are particularly aversive. Autism is also associated with high rates of comorbid anxiety (Croen et al., 2015; Hollocks et al., 2019; Lai et al., 2019; Lugo-Marín et al., 2019), and a greater proportion of autistic than NT adults are prescribed anxiolytics (Vella et al., 2018). Self-reports and longitudinal analyses indicate sensory stimuli, specifically sound stimuli, can lead to anxiety in autism (Green et al., 2012; Landon et al., 2016).
Outcomes in everyday life: decision-making
Autistic individuals report that everyday decisions are problematic (Lawson, 2001; Sainsbury, 2000). Luke et al. (2012) investigated the self-reported decision-making difficulties of 38 autistic individuals without intellectual disability compared to 40 NT individuals. Autistic individuals reported more frequent decision-making difficulties and greater avoidance of decision-making than NT individuals. Three kinds of decisions appeared particularly challenging: those that had to be made quickly, involved a change of routine and/or required talking to other people. Gaeth et al. (2016) found autistic adults rated everyday decisions as more difficult than NT adults.
Autism-friendly initiatives
The findings of focus groups involving 1213 autistic people, their families, and clinicians have emphasised the importance of research-based evidence to promote environments that improve experiences for autistic people (Cusack & Sterry, 2016). Until the COVID-19 pandemic led to a temporary pause (National Autistic Society [NAS], 2020), the NAS organised a week each year during which businesses were supported in making their services more autism-friendly, such as by turning off music and dimming lights (NAS, n.d.). However, there seems to be no experimental evidence to support these initiatives.
The present study
We used an experimental paradigm that modelled supermarket shopping to investigate how the auditory environment may impact two areas of difficulty in autism: decision-making and anxiety. Decision-making was measured using the attraction effect (AE) paradigm (Huber et al., 1982). The paradigm elicits a context effect, where the addition of an alternative option in a choice influences decision-making (Mourali et al., 2007) and contrasts with ‘rational’ decision-making (Luce, 1959, 1977; Tversky, 1972) (Supplementary Material 1). Two aspects of decision-making are measured: latency and consistency. Farmer et al. (2017) found autistic adults had longer response latencies than NT adults when making AE choices. However, compared with NT adults, autistic people made significantly more consistent choices, suggesting they demonstrated more rational decision-making.
Interactions between anxiety and decision-making are well-known in the literature (e.g. Remmers & Zander, 2018; Santos-Ruiz et al., 2012), and so is the high prevalence of anxiety in autism (Croen et al., 2015; Hollocks et al., 2019; Lai et al., 2019; Lugo-Marín et al., 2019). To better understand the role of anxiety in our shopping paradigm, heart rate variability (HRV) was measured to index general adaptive capacity to anxiety (Klusek et al., 2015; Mertens et al., 2017). While HRV reduction in response to a stressor typically reflects an adaptive response, resting-state reductions reflect chronic arousal and autonomic inflexibility (Quintana et al., 2016). Autism has been associated with autonomic atypicalities (Benevides & Lane, 2015; Klusek et al., 2015), but the literature is contradictory. Some studies that compare HRV in autistic adults and NT adults report no differences in resting HRV (Dijkhuis et al., 2019; Smeekens et al., 2015) or HRV in response to a stimulus (Kuiper et al., 2017; Smeekens et al., 2015). However, others report reduced resting HRV in autistic adults (Cai et al., 2019; Kuiper et al., 2017; Mathewson et al., 2011; Thapa et al., 2019) and reduced HRV reactivity in response to a stimulus (Dijkhuis et al., 2019), compared to NT adults. Some studies have assessed the effects of auditory stimuli on HRV in autistic individuals. For example, respiratory sinus arrhythmia (RSA), an index of HRV, was measured in autistic and NT children aged 6–9 years while they listened to different auditory tones (Schaaf et al., 2015); no differences in RSA were found. In contrast, Porges et al. (2013) found RSA to increase in autistic individuals (aged 6–21 years) during an auditory processing task. The effects of ambient environmental conditions on HRV in autistic adults are yet to be investigated.
We expected there would be differences between autistic and NT groups in the effect of different kinds of sounds on (1) decision-making latency, (2) decision-making consistency and (3) HRV. Based on the greater sensory sensitivity of autistic individuals compared with NT adults (Crane et al., 2019), and the everyday decision-making difficulties (Gaeth et al., 2016; Luke et al., 2012) and anxiety in response to sensory stimulation (Landon et al., 2016) of autistic people, we also expected an interaction between these variables and the group (autistic/NT) to which participants belonged.
Methods
Ethics
The study was reviewed by the University of Cambridge Psychology Research Ethics Committee.
Participants
Participants were at least 18 years old, were native English speakers, had not taken part in an AE pilot (Supplementary Material 2) and possessed corrected-to-normal vision and hearing. Participants had tested intelligence quotient (IQ) scores ⩾90 (Wechsler Abbreviated Scale of Intelligence–Second Edition (WASI-II); Wechsler, 2011), with 20% of the assessments scored by two independent raters. Full-Scale IQ was used to indicate IQ except for six autistic and six NT participants where the Verbal Comprehension Index (VCI) was used because the VCI and Perceptual Reasoning Index differed significantly.
Autistic participants (1) self-reported an autism diagnosis and (2) scored above the cut-off for autism spectrum disorder on the Autism Diagnostic Observation Schedule–Second Edition (ADOS-2; Hus & Lord, 2014), Module 4. NT participants (1) self-reported they did not have an autism diagnosis and (2) scored below 32 on the Autism-Spectrum Quotient (AQ; Baron-Cohen et al., 2001).
Power was estimated using Farmer et al. (2017). To detect a clinically meaningful difference of 10 s in decision-making latency between autistic and NT groups while listening to social sounds, 30 participants were needed in each group (α = 0.05) allowing detection of a Cohen’s d of 0.88 (two-tailed) with 90% power (Altman, 1991).
Advertisements were distributed through the Autism Research Centre at the University of Cambridge, the National Autistic Society, local student and community contacts, and autism support services. All participants provided informed written consent for participation.
Materials
Shopping decision-making task
The shopping task was based on that of Braeutigam et al. (2001; also see Ambler et al., 2004). It comprised a film from a shopper’s perspective (Supplementary Material 3) and AE choices. The task was completed in no sound, non-social sound and social sound conditions.
The video and sound clips were recorded in a supermarket and further sounds were retrieved from sound banks. Piloting was completed to identify the choices and sounds to use (Supplementary Material 2). The task was programmed with Python.
The shopping task contained 54 AE choices across nine products (six choices per product). The task was split into three sections, each occurring in a different sound condition and comprising 18 choices, across three products. The order the products appeared was randomised. Each of the sound conditions began with the participant watching a video of a shopper entering a supermarket and approaching a product. The participant then made three pairs of choices about that product, before watching the shopper approach a second product and making three further pairs of choices. The participant then watched a video and made three pairs of choices about a third product, before seeing the shopper leave the supermarket. This process occurred three times, once in each sound condition.
Each choice was presented on a separate page and referred to one product (Supplementary Material 4). A picture of the product was given and remained the same for all six choices for that product. For each choice, there were three options: a target, competitor and decoy. Each option was described in terms of two attributes (Supplementary Material 4). The three options were presented in a triangle and the location of the options was randomised (Paulhus & Vazire, 2007). Participants could not change their choice once made.
Choices were grouped into pairs. Each pair of choices involved the same attributes, attribute descriptors and non-decoy options, but the decoy targeted a different option in each choice. The order of the choices was randomised, but all the first choices in a pair were shown before any of the second choices in a pair.
Ten-min sound collages were produced using Audacity 2.3.0 (Audacity Team, 2018). All sound clips occurred in the first 6 min of the collage to ensure participants who completed the shopping task quickly were still exposed to most sounds. In the last 4 min, the sounds were repeated.
Demographic interview
Participants provided information on their demographics, diagnoses (including reading, listening and sensory impairments) and current medication.
Familiarity, Knowledge and Preference Questionnaire
Familiarity (Mishra et al., 1993; Ratneshwar et al., 1987), knowledge (Malaviya & Sivakumar, 1998; Mishra et al., 1993) and preference of shopping products (Malkoc et al., 2013) may be important to AE decision-making, so were measured.
Participants indicated their familiarity and knowledge of each product on a 4-point scale (scored 0–3) and their preference for each product on a 5-point scale (scored 0–4). Participants received three scores by calculating the median values for familiarity, knowledge and preference across products. Higher scores indicated greater familiarity, knowledge or preference.
Subjective reports
Participants remained in the same room after the three sound conditions, so the first author could ask them ‘how did you find the experience?’. Participants were asked about the sound conditions in the order they had been experienced. The participants’ responses were transcribed verbatim.
HRV
Equipment and protocol
A Zensor v0 Intelesens Ltd monitor recorded electrocardiogram (ECG) and respiration data using three-lead monitoring, sampling at 360 Hz (Laborde et al., 2017). Participants remained seated and upright, given the relationship between posture and HRV (Montano et al., 1994; Mukai & Hayano, 1995). Time of day of the recordings (morning, early afternoon, late afternoon or evening) did not differ between participant groups (Fisher’s exact test value = 5.32, p = 0.12).
HRV questionnaire
To inform the HRV analysis, self-reported information about recent eating, sleeping and caffeine consumption was recorded, together with the use of oral contraceptives, and urgency of need to use a bathroom.
Procedure
Participants attended one session lasting approximately 2.5 h. Sessions took place in one of two similar rooms. Participants completed the AQ and Product Familiarity, Knowledge and Preference Questionnaire before the session.
The order of the procedure ensured more and less demanding tasks were alternated, reducing fatigue (Lezak et al., 2004). To begin, participants answered demographic questions and completed a hearing assessment: the sound of a phone ringtone was played and participants had to describe the sound to pass.
Participants then completed the WASI-II, followed by time-dependent questions in the HRV questionnaire. Subsequently, the HRV equipment was set up. Participants were given an instruction sheet and the researcher left the room while the participant set up the equipment, to ensure privacy.
Baseline heart rate measurement then took place, lasting 10 min. For approximately the first 4 min, the participant was given verbal and written instructions for the shopping task. Consistent language was used across participants when explaining how to complete the AE choices; ‘click on the one [option] you would prefer if you had to choose between them’ (Farmer et al., 2017). For the remaining time, participants watched a nature film.
The shopping task was completed on the same computer by all participants with screen brightness, contrast and resolution all constant. Windows were covered to remove natural light variation and the lights were turned off. The researcher remained in the room, out of sight. The order of the sound conditions was randomised and the sound collages were played through speakers at approximately 78 decibels. Sound collages were looped if necessary. Between each condition, participants watched 5 min of the nature film. The researcher requested that the participant stayed seated. After the task was complete, participants were prompted to discuss each sound condition. Participants then finished the HRV questionnaire. The ADOS-2 was completed at the end of the session to ensure task order between NT and autistic groups remained as similar as possible. All participants were paid, sent a letter of thanks and those who had agreed to their contact details being retained were sent a layperson’s summary of the findings.
Analysis
HRV pre-processing
ECG processing was completed with Kubios 3.2.0, which uses an in-built QRS detection algorithm, based on the Pan–Tompkins algorithm (Pan & Tompkins, 1985). After peak detection, cubic spline interpolation of the RR time series occurred at 4 Hz and a smoothness prior detrending method (smoothing parameter, lambda = 500) reduced the influence of very low-frequency components. The ECG trace was inspected manually to ensure correct QRS recognition. Participant information known to influence ectopic beats was considered during inspection. Ectopic beats and subsequent heart rate turbulence were corrected by altering R peak marks. Subsequent threshold-based artefact correction was applied on a participant-level basis if the RR interval trace showed outliers. The level of artefact correction was determined by applying the lowest threshold level that removed all spurious results. There was no difference in the percentage of heart beats corrected between autistic and NT groups (mean difference = −0.13, 95% confidence intervals (CIs) = −1.11 to 0.83, U = 313, p = 0.72, d = −0.10).
For each participant, four 2.5 min samples were assessed (Esco & Flatt, 2014; Laborde et al., 2017; Munoz et al., 2015). The baseline sample was taken from the final 2.5 min of the baseline period to allow acclimatisation to the equipment (Quintana et al., 2016). For the sound conditions, samples were taken from the first 2.5 min of each condition. The high-frequency (HF) band was defined as 0.15–0.4 Hz, as recommended for adults (Quintana et al., 2016). When, for the baseline recording, there was 5% artefact correction or more (Quintana & Heathers, 2014) or the electrocardiogram derived respiration (EDR) was outside the HF band, the sample was moved as close to the end of the baseline period as possible while allowing for artefact correction below 5% and HF band EDR placement. For the sound conditions, the sample was moved as close to the beginning of each condition as possible, while allowing for less than 5% artefact correction and HF band EDR placement. If a sample with less than 5% artefact correction and HF band EDR placement was not found in the last 5 min of the baseline period or within the sound conditions, the participant was excluded.
The root mean square of successive differences (RMSSD), high-frequency heart rate variability (HF-HRV) and heart rate were exported from Kubios to SPSS and RStudio. HF-HRV was calculated through autoregressive modelling (AR), since AR produces a spectrum with greater resolution than other methods when short samples are used (Laborde et al., 2017). AR was measured through absolute power, as advised by Laborde et al. (2017). Model order was 16 (Boardman et al., 2002; Dantas et al., 2012). Baseline respiration was measured by manually counting the number of respiratory cycles in the respiratory waveform displayed by the Zensor+ software during baseline.
Statistical analyses
Psychotropic medication and comorbid psychiatric conditions influence decision-making (Brand et al., 2006; Hauser et al., 2018) so were considered as confounds in the decision-making latency and consistency analyses. For psychotropic medication, participants were given a score of 1 if they were currently taking any psychotropic medication and a score of 0 if they were not. For comorbid psychiatric conditions, participants were given a score of 1 if they currently had any psychiatric conditions, and again, a score of 0 if they did not. These categorical variables were included in a stepwise regression to assess their impact on decision-making latency and consistency. Product preference, knowledge and familiarity scores were also included in the stepwise regression for decision-making consistency, given the research to suggest these factors influence AE choosing behaviour (Malkoc et al., 2013; Mishra et al., 1993).
Given the impact of comorbid conditions, psychotropic medication and medication known to impact heart rate on HRV in NT (Laborde et al., 2017) and autistic (e.g. Thapa et al., 2019) groups, these variables are often controlled for in HRV studies. We therefore assessed the impact of these variables on HRV through a stepwise regression. For psychotropic medication, participants were given a score of 1 if they were currently taking any psychotropic medication and a score of 0 if they were not. For medication known to impact heart rate, participants were given a score of 1 if they were currently taking any medication known to impact heart rate and a score of 0 if they were not. For comorbidities impacting HRV, participants were given a score of 1 if they currently had any comorbidities known to impact HRV and a score of 0 if they did not.
Variables that contributed to stepwise regression models at p ⩽ 0.05 were added as confounds to the analysis of variance tests (ANOVAs) of the hypotheses. Assumptions underlying the use of parametric tests comparing the autistic and NT groups were checked and, where required, transformations were made to the data or non-parametric tests were used. For variables where the data were transformed, the reported values reflect this, apart from mean values, standard deviations, mean differences and 95% CIs, where raw values are reported. Tests were two-tailed and run at α = 0.05.
Community involvement
This research was developed to target one of the areas that the autism community (autistic people, their families, and clinicians) highlights as needing more attention: research to better understand how environments can improve experiences for autistic people (Cusack & Sterry, 2016). In addition, one autistic individual provided feedback that was used to inform the wording of recruitment advertisements and payment for participants.
Results
Raw data and research materials are available on request to the corresponding author.
Participants
Forty-five autistic and 37 NT individuals participated. Of these, seven autistic participants were excluded: three with a tested IQ score below 90, three below the ADOS-2 cut-off and one due to technical issues. Thirty-eight autistic and 37 NT participants were included in the analyses. More than three-quarters (79%) described themselves as White British (Supplementary Material 5). Twenty-two autistic participants self-reported a diagnosis of anxiety and 20 a diagnosis of depression, compared to four NT participants who self-reported anxiety and four who self-reported depression (Supplementary Material 6). Thirty autistic and 17 NT individuals self-reported taking medication, with 25 autistic participants reporting using psychotropic medication, compared to five NT participants (Supplementary Material 7).
Sixteen autistic participants and 13 NT participants were employed. Twenty-two autistic participants and 24 NT participants were unemployed. Twenty-four autistic and 33 NT participants had at least one degree or were currently completing a degree.
Table 1 shows the characteristics of the participants included in the analyses. Fisher’s exact test was used in the analysis of product familiarity, preference and knowledge because more than 20% of expected values fell below five. Product familiarity (Fisher’s exact test value = 6.27, p = 0.06) and knowledge (Fisher’s exact test value = 1.39, p = 0.61) did not differ between autistic and NT groups, but autistic participants gave significantly higher product preference scores than NT participants (Fisher’s exact test value = 10.71, p = 0.01) (Supplementary Material 8).
Age, intellectual functioning (IQ), autism quotient (AQ) scores and self-reported gender across participant groups.

SD: standard deviation; NT: neurotypical; CI: confidence interval; IQ: intelligence quotient.
Data were cube-root transformed due to raw data not being normally distributed.
p ⩽ 0.05.
Participants’ self-report
The responses of autistic (n = 38) and NT (n = 15) participants to the sound conditions (Figure 1) were analysed. A response was categorised as positive when the participant’s comments were entirely positive, for example, describing the experience as relaxing or easy. Comments that made no reference to positive or negative experiences, references to both positive and negative experiences, or described the use of coping mechanisms were categorised as neutral. A negative categorisation was given when the participant’s comments were entirely negative, for example, describing difficulty or fear. Negative experiences were coded as one, neutral as two and positive as three. Responses were independently coded by two of the authors. Prior to a consensus meeting, Cohen’s kappa equalled 0.81 (95% CIs = 0.71–0.90, p < 0.001). After the meeting, full agreement was met (k = 1.00, p < 0.001). Sample comments are shown in Supplementary Material 9.
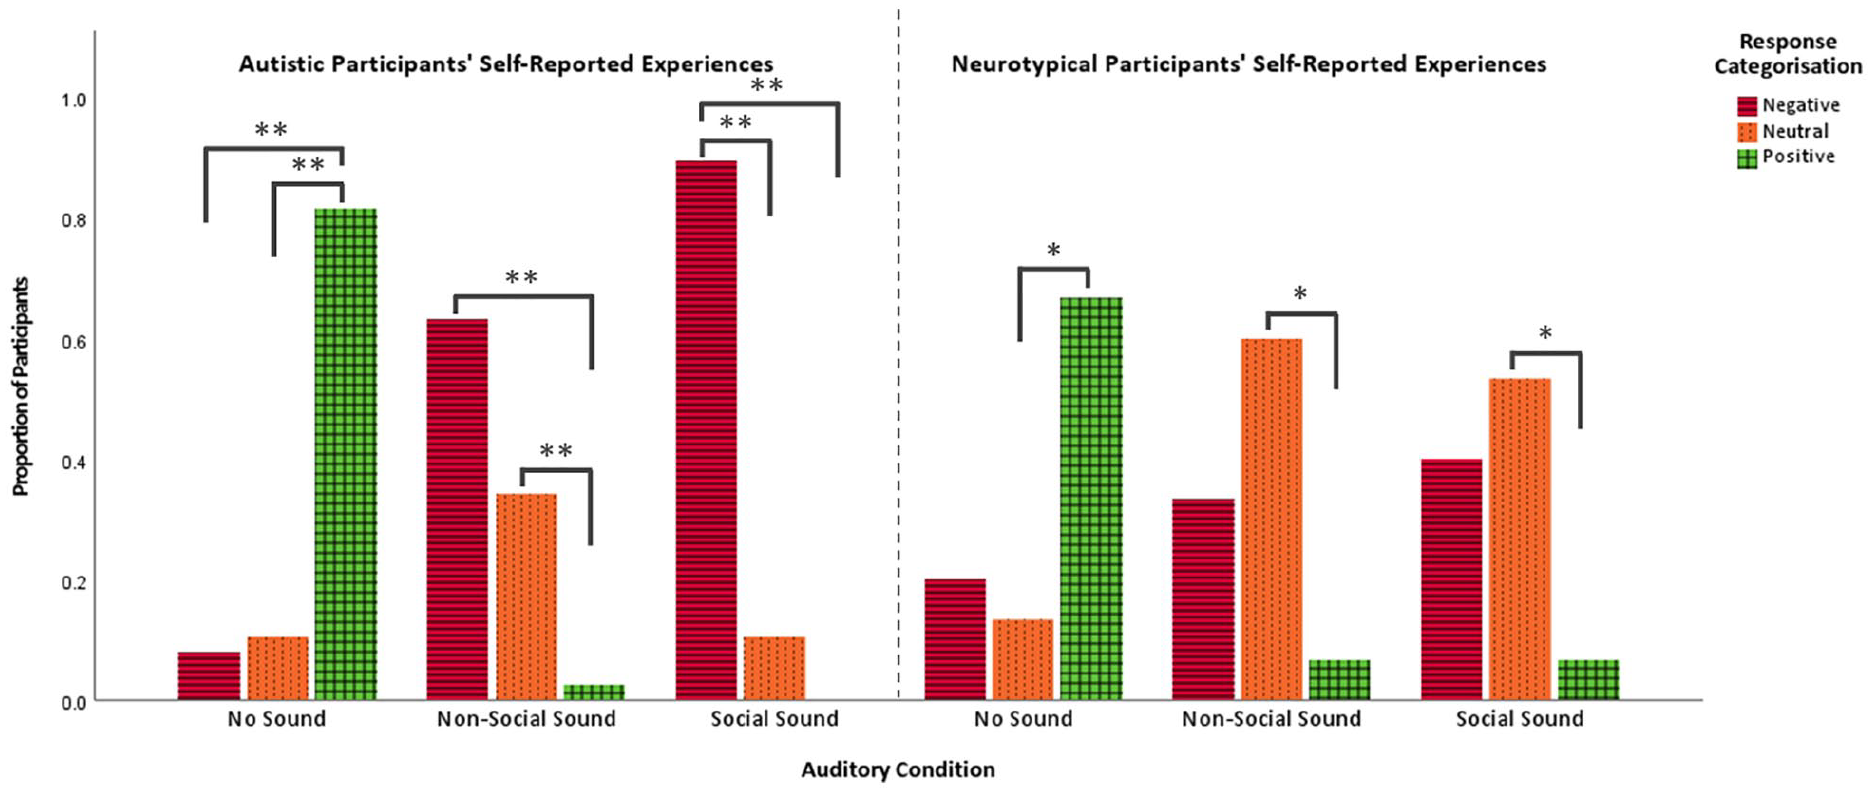
Proportion of negative, neutral or positive experiences reported by autistic and neurotypical participants. Chi-square tests were used to assess significance, except when expected values <5, in which case Fisher’s exact test was used.
A Friedman test indicated a significant difference across the sound conditions within the autistic group (χ2(2) = 54.12, p < 0.001). Bonferroni-corrected post hoc tests indicated responses to the no sound condition were significantly more positive than responses to the non-social sound (p < 0.001, d = 1.37) and social sound (p < 0.001, d = 2.06) conditions, but no significant differences were seen between the non-social and social sound conditions (p = 0.56, d = 0.31). To test, whether a group (autistic/NT) by sound condition interaction existed, a log-linear analysis was completed. A significant three-way interaction was found (χ2(4) = 8.82, p = 0.05), suggesting there was a difference in the qualitative ratings between the autistic and NT groups across the three sound conditions. Bonferroni-corrected post hoc tests revealed there was no difference between the autistic and NT groups’ qualitative ratings in the no sound (Fisher’s exact test value = 2.03, p = 0.44) and non-social sound (Fisher’s exact test value = 2.85, p = 0.22) conditions, but the autistic group produced significantly more negative ratings than the NT group in the social sound condition (Fisher’s exact test value = 16.51, p ⩽ 0.001).
Decision-making latency
Figure 2 highlights decision-making latency in autistic and NT groups across sound conditions (Supplementary Material 10). The group × sound condition interaction (F(2, 146) = 0.98, p = 0.38,

Decision-making latency during no sound, non-social sound and social sound conditions. Error bars represent one SE above and below the mean value.
A stepwise regression was completed with backward elimination of comorbid psychiatric conditions and psychotropic medication as categorical variables. Neither psychiatric comorbidities nor psychotropic medication significantly contributed to the model (p ⩾ 0.43) and so were not added to the ANOVA.
Decision-making consistency
Figure 3 shows decision-making consistency for autistic and NT groups across sound conditions
3
(Supplementary Material 10). The group × sound condition interaction (F(2, 146) = 2.82, p = 0.06,

Decision-making consistency during no sound, non-social sound and social sound conditions. Error bars represent one SE above and below the mean value.
To assess those variables needing to be controlled in the ANOVA, a backward elimination of the following variables was completed: psychotropic medication, comorbid psychiatric conditions, product knowledge, product familiarity and product preference. Psychotropic medication significantly contributed to the final model (p = 0.05), so the ANOVA was repeated with psychotropic medication as a factor. All effects were non-significant (F ⩽ 1.95, p ⩾ 0.15,
HRV
HRV data were analysed for 30 autistic and 22 NT participants. Groups were matched on age, self-reported gender and IQ (Supplementary Material 11). Eighteen participants were excluded due to a lack of ECG trace; two due to data only being available for a 1.5 min sampling period in one or more sound conditions; one due to artefact correction being over 5% and one due to ECG-derived respiration being outside the HF band. Failures were likely produced as the result of participants setting up the ECG equipment independently. This procedure could not be altered due to participant privacy.
To establish whether exclusions from the HRV analysis were linked to participant group, a chi-square test was completed to compare HRV recording success (autistic: n = 30 and NT: n = 22) and failure (autistic: n = 8 and NT: n = 15) between groups; the difference was not significant (χ2(1) = 2.50, p = 0.11, V = 0.21). Forty-two individuals were included in the baseline respiration analysis (autistic: n = 24 and NT: n = 18): baseline respiration could not be determined for five individuals because of a noisy respiratory trace and for another five due to a weak signal. HRV confounds were analysed for 24 participants (autistic: n = 18 and NT: n = 6). There were no differences in baseline heart rate, HRV or respiration between participant groups (Table 2).
Baseline heart rate, HRV and respiration across participant groups.

HRV: heart rate variability; SD: standard deviation; NT: neurotypical; CI: confidence interval; RMSSD: root mean square of successive differences; HF-HRV: high-frequency heart rate variability.
Data were transformed due to raw data not being normally distributed. Baseline RMSSD = square-root transformation. Baseline HF-HRV = log-transformation.
A Mann–Whitney U test was used since data transformation did not lead to normality.
Figure 4 shows RMSSD across participant groups in the sound conditions (Supplementary Material 10). HRV was measured through log-transformed RMSSD values, since raw data violated the assumption of normality of residuals. The group × sound condition interaction (F(2, 100) = 0.75, p = 0.48,

Log-transformed root mean square of successive differences in autistic and neurotypical groups during no sound, non-social sound and social sound conditions. Error bars represent one SE above and below the mean value.
To understand the influence of medication and comorbidities on RMSSD (log-transformed), a stepwise regression was completed with backward elimination of three categorical variables: comorbidities believed to impact HRV, ‘medications that impact heart rate’ and psychotropic medications. Both the ‘medications that impact heart rate’ (p ⩽ 0.001) and psychotropic medication (p = 0.006) variables had a significant influence on the final model, so were included as factors in the ANOVA; all interactions with RMSSD were non-significant (F ⩽ 1.63, p ⩾ 0.20,
Discussion
Qualitative measures suggested the social sound condition was experienced more negatively by the autistic than NT participants. However, the hypotheses were not supported: there were no statistically significant decision-making latency, decision-making consistency or HRV differences across sound conditions and participant groups.
The finding that autistic participants experienced the social sound condition more negatively than NT participants is expected given the social difficulties characterising autism (American Psychiatric Association, 2013). The difference in qualitative ratings between the autistic and NT groups in the social sound condition but not the non-social sound condition, suggests difficulties experienced by autistic individuals, as compared to NT individuals, in these ambient environments may be related to the social aspects of sounds, rather than a generalised sensitivity to all sounds. It is also possible the social sounds were characterised by features which autistic individuals self-report as particularly difficult, such as unpredictable, loud or very high- or low-frequency sounds (Smith & Sharp, 2013). However, within the autistic group, both ambient sound conditions were rated more negatively than the no sound condition, suggesting benefit to reducing both non-social, such as checkout beeps, and social, such as loud conversations, sounds to make supermarkets more autism-friendly.
The lack of difference in decision-making and HRV measures between the non-social and social sound conditions in the autistic group is unexpected and noteworthy. This result is not in line with theories suggesting autism is due to inherent social difficulties (e.g. Baron-Cohen et al., 1985), which would predict the social sound condition would create more difficulty for autistic people than the non-social condition. Such results could be better explained by attentional theories of autism (e.g. Liss et al., 2006; Ploog, 2010; Tyndall et al., 2017) that suggest autistic individuals show broader atypicalities in attention, rather than specific social deficits. Prediction deficit models of autism (e.g. Sinha et al., 2014) may also better explain these results by suggesting autistic individuals rely less on prior expectations relative to sensory inputs, leading to broad perceptual atypicalities rather than atypicalities specific to the social domain. The presence of a participant group by sound condition interaction in the qualitative analysis should, however, be noted, since this interaction indicates that there are differences in the impact of social, but not non-social, sounds between autistic and NT individuals.
The absence of differences in decision-making between participant groups was unexpected based on self-reported decision-making difficulties in autism (Gaeth et al., 2016; Luke et al., 2012) and Farmer et al.’s (2017) findings of increased latency and consistency in autistic, compared to NT, adults. In this study, the autistic participants’ reports highlighted the negative experience of the social and non-social sound conditions, suggesting the participants faced difficulties with the shopping task. Measures of latency and consistency may not have been sufficiently sensitive to reflect the subjective experience of autistic participants and participants’ difficulties may have gone undetected.
The outcome measures must be considered in terms of whether they reflect everyday decision-making. Taking a long time to make decisions is reported by autistic participants as an everyday difficulty (Luke et al., 2012), supporting the use of latency. However, decision-making consistency may not reflect decision-making in everyday life, since individuals rarely make several choices regarding the same product. There are methods to improve the everyday relevance of the AE paradigm, such as offering a no-buy option, but these are not validated with autistic participants (Hadar et al., 2018; Lichters et al., 2015; Stewart, 1989).
Our findings add to the inconsistencies in the HRV literature: some studies have found baseline/task-driven HRV differences between autistic and NT adults, but others have not (Cai et al., 2019; Dijkhuis et al., 2019; Kuiper et al., 2017; Mathewson et al., 2011; Smeekens et al., 2015; Thapa et al., 2019).
The absence of baseline differences in HRV between participant groups was surprising, given that 22 autistic participants self-reported ‘anxiety’ compared to only 4 NT participants (Supplementary Material 6). However, ‘anxiety’ is often used informally rather than according to standard diagnostic classifications (such as Diagnostic and Statistical Manual of Mental Disorders (5th ed.; DSM-V, American Psychiatric Association, 2013); the International Statistical Classification of Diseases and Related Health Problems (10th ed.; ICD-10, World Health Organization, 1992)) to include a range of worries and fears, with different levels of impact. The relationship between these self-reports, which are very common in autistic people (Zaboski & Storch, 2018), and ‘anxiety’ as measured by HRV is uncertain. While we controlled for medication use and comorbidities known to impact HRV, it is possible that the signal may have been affected by variables that were uncontrolled, such as smoking (Kemp et al., 2017; Murgia et al., 2019), body mass index (Föhr et al., 2016; Koenig et al., 2014), physical activity (Kemp et al., 2017; May et al., 2017), and alcohol (Ralevski et al., 2019) and water (Heathers et al., 2018) consumption.
During the task, the ambient sounds may not have induced anxiety, resulting in no HRV change. Since anxiety can impact decision-making (Remmers & Zander, 2018), this possibility may also account for the absence of decision-making differences across sound conditions. However, given that previous research suggests sound stimuli can lead to anxiety for autistic individuals (Landon et al., 2016), this would be surprising. It is possible there were differences in anxiety between participant groups at baseline and across the sound conditions that were not detected by the HRV measures. As Taylor et al. (2021) suggest, self-reports may be more sensitive to such changes than physiological measures. However, the absence of HRV differences may also reflect autonomic dysregulation in autistic individuals (Panju et al., 2015; Truzzi et al., 2016) where, despite self-reported negative affect, a physiological response is absent. For example, in Dijkhuis et al.’s (2019) study, there were no significant differences between baseline HRV and HRV during a speaking task in autistic adults, despite participants’ negative reports. Such dysregulation is problematic because it may result in reduced environmental adaptation, exacerbating feelings of negative affect (Dijkhuis et al., 2019).
Implications
Future research could expand on this study’s paradigm to create a shopping experience with even greater ecological validity. Research could be conducted in a supermarket, although this may improve validity at the cost of experimental control. When Doyle et al. (1999) completed the AE paradigm in a supermarket, they noted several uncontrolled factors, such as the actions of other shoppers.
Several acoustic factors are known to influence sensory reactivity, including unpredictability and frequency (Robertson & Simmons, 2015; Smith & Sharp, 2013). However, in this study, participants were not specifically asked whether the sounds were distracting to the task or whether certain aspects of the ambient environment were more difficult than others. Additional studies could ask participants to specify which aspects of the ambient environment impacted the task.
Additional physiological measures could be used in future research. For example, pupil diameter, an indicator of arousal, is affected by decision-making uncertainty and pupil-linked arousal also influences decision-making behaviour (Urai et al., 2017). Therefore, this measure may give insights into the relationship between arousal and decision-making behaviour during exposure to ambient sensory environments.
In this study, participants had high levels of intellectual functioning. Future research could adapt the shopping paradigm to be inclusive of those with intellectual disability, since 50% of autistic people have co-occurring intellectual disability (n = 24 studies) (Loomes et al., 2017).
The context of this study was that of the increasing number of organisations that have begun creating autism-friendly environments. Our qualitative evidence indicated that the non-social and social sound conditions were experienced more negatively than the no sound condition for the autistic group, suggesting such autism-friendly changes may help. Research studies should consider alternative quantitative measures and assess the impact of other environmental stimuli, such as lighting or proximity to others, to potentially allow for more detailed recommendations with applications to settings far beyond supermarkets such as classrooms (Zazzi & Faragher, 2018), the workplace (Johnson & Joshi, 2016) and healthcare (Morris et al., 2019; Vohra et al., 2016). By considering autism as a difference in neurodiversity (Kapp et al., 2013) and understanding how environments can be altered to promote a good person-environment fit, autistic individuals may be better able to thrive (Lai & Baron-Cohen, 2015; Mandy & Lai, 2016).
Supplemental Material
sj-docx-1-aut-10.1177_13623613211014993 – Supplemental material for The effect of ambient sounds on decision-making and heart rate variability in autism
Supplemental material, sj-docx-1-aut-10.1177_13623613211014993 for The effect of ambient sounds on decision-making and heart rate variability in autism by Rachel Bellamy, Howard Ring, Peter Watson, Andrew Kemp, Giles Munn and Isabel CH Clare in Autism
Footnotes
Acknowledgements
The authors are grateful to all the participants and their families and other carers for making the study possible. We thank also the National Autistic Society, the University of Cambridge’s Autism Research Centre, and local autism services, Colleges, and shops for advertising the study; Morrisons supermarkets for allowing us to film in store, and for promoting the study; and Dr Sven Braeutigam, Dr George Farmer, and Dr William Skylark for assisting in the development of the study by providing access to their study material.
Declaration of conflicting interests
The author(s) declared the following potential conflicts of interest with respect to the research, authorship, and/or publication of this article: The research reported was carried out by Rachel Bellamy in part fulfilment of the MPhil in Medical Sciences at the Department of Psychiatry, University of Cambridge.
Funding
The author(s) disclosed receipt of the following financial support for the research, authorship, and/or publication of this article: Rachel Bellamy was funded by the Newton College Masters Scheme, Gonville & Caius College, Cambridge, and an anonymous donation. This is a summary of research supported by the National Institute of Health Research (NIHR) Applied Research Collaboration East of England (ARC EoE) programme. The views expressed are those of the authors, and not necessarily those of the NIHR, NHS or Department of Health and Social Care.

Supplemental material
Supplemental material for this article is available online.
Notes
References
Supplementary Material
Please find the following supplemental material available below.
For Open Access articles published under a Creative Commons License, all supplemental material carries the same license as the article it is associated with.
For non-Open Access articles published, all supplemental material carries a non-exclusive license, and permission requests for re-use of supplemental material or any part of supplemental material shall be sent directly to the copyright owner as specified in the copyright notice associated with the article.
