



Abstract
Predictive coding theories of autism suggest that symptoms could result from an atypical learning of expectations. We assessed whether adults with autism could learn expectations in an uncertain context. Twenty-nine neurotypicals and 25 autistic adults participated in an associative learning task. After hearing a tone, participants had to predict the rotation direction of a dot pair, and to report what they perceived. There was a probabilistic association between the tone and the rotation direction. This association could reverse within a block. Both groups were biased by their expectations, as they reported perceiving a rotation consistent with the contingency in a subset of ambiguous trials where the dots did not rotate. Participants made predictions above chance level, but contrary to neurotypicals, autistic participants updated their prior expectation less after a change in contingency. Computational modeling revealed a smaller influence of associative learning on perceptual expectations in the autism group. In an additional task, participants reported how confident they were about their percepts. Both groups expressed confidence in relation to the stimuli, but certainty ratings reflected response times in neurotypical participants only. These findings, showing a more inflexible adjustment of priors in autism, should help refining the predictive coding hypotheses of autism.
Lay abstract
We have an internal representation of the world that guides our behavior, helps us predicting what comes next and therefore, reducing uncertainty. For instance, after hearing the noise of a door opening, we usually expect to see a person appearing, whose features differ depending on the context. In this example of associative learning, predictions need to be adjusted if there is a change in the environment (e.g. different person depending on the location). Recent theories suggest that the symptoms encountered in autism could be due to an atypical learning of predictions or to a decreased influence of these expectations on perception. Here, we conducted an experiment assessing whether adults with autism could learn and adjust their predictions in a changing environment. Throughout a behavioral task, participants learned to associate a sound with a visual outcome, but this association could sometimes reverse. Results showed that autistic adults could learn to make predictions that fitted the main sound–vision association, but were slower to adapt their expectations when there was an unannounced change in the environment. We also observed that both adults with and without autism tended to be biased by their expectations, as they reported seeing what they expected to see rather than what was actually shown. Altogether, our results indicate that autistic adults can learn predictions but are more inflexible to adjust these predictions in a changing environment. These results help refining recent theories of autism (called “predictive coding” theories), which intend to identify the core mechanisms underlying the autistic symptomatology.
Keywords
Introduction
To minimize uncertainty in new environments, we tend to make predictions about what comes next, based on our prior knowledge. Actively computing predictions is one of the main tasks facing the brain. It relies on a combination of contextual sensory information with an internal model of the world that captures the underlying statistical regularities of the environment. Using this internal model, we make knowledge-driven inferences about the causes of sensory inputs. This process of perceptual inference has been formalized in the Bayesian framework, where posteriors (i.e., percepts) emerge from a combination of precision-weighted likelihood (i.e., sensory inputs) and priors (i.e., expectations). These expectations may rely on structural priors, usually learned over long time-scales, or on contextual priors that can be learned quickly and are specific to a given spatial or temporal situation (Seriès & Seitz, 2013). Mismatches between expectations and sensory inputs give rise to prediction errors, which can be used to update the internal model, and therefore, to minimize surprise in future situations. Prediction errors should be given a flexible weight (or precision), so that prediction errors signaling important changes in the structure of the environment have a high precision, whereas prediction errors due to noise are ignored. Furthermore, in uncertain environments, one needs to be able to track different forms of uncertainty: sensory uncertainty (i.e., ambiguous sensory inputs), expected and unexpected uncertainty. Expected uncertainty comes from the known unreliability of the predictive relationships between stimuli in a familiar environment, whereas unexpected uncertainty arises from non-signaled changes in the environment that lead to strong prediction errors (Yu & Dayan, 2005).
Difficulties to deal with uncertainty are particularly frequent in people who have an Autism Spectrum Condition (ASC) and are often related to anxiety issues (Jenkinson et al., 2020; Joyce et al., 2017). ASC is characterized by persistent difficulties in social interactions and communication, and by restrictive, repetitive patterns of behaviors, interests, or activities (Diagnostic and Statistical Manual of Mental Disorders (5th ed.; DSM-5); American Psychiatric Association, 2013). Recent Bayesian and predictive coding theories suggest that the autistic symptomatology could arise from an atypical combination of sensory input and prior knowledge (Brock, 2012; Lawson et al., 2014; Palmer et al., 2017; Pellicano & Burr, 2012; Van de Cruys et al., 2014). Specifically, the HIPPEA hypothesis suggests a High and Inflexible Precision of Prediction Error in Autism (Van de Cruys et al., 2014), leading to an atypical updating of priors in ASC. This hypothesis was supported by recent studies showing that the behavioral and neural responses to unexpected versus expected stimuli were decreased in ASC (Goris et al., 2018; Lawson et al., 2017), suggesting that the weight of the prediction error is indeed more inflexible in ASC. As the precision of the prediction error is function of the prior and sensory precisions, the increased inflexibility of the prediction error may reflect an inflexible prior precision. This idea of more inflexible priors in ASC is consistent with a recent study showing that predictions are updated more slowly in ASC (Lieder et al., 2019). Behavioral studies found that priors biased perception either in a typical way in ASC (Corbett et al., 2016; Croydon et al., 2017; Ego et al., 2016; Van de Cruys et al., 2017), or to a smaller extent (Karaminis et al., 2016; Król & Król, 2019). Probabilistic learning tasks investigating how people with ASC learn expectations in uncertain environments showed that adults with ASC (Robic et al., 2014) or with more autistic traits (Goris et al., 2020) had lower performance in a volatile environment, but Manning and colleagues (2016) found that children with ASC were able to adapt their learning rate in a volatile context. Finally, in another associative learning task, neurotypical adults had longer response times when the cue–outcome association was unexpected versus expected, whereas there was no such modulation in the ASC group (Lawson et al., 2017). This result was interpreted as a more inflexible surprise in ASC, but might also be due autistic participants not learning the association if they ignored the auditory cue that was irrelevant to perform the task (i.e., determining if an image displayed a house or a face). In contrast, explicitly asking for a prediction response after hearing the cue would ensure that participants try to learn the probabilistic association.
Interestingly, Weilnhammer et al. (2018) developed an associative learning task to assess prediction learning through an explicit response (i.e., giving a prediction response) and an implicit response (i.e., measuring how priors bias percepts). In their task, there was a probabilistic association between a tone and a rotation direction of two dots (clockwise or counterclockwise). After hearing a tone, participants had to predict the rotation direction. Then, they saw two rotating dots and had to report their percepts. Importantly, the paradigm included unambiguous trials (with two dots rotating) and ambiguous trials where the dots did not rotate (but simply appeared first in a vertical and then in a horizontal position). The ambiguous trials provided an implicit measure of prior learning, as participants tended to report a rotation direction that matched their expectations.
Here, we used an adaptation of the task developed by Weilnhammer and colleagues (2018) to assess whether adults with ASC can learn and update their priors in uncertain environments. In this task, participants had to give a prediction response about the tone-rotation association, and then a perception response about they perceived. The paradigm encompassed three forms of uncertainty: sensory uncertainty due to the presence of ambiguous trials, expected uncertainty due to a cue-outcome association being at 62.5%, and unexpected uncertainty due to the volatility of the context (i.e., sudden reversals of the cue-outcome associations).
Using the prediction response, we investigated whether adults with ASC could explicitly learn the association, and whether they could update their expectations after a change in contingency. Using the perception response in ambiguous trials, we assessed whether priors implicitly biased perception in ASC. Computational models helped studying whether perceptual expectations were mostly driven by associative learning (i.e., the influence of the current hidden contingency), priming (i.e., the influence of the percept in the preceding trial) and/or sensory memory (i.e., the influence of the preceding ambiguous trial on the next ambiguous trial). Comparing the response times to give the perception response in ambiguous versus unambiguous trials also allowed us to investigate if ambiguity increases the uncertainty of the percepts. Finally, we gained insights about metacognition in a last block where participants reported how sure they were about their percepts. We investigated whether ambiguous trials were indeed rated as more uncertain, and whether the delay in response time in ambiguous trials (vs. unambiguous trials) was correlated with an increase in uncertainty rating in these trials.
Methods
Participants
Twenty-nine neurotypical (NT) adults and 25 adults with ASC were included in this behavioral study (Table 1). In addition to these 54 participants, four participants were excluded from the analyses: three NT participants had high rates of unanswered trials (more than 25% of unanswered trials, vs. 2% ± 3 in the rest of the NT group) and one ASC participant was an outlier (68% of correct perception responses in unambiguous trials, vs 99% ± 2 in the rest of the ASC group).
Demographic characteristics (group means ± standard deviations).

NT: neurotypical; ASC: Autism Spectrum Condition.
Note that AQ scores from 2 NT participants are missing.
p < 0.05, ns: non-significant if p > 0.05.
Participants with ASC received their diagnoses of ASC from a multidisciplinary Expertise Center for Autism in a standardized way according to the criteria of DSM-5 (American Psychiatric Association, 2013). All the ASC participants had a diagnosis of ASC without intellectual disability (Intelligence Quotient above 70 at the Wechsler Adult Intelligence Scale IV (Wechsler, 2008)).
Inclusion criteria were being between 18 and 50 years old and reporting normal or corrected-to-normal hearing and vision. Exclusion criteria for the NT participants were being diagnosed with a psychiatric or neurologic disorder, being under current neuropsychiatric medication and scoring higher than 32 out of 50 at the Autism-spectrum Quotient (AQ, Baron-Cohen et al., 2001). In the ASC group, seven participants reported having one or more comorbidities, and nine ASC participants reported being under current medication.
Neurotypical participants were recruited at the university, and participants with ASC were recruited at the Expertise Center for Autism (part of the university hospitals).
This study was approved by the medical Research Ethical Committee of the university hospitals. All participants provided written informed consent before starting the experiment.
Overall procedure
Prior to the experiment, participants filled out the AQ questionnaire (Baron-Cohen et al., 2001). They performed a short training (seven trials) followed by four blocks of the main task (total of 384 trials), and one block with the confidence rating task (64 trials). The experiment relies on the paradigm developed by Weilnhammer and colleagues (2018).
Participants sat in a quiet and darkened room, at about 60 cm from the computer screen (Dell Monitor U2410, spatial resolution 1920 × 1200) and wore headphones. They used their dominant hand to give answers using the keyboard. Stimuli were displayed using the Psychtoolbox implemented in Matlab (version R2018a).
Experimental procedure of the main task
Trial structure
Participants performed a probabilistic associative learning task (Figure 1(a)). They first had to predict the rotation direction of a pair of dots after hearing a tone, and second to report the rotation direction they perceived. They were instructed that there was an underlying association between the tone and the rotation direction, and that this association could change over time.
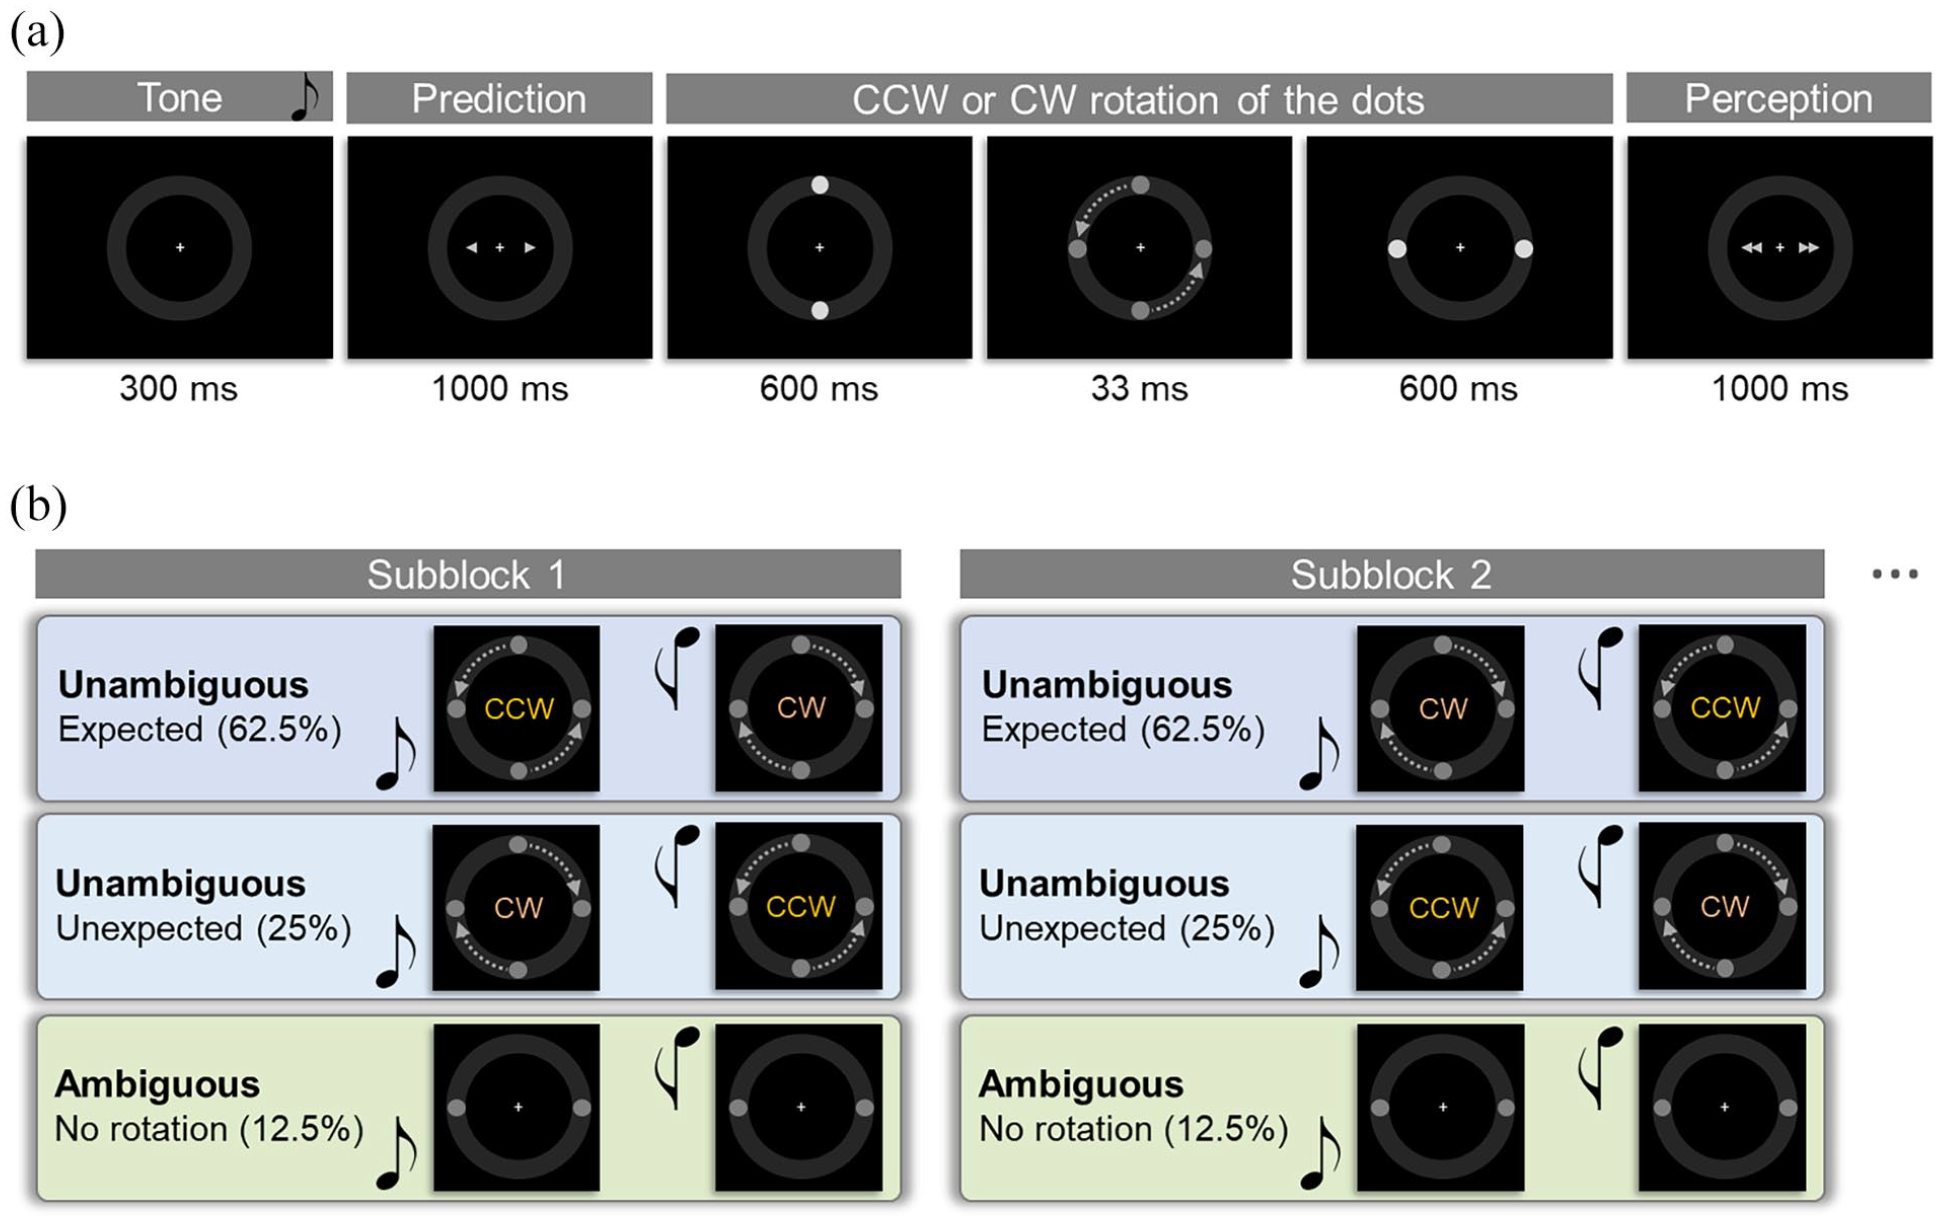
Experimental design: (a) Trial structure. At each trial, subjects heard a high or low tone, predicted the rotation direction (CW or CCW), saw a pair of dots rotating (except in ambiguous trials), and reported their perception (CW or CCW). (b) Block structure. Each block consisted of four subblocks that were 16, 24, or 32 trial long. CW: Clockwise. CCW: Counterclockwise.
A high (576 Hz) or low (352 Hz) tone was played for 300 ms. After a jitter of 100 to 300 ms (uniform distribution), the prediction screen showing a right and a left arrow appeared for 1000 ms. Participants had to click on the left or right arrow of the keyboard, if they predicted that a counterclockwise (CCW) or clockwise (CW) rotation would follow, respectively. To highlight the choice of the participant, the selected arrow turned red. Then, the two dots appeared at their vertical position for 600 ms, made a CW or CCW rotation within 33 ms, and remained at their horizontal position for 600 ms. The perception screen appeared for 1000 ms, showing a left and a right double arrow. Participants had to report the direction of the rotation, using the left or right arrow key of the keyboard to report a CCW or CW rotation, respectively. After clicking, the arrow that was selected turned red. The inter-trial interval lasted for 500 to 2500 ms (uniform distribution, average of 1500 ms). During all the trials, a white fixation cross was displayed at the center of the screen.
There were two types of trials: ambiguous and unambiguous trials. In unambiguous trials, there was a CW or CCW rotation of the dot pair. In ambiguous trials, the two dots appeared in their vertical position and then in their horizontal position (without rotating).
The prediction response provided an explicit measure of associative learning, while the perception response in ambiguous trials provided a more implicit measure (i.e. they should be perceived according to the current contingency if they are biased by their expectations (Weilnhammer et al., 2018)).
Block structure
Each block consisted of 96 trials, divided within four subblocks: one subblock of 16 trials, two subblocks of 24 trials, and one subblock of 32 trials. The order of these subblocks was randomized. Within one subblock, there was a small fraction (12.5%) of ambiguous trials and a large fraction (87.5%) of unambiguous trials (Figure 1(b)).
In the unambiguous trials, there was an underlying contingency between the tone and the rotation direction. In 71.4% of the unambiguous trials (i.e. 62.5% of all trials), the tone–rotation association was consistent with the current contingency (i.e., expected unambiguous trials). In 28.6% of the unambiguous trials (i.e. 25% of all trials), the tone–rotation association was inconsistent with the main contingency (i.e., unexpected unambiguous trials). Among the unambiguous trials, 50% showed CW rotations and 50% showed CCW rotations.
Therefore, in each block of 96 trials, there were 12 ambiguous trials (12.5%), 60 expected unambiguous trials (62.5%), and 24 unexpected unambiguous trials (25%). These trial type proportions remained the same within eight successive trials. The contingency reversed when starting a new subblock. Note that the proportions of trial types differ somewhat from the study by Weilnhammer and colleagues (2018; i.e., in their study: 12.5% of ambiguous trials, 75% of expected unambiguous trials, and 12.5% of unexpected unambiguous trials). In our study, we doubled the percentage of unexpected ambiguous trials in order to create a more uncertain environment, and therefore to investigate how adults with ASC learn prediction in uncertain contexts and deal with different forms of uncertainty (sensory, expected, and unexpected uncertainty).
Experimental procedure of the confidence rating task
Trial structure
Participants performed a confidence rating task, where the structure of the trials was the same as in the main task, but in addition, they had to rate how sure they were about their percept. The confidence rating screen appeared for 2600 ms, showing the following ratings: “1. Very sure,” “2. Quite sure,” “3. Quite unsure” or “4. Very unsure.” Participants used the numbers 1 to 4 on the keyboard to answer. After selecting a number, their answer was highlighted in red.
Block structure
Participants performed one confidence rating block after completing the four blocks of the main task. The confidence rating block consisted of 64 trials, divided in two subblocks of 32 trials. There were 50% of ambiguous trials and 50% of unambiguous trials (43.75% expected and 6.25% unexpected unambiguous trials). Note that in this block, the percentage of ambiguous trials was higher than in the main task, as the main goal was to compare confidence responses in ambiguous versus unambiguous trials.
Statistical analyses
Demographic data of the two groups (Table 1) were compared using Student t-tests and proportion tests. In the main task, one-sample t-tests (with μ = 0.50) were used to compare performance to chance level in each group. Groups were compared using two-sample t-tests. Response times (RT) were based on the individual median RT. Accuracy and RT were analyzed using repeated-measure ANOVAs, with group as a between-subject factor (NT vs. ASC) and condition as a within-subject factor (ambiguous vs. unambiguous or expected vs. unexpected). Student t-tests were used as post hoc tests. Effect sizes are reported as Cohen’s d: very small (d = 0.01), small (d = 0.20), medium (d = 0.50), large (d = 0.80) or very large (d > 1.20) effect sizes (Cohen, 1988; Sawilowsky, 2009). In addition, we report Bayes Factors10 in favor of the H1 hypothesis for all these tests.
In the confidence task, a mean confidence rating was calculated for ambiguous and unambiguous trials: the 1 to 4 scale (Very sure to Very unsure scale) was transformed into a 100% to 0% certainty scale, for an easier understanding of the certainty rating scale.
Correlations were assessed using Pearson’s correlation tests. A Pearson’s r of 0.10 is considered as a small effect, 0.30 as a medium effect, and 0.50 as a large effect. Correlations were compared between groups using Fisher’s test.
Data were processed using Matlab (version 2019a) and statistical analyses were performed using R (version 2.15.3, http://www.r-project.org/). All student t-tests were two-tailed. Results are presented as Mean (±Standard Deviation). The threshold for statistical significance was set at p < 0.05.
Bayesian modeling
In line with Weilnhammer and colleagues (2018), we used a Bayesian modeling approach that evaluates the updating of predictions in the main task. It allows assessing whether perceptual expectations are mostly driven by associative learning (i.e., the influence of the current hidden contingency), priming (i.e., the influence of the percept in the preceding trial) and/or sensory memory (i.e., the influence of the preceding ambiguous trial on the next ambiguous trial). The models were developed by Weilnhammer and colleagues (2018), and the full mathematical model description is detailed in their manuscript. The prior parameters are described as Supplementary Information (Table S1).
The behavioral model consists of a contingency model and a perceptual model (Figure 4(a)). The contingency model infers the tone-rotation associations throughout the main experiment to determine the prediction response, using a three-level Hierarchical Gaussian Filter (HGF; Mathys et al., 2011; Mathys et al., 2014). The contingency model is coupled with a perceptual model, which predicts the perceptual choices under the influence of associative learning (inferred from the contingency model), priming and sensory memory. We fitted eight models on the data: associative learning (A), priming (P) and/or sensory memory (S) (i.e. none, A, P, S, AP, AS, PS, APS).
The models were fitted on the prediction response about the upcoming rotating direction of the dot pair (yprediction) and the perception response about the rotation direction perceived (yperception). Model inversions were performed separately for each block of the main task. We used a version of the HGF for binary inputs, with the quasi-Newton Broyden–Fletcher–Goldfarb–Shanno minimization as optimization algorithm. The HGF was implemented in the HGF 4.0 toolbox (TAPAS toolbox—Translational Algorithm for Psychiatry-Advancing Science, translationalneuromodeling.org/tapas/) in Matlab (R2019a version).
We used random effects Bayesian Model Selection (BMS; Stephan et al., 2009) in SPM12 (http://www.fil.ion.ucl.ac.uk/spm/) to assess which of the eight models best fitted the data. We report the exceedance probability, that is, the probability that a given model is more likely than any other model (among the eight models tested). We also report the group-level Bayesian Information Criterion (BIC), that is, the BIC scores summed across participants, for each model as a Supplementary Table (Table S2).
For each participant, the posterior parameters of each model were averaged across the four blocks of the main task. Then, using Bayesian Model Averaging (BMA), we estimated the associative learning precision πa, the sensory memory precision πs, the priming precision πp, the second-level learning rate ω2 and the third-level learning rate ω3 for each participant. The second-level represents the probabilistic association between the cue (i.e., high or low tone) and the outcome (i.e., clockwise or counterclockwise rotation). The third level corresponds to the volatility of this probabilistic association across time (i.e., whether it will remain stable or change). The precision parameters of the winning model were compared using Bayesian estimation (BEST; Kruschke, 2013).
Community involvement
When setting up the experiment, an autistic adult gave us feedback about the task (e.g., clarity of the instructions). Furthermore, the results were presented to a local consortium including autistic adults, and interpretations were discussed with them.
Results
Main associative learning task
Prediction response
Mean prediction response
A correct prediction response refers to a response that matches the main tone-rotation association within a subblock. The mean percentage of correct predictions was 61% (±7) in the NT group and 58% (±6) in the ASC group (Figure 2(a)). These percentages were significantly different from chance level (50%) in both groups (NT: t(28) = 8.9, p < 0.0001, d = 1.66, BF10 = 1.0 × 10⁷; ASC: t(24) = 7.0, p < 0.0001, d = 1.40, BF10 = 5.5 × 10⁴). There was a trend toward a significant group difference (t(52) = 1.9, p = 0.06, d = 0.52, BF10 = 1.2), suggesting more accurate predictions in the NT group than in the ASC group.

Associative learning in the main task: (a) Mean percentage of correct predictions. (b) Mean percentage of ambiguous trials perceived according to the main current contingency. (c and d) Correlations between the percentages of correct predictions and of ambiguous trials perceived according to the current contingency in NT (c) and ASC (d). Error bars indicate standard deviations. Significance levels: *p < 0.05, **p < 0.005.
The mean response time (RT) to give a prediction answer was 540 ms (±90) in the NT group and 530 ms (±97) in the ASC group (no significant group difference).
Prediction learning throughout the task
To investigate the dynamics of prediction learning, we compared the percentages of correct predictions at the beginning vs. end of a subblock. We refer to the beginning and end of a subblock (of 16, 24, or 32 trials) as the first eight and last eight trials, respectively. The percentages of correct predictions at the beginning and end of subblocks were, respectively, 55% (±5) and 64% (±8) in the NT group (Figure 3(a)), and 58% (±6) and 58% (±7) in the ASC group (Figure 3(b)).
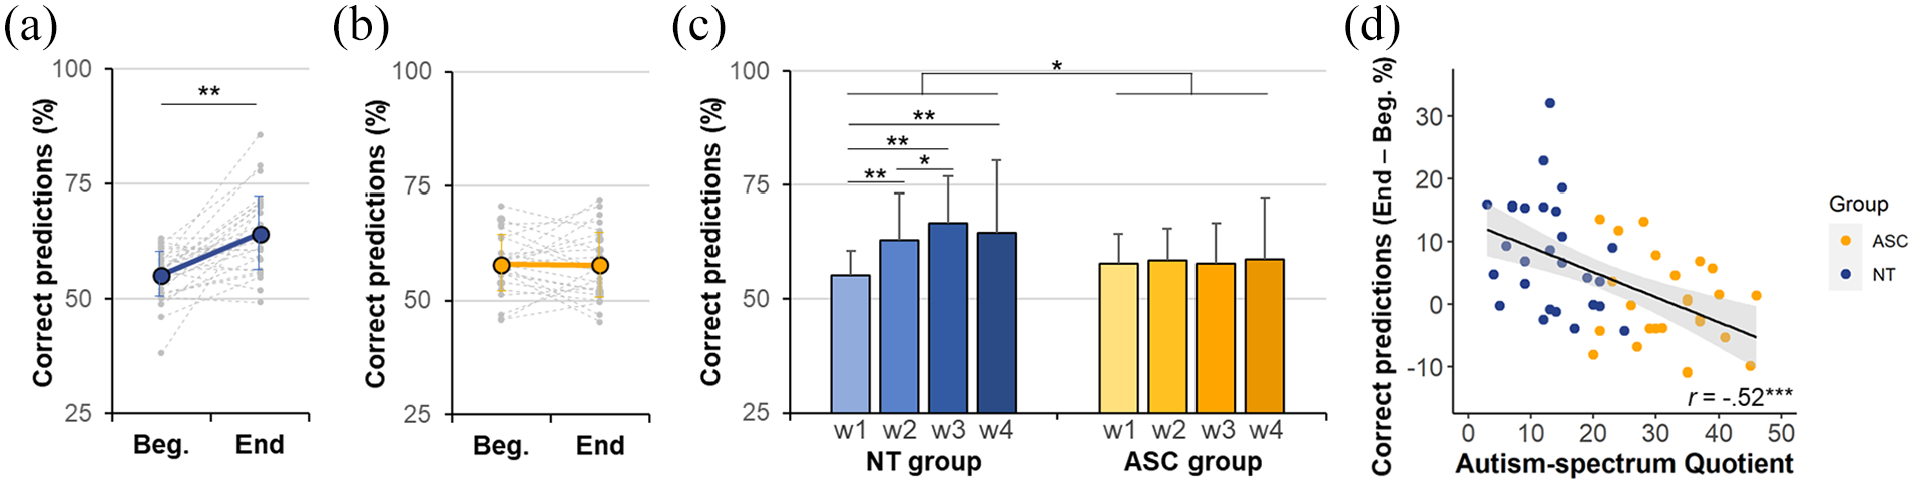
Prediction learning dynamics: (a and b) Mean percentages of correct predictions in the NT (a) and ASC (b) groups at the beginning (Beg.) and end of a subblock in the main task. Gray dotted lines represent individual data, while the thick line corresponds to the group mean. (c) Mean percentage of correct predictions across four time-windows (w1, w2, w3, w4) corresponding to eight successive trials within one subblock. (d) Correlation between the Autism-spectrum Quotient (AQ) and the difference in percentages of correct predictions between the end and the beginning of a subblock. Error bars indicate standard deviations. Significance levels: *p < 0.05, **p < 0.005.
An ANOVA assessing the effect of group (NT vs. ASC) and part (beginning vs. end) on the percentage of correct predictions revealed an effect of part (F(1, 52) = 17.7, p < 0.0001) and an interaction between part and group (F(1, 52) = 15.5, p < 0.0005). Post hoc t-tests showed that the percentage of correct predictions was higher at the end than at the beginning of the subblock (t(53) = 3.7, p < 0.0005, d = 0.51, BF10 = 55). In the NT group, the percentage of correct predictions was significantly higher at the end of a subblock than at the beginning (t(28) = 5.2, p < 0.0001, d = 0.96, BF10 = 1.2 × 10³), whereas there was no significant difference in the ASC group (t(24) = 0.0, p = 0.98, d = 0.01, BF10 = 0.2). Between groups, the percentages differed at the end of the subblock (t(52) = 3.0, p < .005, d = 0.81, BF10 = 8.7), but not at the beginning (t(52) = 1.7, p = 0.10, d = 0.45, BF10 = 0.8).
The AQ was negatively correlated with the difference in percentages of correct predictions between the end and the beginning of a subblock (r = −0.52, p < 0.0001, BF10 = 3.1 × 10², Figure 3(d)). Note that these correlations did not reach the significance level within groups (NT: r = −0.32, p = 0.10, BF10 = 1.3; ASC: r = −0.23, p = 0.26, BF10 = 0.7).
To refine the understanding of prediction learning within a subblock, we performed the same analyses on four time windows of eight trials within a subblock (statistical analyses described as Supplementary Information, analysis S1). The results, shown in Figure 3(c), confirm that there was no significant increase in percentage of correct predictions in ASC, whereas there was an increase in NT.
Perception response
Perception response in unambiguous trials
In unambiguous trials, the mean percentage of correct perception responses was 99% (±2) in both groups (no significant group difference). The percentages of correct perception response in expected and unexpected unambiguous trials were, respectively, 99% (±1) and 98% (±2) in the NT group, and 99% (±2) and 98% (±2) in the ASC group. The mean RT for expected and unexpected trials were, respectively, 231 ms (±82) and 223 ms (±81) in the NT group, and 256 ms (±116) and 251 ms (±127) in the ASC group. ANOVAs performed on the mean accuracy and RT revealed no significant effect of group or expectedness.
Perception response in ambiguous trials
In ambiguous trials, a perception response is considered as being correct if it matches the current tone-rotation association. The mean percentage of correct perception responses in ambiguous trials was 61% (±9) in the NT group and 56% (±6) in the ASC group (Figure 2(b)). These percentages were different from chance level in the NT (t(28) = 6.5, p < 0.0001, d = 1.20, BF10 = 3.3 × 10⁴) and ASC (t(24) = 4.9, p < 0.0001, d = 0.98, BF10 = 4.7 × 10²) groups. The NT group had a higher percentage of correct ambiguous trials than the ASC group (t(52) = 2.2, p < 0.05, d = 0.60, BF10 = 2.0). The mean RT associated to this response was 285 ms (±91) in the NT group and 282 ms (±115) in the ASC group (no significant group difference).
Unambiguous vs ambiguous trials
We assessed whether ambiguous trials were associated with an increase in response time compared to unambiguous trials. The mean RT in unambiguous and ambiguous trials were, respectively, 227 ms (±82) and 285 ms (±91) in the NT group, and 251 ms (±116) and 282 ms (±115) in the ASC group. An ANOVA on RT with the factors group (NT vs. ASC) and trial type (ambiguous vs. unambiguous) revealed an effect of the trial type (F(1, 52) = 32.0, p < 0.0001) and a non-significant trend toward an interaction between trial type and group (F(1, 52) = 2.7, p = 0.11).
The RT was longer in ambiguous than unambiguous trials (t(53) = 5.6, p < 0.0001, d = 0.76, BF10 = 1.8 × 10⁴), with this effect being also significant within groups (NT: t(28) = 5.0, p < 0.0001, d = 0.93, BF10 = 1.7 × 10⁴; ASC: t(24) = 3.2, p < 0.005, d = 0.65, BF10 = 3.5). Between groups, the mean RTs did not differ significantly (p values > 0.33).
Correlation between the prediction and perception response
We assessed correlations between the two main measures of prediction learning: the percentage of correct predictions (explicit measure) and of correct perception response in ambiguous trials (implicit measure). There was a positive correlation between these variables across groups (r = 0.59, p < 0.0001, BF10 = 7.8 × 10³) and within groups (NT group: r = 0.52, p < 0.005, BF10 = 13; ASC group: r = 0.66, p < 0.0005, BF10 = 77; Figure 2(d) and (e)). These correlations did not differ significantly between groups (p = 0.46).
Behavioral modeling of the main task
Bayesian model selection
Random-effect Bayesian Model Selection (BMS) comparing the eight models revealed that the model best explaining the data in both groups was the model combining the factors associative learning and priming (Model AP) (Figure 4(b)). The exceedance probability for the model AP was 0.59 in the NT group and 0.96 in the ASC group. In NT, the second model best explaining the data was the model A (exceedance probability of 0.28).

Hierarchical Gaussian Filter model of the associative learning task: (a) Illustration adapted from Weilnhammer et al. (2018). The model consists of a contingency level and a perceptual level that interact. The contingency model is a standard Hierarchical Gaussian Filter (HGF) model with μ1, μ2, and μ3 as first, second, and third level predictions of the HGF model, ω2 and ω3 the second and third level learning rates, and κ2 the coupling strength between the second and third levels. The participant’s responses are the prediction response yprediction and the perception response ypercept. The perceptual model considers the influence of associative learning (mean μa and precision πa), priming (mean μp and precision πp), and sensory memory (mean μs and precision πs). P(θ1) represents the posterior probability of perceiving a CW rotation. The sensory stimulations are the CW or CCW rotations with the disambiguation factor (mean μdis and precision πst) and the high or low tone β. ζ is the decision temperature. (b) Bayesian model comparison of the eight models assessing the influence of sensory memory (S) and/or priming (P) and/or associative learning (A), or none of these effects (0). The model AP (associative learning and priming) has the highest exceedance probability in both groups. (c) Bayesian model averaging assessing the precisions of the associative learning factor πa and of the priming factor πp. (d) Mean second-level (ω2) and third-level (ω3) learning rates in the NT and ASC groups. (e and f) Correlations between the mean percentage of correct predictions and the learning rate in the NT group (e) and ASC group (f). **p < 0.005, ***p < 0.0005.
Posterior model parameters
The influence of associative learning was stronger in NT than ASC (NT: πA = 1.46 ± 0.36; ASC: πA = 1.17 ± 0.31; BEST, t(52) = 3.2, p < 0.005, d = 0.86, BF10 = 14). The influence of priming was not significantly different between groups (NT: πP = 0.20 ± 0.17; ASC: πP = 0.26 ± 0.16; BEST, t(52) = 1.1, p = .26, d = 0.31, BF10 = 0.5), nor was the influence of sensory memory (NT: πS = 0.31 ± 0.39; ASC: πS = 0.31 ± 0.41; BEST, t(50) = 0.0, p = 0.99, d = 0.00, BF10 = 0.3). The parameters of the best model (Associative learning and Priming) are shown in Figure 4(c). Within groups, the influence of associative learning was stronger than the influence of priming in both groups (NT: BEST, t(28) = 16.0, p < 0.0001, d = 2.96, BF10 = 4.3 × 10¹²; ASC: BEST, t(24) = 12.5, p < 0.0001, d = 2.51, BF10 = 1.7 × 10⁹). Posterior parameter estimates are shown as Supplementary Information (Table S1).
The second-level and third-level learning rates were ω2 = −1.53 (± 1.11) and ω3 = −6.18 (± 0.11) in the NT group, and ω2 = −1.59 (± 1.13) and ω3 = −6.19 (± 0.17) in the ASC group (Figure 4(d)). The learning rates were not significantly different between groups (ω2: BEST, t(52) = 0.2, p = 0.85, d = 0.05, BF10 = 0.3; ω3: BEST, t(52) = 0.4, p = 0.70, d = 0.11, BF10 = 0.3).
As expected, the mean percentage of correct predictions was strongly correlated with the second-level learning rate (NT: r = 0.75, p < 0.0001, BF10 = 3.4 × 10⁴; ASC: r = 0.77, p < 0.0001, BF10 = 1.4 × 10⁴; Figure 4(e) and (f)). The percentage of ambiguous trials perceived according to the current contingency and the second-level learning rate were marginally correlated in NT (r = 0.31, p = 0.096, BF10 = 1.3) and significantly correlated in ASC (r = 0.55, p < 0.005, BF10 = 11).
Confidence rating task
Prediction and perception responses
The mean percentage of correct predictions was 63% (±12) in the NT group and 61% (±15) in the ASC group (no significant group difference). The percentage of ambiguous trials perceived according to the current contingency was 58% (±13) in NT and 59% (±14) in ASC (no significant group difference).
Confidence rating response
The mean certainty ratings for ambiguous and unambiguous trials were, respectively, 52% (±27) and 85% (±17) in the NT group, and 69% (±27) and 95% (±8) in the ASC group (Figure 5(b)). An ANOVA on certainty rating with the factors group (NT vs. ASC) and trial type (ambiguous vs. unambiguous) showed a group effect (F(1, 52) = 10.4, p < 0.005), a trial type effect (F(1, 52) = 53.1, p < 0.0001) and no significant interaction (F(1, 52) = 0.9, p = 0.35). Post hoc t-tests showed that participants gave higher certainty rating for unambiguous than ambiguous trials (t(53) = 7.3, p < 0.0001, d = 0.99, BF10 = 7.4 × 10⁶). The ASC group gave higher certainty ratings than the NT group (t(106) = 2.7, p < 0.01, d = 0.53, BF10 = 5.4).
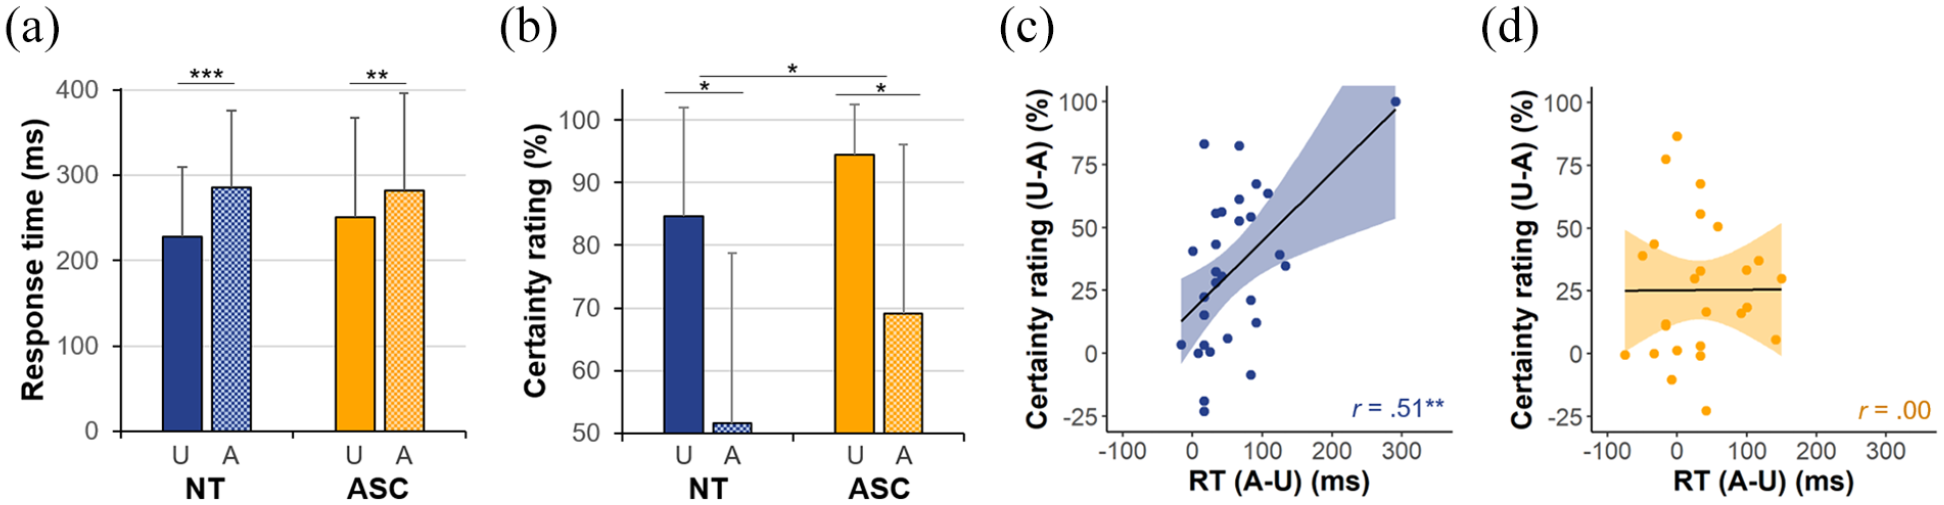
Effect of ambiguity on response time and certainty rating. (a) Mean response time in the main task for ambiguous and unambiguous trials. (b) Certainty rating in the confidence task for ambiguous and unambiguous trials. (c and d) Correlations between the certainty rating for unambiguous minus ambiguous trials and response time for ambiguous minus unambiguous trials in the NT (c) and ASC (d) groups. Error bars indicate standard deviations U: Unambiguous trials (solid color). A: Ambiguous trials (spotted color). Significance levels: *p < 0.05, **p < 0.005, ***p < 0.0005.
Correlations between measures of uncertainty
We assessed whether the explicit certainty rating for unambiguous vs. ambiguous stimuli was correlated with an implicit measure of certainty: the RT to give the perception response for unambiguous vs. ambiguous stimuli. The difference in certainty rating (unambiguous minus ambiguous) was positively correlated with the difference in RT (ambiguous minus unambiguous, in the main task) across groups (r = 0.31, p = 0.02, BF10 = 3.4). This correlation was significant within the NT group (r = 0.51, p < 0.005, BF10 = 12.2, Figure 5(c)) but not ASC group (r = 0.00, p = 0.98, BF10 = 0.4, Figure 5(d)). Correlations significantly differed between groups (p = 0.05). In Figure 5(c), one NT participant appears to be an outlier, but note that the correlation is marginally significant in the NT group after removing this participant (r = 0.34, p = 0.07, BF10 = 1.5). Data per trial type (ambiguous or unambiguous) are shown as Supplementary Information (Figure S1).
Discussion
We used an associative learning task in a volatile environment to investigate whether adults with autism could learn and update their expectations in an uncertain environment. Both groups managed to learn predictions, but contrary to the NT group who had increasing percentages of correct predictions when the contingency remained stable, the ASC group did not show any increase. Both groups tended to perceive ambiguous trials according to the current contingency, suggesting that priors biased their perception. Yet, this prior bias was smaller in ASC than NT. Models showed that both groups had their perceptual expectations mostly influenced by associative learning, but this influence was smaller in ASC than NT. There was no significant difference in learning rates between the groups. Finally, both groups rated unambiguous trials as more certain than ambiguous trials, suggesting a form of meta-confidence. In NT only, the differences in certainty ratings and responses times between unambiguous and ambiguous trials were correlated.
As different types of uncertainty contribute to shaping expectations about the environment, results are discussed in the framework of sensory, expected, and unexpected uncertainties.
Learning expectations under sensory uncertainty
The task presented here included ambiguous trials where the dot pair did not rotate. Sensory uncertainty was therefore very high in these trials, leading participants to rely on their prior expectation to give a perception response. It should be noted that explicitly asking for a prediction response might have influenced the perception response, especially in ambiguous trials. In ambiguous trials, both groups tended to report perceiving a rotation that followed the current contingency, showing that they learnt a prior that biased their perception. Yet, we observed a smaller bias in the ASC group (d = 0.60), consistently with the theory of “hypo-priors” in ASC formulated by Pellicano and Burr (2012). Nonetheless, it should be noted that autistic individuals would not have a uniformly decreased prior precision, as they sometimes show intact priors (e.g. Van de Cruys et al., 2017). Thus, the prior weight on perception might be different or not in ASC compared to NT, depending on the context and on the type of priors investigated (e.g., structural vs. contextual priors, see Seriès & Seitz, 2013). In light of previous studies showing impaired prediction learning in a volatile context but not in a stable context (e.g., Robic et al., 2014), we can hypothesize that hypo-priors would only be observed in autistic individuals in uncertain contexts.
In the current study, another effect of sensory uncertainty on perception was the increased response times and the decreased certainty ratings in ambiguous trials in both groups. Within the Bayesian framework, a noisy sensory distribution (as in ambiguous trials) should be associated with a noisy posterior distribution, and therefore with a decreased confidence about the percept. The decreased prior bias on perception observed in ASC could either be due to a decreased prior precision or to an increased sensory precision (Brock, 2012). A distinction between these two alternatives is that an increased sensory precision would lead to a more precise posterior distribution (i.e. more confident percept, as observed in the ASC group), whereas a decreased prior precision would lead to an unprecise posterior distribution. Hypotheses about the causes of the decreased prior bias will be further developed in the following sections.
Learning expectations under expected uncertainty
In this task, expected uncertainty refers to the fact that the tone was predictive of the dot rotation direction in only 62.5% of the trials. Both groups had percentages of correct predictions above chance level (d > 1.40), suggesting that they managed to learn the association despite a rather high level of expected uncertainty. In the literature, results on probabilistic learning in ASC seem to depend on several factors (e.g. high vs. low probabilistic associations, see Solomon et al., 2011). A meta-analysis including a large variety of tasks (including probabilistic learning tasks) concluded that statistical learning in ASC was intact, on average (Obeid et al., 2016). Finally, a probabilistic reversal learning task performed on a large sample of individuals with ASC showed that less optimal learning was related to the reduced flexible behavior in ASC (Crawley et al., 2020).
Using computational models, we found that perceptual expectations were driven by associative learning and, to a smaller extent, by sensory memory in both groups. This result is consistent with the findings by Weilnhammer et al. (2018) in NT and suggests that both groups relied on the same learning mechanisms to perform the task. In addition, the second-level learning rate (about the cue-outcome association) was not significantly different between groups, consistently with other probabilistic learning studies involving adults with ASC (Lawson et al., 2017), children with ASC (Manning et al., 2016) and adults with high autistic traits (Goris et al., 2020). Interestingly, in the study by Goris et al. (2020), adults with more autistic traits did not significantly differ in learning rates but had a lower performance level in a volatile environment. Here, the ASC group had a smaller strength of associative learning and a smaller prior bias, in spite of equal average learning rates. It suggests that the prior may have been learnt at the same speed in both groups, but less precisely in the ASC group.
Furthermore, we had hypothesized that expected uncertainty would lead to longer response times in unexpected vs. expected trials. Yet, we did not observe this effect in neither of the two groups. This absence of effect in unambiguous trials may be due to the high sensory precision of the inputs in these trials, in combination with a relatively low prior precision. Lawson et al. (2017) observed an effect on response times for unexpected tone–outcome associations in NT, but the probabilistic association was higher in their task than ours (84% vs. 62.5%), probably leading to a more precise prior.
Learning expectations under unexpected uncertainty
In addition to dealing with sensory and expected uncertainties, participants had to handle unexpected uncertainty as the cue-outcome association could suddenly reverse. NT participants had more and more correct prediction responses from the beginning to the end of a subblock. In other words, NT participants updated their predictions about the cue-outcome association after a reversal in contingency (d = 0.96). In contrast, the mean percentage of correct predictions did not increase in ASC (d = 0.01), suggesting that they adjusted their predictions to a lesser extent or slower after contextual changes. The group comparison also revealed that the percentage of correct predictions at the end of a subblock was higher in NT than ASC (d = 0.81), reinforcing the idea that ASC participants failed to optimally update their predictions after a change in contingency. Other studies also showed impaired performance in probabilistic learning tasks in ASC (or in individual with autistic traits), specifically in volatile environments (Goris et al., 2020; Robic et al., 2014).
Previous studies revealed a slower prior learning in ASC (e.g. Lieder et al., 2019), consistently with the decreased prior update observed in the ASC group. However, it should be noted that in the present study, there was no significant difference in the third-level learning rate between the groups, suggesting a similar learning about the volatility of the environment in both groups. Using HGF, Lawson et al. (2017) found that the third-level learning rate was higher in ASC than NT. Note that they used a higher prior variance in their model, compared to our study, which may have influenced the results. In contrast, Manning et al. (2016) found that both children with and without ASC updated their learning rates in a volatile vs. stable context.
In the present study, given the similar volatility learning rates in both groups but the decreased prediction update in ASC, we can hypothesize that participants with ASC noticed the environmental changes, but failed to update their priors in an optimal way. Alternatively, this decreased prediction update in ASC may be viewed as a cost/benefit compromise in a very uncertain environment, where adjusting priors may seem too costly and eventually useless, as both groups still reached a similar level of performance on average.
As highlighted in the review by Palmer et al. (2017), the learning rate depends on the precision of the prediction error. According to the hypothesis of a High and Inflexible Precision of the Prediction Error in Autism (HIPPEA, Van de Cruys et al., 2014), the learning rate should be higher and more inflexible in ASC. The present study showed no significant difference in learning rate between groups, but showed a more inflexible behavior to adjust predictions in ASC. This would be in favor of an inflexible, but not higher, precision of the prediction error in ASC. Other studies also found a more inflexible precision of the prediction error in ASC, without a higher surprise response in ASC (Goris et al., 2018; Lawson et al., 2017).
Self-reported uncertainty
When participants were asked to judge how confident they were about their percepts, both NT and ASC participants indicated being more uncertain in ambiguous than unambiguous trials. This effect suggests that they were able to correctly assess which of the sensory stimuli were more uncertain, therefore revealing a form of metacognition in both groups. Being more uncertain in ambiguous than unambiguous trials was expected to be associated with slower answers in ambiguous than unambiguous trials. This effect was observed in the NT group, but not in the ASC group. In other words, the group level data reflected the individual data for these two effects in NT, but not in ASC. Hypotheses to explain this group difference may be that NT were better at assessing their uncertainty, and/or that they used the response time to converge toward a decision, contrary to the ASC group. An alternative explanation could be that ASC participants had a more inflexible behavior, as the reliability of the percept was not used to adapt their behavior (i.e., to modulate their response time). Nonetheless, this correlation result should be interpreted with caution given the trends toward correlations presented as Supplementary Information.
Interestingly, ambiguous trials were perceived as relatively certain, suggesting that participants were indeed biased by their priors in these trials. Particularly, the certainty ratings were higher in the ASC group, which could be interpreted as a different use of the scale, or as different underlying mechanisms. It may reflect an increased precision of the posterior distribution in the ASC group, or a higher confidence in sensory inputs. If people with ASC trust their percepts more, even when they are non-informative (i.e., ambiguous trials), it may explain why priors would be updated suboptimally. Indeed, the more confident a participant is in a new observation, the more it should impact his or her prior knowledge (Meyniel et al., 2015). This hypothesis would be consistent with an inflexible precision of the prediction error, leading people with ASC to use both relevant and irrelevant information to adjust their prior.
Limitations
We discussed how perception was biased by expectations, but we would like to highlight that this task does not allow to directly assess whether perception itself or the response itself is biased by prior expectations. Neuroimaging studies could distinguish these two alternatives. Furthermore, we included participants with comorbidities and receiving medications, which is representative of the ASC population, but which may have influenced their behaviors. Yet, these participants did not behave as outliers. In the confidence task, fitting within-subject trial by trial models would better capture the RT/confidence rating relationship, but could not be performed here given the low number of trials in the confidence block.
Conclusion
Altogether, results showed that adults with ASC can learn predictions in uncertain environments and are biased by their expectations. However, in this volatile context, the prior bias was smaller in ASC, consistently with the hypo-prior hypothesis (Pellicano & Burr, 2012). Importantly, adults with ASC were more inflexible, as they update their priors to a lesser extent than NT after a contingency change. Slower prior learning in volatile contexts would explain the decreased prior update, smaller prior bias, and smaller influence of associative learning in ASC, but the learning rates were not significantly different between groups. The results tend to converge toward a more inflexible precision of prediction errors in ASC, but we did not find evidence of a higher precision of prediction errors. It is therefore partially in accordance with the hypothesis of a High and Inflexible Precision of the Prediction Error in Autism (Van de Cruys et al., 2014).
Future perspectives include using model-based functional MRI to identify the regions playing a key role in prior update. Besides, it would be interesting to investigate if the increased inflexibility observed in this task is associated with more repetitive behaviors and with a higher intolerance of uncertainty in the daily-life of individuals with ASC. Finally, comparing prior learning in other disorders of perceptual inference, such as schizophrenia, can contribute to refine the predictive coding theories.
Supplemental Material
sj-docx-1-aut-10.1177_13623613211045026 – Supplemental material for Associative learning under uncertainty in adults with autism: Intact learning of the cue-outcome contingency, but slower updating of priors
Supplemental material, sj-docx-1-aut-10.1177_13623613211045026 for Associative learning under uncertainty in adults with autism: Intact learning of the cue-outcome contingency, but slower updating of priors by Laurie-Anne Sapey-Triomphe, Veith A Weilnhammer and Johan Wagemans in Autism
Footnotes
Acknowledgements
We would like to thank Lise Raymaekers and Laura Timmermans for their help in recruiting participants and collecting data. We would like to thank Christophe Bossens for his help with programming the display of the experiment. We also thank Kobe Desender for the discussion about the confidence results. Finally, we thank all the participants for their time and the LAVA group of autistic adults for the interesting discussions.
Funding
The author(s) disclosed receipt of the following financial support for the research, authorship, and/or publication of this article: LAST was supported by postdoctoral fellowships of the M.M. Delacroix Foundation and of the H2020 Marie Skłodowska-Curie Actions. The research was financed by grants from a long-term structural funding from the Flemish Government to JW (METH/14/02).

Supplemental material
Supplemental material for this article is available online.
References
Supplementary Material
Please find the following supplemental material available below.
For Open Access articles published under a Creative Commons License, all supplemental material carries the same license as the article it is associated with.
For non-Open Access articles published, all supplemental material carries a non-exclusive license, and permission requests for re-use of supplemental material or any part of supplemental material shall be sent directly to the copyright owner as specified in the copyright notice associated with the article.
