
Abstract
To better understand the associations between social activities and depressive symptoms in adolescents and young adults with autism spectrum disorder, this study utilized interpersonal theories of depression by accounting for both frequency of various social activities and perceptions of how well their time spent in these activities meet their needs and testing the indirect effects of loneliness in this association. To test these ideas, 321 participants who were recruited from the Simons Foundation Powering Autism Research for Knowledge (SPARK) research match registry and completed online measures of social activities, depressive symptoms, and loneliness. While the specific pattern was different for individual activities, it was found that those who felt that their current frequency of activities did not meet their needs had higher rates of depressive symptoms than those who felt they did meet their needs and that loneliness help to understand the indirect effects of the association between social activities and depressive symptoms. Overall, the findings suggest that how individuals feel about the time they are spending in social activities, such as with friends and in general social activities, could impact outcomes such as depression and loneliness.
Lay Abstract
Previous studies have found that social activities and depressive symptoms in adolescents and young adults with autism spectrum disorder are related. To better understand the relationship between these issues, this study examined the frequency of various types of social activities as well as if the participants felt that the frequency of time spent in the activity met their personal needs. In addition, the role of loneliness was tested as a possible way to understand the relationship between activities and depressive symptoms. To test these ideas, 321 participants who were recruited from the Simons Foundation Powering Autism Research for Knowledge (SPARK) research match registry and completed online measures of social activities, depressive symptoms, and loneliness. While the specific pattern was different for individual activities, it was found that those who felt that their current frequency of activities did not meet their needs had higher rates of depressive symptoms than those who felt they did meet their needs. Also, loneliness helps to understand relationship between social activities and depressive symptoms. The findings were discussed in light of previous study findings, interpersonal theories of depression, and clinical implications.
Persistent difficulties with social functioning are a defining feature of autism spectrum disorder (ASD). Indeed, adults on the autism spectrum spend significantly less time in social activities (Liptak et al., 2011; Orsmond et al., 2013) and have fewer friendships than typically developing individuals and individuals with other neurodevelopmental disorders (Orsmond et al., 2013; Tobin et al., 2014). While participation in organized social events seems to be slightly more common than informal socializing, rates of participation in such activities are still lower than in the general population (Orsmond et al., 2004), with rates of structured social events declining after high school exit (Taylor et al., 2017). In addition to quantity, perceptions about the quality of social interactions have been found to be poorer among individuals on the autism spectrum compared to non-autistic individuals (McLeod et al., 2019).
Despite persistent social difficulties, qualitative and quantitative studies show that individuals on the autism spectrum desire social relationships and connections (Jones & Meldal, 2001; Müller et al., 2008; Sosnowy et al., 2019; Tesfaye et al., 2023). Thus, it should not be surprising that low social participation (Mazurek, 2013) and social anhedonia (Han et al., 2019) have been associated with loneliness in this population. Loneliness, in turn, may play an important role in understanding the particularly high rates of depression observed in people on the autism spectrum (Han et al., 2019; Hollocks et al., 2019; Smith & White, 2020; Umagami et al., 2022).
ASD, depressive symptoms, and social activities
Numerous studies show elevated rates of depressive symptoms for individuals on the autism spectrum, as well as higher rates of depression diagnoses (prevalence rates range from 20% to 52% in ASD compared to 5% in typically developing groups; Andersen et al., 2015; Costello et al., 2005; Hudson et al., 2019; Lever & Geurts, 2016; Leyfer et al., 2006; Pisula et al., 2017; Weiss et al., 2018). Studies of typically developing populations suggest that negative social experiences predict depressive symptoms. Specifically, fewer friendship (Bagwell et al., 1998; Sakyi et al., 2015), less perceived social support (Scardera et al., 2020), and lower quality of social interactions (Davila et al., 2012) are all predictive of increased depressive symptoms over time.
Cross-sectional studies have found similar relations in adolescents and adults on the autism spectrum, with social support, quantity of social interactions, and quality of social interactions associated with depression in this group (Bohnert et al., 2019; Gotham et al., 2014; Mazurek, 2014; Whitehouse et al., 2009). In addition, studies indicate that social skills interventions, which ultimately aim to improve social experiences, may also improve depressive symptoms (Rumney & MacMahon, 2017; Schiltz et al., 2018), further highlighting the impact of social experiences on depression. Overall, accumulating evidence points to social experiences of individuals on the autism spectrum as a potential target for prevention and treatment of depression. However, more details regarding associations between specific social experiences and depressive symptoms are needed before avenues for such interventions are viable.
Importance of distinguishing between time spent in social activities and meeting an individual’s social needs
When designing interventions that target social experience to improve depressive symptoms, it may be important for interventions to distinguish between how much time is spent in social activities and whether the amount of time spent in social activities meets the needs of the individual. Interpersonal theories of development suggest that the effects of social experiences on outcomes, especially depression, depend on both the amount of social contact and perceptions about whether the amount of contact meets the individual’s needs (e.g. Baumeister & Leary, 1995; Maslow, 1968; Sullivan, 1953). In general, these interpersonal theories propose that we are born with the need for social interactions, and when an individual’s needs for such interactions are not met, they experience negative thoughts and emotions, such as loneliness, which result in negative psychological and physiological outcomes. In these theories, it is not just the amount of time in social interaction that is critical, but whether the individual feels that their needs are being met in terms of the amount of social interaction. For individuals on the autism spectrum, who vary widely in terms of social motivation and needs, the fit between needs and experiences may be an especially important consideration. Thus, this study aims to examine the associations between social activities and depressive symptoms by accounting for both the amount of time spent in social activities and individuals’ perceptions of whether the amount of time spent in social activities met their needs.
Considering associations between types of social experiences and depressive symptoms
This study also considers the type of social experience when examining the impact of social activity on depressive symptoms. There is likely variability in the types of social activities that are important to a given individual. For instance, some people might prefer face-to-face interactions with friends, while others may prefer talking on the phone or interacting online. Previous studies of social activities in autism focus on face-to-face time with friends (Bohnert et al., 2019; Liptak et al., 2011; Orsmond et al., 2004, 2013), but considering multiple types of activities (e.g. face-to-face, online, texting, structured, as well as non-structured; Benford & Standen, 2009; Gillespie-Lynch et al., 2014; Stone et al., 2019) as well as multiple types of social partners (e.g. friends, classmates, parents, siblings; Atkin & Tozer, 2014; Mazurek, 2014) is necessary to fully understand associations between social experiences and depressive symptoms.
Current study
The goal of this study is to examine whether and how social activities are associated with depressive symptoms among autistic adults. To test whether the perceptions about the amount of time spent in an activity moderate the association between the amount of time spent in the activity and depressive symptoms (Research Question 1, RQ1), we examined self-reports from autistic adults about the amount of time they spent in different types of social activities (e.g. time spent with family; time spent with friends; going to social events), their perceptions about whether that the amount of time met their needs, and their depressive symptoms. We tested whether the association between the amount of time spent in an activity and depressive symptoms was stronger or weaker depending on perceptions about whether the amount of time met their needs (e.g. the frequency of time the adult spends with friends might have a stronger association with mental health if the time spent is perceived as “too little” as opposed to “just about right”).
Additionally, we tested whether the associations between social activities and depressive symptoms overlapped with self-reports of loneliness. In typically developing populations, interpersonal theories suggest that the connection between unfulfilling social engagement and depressive symptoms is explained by negative feelings, such as loneliness, which result from the unfulfilling social engagement (e.g. Baumeister & Leary, 1995; Maslow, 1968; Sullivan, 1953). This study tested whether this held true in a sample of young adults on the autism spectrum, by examining whether social activities and depressive symptoms were indirectly related through feelings of loneliness (Research Question 2, RQ2).
Method
Sample
The study sample consisted of 321 participants who were recruited from the Simons Foundation Powering Autism Research for Knowledge (SPARK) research match registry (SPARK Consortium, 2018) for a larger study on depression and service status (Zheng et al., 2021). Eligibility criteria for the original study included the following: (1) 18–35 years of age at the time of the study, (2) diagnosed with ASD before 18 years old, (3) able to self-report and consent for themselves, (4) completed the background history questionnaire when joining the SPARK registry. See Table 1 for participant characteristics.
Characteristics of the young adult sample (N = 321).
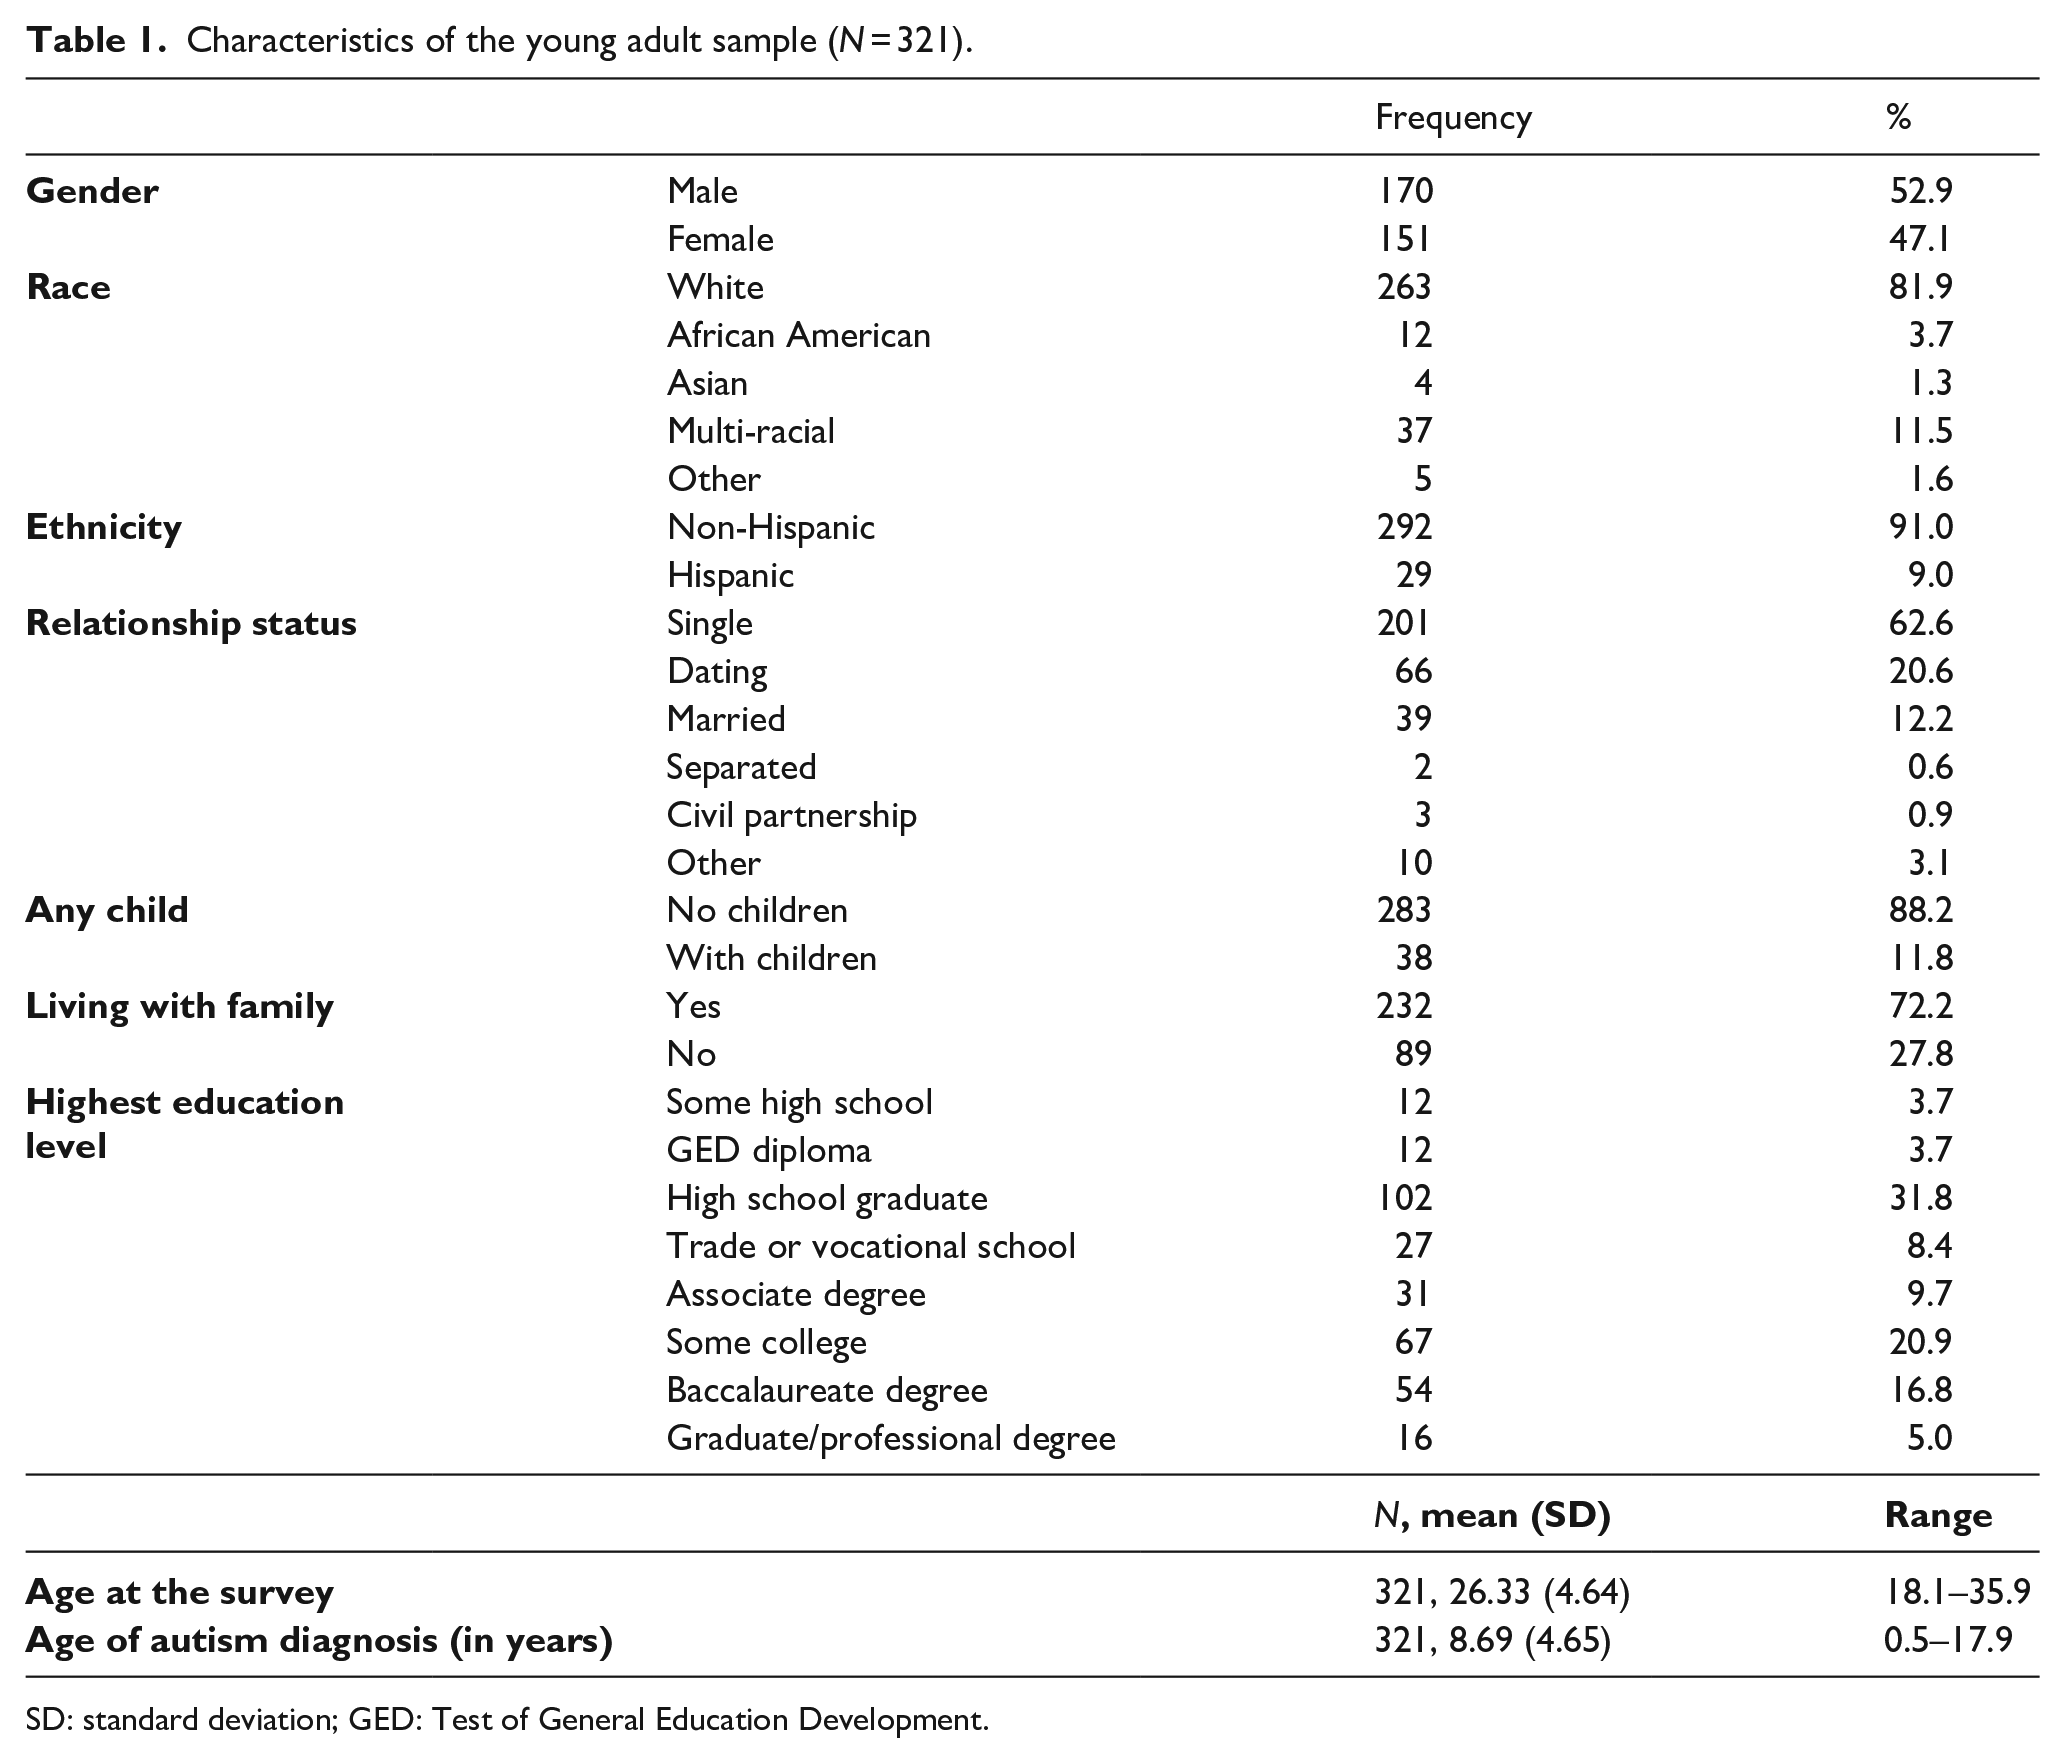
SD: standard deviation; GED: Test of General Education Development.
Procedures
Institutional Review Boards from each authors’ institution reviewed the study and provided approval, and a community advisory committee for SPARK approved this project. Invitation emails with a brief study description were sent, and interested individuals were directed to an online data collection platform to first provide electronic informed consent and then to complete the study survey. Typically, SPARK allots a 14-day recruitment period, but our goal of 300 participants was exceeded in only 8 days, with 322 participants consenting and 321 completing the online surveys. The goal of 300 participants was chosen as it provides sufficient power to detect a clinically meaningful effect of 0.20 and above for a standardized beta (using relatively conservative parameters of calculating power; Mathieu et al., 2012). Each participant who completed the survey received a $25 e-gift card.
Measures
Activities
To provide information about their activities, participants completed an adapted version of the Social Interests and Habits Questionnaire (SIHQ, Gotham et al., 2014). Seven types of activities were surveyed. Five inquired about social activities and were the focus of this study: time spent with family; time spent with friends; talking on the phone or texting with friends; emailing, chatting online, or playing videogames with friends; going to social events (e.g. community groups, birthday parties, dances, church socials).
For each activity, two measures were recorded: (1) the amount of time they spent in the activity and (2) perceptions about the amount of time spent in the activity. For the reported amount of time for each activity, participants were asked, “How often do you” followed by the description of the activity, with the following responses: 0 = never, 1 = a few times a year, 2 = at least once a month, 3 = several times a month, 4 = at least once per week, 5 = several times a week, 6 = everyday. Next, participants were asked whether the amount of time spent in that activity was “too much time,” “about the right amount of time,” and “too little time.” Across all activities, less than 2% (i.e. ns ranged from 2 to 6) reported that they felt they spent too much time on any of the activities, except for time spent with family (9.7%; n = 31). As such, coefficients could not be reliably estimated for “too much” responses. Thus, for each individual activity, we only coded responses reporting about right (0) and too little (1). Responses of too much time were excluded from the analyses for that activity. Two additional variables were created. The total reported amount of time across all social activities was created by summing the scores for time spent across all five social activities (Cronbach’s alpha = 0.62). The total number of “too little” responses was created by summing the too little responses across all five social activities (Cronbach’s alpha = 0.66).
Depressive symptoms
Participants were asked to self-report depressive symptoms using the Beck Depression Inventory-II (BDI-II; Beck et al., 1996). The BDI-II consisted of 21 sets of descriptive statements on depressive symptoms during the past 2 weeks. Consistent with previous studies in both the general population and autism samples (Williams et al., 2021), the BDI-II showed excellent internal consistency in the current sample (alpha = 0.95).
Loneliness
Participants reported their levels of loneliness on the 10-item Loneliness in Context Questionnaire for Adults (Weeks & Asher, 2014). This measure asks participants to rate their levels of loneliness (1 = never to 5 = always) during different times (e.g. “Mornings are a lonely time for me”) and situations (e.g. “I am lonely with other people” and “My place of residence is a lonely place for me”). It has shown good internal consistencies with alphas >0.90 in the general population (Asher & Weeks, 2013; Asher et al., 2010). An alpha of 0.93 was found for the current sample.
Control variables
Age and sex have been shown to be associated with both social relationships (Rose & Rudolph, 2006) and depression (Kessler et al., 2010; Salk et al., 2017). Because we were examining parent interactions, we also wanted to account for those living with parents since they would most likely spend more time with their parents due to proximity. Thus, age, sex (male = 0 and female = 1), and whether or not they were living with family member(s) (No = 0 and Yes = 1) were used as control variables in the models testing the study questions. Living with family member(s) was coded as yes if the participant indicated they lived with any member of their family (e.g. parent, sibling, step-parent, grandparent, spouse, child, or in-law).
Plan of analysis
Preliminary analyses tested differences and associations between the different activities. A repeated measures analysis of variance (ANOVA) with post hoc pairwise comparisons with marginal means using Bonferroni corrections for multiple comparisons tested the differences between the amount of time spent in each activity to understand which activities occurred most/least frequently. Next, percentages of those who reported the amount of time spent in each activity was “about right” and “too little” were calculated, and then independent sample t tests examined whether there was a difference in time spent in that activity between those who said the amount of time was “about right” versus “too little.” This allowed us to understand the association between the amount of time reported and perceptions about the amount of time in the activity.
To address RQ1 (i.e. do ratings about the amount of time spent in an activity moderate the association between the amount of time spent in the activity and depressive symptoms?), the PROCESS 3.4 macro for multiple regression by Hayes (2018) was used to test the interaction between the amount of time spent and ratings of the amount spent for each of the five social activities and the total social activities. For each of the six models, the main effects of the time spent in the activity, the perception of the time spent in the activity, and the interaction between the two were included. A significant interaction effect would indicate moderation was present. As mentioned above, age, sex, and living with a family member were entered as control variables.
Depending on the findings for RQ1, tests of indirect effects were used to test RQ2 (i.e. Are there indirect effects of loneliness on the association between social activities and depressive symptoms). If the RQ1 regression analyses did not find an interaction between the amount of time spent in an activity and perceptions about the amount of time, simple indirect effects were tested using the PROCESS macro. Specifically, perceptions about the amount of time in the activity was the predictor, depressive symptoms was the outcome variable, and loneliness was the mediator. Mediation was indicated by a bias-corrected 95% confidence interval of the test of indirect effect that does not include zero using 10,000 bootstrapped samples (Hayes, 2018).
Please note that the main effect of time spent in the activity was not significant in the initial analyses (see “Results” section) and was not a significant predictor in preliminary mediation models (ps > 0.11). Thus, it was not tested as a predictor in the final set of mediation models.
Next, if an interaction in the preliminary model indicated that the effect of the amount of time in the activity was moderated by perceptions of the amount of time in the activity, moderated mediation was tested using the PROCESS macro with depressive symptoms as the outcome, reported amount of time in the activity as the predictor, perceptions of the amount of time in the activity as the moderator, and loneliness as the mediator. Moderated mediation was indicated when a bias-corrected 95% confidence interval of the index of moderated mediation did not include zero using 10,000 bootstrapped samples (Hayes, 2018). If moderated mediation was indicated, separate simple mediation models (i.e. using the PROCESS macro as described above for testing mediation) were conducted for those who felt the amount of time in the activity was “about right” and those who felt the amount of time in the activity was “too little.” When a significant interaction effect was found for the total number of activities with too little time (a continuous variable), the PROCESS macro tested the mediation models at three different levels of total number of activities with too little time: 1 SD above the mean, the mean, and 1 SD below the mean (Aiken & West, 1991; Hayes, 2018). General assumptions for multiple regression analyses were found to be met for all models (i.e. normality and homoscedasticity of residuals, extreme outliers, and multicollinearity).
We want to be clear that a strict mediation model of social activities leading to loneliness, and, in turn, loneliness leading to depressive symptoms, is not being tested given the cross-sectional design of this study. Rather, the indirect tests are testing whether the three variables (i.e. social activities, loneliness, and depressive symptoms) share a significant amount of variance. Demonstrating these indirect effects is an important first step that can provide evidence for testing mediation models in follow-up longitudinal studies.
Results
Preliminary analyses
As seen in Table 2, there were significant differences in the amount of time spent in each activity, F(4, 1280) = 79.27, p < 0.01. Post hoc analyses found that the most frequent activities were spending time with family and talking on phone/texting with friends. The next most frequent activities, in order of frequency, were emailing/chatting online/video games with friends, spending time with friends, and finally, social events. It can be seen from Table 2 that though some of these activities were occurring more often than others, none was frequent. For example, talking on the phone/texting with friends occurred less than once a week, on average, and the mean value for spending time with friends corresponded somewhere between once a month and several times a month.
Reported amount of time in each activity overall and by feelings about amount of time (N = 315).
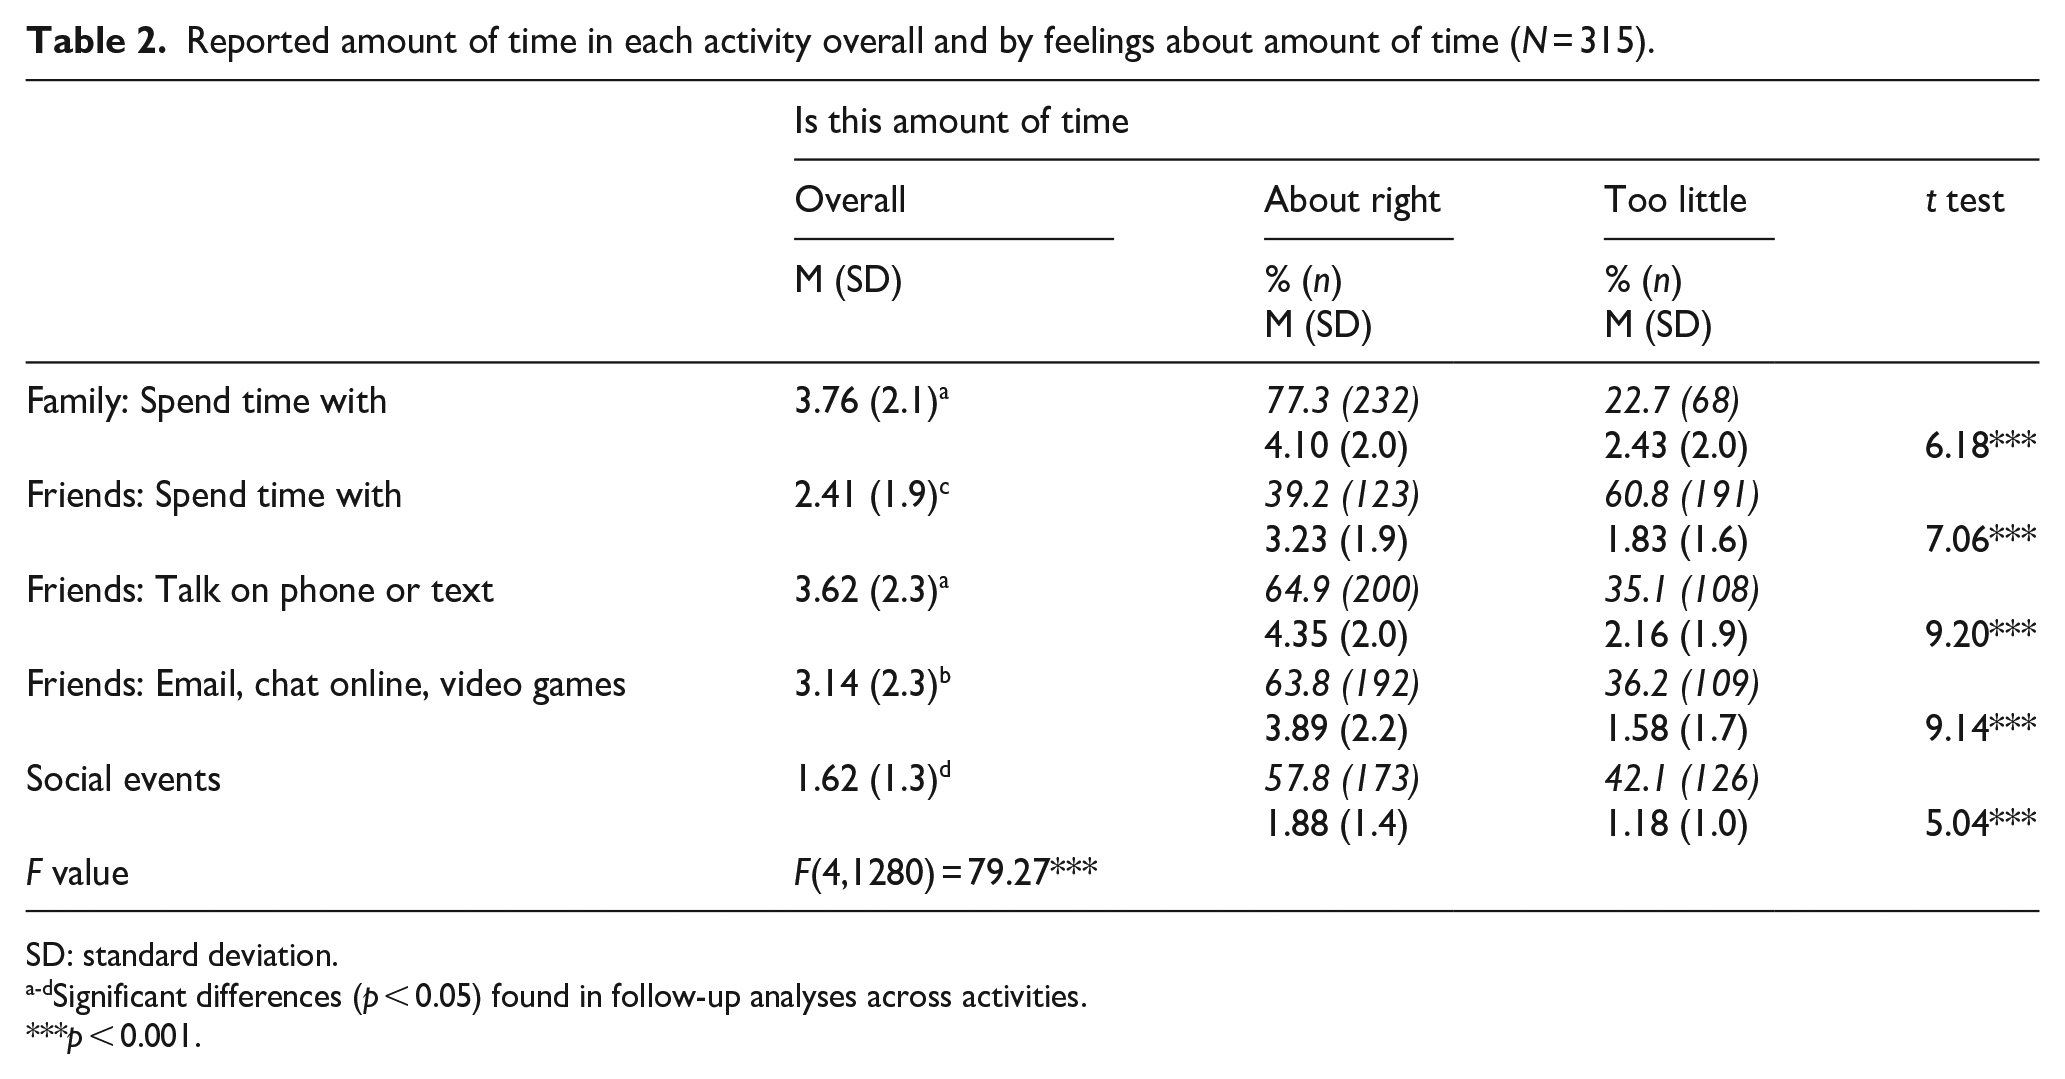
SD: standard deviation.
Significant differences (p < 0.05) found in follow-up analyses across activities.
p < 0.001.
Despite the relatively low rates of social participation overall, many adults were reportedly satisfied with the amount of time they spent in these activities. For each activity except time spent with friends, well over half of the participants reported that the amount of time spent in the activity was “about right” for them (see Table 2). For time spent with friends, around 60% reported that they spent “too little” time with friends. Finally, across all five activities, the amount of time spent in each activity was higher for those reporting that the amount of time was “about right” compared to those reporting that the amount of time was “too little,” indicating that those who felt that they did not spend enough time in an activity were reporting that they actually spent less time in that activity than those who reported that the amount of time in the activity was adequate.
Models testing study questions
The initial sets of models were conducted to test RQ1 (i.e. do perceptions of the amount of time spent in an activity moderate the association between the amount of time spent in the activity and depressive symptoms?) and to know which type of test of indirect effect (a simple indirect effects model or a moderated mediation model) should be used for each type of activity to answer RQ2. Two patterns were found in answering RQ1 and RQ2.
Pattern 1
In terms of RQ1, three activities (time with family; emailing, chatting, playing video games with friends; and talking on phone/texting with friend), perceptions of too little time were associated with higher rates of depressive symptoms compared to those that said the amount of time was about right (time with family: coefficient = 0.31, 95% confidence interval (CI) = 0.08, 0.54; emailing, chatting, playing video games with friends coefficient = 0.32, 95% CI = 0.11, 0.53; and talking on phone/texting with friend coefficient = 0.19, 95% CI = 0.05, 0.32). The amount of time in the activity (ps > 0.17) and the interaction between amount and perception (ps > 0.21) were not associated with depressive symptoms for these three activities.
Since only the main effect of perceptions about the amount time spent in the activity was associated with depressive symptoms for time with family; emailing, chatting, playing video games with friends; and talking on phone/texting with friend, simple indirect effects models were used to test RQ2 within this pattern of findings (i.e. testing the indirect effect of loneliness on the association between perceptions about the amount of time in the activity and depressive symptoms), as seen in Figure 1. For each activity, feeling that too little time was spent in the activity was associated with higher rates of depressive symptoms compared to feeling that the amount of time was about right, and higher rates of loneliness was associated with higher rates of depressive symptoms (see Figure 1). As a direct test of RQ2, the simple indirect models found significant indirect effects of loneliness for all three activities (see the right column in Figure 1).

Indirect effects of loneliness in the association between perceptions of time in activities and depressive symptoms.
Pattern 2
The second pattern in the initial regression models testing RQ1 found significant interaction terms between the amount of time spent and perceptions of the amount spent in that activity. This indicates that perceptions about spending too little time moderated the effects of the amount of time on depressive symptoms for time with friends (R2Δ = 0.01, p < 0.05), social events (R2Δ = 0.03, p < 0.001), and total social activities (R2Δ = 0.02, p < 0.01). Given that the scaling for total social activities was different than time with friends and social events, findings for total social activities will be explained separately (see the following paragraph). In terms of the individual activities (i.e. time with friends and social events), for those who felt they spent too little time with friends in each type of activity, lower amount of time spent in each activity was associated with higher rates of depressive symptoms (see Figure 2; time with friends: coefficient = −0.15, 95% CI = −0.23, −0.06; social events: coefficient = −0.37, 95% CI = −0.54, −0.21). Alternatively, for those who felt that the amount of time spent in the activity was about right, there was no significant association between the amount of time spent in the activity and depressive symptoms (see Figure 2; time with friends: coefficient = −0.03, 95% CI = −0.14, 0.02; social events: coefficient = −0.02, 95% CI = −0.12, 0.08).

Plots of the three significant interactions between perceptions about the amount of time in the activity and the amount of time spent in the activity for depressive symptoms testing Q1.
As explained in the paragraph above, we detail the follow-up analyses for total social activities here. Because the scaling for this variable was continuous rather than categorical, the effects were tested at three different levels total number of responses of too little time spent across all social activities: 1 SD below the mean, the mean, and 1 SD above the mean (see Figure 2). For those at 1 SD below the mean of the number of responses with too little time spent across all social activities, there was no significant association between the amount of time spent in all social activities and depressive symptoms (1 SD below the mean: coefficient = 0.00, 95% CI = −0.02, 0.03). For those at the mean of the number of responses with too little time spent across all social activities and at 1 SD above the mean of the number of responses with too little time spent across all social activities, lower rates of the total amount of time spent in all social activities were associated with higher rates of depressive symptoms (at the mean: coefficient = −0.02, 95% CI = −0.05, −0.01; 1 SD above the mean: coefficient = −0.05, 95% CI = −0.07, −0.02).
Given that moderation was found for these three variables (i.e. time with friends, social events, and total activities), moderated mediation models were used to test RQ2; results are presented in Figure 3. Overall tests of moderated mediation, as seen in the columns to the far right of Figure 3, were significant. This indicated that ratings of too little time spent in activities moderated the association between the amount of time spent in each of the activities and depressive symptoms through the shared variance with ratings of loneliness.
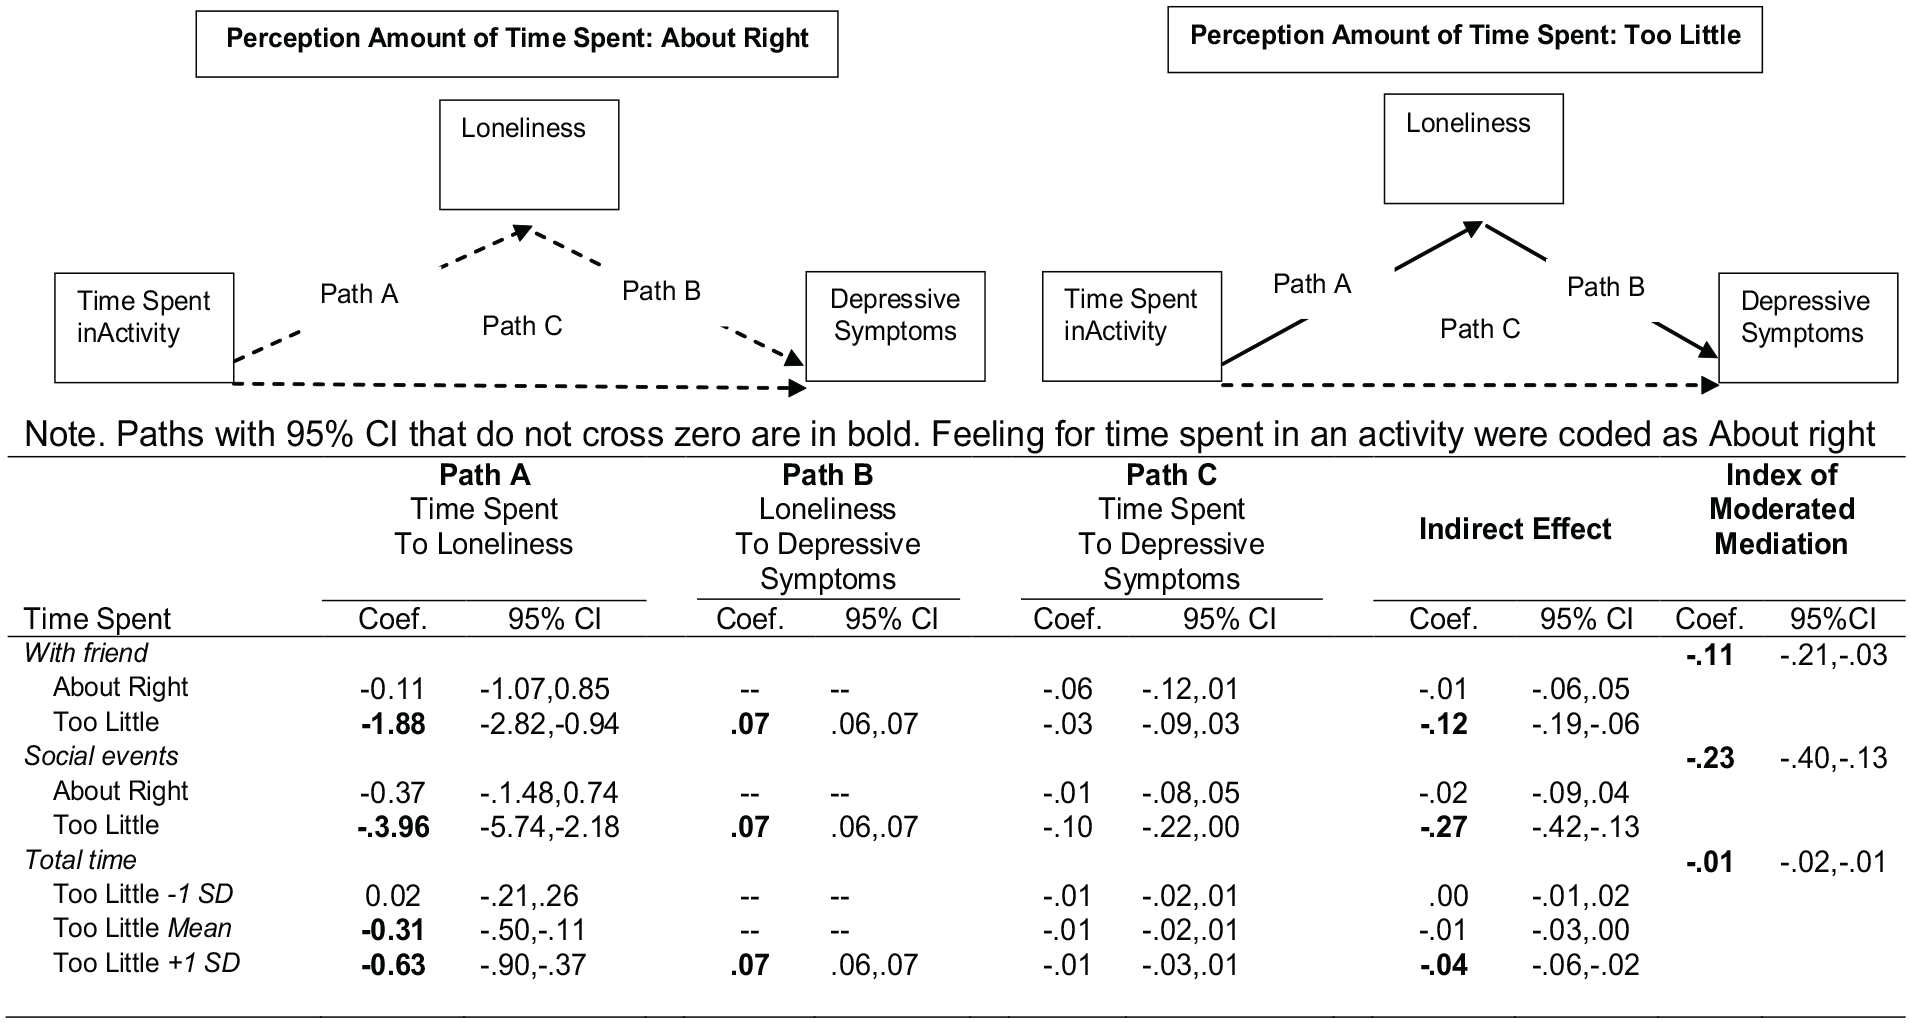
Tests of moderated mediation for the indirect effects of loneliness in the association between time spent in activities and depressive symptoms as moderated by perceptions about the time spent in the activity.
See Figure 3 for the explanation of follow-up analyses for the moderated mediation effects (i.e. the separate mediated effects for different levels of perceptions about the amount of time in the activity). In terms of the individual activities (i.e. time with friends and social events), for those who felt they spent too little time in each type of activity, lower amount of time spent in each activity was associated with higher rates of loneliness, and higher rates of loneliness were associated with higher rates of depressive symptoms. Importantly, for those rating that they spent too little time in the activity, the test of the indirect effect for each model was significant, indicating that the association between the amount of time spent in each type of activity and depressive symptoms had shared variance with feelings of loneliness. Alternatively, for those reporting the amount of time in the activity was about right, there were no associations between the amount of time in the activity, loneliness, and depressive symptoms.
For the follow-up analyses for the total social activities variable, the analyses examined the effects at three different levels of total number of activities with perceptions of too little time spent (see Figure 3). For those at 1 SD above the mean and at the mean for total number of activities with perceptions of too little time spent, loneliness mediated the association between the total time spent in activities and depressive symptoms (see Figure 3). For those at 1 SD below the mean, there was no mediated effect of loneliness for the association between time spent in activities and depressive symptoms (see Figure 3). Specifically, as seen in Figure 3, for those at 1 SD above the mean and at the mean for total number of activities with too little time, lower rates of total reported time spent across the activities were associated with higher rates of loneliness. In turn, higher rates of loneliness were associated with higher rates of depressive symptoms (see Figure 3). For those at 1 SD below the mean for total number of activities with perceptions of too little time spent, there were no significant associations between total time spent in activities and depressive symptoms and loneliness (see Figure 3).
Control variables
In all models, gender, age, and living with family were controlled in each of the pathways. None of the control measures was found to be significant when the outcome was depressive symptoms. For pathways where the outcome was loneliness, those living with family reported lower rates of loneliness than those who did not live with family. In addition, age was associated with loneliness (i.e. older participants reported less loneliness) but only in the time spent with friend and the total time models. Gender was not associated with loneliness in any models.
Supplemental analysis: validity check of the hypothesized effects between social activities and the outcome measures
Next, we tested whether the effects (i.e. mediation or moderated mediation) found for each separate activity were due to total time in social activity and total ratings of spending too little time across all activities rather than the individual activity. In other words, we were trying to understand whether the effects found for individual activities reflected unique findings for each individual activity, or whether they reflected a general, overall amount of activity or perceptions about activities. Thus, the final set of analyses for each activity (i.e. moderated mediated analyses or mediation analyses, depending on the activity) were re-run using the same models described above and adding two variables, total time in social activities and total number of social activities reporting too little time. In each of these models, the patterns in the findings were the same as the original findings and the post hoc analyses for each activity, except for talk on phone/text with friends and emailing, chatting, playing video games with friends. Here, the effects of talking on phone/texting with friends and emailing, chatting, playing video games with friends on depressive symptoms and loneliness were due to general activity levels and general ratings of too little time in activities.
Discussion
The primary goal of this study was to test associations between depressive symptoms and two aspects of social activities—the amount of time spent in a specific social activity and individual perceptions about whether the amount of time in the activity was “just right” or “too little.” With regard to time spent with friends or at social events, the associations between activities and depressive symptoms were explained by the unique combination of both the amount of time in the activity and perceptions about whether that the amount of time met their needs (i.e. Research Question 1). Specifically, those reporting that the amount of time with friends or at social events met their needs had the lowest levels of depressive symptoms. For these individuals, there was no association between the amount of time spent in the activity and depressive symptoms. Thus, it did not matter how much time they spent in the activity (in terms of their depressive symptoms), as long as they felt that the amount of time was adequate. On the other hand, for those who felt that the amount of time spent with friends or in social events was too little, the amount of time spent in the activity was associated with depressive symptoms. In this group that felt they spent too little time with friends or at social events, those with the lowest amount of time in the activity had the highest rates of depressive symptoms, and those with the highest amount of time in the activity had the lowest rates of depressive symptoms. Therefore, the highest rates of depressive symptoms were found in those who spent the lowest amount of time with friends and at social events and also felt that the amount of time in these activities did not meet their needs. Alternatively, within this group who felt that the amount of time spent with friends and at social events did not meet their needs, those who reported spending the highest amount of time in these activities had the fewest depressive symptoms. Thus, engaging with friends or in social events seemed to buffer the negative effects of feeling that they spent too little time in these activities. Overall, this pattern of findings suggests that research on the social lives of individuals on the autism spectrum should pay particular attention to how individuals feel about the time they are spending with friends and in social activities, in addition to considering the amount of time that they are spending in such activities.
A different pattern was found for time spent with family. Here, those who felt that the time spent with family was too little had the highest rates of depressive symptoms, and the reports of the amount of time spent in the activity were not associated with depressive symptoms. This finding fits similar patterns found in research comparing adolescent parent–child relationships and peer relationships using a closed/open relationship model (Collins & Laursen, 1992). Specifically, this model and the supportive findings show that parent–child and sibling relationships, which are considered closed relationships since one cannot technically stop being a daughter/son or a sibling, are more likely to withstand/allow more conflict and need less maintenance than peer relationships, which are considered open relationships since the relationship can be easily dissolved. Thus, the amount of time spent with family members might not relate to depressive symptoms as much as how one feels about the amount of time spent with family. In addition, it should be noted that the effect of feeling that they spent too little time with family had the largest indirect effect on depressive symptoms. This suggests that family relationships play a significant role for individuals on the autism spectrum even into adulthood and are an important line of research to continue to follow especially given that, based on the current findings, individuals on the autism spectrum spend the most amount time with their families compared to other social activities.
Overall, loneliness was found to have an indirect effect on depressive symptoms (i.e. Research Question 2), supporting the interpersonal theories of depression. Our findings suggest that feeling unsatisfied about the amount of time spent in social activities results in feelings of loneliness, which in turn may increase rates of depressive symptoms. While future longitudinal studies are needed to determine the directionality of associations in this pathway, these preliminary findings suggest that interventions may want to consider how their targets for change may impact feelings of loneliness. Specifically, interventions that aim to change social experiences may want to ensure that such changes have a positive impact on feelings of loneliness. Previous studies in individuals on the autism spectrum have found links between loneliness and lack of peer relationships (Mazurek, 2014; Tobin et al., 2014), poor quality friendships (Baczewski & Kasari, 2021; Mazurek, 2014), and less participation in organized activities (Bohnert et al., 2019), suggesting that these may be good targets for intervention.
For most social activities, only around a third of participants reported spending too little time in the activity even though the average time in most activities was fairly low. The exception was for spending time with friends, with over 60% reporting spending too little time in this activity. Given this high rate of not having needs met for spending time with friends, and the association with loneliness and depressive symptoms, future research may want to focus on the barriers to and interventions for having needs meet in terms of time with friends. Also, while the amount of time spent in an activity and perceptions about the amount of time in activity were associated in this study, each of these components of social activities were uniquely associated with depressive symptoms. These findings suggest that distinguishing between the amount of time in social activities, and whether that amount of time meets an individual’s needs, may be important for creating interventions. Thus, an important next step is to understand why individuals feel that the amount of time in interactions is not meeting their needs.
Limitations should be considered when interpreting the current findings. As mentioned previously, concurrent associations between variables reported here will need to be replicated with longitudinal data that can delineate the direction of the effects. This is especially important given that depression has also been shown to predict problematic social relationships (Teo et al., 2013; Vujeva & Furman, 2011). Future longitudinal studies could also help to rule out other confounding variables as threats to the internal validity of the current findings, such as shared method variance. Also, ratings of time in social experiences could have alternative interpretations. For instance, the items could have been interpreted as rating the amount of time with reference to social norms (i.e. the amount of time is about right in respect to what others expect) instead of with reference to how they feel about the amount of time (i.e. the amount of time is about right in terms of what I want or need). In addition, reporting that they did not spend enough time could reflect poor-quality interactions that do not meet their needs or goals. Furthermore, given that the sample consisted of legally independent adults who were able to fill out an Internet survey, the findings may not apply to adults who would be unable to report for themselves or who would have challenges filling out a survey on their own. Cognitive abilities impact independence and likely impact opportunities for social interactions so these findings should not be applied to that group. Future studies should look at social relationships among those with greater cognitive limitations. Finally, the study sample is predominantly white, which limits the generalizability of the findings and the ability to test possible effects of race and ethnicity on the current findings.
Overall, the findings from this study suggest that future studies examining the impact of social experiences on well-being and depressive symptoms in individuals on the autism spectrum should (1) consider both the frequency of a broad range of social experiences and the perceptions about whether such experiences are meeting individual needs, (2) test loneliness as a possible mechanism driving the effects of these social experiences, and (3) identify additional nuances and complexities of this pathway (e.g. gender differences, role of social motivation).
Footnotes
Acknowledgements
We are grateful to all of the families in SPARK, the SPARK clinical sites, and the SPARK staff. The authors would also like to thank Florencia Pezzimenti for her help with reviewing an early version of this manuscript and providing information about the study methods.
Declaration of conflicting interests
The author(s) declared no potential conflicts of interest with respect to the research, authorship, and/or publication of this article.
Funding
The author(s) disclosed receipt of the following financial support for the research, authorship, and/or publication of this article: This research was supported by the FAR Fund.