



Abstract
Aims and objectives:
The aim was to identify which criteria children use to decide on the category membership of native and non-native vowels, and to get insight into the organization of phonological representations in the bilingual mind.
Methodology:
The study consisted of two cross-language mispronunciation detection tasks in which L2 vowels were inserted into L1 words and vice versa. In Experiment 1, 10- to 12-year-old Dutch-speaking children were presented with Dutch words which were either pronounced with the target Dutch vowel or with an English vowel inserted in the Dutch consonantal frame. Experiment 2 was a mirror of the first, with English words which were pronounced “correctly” or which were “mispronounced” with a Dutch vowel.
Data and analysis:
Analyses focused on extent to which child and adult listeners accepted substitutions of Dutch vowels by English ones, and vice versa.
Findings:
The results of Experiment 1 revealed that between the age of ten and twelve children have well-established phonological vowel categories in their native language. However, Experiment 2 showed that in their non-native language, children tended to accept mispronounced items which involve sounds from their native language. At the same time, though, they did not fully rely on their native phonemic inventory because the children accepted most of the correctly pronounced English items.
Originality:
While many studies have examined native and non-native perception by infants and adults, studies on first and second language perception of school-age children are rare. This study adds to the body of literature aimed at expanding our knowledge in this area.
Implications:
The study has implications for models of the organization of the bilingual mind: while proficient adult non-native listeners generally have clearly separated sets of phonological representations for their two languages, for non-proficient child learners the L1 phonology still exerts a strong influence on the L2 phonology.
Keywords
Introduction
The extent to which bilingual speakers’ or second language learners’ languages are integrated or form separate entities is the topic of a longstanding debate. The issue revolves around the question of how the languages’ lexicons are organized, and how (morpho)syntactic and phonological representations are organized in relation to the lexicon(s). Models that address lexical access and sentence processing in bilinguals often share the assumption of one mental lexicon in bilingual speakers, but differ in the degree of assumed integration between the languages of bilinguals (De Bot, 1992; Hartsuiker, Pickering, and Veltkamp, 2004; see Hartsuiker and Pickering, 2008, for review). The present study focuses specifically on the organization of phonological representations in the mental lexicon of child second language learners. On the basis of behavioral data, we aim to investigate to what extent child and adult listeners of a second language create two separate sets of phonological categories for their first and second language.
It has been a longstanding question whether bilinguals (used here in the general sense of speakers of more than one language) can develop two phonemic representations for a single acoustic–phonetic speech sound continuum. This has been referred to as the question of whether bilinguals have a “double phonemic representation” (e.g. Elman, Diehl, & Buchwald, 1977; Flege & Eefting, 1987; García-Sierra, Diehl, & Champlin, 2009; García-Sierra, Ramírez-Esparza, Silva-Pereyra, Siard, & Champlin, 2012). Previous reports on this issue, often focusing on variation of a single cue such as voice onset time (VOT), have produced rather mixed results. In such experiments participants were typically asked to categorize stimuli from across a phoneme boundary which differed between languages (e.g. VOT across Spanish and English). Participants were then presented with these stimuli in different language settings. Some authors reported shifts in phoneme boundaries (Elman et al., 1977; Flege & Eefting, 1987), suggesting that listeners can indeed treat their phonological inventories as separate. Others, however, have failed to find such shifts (Caramazza, Yeni-Komshian, Zurif, & Carbone, 1973; Williams, 1977).
It has been argued that differences between experimental outcomes may often have resulted from differences in the extent to which the experimental procedures (providing language contexts) managed to let listeners focus on a particular language set (García-Sierra et al., 2009). Moreover, additional influences from range and phonetic context effects have also been found to play a potential role (Bohn & Flege, 1993). Such effects of stimulus range may be closely related to “acoustic context effects”. That is, preceding acoustic stimuli (speech or non-speech sounds) have been shown to influence the perception of subsequent speech sounds, and it has been argued that these influences have a general auditory nature (Holt & Lotto, 2002; see also Benders, Escudero, & Sjerps, 2012; Brady & Darwin, 1978; Holt, 2005; Holt, Lotto, & Kluender, 2000, for discussion). Despite the various factors that may influence the location of categorization boundaries, however, the conclusion seems to be that bilingual listeners can, at least to some extent, apply different phoneme category boundaries with different language sets (Elman et al., 1977; Flege & Eefting, 1987).
In addition, however, many studies have shown that the phonological systems of two different languages do perceptually interact. For example, Sebastián-Gallés, Echeverría, and Bosch (2005) asked Catalan–Spanish and Spanish–Catalan bilinguals to conduct a lexical decision task with Catalan words and non-words, in which the Catalan vowel /ԑ/ was replaced by the Catalan vowel /e/, or vice versa. They found that Spanish–Catalan bilinguals did not perform at the same level as Catalan–Spanish bilinguals, indicating that the phonological representations of the Spanish-dominant were not identical to those of the Catalan-dominant bilinguals. Similar experiments involving Spanish-learning, Catalan-learning and bilingual children are reported in Ramon-Casas, Swingley, Sebastián-Gallés, and Bosch (2009) and support the observation that even simultaneous bilinguals do not treat the two languages in the same way as monolingual native speakers do.
Summarizing, then, it seems that bilingual listeners do not fully rely on a single phoneme set for separate languages, while at the same time the phonemic inventories of different languages are not completely independent either. In the current paper we focus on the developmental aspects of this phenomenon in the context of second language learning: to what extent do young second language learners apply different criteria when judging the pronunciation of words in their first (Dutch) versus their second language (English)?
To answer this question we tested a group of 10–12-year-old monolingual Dutch children who have had informal exposure to English (through media), but who have had no or only minimal content-based English instruction in school. While native and non-native perception by infants has been examined in a large number of recent studies (Bosch & Ramon-Casas, 2011; Kuhl et al., 2006; Polka, Rvachew, & Molnar, 2008), studies on first and second language perception of school-age children are rare (exceptions are Flege & Eeftink, 1986; Hazan & Barrett, 2000; Johnson, 2000; Parnell & Amerman, 1978; Simon, Sjerps, & Fikkert, 2014; Walley & Flege, 1999; see Simon et al., 2014, for a discussion). The current study adds to the growing body of literature aimed at expanding our knowledge about this relatively understudied area.
The study consisted of two cross-language mispronunciation detection tasks, in which L2 vowels were inserted into L1 words (Experiment 1), and vice versa (Experiment 2). This approach allowed for testing the specificity of phonological representations in English and Dutch while fully immersing the listeners in a particular language setting (listening to Dutch words: Experiment 1; listening to English words: Experiment 2). This type of task is likely to be easier for young participants when compared to phoneme categorization tasks, because the latter demand some meta-awareness of phoneme categories, as participants then have to match the auditory stimuli to abstract phonological categories. Furthermore, the mispronunciation detection task prevents the influence of range effects that have been found to affect previous investigations in cross-language phoneme boundaries (García-Sierra et al., 2009).
In the present investigation, we tested the same 10- to 12-year-old Dutch-speaking children tested in Simon et al. (2014). The children had not had any English classes, but had a basic English vocabulary through contact with English media (see Participants section below). Simon et al. (2014) examined the phonological representations of vowels in children’s L1 and L2 lexicon by means of two mispronunciation tasks involving L1 and L2 words in which the vowels were replaced by other vowels from the same language (i.e. Dutch words in which, sometimes, a vowel was replaced by another Dutch vowel, and in another experiment, English words in which a vowel was replaced by another English vowel). The results of the first language mispronunciation task revealed that the 10- to 12-year-old children had well-developed and determinate phonological representations of L1 vowels. However, in the L2 mispronunciation task, children accepted significantly more English words in which the vowel was replaced by another vowel from English, suggesting that the phonological representations of L2 vowels were still under development. Especially for vowel contrasts which did not occur in the listeners’ L1, such as the English /ԑ–æ/ contrast, which does not exist in Dutch (Dutch only has /ԑ/), listeners had underspecified representations. In the current study, we implemented cross-language changes to more directly investigate the role of the Dutch phonological system in the formation of English representations and vice versa.
In the first word–picture verification experiment, children were presented with Dutch words which were either pronounced with the target Dutch vowel (“correct pronunciations”) or with an acoustically similar English vowel inserted in the Dutch consonantal frame (“mispronunciations”). The second experiment was a mirror of the first, this time with English words which were pronounced correctly or which were mispronounced with a Dutch vowel. It will be examined to what extent child and adult listeners accepted substitutions of Dutch vowels by English ones, and vice versa, and which vowel substitutions were accepted or rejected. Because it is unclear just how underspecified the English lexicon may be with respect to the use of Dutch vowels, some replacements involved vowels which were relatively close in acoustic–phonetic space whereas others were relatively far.
The first experiment served as a control to test whether the children could perform similarly to the adults in the specific task settings. Moreover, it can show whether children have generally less well-developed phoneme categories than adults, and whether children are equally liberal/conservative to adults when performing the mispronunciation task in their first language. For this experiment we predicted that school-age children have well-developed L1 phonological representations. They should be able to indicate correctly pronounced Dutch words as correct and they should also identify Dutch words in which the vowel was replaced by an incorrect, English vowel (as in the Dutch word boom (“tree”) realized with the English /ɔ/, as [bɔm]). However, since some English phonological categories are very close to the Dutch categories we did not predict that listeners would pick up on all “mispronunciations.” The children’s performance was compared to that of the adults, who can be expected to have well-developed L1 categories but are also aware of the English phonology, and would as such be able to pick up on subtle mispronunciations of the Dutch words. We predicted that the children would make more errors than the adults, because in the age range 10–12 children’s native phonological system is still undergoing subtle changes (see e.g. Simon et al., 2014, for discussion).
In Experiment 2, the mispronunciation items were created by inserting Dutch vowels into English consonantal frames (as in the English word ball realized with the Dutch /o/ vowel, as [bol]). The experiment was set up to differentiate between two general hypotheses, both indicating relative differences between child and adult second language learners. The first is that these child L2 learners will overwhelmingly rely on their first language phonological system when interpreting words in the second language they are learning. If so, they should be inclined to reject correctly pronounced English words if those contain phonological items that are not present in the children’s first language phonology, as these instances should be recognized as deviant pronunciations forms. A second hypothesis, however, states that child L2 learners are in general more liberal when listening to their L2 than adults. This hypothesis would predict that children overwhelmingly and more frequently than adults accept instances of L2 English words. This difference between children and adults would hold both for English words pronounced with the correct phonemes and for those produced with incorrect phonemes. Critically, only in the second hypothesis should children also generally accept correct pronunciations, and even more so than the adults, to the extent that those do not perform at ceiling.
For each of the experiments a general analysis of the acceptance patterns will be supplemented with a more in-depth comparison of acceptances of specific vowel pairs and the reliance of listeners on the first and second formants and speech sound duration.
Experiment 1. Dutch with English vowel substitutions
Participants
Twenty-five Dutch-speaking children completed the experiment. The children’s ages ranged between 10 and 12, with just one child who had reached the age of 12 at the time of testing. (The data of one participant was discarded because the participant did not complete both experiments.) They were recruited in three schools in Flanders. The school heads and teachers reported that none of the children had any hearing deficits or learning or concentration difficulties. The children had had no or minimal (content-based) instruction in English in school. None of the children could conduct a basic conversation in English. All children were interviewed in Dutch on their contact with English. Only seven of the 25 children had ever been to an English-speaking country (with stays between two days and four weeks) and only four reported ever having been in contact with English-speaking (distant) family or family friends. The remaining 21 children had never had contact with English-speaking people.
However, all children reported that they sometimes watch English-spoken television programs (mostly with subtitles) and 19 of the 24 reported playing computer games in English. As English is pervasive in the media in Flanders, all children had a basic English vocabulary (as was apparent from their performance on an English vocabulary test, see further below). Which varieties of English the children were mostly exposed to is hard to determine. While American English is certainly prominent in pop culture and many children, when interviewed (in Dutch) on their English input, reported to watch television channels with predominantly American English programs, some children also reported watching popular British English films or listening to British singers. Because of individual preferences, it is likely that the children were exposed to British and American (or other) varieties of English to different extents.
A control group of 16 18–20-year-old adult native speakers of Dutch also performed the experiment. The adult participants were 2nd or 3rd year university students of English and thus had a high proficiency in English. When entering university, students are expected to have at least level B2 (“upper intermediate”) for English in the Common European Framework of Reference for Languages (scores range from A1, lowest proficiency, to C2, highest proficiency; Council of Europe, 2016). Although the adult participants are thus highly proficient in English, only one of the 16 students had spent a longer time (six months) in an English-speaking country; the remaining 15 students reported not having been in an English-speaking country or to have spent only between one and three weeks there. All participants had started learning English in school at the age of 12 or 13. In Flemish schools and universities British English is generally used as a model, and the participants were hence presumably most familiar with this variety of English, although they were also exposed to American English (and other varieties of English) through the media.
Materials
Auditory stimuli
The stimuli were based on 16 monosyllabic Dutch words in which the vowel was synthetically replaced either by an English vowel or by another realization of the target Dutch vowel. The Dutch words and English non-words on which the synthetic stimuli were based were produced by a female, bilingual Dutch–English speaker, living in Flanders and dominant in Dutch, but with a very high proficiency in English and speaking and teaching English on a daily basis. The recordings were made with a Marantz Professional solid state recorder (PMD620), with a Sony condenser microphone (ECM-MS907) placed on a stand. All stimuli were read and recorded four times, but only the second repetition was used for the experiment, except for a few tokens for which the third repetition led to better cross-splicing results.
For each Dutch word four tokens were recorded: (1) the Dutch word itself (e.g. Dutch dak [dɑk] “roof”); (2) the same consonantal frame but with an English vowel (e.g. deck [dԑk]); (3) the same consonantal frame with another English vowel (e.g. dack [dæk]) and (4) a repetition of the target Dutch word. These four tokens were produced in a sequence, in order to ensure maximal similarity in pitch pattern and amplitude between the tokens. In order to facilitate code-switching for the speaker, Dutch and English tokens were presented in a different color code to the speaker and were produced in carrier phrases (for Dutch: “Zeg_opnieuw;” for English: “Say_again”), with the target word clearly separated from the context, so that there was no coarticulation between the target word and the neighboring words. On the basis of these recordings, three synthetic stimuli were produced with the consonantal frame of the first repetition of the Dutch word (e.g. [d_k]), in which two English vowels (e.g. /ԑ/ and /æ/) and the Dutch vowel from the second repetition (e.g. /ɑ/) were inserted. Table 1 presents formant 1 (F1), formant 2 (F2) (in Hertz) and duration (in milliseconds) of each Dutch vowel in the stimuli (words and non-words) produced by the bilingual Dutch–English speaker (row a), and of each of the two substituting English vowels produced by the same speaker (rows c and d). In order to enable a comparison of the vowels in the stimuli to the vowels as they are typically produced in the Dutch speech of the bilingual speaker, the vowels were also measured in four repetitions of the (existing) Dutch words produced by the speaker. These values are presented in row b. Standard deviations are provided between brackets. (Number of instances provided in column N.)
Target Dutch (Du) vowels and English (Eng) substituting vowels.

Standard deviations in brackets.
In two tokens in which the vowel was followed by a sonorant (stoel “chair” and tent “tent”), the vowel was spliced together with the sonorant. Both the aspiration into the vowel in the English tokens and the original vowel duration were retained, in order to keep the vowel sound maximally natural and close to how it is normally produced in English.
The stimuli were organized into three lists in which different words occurred with their target Dutch vowel and the English vowel substitutions. The three lists were presented with optional breaks between them and the items were randomized within each list. The lists can be found in Appendix A. Table 2 presents an example of the stimuli.
Examples of stimuli in the Dutch experiment.

Stimuli in bold contain the Dutch target vowel.
Visual stimuli
All pictures were black-and-white line drawings and were retrieved from the picture database of the Experimental Psychology Department at Ghent University.
Procedure
Listeners were individually tested in a quiet room in their school, with no other person present besides the experimenter. They were seated in front of a computer screen and were presented with a picture of an object followed after 1500 ms by an audio stimulus. They were instructed to judge whether the word they heard was pronounced “correctly” or “incorrectly” and were asked to provide their response by pressing a blue button marked juist (“right”), or a red button marked fout (“wrong”) on an RB-730 response pad. All instructions were provided orally in Dutch prior to the experiment and also appeared in written form on the screen at the beginning of the experiment. If children signaled they had understood the task after the instructions, they could start with the experiment. The first three items were practice trials which were played over the speakers of the computer. Listeners were asked to focus on the vowel in each word, ignoring the consonants, and to respond as quickly and accurately as possible. Stimuli were presented binaurally over Bose headphones at a comfortable listening level.
Design
The experiment was supported by SuperLab 4.0. It started with written instructions, followed by three practice trials. After the practice trials, three experimental blocks were presented, with optional breaks between them. These three blocks corresponded to the three lists described under “Stimuli.” Trials were automatically randomized for each listener within each block. Each block consisted of 16 trials (4*vowel /ԑ, ɑ, o, u/). Within each block, eight items were presented with the correct vowel (each vowel twice) and eight with an incorrect vowel. Since the number of expected “correct” and “incorrect” responses was the same, no filler items were inserted.
Results
For the analyses we will report the proportion of “yes” responses. That is, the proportion of trials where participants indicated that the words were pronounced correctly. (Note that the actual response options were “right” and “wrong;” see Procedure. For clarity’s sake, we refer to the “right” responses as “yes” responses.) Figure 1 presents the proportion of “yes” responses to Dutch words that either contained the correct Dutch vowels (two leftmost bars: correct pronunciations or CPs) or English vowels (two rightmost bars: mispronunciations or MPs). As shown in Table 1 and Figure 2, some Dutch and English vowels are acoustically very similar, and hence it is debatable whether a Dutch word containing an acoustically similar English vowel should be called a “mispronunciation.” However, we use the terms CP and MP here to make a clear distinction between the two types of stimuli: those containing a vowel originally produced in a Dutch word (CP), and those containing a vowel originally produced in an English word (MP). In line with this, accepted CPs are called “correct responses,” while accepted MPs are referred to as “incorrect responses.” Data were obtained from the group of school-age children (black bars, N = 25) or the adult students (gray bars, N = 16). The top panel displays proportions of “yes” responses; the bottom panel displays reaction times.

Dutch task: proportion of “yes” responses (top panel) and reaction times (RTs, bottom panel) (measured from sound onset) with indication of the standard error of the mean.
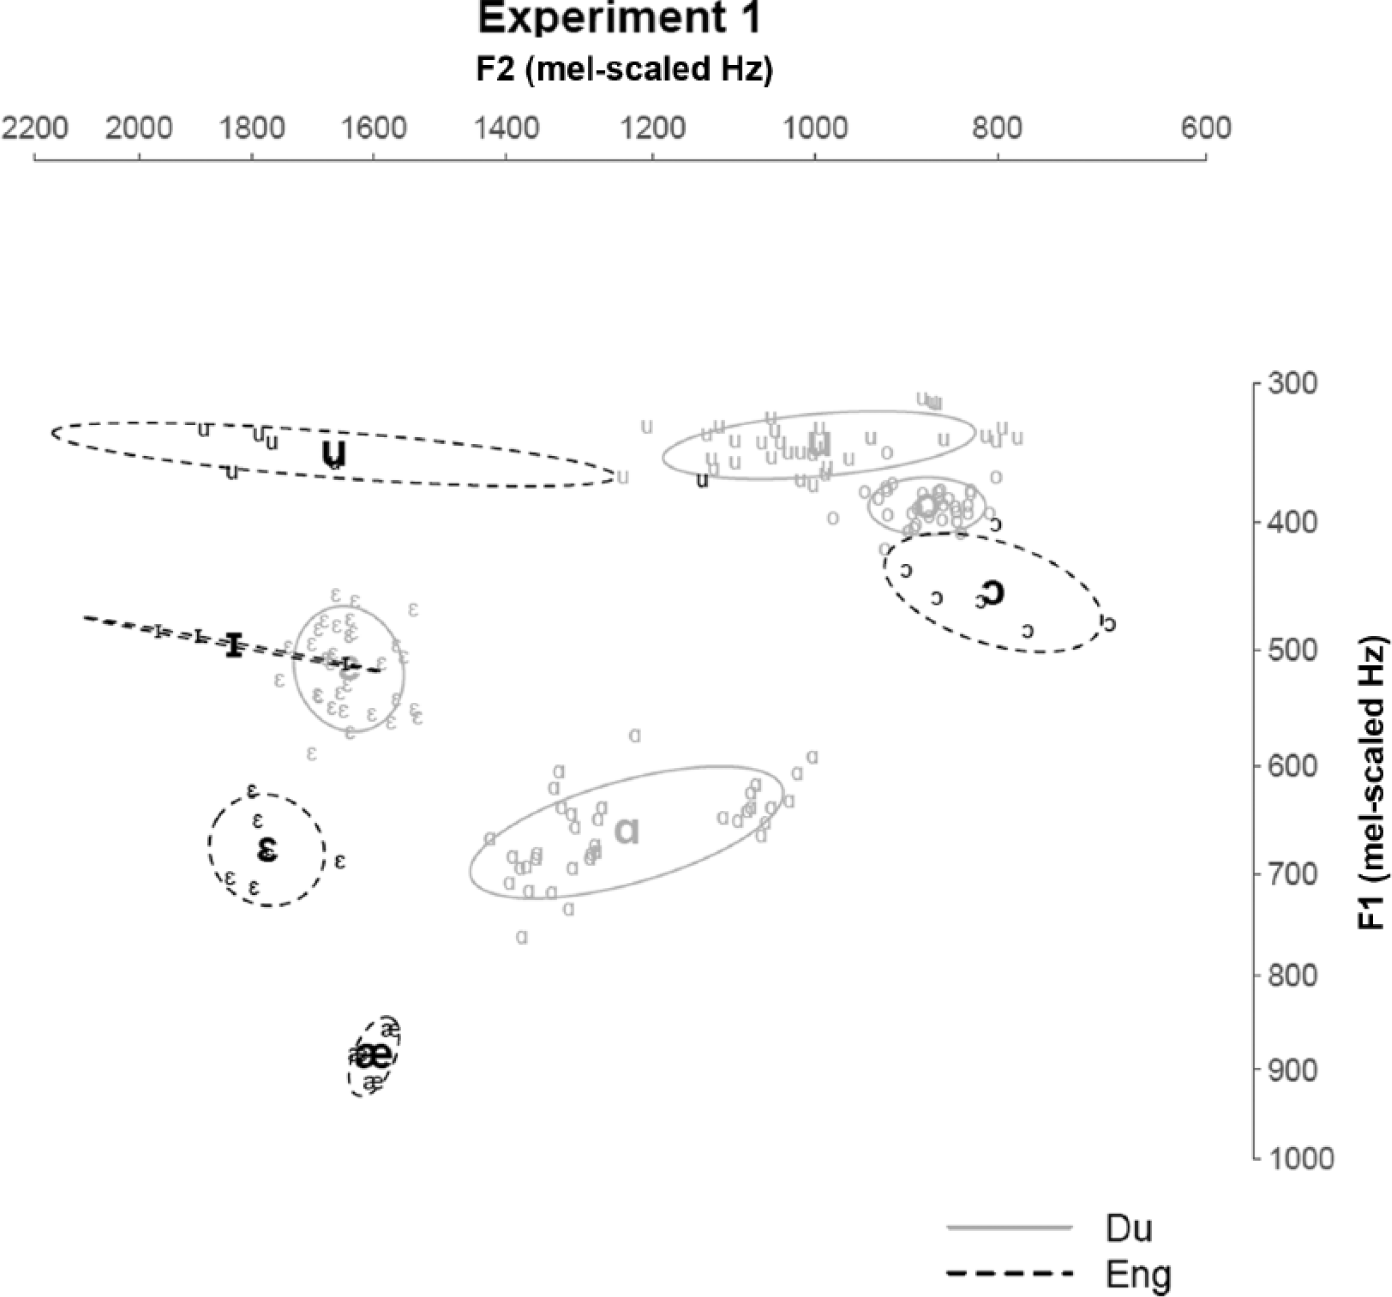
Vowel plot showing formant 1 (F1) and formant 2 (F2) values of the target Dutch (solid ellipses, in gray) and substituting English (dashed ellipses, in black) vowels in the stimuli. Ellipses represent 1 SD away from the mean. Axes are mel-scaled.
Repeated measures ANOVAs were performed on logit transformed data. It can be observed that, overall, children and adults gave similar proportions of “yes” responses: F (1,39) = 0.42, p = .523, ηp2 = 0.011. “Yes” responses to CPs (i.e. Dutch words containing Dutch vowels) were significantly more frequent than “yes” responses to mispronunciations (MPs, i.e. Dutch words containing English vowels): F (1,39) = 1191.38, p < 0.001, ηp2 = 0.968. The high proportions of “yes” responses to the CP stimuli indicate that the manipulated stimuli, in which the vowels in Dutch words were replaced by other realizations of the same Dutch vowels, sounded natural to the listeners, and did not lead to false rejections. No interaction was observed between stimulus language and age group: F (1,39) = 0.47, p = 0.495, ηp2 = 0.012.
The bottom panel of Figure 1 displays reaction times (RTs). Analyses were performed on logit transformed data. Moreover, for each participant, those RTs that lay two standard deviations (SD) above or below their (log transformed) means were replaced with the respective values of two SD away from their mean, to avoid missing data. The panel displays averaged RT data that were back transformed from those LogRT data. All responses are included (correct and “incorrect” responses). It can be observed that, overall, the children responded more slowly than the adults: F (1,39) = 15.54, p < 0.001, ηp2 = 0.285. Furthermore, participants responded more slowly to words containing English vowels than to those containing Dutch vowels: F (1,39) = 50.42, p < 0.001, ηp2 = 0.564. No interaction was found between stimulus language and age group: F (1,39) < 0.001, p = 0.973, ηp2 < 0.001.
Table 3 reports the percentages of correct (“yes”) responses to words with Dutch vowels (CPs) per vowel.
“Yes” responses to Dutch correct pronunciations by children and adults.

As can be observed in Table 3, scores were well above 90% correct for all vowels. Small differences existed between the proportion of correct scores between the vowel pairs, though: F (3,117) = 3.86, p = 0.011, ηp2 = 0.09. Overall, adults and children had similar scores: F (1,39) = 0.09, p = 0.761, ηp2= 0.002. A just-significant interaction was found between vowel and age group: F (3,117) = 2.84, p = 0.041, ηp2 = 0.068. Given the ceiling performance for most participants on all vowels (16 out of 25 children and 10 out of 16 adults scored 100% correct on all four vowels) we did not perform any post-hoc comparisons among the vowel pairs. Both children and adults received perfect or near-perfect scores on both /ɑ/ and /o/, and only a few CPs involving /ԑ/ and /u/ were incorrectly rejected by the children and adults.
Table 4 displays the proportion of “yes” responses (incorrectly accepting MPs) for each of the English substituting vowels. Substantial differences were observed between the proportions of correct responses for the different vowel target-replacement pairs: F (7,273) = 190.47, p < 0.001, ηp2 = 0.83. No significant difference was observed between the age groups: F (1,39) = 2.26, p = 0.141, ηp2 = 0.055. No interaction between age groups and vowel pair was observed: F (7,273) = 0.74, p = 0.64, ηp2 = 0.019.
“Yes” responses to Dutch mispronunciations by children and adults.

Discussion
The results of the Dutch task, in which words were either pronounced with their correct Dutch vowels or in which the vowels were replaced by English ones, revealed that children and adults behaved very similarly. They both accepted nearly all correct pronunciations of Dutch words, indicating that the manipulated stimuli sounded natural. Furthermore, they performed quite similarly on the “mispronounced” items as well, accepting on average only 38% (children) and 34% (adults) of the Dutch words in which the vowel was replaced by an English one. These results also confirm that the children did not show a general “yes” bias in this task, since they did not differ from the adults in their rejection rates.
With respect to the investigation of specific vowel pairs, it can be observed from Table 4 that substitutions of Dutch /ԑ/ by English /ԑ/ or /ɪ/ were frequently accepted by native Dutch listeners. This effect was strongest for words containing substitutions by English /ԑ/, which were judged to be correct in 95% and 94% of the tokens by the children and adults, respectively. The very high acceptance rate of substitutions of Dutch /ԑ/ by English /ԑ/ by both children and adults suggests that the phonological representation for the vowel /ԑ/ may be shared in Dutch and English. Furthermore, substitutions of Dutch /ԑ/ by English /ɪ/ were accepted less often, namely in 76% of the tokens by the children and in 63% by the adults. The lower acceptance rate may be the result of the learners’ sensitivity to the /ԑ/–/ɪ/ contrast from their native language.
With respect to Dutch /ɑ/ and the English substituting vowels /æ/ and /ԑ/, one could predict that words containing these substitutions would generally be rejected by the listeners, since the three vowels seem to occupy clearly separated spaces in the vowel diagram. Figure 2 presents a vowel plot representing F1 and F2 values of the Dutch and English vowels in the stimuli. (The values are those reported in Table 1.) Axes are mel-scaled so that distances between items in the graph are similar to perceptual distances in the auditory system.
The proportions of “yes” responses were indeed very low for substitutions of /ɑ/ by /æ/ and /ԑ/ by the children (3% and 4%, respectively), and even reached ceiling for the adults, who accepted words with these types of substitutions in 0% of the cases.
For substitutions of Dutch /o/ by English /ɔ/ it was observed that children and adults behaved very similarly, in that they accepted the majority of Dutch words in which /o/ was replaced by English [ɔ], i.e. in 95% of the tokens by the children and in 96% of the tokens by the adults. By contrast, they rejected nearly all or all of the replacements by [u] (1% accepted by the children and 0% by the adults). A Dutch word like boom (“tree”) pronounced as [bɔm] was thus accepted in the majority of tokens, while its realization as [bum] was nearly always rejected. This low rejection rate of MPs involving substitutions of /o/ by /ɔ/ by both adults and children suggests that the realizations of the English vowel /ɔ/ are acoustically close enough to be considered as phonetic realizations of the Dutch vowel /o/.
Finally, for substitutions of Dutch /u/ it was found that the English vowel [ɔ] turned out not to be an acceptable substitution: when a word like hoed (“hat”) was realized as [hɔt], it was accepted in only a few cases by both children and adults. Furthermore, words in which Dutch /u/ was replaced by English [u] were accepted in only 23% and 21% of the cases by children and adults, respectively.
Based on these data, it seems that the child and adult listeners made use of spectral and durational cues to make their phoneme judgments. We further investigated to what extent listeners based their judgments on F1, F2 and duration. Figure 3 displays the use of these three cues to phoneme identity. For this plot, formant values were transformed to a mel-scale. For each Dutch target category the mean and standard deviation (SD) were calculated (see also Figure 2), and for each stimulus sound the distance in SDs from the target mean was calculated for each of the three cues. For F2 and duration, the further away the stimulus is from the target, the less likely participants are to say “yes.” This indicates that the listeners made use of these two cues in determining category membership. For example, when the sound /u/ replaced /o/ (red symbols) listeners probably did not use the cues F1 and duration (in the left and rightmost panel these symbols are placed to the left, i.e. at a small distance from the target mean, making them rather uninformative). However, for F2, the symbols are placed far to the right, that is, in terms of F2 the stimulus /u/ differed from the target sound very strongly. Indeed, both children and adults hardly ever accepted English /u/ as an instance of Dutch /o/.

Cue use in Experiment 1: Dutch target words containing English vowels.
Other distinctive cases can be observed for the use of duration. This effect seems less strong for F1. This is probably a result of the fact that none of the stimulus sounds differed in terms of their target F1 to a large extent. Linear mixed effects regression was used to test these effects. A model was fitted to the proportion of “yes” responses, including the main effects of the factors age (children vs. adults coded as −0.5 vs. 0.5, respectively), and z-transformed versions of duration distance, F1 distance and F2 distance (the distance of a stimulus to the target, expressed as distance in target SD away from the target mean). Separate terms for the interaction between age and each of the individual cues were also included. The model included random intercepts for participants (including random slopes for subjects on the three cues led to failure to converge). An effect was observed for the intercept (b = −2.68, z = 11.80, p < 0.001), indicating that, overall, mispronunciations were categorized as correct less than half of the time. No main effect was observed for the factor of age, indicating that the children and the adults performed the same. Main effects were observed for duration (b = −6.46, z = −9.71, p < 0.001); F1 (b = −0.82, z = −7.53, p < 0.001) and F2 (b = −3.66, z = −10.64, p < 0.001). For each of the cues, the negative b-value shows that listeners use that cue to categorize the phonemes (a negative slope indicates that the bigger the distance between a stimulus and the target, the less likely a participant is to say “yes”). No interactions were observed between age and each of the cues.
To summarize, these data suggest that all listeners applied a fairly strict criterion for accepting vowels in an L1 mispronunciation detection task. In Experiment 2 it was investigated whether this pattern was mirrored in an L2 mispronunciation task, by presenting participants with English words containing English or Dutch vowels.
Experiment 2. English with Dutch vowel substitutions
Participants
In total, 25 children and 16 adults participated in this experiment. All of the participants in this experiment also conducted Experiment 1.
Materials
Auditory stimuli
The stimuli were based on 16 monosyllabic English words, which were at least passively known by the children since they were selected on the basis of the results of a receptive vocabulary test in which children had to match auditory stimuli to the corresponding pictures (see Simon et al., 2014, for a detailed description). In these words the vowel was synthetically replaced either by a Dutch vowel, or by another token of the target English vowel. The English words and Dutch non-words on which the synthetic stimuli were based were produced by the same female, bilingual Dutch–English speaker who produced the tokens for Experiment 1. As in Experiment 1, four tokens were recorded for each English word: (1) the English word itself (e.g. English ball [bɔ:l]); (2) the same consonantal frame but with a Dutch vowel (e.g. bool [bo:l]); (3) the same consonantal frame with another Dutch vowel (e.g. boel [bul]) and (4) a repetition of the target English word. The organization of the stimuli and the recording procedure were the same as in Experiment 1. The four English target vowels in the present experiment ([ԑ], [æ], [ɔ], [u]) were used as substituting vowels in Experiment 1, and four of the Dutch substituting vowels ([ԑ], [ɑ], [o], [u]) were used as target vowels in Experiment 1. The remaining four Dutch substituting vowels ([ɪ], [ԑ], [u], [y]) in Experiment 2 are vowels which are acoustically close to the English target vowels. Table 5 presents the English vowels and, for each vowel in the stimuli (English words and non-words) (row a), the two Dutch substituting vowels with their F1, F2 and duration values (rows c and d). Again, in order to compare the target English vowels in the stimuli to the way these vowels are typically produced by the bilingual speaker, the vowel measurements in eight repetitions of the English existing words produced by the speaker are presented in row b. Standard deviations, based on multiple instances of the same vowel (number of instances provided in column N), are provided between brackets.
Target English vowels and their Dutch substitutions.

Standard deviations between brackets.
As the stimuli were produced by a bilingual Dutch–(British) English speaker, dominant in Dutch, one may wonder to what extent the formant and durational values in the English vowels produced by this speaker are in line with values for native British English reported in the literature. Table 6 presents F1 and F2 values of the target English vowels in the stimuli in Experiment 2, in comparison with formant values reported in Deterding (1997) for five female speakers of southern British English, and Hawkins and Midgely (2005) for five male speakers of RP in the age group 50–55, which was the group closest in age to that of the bilingual speaker, who was 46 at the time of the recordings. (No female data are reported in this study.)
Formant 1 (F1) and formant 2 (F2) values of the target English vowels in Experiment 2, compared with data reported in Deterding (1997) and Hawkins and Midgely (2005).

In brackets: the number of realizations of each vowel; in italics: the standard deviations.
Table 6 shows that the formant values of the vowels produced by the Dutch-English speaker are generally similar to those reported in Deterding (1997) and Hawkins and Midgely (2005).
As in Experiment 1, the stimuli were organized into three lists in which different words occurred with their target English vowel and the Dutch vowel substitutions. The three lists were presented to the participants with optional breaks between lists, and the items were automatically randomized within each list. The stimuli lists can be found in Appendix B. Table 7 presents an example of the stimuli. Tokens which contain the English target vowel are in bold.
Examples of stimuli in the English experiment.

Stimuli in bold contain the Dutch target vowel.
Visual stimuli
All pictures were black-and-white line drawings and were retrieved from the picture database of the Experimental Psychology Department at Ghent University.
Procedure
The procedure was the same as in Experiment 1. The child participants conducted Experiment 2 about 3–4 weeks after Experiment 1. The adult controls conducted the two experiments one after another, in the same session in which they completed two other tasks which are not discussed in this paper (see Simon et al., 2014). All participants conducted the Dutch experiment before the English one. Before the Dutch experiment started, they were told they were later going to do a similar experiment in English. There was an obligatory break between the experiments, and the experimenter completed an English questionnaire asking for background information together with the participant after this break, so as to get the participant into an English language mode before the start of Experiment 2. The data were collected by three experimenters, who were all native speakers of Dutch with a high proficiency in English, teaching or studying English at university. All child data were collected by the same experimenter.
Design
The experiment was supported by SuperLab 4.0. It started with written instructions, followed by three practice trials. The design was the same as in Experiment 1: after the practice trials, three experimental blocks were presented, with optional breaks between them. Trials were automatically randomized for each listener within each block. Each block consisted of 16 trials (4*vowel /ԑ, æ, ɔ, u/). Within each block, eight items were presented with the correct vowel (each vowel twice) and eight with an incorrect vowel. No fillers were inserted.
Results
As in Experiment 1, we will report the number of “yes” responses. “Yes” responses to English words containing English vowels are considered to be correct (CPs), while “yes” responses to English words containing Dutch vowels are referred to as incorrect (MPs). Figure 4 presents the “yes” responses to English words that contained Dutch vowels (two leftmost bars) or English vowels (two rightmost bars). The black bars represent the data from the school-age children (N = 25); the gray ones those obtained from the adult students (N = 16). The left panel displays proportion of “yes” responses; the right panel displays the reaction times.

English task: proportion of “yes” responses (top panel) and reaction times (RTs) (bottom panel) with indication of the standard error of the mean.
It can be observed that, overall, adults gave more correct responses (acceptance of CPs and rejection of MPs) than children: F (1,39) = 5.54, p = 0.024, ηp2 = 0.124. Correct responses to CPs (English vowels) were significantly more frequent than correct responses to MPs (Dutch vowels): F (1,39) = 175, p < 0.001, ηp2 = 0.818. An interaction was observed between stimulus language and age group: F (1,39) = 21.1, p < 0.001, ηp2 = 0.351. Post-hoc comparisons show that the effect of age is significant for the Dutch stimuli: F (1,39) = 40.67, p < 0.001, ηp2 = 0.51. The effect is not significant for the English stimuli: F (1,39) = 1.3, p = 0.262, ηp2 = 0.032. These findings show that the young listeners are more inclined than the adults to accept Dutch vowels in English words as instances of English ones. However, the children are not more inclined to reject English words pronounced with an English vowel.
The analysis of the RTs revealed that participants responded faster to the stimuli with English vowels: F (1,39) = 4.22, p = 0.047, ηp2 = 0.098. Adult participants were found to respond generally faster than children: F (1,39) = 27.98, p < 0.001, ηp2 = 0.418. No significant interaction was observed between the factors age group and stimulus language: F (1,39) = 0.02, p = 0.893, ηp2 = 0.
A following analysis was carried out to compare the effects of Experiment 1 to those of Experiment 2. Across the two experiments, the children were slightly more likely than the adults to give “yes” responses: F (1,39) = 4.36, p = 0.043, ηp2 = 0.101. Furthermore, participants gave overall more “yes” responses to the items in Experiment 1 than in Experiment 2: F (1,39) = 18.32, p < 0.001, ηp2 = 0.32. Participants gave overall more “yes” responses to stimuli containing English vowels: F (1,39) = 23.08, p < 0.001, ηp2 = 0.372. A just non-significant effect was observed for the interaction between age and experiment: F (1,39) = 3.66, p = 0.063, ηp2 = 0.086. A significant effect was observed for the interaction between age and stimulus language, indicating that children gave overall more “yes” responses to stimuli containing Dutch vowels whereas the pattern was reversed for the adults: F (1,39) = 12.98, p = 0.001, ηp2 = 0.25. An interaction was observed between experiment and stimulus language, reflecting the fact that in Experiment 1 the items containing Dutch vowels were more often accepted, whereas this pattern was reversed in the English experiment: F (1,39) = 839.17, p < 0.001, ηp2 = 0.956. Finally, a significant three-way interaction was observed between experiment, stimulus language and age: F (1,39) = 20.14, p < 0.001, ηp2 = 0.341. This interaction reflects the pattern observed in the previous section: in Experiment 2, children were more likely to accept English words with Dutch vowels than the adults. No difference was observed for the English words containing English stimuli. This asymmetry was not present for Experiment 1. Appendix C reports on a control experiment to test the naturalness of the created items, both those from Experiment 1 and those from Experiment 2. The results of that experiment showed that the within language cross-spliced items (CPs) sounded more natural than the cross-language cross-spliced items (MPs). This is not surprising because for the CP items the formant transitions between the frame and the vowel had to be smaller than those for the MPs. However, the naturalness of the items was equal across the two experiments. The asymmetry reported above (which was present in Experiment 2 but not in Experiment 1) can thus not result from differences in cross-splicing quality across the experiments.
Table 8 presents the proportion of “yes” responses to CPs by children and adults per vowel. An analysis of the participants’ responses to CPs per vowel did not reveal an overall effect of age group: F (1,39) = 2.13, p = 0.152, ηp2 = 0.052. However, a just non-significant effect was observed for the factor vowel: F (3,117) = 2.15, p = 0.098, ηp2 = 0.052. More importantly, these effects were accompanied by a strong interaction between the factors vowel and age group: F (3,117) = 9.82, p < 0.001, ηp2 = 0.201. While the children displayed lowest performance on English words with /æ/, which they accepted in 81% of the tokens, the adults accepted as many as 98% of those words. By contrast, the adults accepted CPs involving English /u/ in only 82% of the tokens, which the children accepted in 93%. These results may be understood when considering that, according to Flege (1997), English /æ/ is a “new” vowel for native Dutch listeners, which in Flege’s speech learning model (SLM) is defined as “a vowel that differs acoustically and perceptually from the sound(s) in L1 that most closely resemble(s) it” (Flege, 1997, p. 17). As a result, children may be less familiar with this non-native vowel than proficient adults. One could hypothesize that some children have not created a new category for English /æ/, but instead use the phonological representation of English /ԑ/, which is always realized as [ԑ], leading them to reject [æ] realizations. For instance, if they use one phonological category /ԑ/ for both English /ԑ/ and /æ/, they may expect the vowel in both English “head” and “hat” to be realized as [ԑ], and reject pronunciations of English “hat” as [hæt].
“Yes” responses to English correct pronunciations by children and adults.

The reason for the relatively low acceptance rate of CPs involving English /u/ by the adults may be twofold. First, it can again be ascribed to the fronted character of the [u] produced in the stimuli (see Table 1), in line with a general trend for u-fronting in English (Hawkins & Midgley, 2005). The adults in particular may be more familiar with the traditional back realization of English /u/, and hence prefer non-fronted realizations. A second explanation can be found in the listeners’ native language, in which the rounded back vowel /u/ contrasts with the rounded front vowel /y/. Dutch listeners may thus perceive fronted realizations of /u/ as allophones of their native category /y/, and more strongly prefer the non-fronted version in English words. However, this latter explanation does not explain the difference between the children and the adults.
Table 9 displays the proportion of “yes” responses to each of the Dutch substitution vowels. Substantial differences existed between the proportions of “yes” responses for the different vowel target-replacement pairs: F (7,273) = 23.06, p < 0.001, ηp2 = 0.372. Furthermore, the adults performed significantly better than the children: F (1,39) = 38.63, p < 0.001, ηp2 = 0.498. These effects were accompanied by an interaction between vowel pair and age group: F (7,273) = 9.35, p < 0.001, ηp2 = 0.193.
“Yes” responses to English mispronunciations by children and adults.

Discussion
In the first analysis it was observed that children are more likely than adults to accept English words that are pronounced with a Dutch vowel. Interestingly, they are not in general more inclined to completely rely on their native phonology, as shown by the observation that children were not more inclined than the adults to reject English words that contained the correct English vowels. One could speculate that the children are just applying a more liberal criterion in general when judging English words, but this does not seem to be the case as they numerically rejected more of the correct English words than the adults. This trend is in line with the idea that the children rely more on their native phonology. Interestingly, however, this effect is especially expressed in their acceptance of English words that contain Dutch vowels.
With respect to the individual vowel substitutions, substitutions of /ԑ/ by /ɪ/ were rejected most of the time by the children (20% “yes” responses) but in all of the cases by the adults (0% “yes” responses). For both groups it seems that the listeners’ familiarity with the /ԑ/–/ɪ/ contrast from their native language made them sensitive to the contrast in the non-native language. However, substitutions of English /ԑ/ by Dutch /ԑ/ were also frequently rejected by the adults in (with an acceptance rate of only 27%). This is surprising, given the acoustic similarity between Dutch and English /ԑ/. Figure 5 presents a vowel plot representing F1 and F2 values of the English and Dutch vowels in the stimuli. (The values are those reported in Table 5.)

Vowel plot showing formant 1 (F1) and formant 2 (F2) values of the target English (dashed ellipses, in gray) and substituting Dutch (solid ellipses, in black) vowels in the stimuli. Ellipses represent 1 SD away from the mean. Axes are mel-scaled.
Again, the children accepted more MPs involving English and Dutch /ԑ/ (in 56% of the tokens). Apparently, the adults could detect an acoustic difference between the vowels that the children did not perceive, or to which they were not as sensitive.
For the English words with the target vowel /æ/ containing Dutch /ɑ/ or /ԑ/, the adults accepted very few of the MPs. The children accepted more items, namely 27% and 43% of the English /æ/-words containing Dutch /ɑ/ and /ԑ/, respectively. This again seems to suggest that some children have (to some extent) not created a new phonological category for the “new” English vowel /æ/, but use a phonological vowel category that is underspecified and includes phonetic realizations like [ԑ] and [ɑ].
For substitutions of English /ɔ/ by Dutch /u/ and especially /o/, the data from the children showed that, with respect to English /ɔ/ being substituted by Dutch /o/, MPs were accepted in 57% of the tokens. Again, the adults accepted this type of MP much less frequently than the children, in only 23% of the tokens. Further, both children and adults performed at ceiling with respect to English /ɔ/ words realized with Dutch /u/, which were correctly rejected in all of the cases.
For the English words in which the target /u/ was replaced by Dutch /y/, the adults accepted /y/- and /u/-substitutions in 17% and 15% of the tokens, respectively. Again, the children accepted these types of MPs much more frequently: English /u/ words containing Dutch /y/ were accepted in 53% of the tokens, those containing Dutch /u/ in 67%.
In sum, the results of the English task revealed that children were sufficiently familiar with the English words and vowels to accept by far the majority of CPs (89%) and to reject MPs involving Dutch vowels which are considerably different from the English target vowels in acoustic terms (e.g. substitution of /ɔ/ by /u/). However, the children correctly reject MPs involving substitutions of /ԑ/ by /ԑ/ and /ɔ/ by /o/ in less than half of the tokens, confirming the observation that, if vowels do not differ greatly in terms of F1 and especially F2, they are less easily discriminated. Overall, these data show that children were less sensitive to English phonemic contrasts in most of the vowel contrasts. This means that the overall pattern, where children are specifically performing worse than the adults on mispronunciations, is not due to the data of any one specific vowel contrast.
As in the previous section, Figure 6 displays the use of the cues F1, F2 and duration. The picture is less clear than for the previous experiment. For F2, children seem to respond “yes” even for stimuli that are quite far from the target. Significantly, this is in part due to their high acceptance rate of Dutch /u/ in English words which contain /u/, despite the fact that English /u/ is relatively far removed from Dutch /u/. The children thus seem to be less sensitive to the F2 contrast in these English target stimuli. A linear mixed effects regression was used to test these effects. The same analysis approach was taken as for Experiment 1. An effect was observed for the intercept, reflecting that, overall, mispronunciations were accepted less than 50% of the time (b = −2.97, z = −8.58, p < 0.001). A main effect was observed for age (b = −1.88, z = −2.71, p = 0.007), indicating that adults gave overall fewer “yes” responses to these mispronunciations than children. Main effects were also observed for duration (b = −6.98, z = −6.07, p < 0.001) and F1 (b = −0.7948, z = −4.040, p < 0.001). The negative b-values indicate that, across all participants, listeners used these cues correctly as a larger distance between the stimulus and the target led to fewer “yes” responses. No significant main effect was observed for F2 (b = −0.19, z = −1.52, p = 0.130). Significant interactions were observed between age and F1 (b = −1.1300, z = −2.87, p = 0.004), and age and F2 (b = −0.8193, z = −3.343, p < 0.001). The negative b-values indicate that the slopes for the adults were steeper, that is, that the adults made significantly better use of these two cues than the children. No such interaction was observed between age and duration (b = −0.6933, z = −0.301, p = 0.763). Unlike the data for Experiment 1, these results show that the children were less able to make use of the available cues than the adults.

Cue use in Experiment 2: English target words containing Dutch vowels.
General discussion
The current study was set up to test the phonological development of school-age children in their L2. To this end two experiments were conducted, in which a group of 10–12-year-old Dutch-speaking children and a control group of adults judged the pronunciation of L1 Dutch (Experiment 1) and L2 English (Experiment 2) words to be “correct” or “incorrect.” The words were either presented with other instances of the target vowels, or with vowels from the other language inserted, i.e. English vowels inserted into Dutch words in Experiment 1 and Dutch vowels inserted into English words in Experiment 2.
The discussion centers around two topics on which the reported experiments shed light: the similarities and differences between school-age children and adults with respect to the vowel category boundaries in their native and non-native language, and the way in which phonological representations are organized in the mind of bilingual/second language speakers.
First, the experiments provided insight into the criteria native and non-native language users use to decide on the category membership of phonological vowel representations. With respect to the native language, the results of the Dutch experiment revealed that children and adults did not differ in their judgments on native Dutch words with either Dutch or English vowels inserted. This suggests that 10–12-year-old children have well-established categories for their native vowels, and confirms the findings reported in Simon et al. (2014). Both children and adults were very tolerant with respect to certain vowel substitutions, while they rejected others. An explanation should be sought in the acoustic (spectral and durational) distance between the vowels, but also in the location of phonological boundaries. Both children and adults seemed to be sensitive to even small acoustic differences. For instance, English /ɔ/ was only slightly closer to Dutch /o/ than to Dutch /u/ in terms of F1, F2 and duration in the stimuli, yet Dutch /o/-words realized with English [ɔ] were accepted in 95% and 96% of the tokens by the children and adults, respectively, while Dutch /u/-words realized with English [ɔ] were accepted in 4% and 2% of the tokens. It should be noted that a cue which was not taken into account in the analysis was liprounding: it is, for instance, possible that stronger liprounding in Dutch /u/ than in Enlgish /ɔ/ is the explanation for why Dutch /u/-words realized with English [ɔ] were accepted. However, besides acoustic differences, the native phonology also seems to play an important role in the setting of vowel category boundaries. For instance, Dutch /ԑ/ was acoustically closer to English /ɪ/ than to English /ԑ/ in terms of F1 and duration, and only marginally further away from English /ɪ/ than from /ԑ/ in terms of F2, yet realizations of Dutch /ԑ/ words with English [ɪ] were less often accepted than realizations with English [ԑ]. The native phonology offers an explanation here: Dutch has a contrast between the phonemes /ԑ/ and /ɪ/, so Dutch listeners map English [ɪ] realizations to their native Dutch /ɪ/ phoneme and hence reject Dutch /ԑ/-words that are realized with English [ɪ].
Although children and adults mostly did not differ with respect to their judgments on native Dutch words, they did differ in their responses to English words, and especially when a native Dutch vowel was inserted. Overall, children and adults did not differ in their judgments on English words with English vowels, which they accepted in by far the majority of tokens (over 88%). An analysis of the individual vowels revealed that children and adults differed in their responses to specific vowels, with children accepting only 81.3% of correctly pronounced English /æ/-words (compared to 97.9% accepted by the adults) and adults accepting only 82.3% of correctly pronounced English /u/-words (compared to 92.7% accepted by the children). It is possible that as the children had only a basic vocabulary in English, some had not created a new category for the English vowel /æ/, which does not occur in Dutch, but instead use the vowel /ԑ/ for both English /ԑ/ and /æ/, and hence rejected English /æ/-words which were pronounced correctly. One explanation for the higher rejection rate of correctly pronounced English /u/-words by the adults could be due to adults’ lower familiarity with the relatively recent trend to produce /u/ more fronted in British English. When the 18–20-year-old adult listeners received their first formal instruction in English (i.e. when they were about 13), the phenomenon of u-fronting may not have been as common as now, which would explain why adults but not children reject pronunciations of English /u/ words with a fronted vowel. This interpretation is, however, not supported by the mispronunciation data: the vast majority of English /u/-words that were pronounced with Dutch /u/ were rejected by the adults (only 15% “yes” responses), whereas the children accepted those words much more often (67% “yes” responses). It thus seems that children had a much less well-defined /u/ category in English and accepted more of those words, irrespective of their pronunciation.
In general, the most important differences between children and adults were observed in the responses to English words in which a Dutch vowel was inserted: the adults rejected significantly more of these words than the children. Whereas some vowel substitutions were detected (and rejected) by both groups, such as the realizations of English /ɔ/-words (like “ball”) with Dutch /u/, others were rejected by the adults but accepted by the children. One such vowel was English /æ/. As mentioned above, the adult listeners had clearly created a new phonological representation for this vowel, as they rejected all instances of English words in which target /æ/ was replaced by Dutch /ԑ/. Some children, by contrast, had not (yet) created a separate phonological category for English /ԑ/ and accepted a native Dutch vowel, /ԑ/ or /ɑ/, as a substitution. This shows that for these children the phonological representations of the native language interfere with the non-native phonological component. As predicted by Flege’s SLM (1997), the results also confirm that, as proficiency in the non-native language increases (the adults being more proficient than the children), the boundaries between phonological categories become sharper.
With respect to the English experiment, two hypotheses were formulated. The first hypothesis stated that children use their Dutch phonological inventory when listening to English words. The second hypothesis stated that children are, in general, more liberal than adults when they perform a mispronunciation task in a second language (note that Experiment 1 shows that children are not more liberal in general, i.e. irrespective of the language). The results discussed above argue against a pure version of the first hypothesis because children did not generally reject correctly pronounced English words in Experiment 2. The results also argue against a pure version of the second hypothesis as the children were not more liberal across the board. In fact, numerically, they rejected more of the CPs than the adults. As such, it is most likely that the child behavior results from a combination of these two hypotheses. That is, the children rely on their native language phonology, but they also apply less strict criteria in general. That means that the scores for CPs in Experiment 2 are not significantly different between children and adults because a potential decrease in perceived acceptance (due to the native phonology) is offset by their more liberal strategy.
One alternative explanation may also account for these data. It is possible that children mostly rely on their native phonology, but can also recognize correctly pronounced English items. For the latter they could rely on units of recognition that are of word sizes (i.e. these words are not specified for phonemic content but are associated with a “sound image”). Such an explanation would be in line with template-based approaches to phonological representations, according to which the basic organizational units of children’s early development are whole words rather than individual phonemes or features (Macken, 1979; Vihman & Croft, 2007). It is hypothesized that in the early stages of learning children acquire a limited number of specific word shapes, which then gradually becomes larger as the learning process goes on (Vihman & Croft, 2007, p. 686). The data provide support for this hypothesis because there was no significant difference between the performance of the children and the adults on the CPs in Experiment 2 (which would be based on their recognition of these English words as units). Some specific patterns argue against a strong version of this hypothesis though, such as the observation that the children rejected more of the CPs in Experiment 2 that involved /æ/. Future research should be undertaken to further investigate this hypothesis. As for now, the current data provide the strongest support for a combination of the first and second hypotheses formulated above: children rely heavily on their L1 phonology, but at the same time they tend to be more lenient when judging English words.
A second topic on which the experiments shed light is the organization of phonological representations in the bilingual mind. As discussed in the introduction, most models of the bilingual mind (De Bot, 1992; Hartsuiker & Pickering, 2008) assume language-nonselective lexical access, with separate syntactic and phonological components which to some extent interact. The present study aimed to get better insight into the extent to which there is interaction between the phonological components of the two languages of bilingual speakers. The results of the experiments suggest that proficient adult non-native listeners generally have clearly separated sets of phonological representations for their two languages. Even for acoustically very similar vowels, such as Dutch and English /ԑ/, advanced learners seem to have created separate phonological representations, as evidenced by the adults’ rejection of most English words in which a Dutch /ԑ/ was inserted. For non-proficient child learners, the L1 phonology still exerts a big influence on the L2 phonology, since they accept English words realized with native Dutch vowels more frequently than adults. However, the children do seem to be aware that their second language requires a different task strategy: the children applied a less strict criterion for making their judgments about stimulus quality when performing the English task.
Conclusions
We reported on the phonological development in the native and non-native language of a group of 10–12-year-old Dutch-speaking children learning English, and compared the children’s development to that of more proficient non-native adults. The aim was to identify which criteria children used to decide on the category membership of native and non-native vowels, and to get insight into the organization of phonological representations in the bilingual mind. The results confirm those reported in Simon et al. (2014) that at that age children have well-established phonological vowel categories in their native language. However, in their non-native language, children tend to accept mispronounced items which involve sounds from their native language. At the same time, however, they do not seem to fully rely on their native phonemic inventory because the children accepted most of the correctly pronounced English items.
Footnotes
Appendix C
Appendix A
Stimuli for Experiment 1

| Dutch vowel | Dutch word | Frame | List 1 | List 2 | List 3 |
|---|---|---|---|---|---|
| /ε/ | pet (“cap”) | [p_t] |
|
[pεt] | [pɪt] |
| web (“web”) | [w_b] | [wɪb] |
|
[wεb] | |
| mes (“knife”) | [m_s] | [mεs] | [mɪs] |
|
|
| tent (“tent”) | [t_nt] |
|
|
|
|
| /ɑ/ | tak (“branch”) | [t_k] |
|
[tεk] | [tæk] |
| bad (“bath”) | [b_t] | [bæt] |
|
[bεd] | |
| dak (“roof”) | [d_k] | [dεk] | [dæk] |
|
|
| kat (“cat”) | [k_t] |
|
|
|
|
| /o/ | spook (“ghost”) | [sp_k] |
|
[spɔk] | [spuk] |
| poot (“paw”) | [p_t] | [put] |
|
[pɔt] | |
| boot (“boat”) | [b_t] | [bɔt] | [but] |
|
|
| noot (“nut”) | [n_t] |
|
|
|
|
| /u/ | hoed (“hat”) | [h_t] |
|
[hɔt] | [hut] |
| stoel (“chair”) | [st_l] | [stul] |
|
[stɔl] | |
| voet (“foot”) | [v_t] | [vɔt] | [vut] |
|
|
| koe (“cow”) | [k_] |
|
|
|
Stimuli in bold contain the Dutch target vowel.
Appendix B
Stimuli for Experiment 2

| English vowel | English word | Frame | List 1 | List 2 | List 3 |
|---|---|---|---|---|---|
| /ε/ | bed | /b_d/ |
|
[bεd] | [bɪd] |
| ten | /t_n/ | [tɪn] |
|
[tεn] | |
| neck | /n_k/ | [nεk] | [nɪk] |
|
|
| pen | /p_n/ |
|
|
|
|
| /æ/ | cat | /k_t/ |
|
[kεt] | [kɑt] |
| rat | /r_t/ | [rɑt] |
|
[rεt] | |
| hand | /h_nd/ | [hεnd] | [hɑnd] |
|
|
| hat | /h_t/ |
|
|
|
|
| /ɔ/ | ball | /b_l/ |
|
[bul] | [bol] |
| four | /f_/ | [fo] |
|
[fu] | |
| door | /d_/ | [du] | [do] |
|
|
| fork | /f_k/ |
|
|
|
|
| /u/ | moon | /m_n/ |
|
[mun] | [myn] |
| shoe | /∫_/ | [∫y] |
|
[∫u] | |
| two | /t_/ | [tu] | [ty] |
|
|
| fruit | /fr_t/ |
|
|
|
Stimuli in bold contain the English target vowel.
Acknowledgements
The authors wish to thank all children and adults for their participation in the experiments, the school heads and teachers for their cooperation, and the bilingual speaker for recording stimuli. Thanks also to Sarah Bernolet for granting access to the picture database of the Experimental Psychology Department at Ghent University, and to Mathijs Debaene and Kiki Marcus for help with adult data collection.
Declaration of Conflicting Interests
The author(s) declared no potential conflicts of interest with respect to the research, authorship, and/or publication of this article.
Funding
The author(s) disclosed receipt of the following financial support for the research, authorship, and/or publication of this article: This work was supported by a post-doctoral research grant from the Fund of Scientific Research – Flanders (FWO), awarded to the first author.