




Abstract
Purpose:
As a contribution to the endeavour of developing appropriate tools for bilingual language assessment, this paper investigates the concurrence between two new tools from the recent COST Action IS0804 (Bi-SLI), and the differences between children across two different migrant communities.
Approach:
Two new tools from the battery Language Impairment Testing in Multilingual Settings (LITMUS) were used: the direct assessment tool Cross-linguistic Lexical Tasks (CLT) and the reporting instrument Parents of Bilingual Children Questionnaire (PaBiQ), which offers an indirect measure of overall language skills.
Data:
The participants were 36 children (4;2–6;6) of Polish immigrants to Norway or the UK. Correlations were investigated with Kendall’s rank correlation, and comparisons carried out with Wilcoxon rank sum tests.
Findings:
The results from the two tools correlated. The CLT results were higher in the minority language (Polish) than in the majority language, with no difference between the groups. Still, the parents in the UK judged their children as less proficient in Polish than those in Norway did. Two different accounts for this incongruity are discussed. Firstly, parents in the UK may set higher benchmarks for their children’s minority language skills than the parents in Norway. Alternative accounts of this interpretation related to differences in the parents’ socio-economic background, minority language proficiency or language attitudes are discussed. Secondly, parental report may indicate early stages of attrition of the minority language among the children in the UK that the direct lexical assessment tool may not be sensitive enough to uncover.
Originality:
The study used two new tools designed for multilingual children to compare two groups of children of a recent and growing immigration group, whose language development is currently underinvestigated.
Implications:
The findings underscore the complexity of assessing bilingual children’s full language competence. The cross-cultural differences documented call for further longitudinal research comparing immigrant children from different language backgrounds.
Keywords
Introduction
In the wake of the 2004 European Union (EU) enlargement, many Western European countries have seen a rapid increase in the immigration from the former Eastern Bloc. As a result, Poland is currently the most common country of birth in the immigrant population of both Norway (Statistics Norway, 2016a) and the UK (Office for National Statistics, 2016). Migrant communities may retain their own minority language(s) at the expense of the majority language(s), maintain their minority language(s) alongside the majority language(s) or undergo a process of language shift, where the heritage language is replaced with the majority language (Fishman, 1991). As pointed out by Fishman (1991), the first two outcomes depend on intergenerational transmission of the minority language; language transmission in turn depends on language maintenance. Language shifts may vary in speed within different contexts (Gal, 1979), but they tend to progress from one generation to the next (De Houwer, 2007; Fishman, 1991; Saltarelli & Gonzo, 1977).
Importantly, an individual can become or cease to be multilingual; as such, multilingualism must be seen as a dynamic state rather than a static property (Grosjean, 2008). Thus, an individual may acquire a minority language in a monolingual setting from birth, become multilingual as a pre-schooler and be a monolingual speaker of the majority language as an adult. Multilingualism is not only dynamic, but also multifaceted: As stated by Grosjean’s Complementarity Principle, individuals who use more than one language on a daily basis will at any point in time tend to use each of these for different purposes, with different people and within different domains (Grosjean, 2008). They will, hence, not know a translational equivalent in language X for every word they know in language Y, and vice versa.
Thus, to fully capture multilingual children’s language development, one must study all their languages (De Houwer, 2009; Grosjean, 2008; Pearson, 2010). This point is particularly important in a clinical context: slow development only in the majority language may be attributable to limited exposure to that language (Paradis, Emmerzael, & Duncan, 2010), whereas slow language development in all languages may indicate language impairment (Kohnert, 2010; Paradis, 2016). Logically, then, results from one language alone cannot tell us whether a child has language impairment. Even so, it is common to assess only the majority language – both in research (e.g. Bialystok, Craik, & Luk, 2008; Lervåg & Aukrust, 2010; Melby-Lervåg & Lervåg, 2013) and in speech-language pathology (Bedore & Peña, 2008; Paradis et al., 2010). As a result, multilingual children risk being misdiagnosed with language impairment (Armon-Lotem & de Jong, 2015; Bedore & Peña, 2008; Cattani et al., 2014; de Jong, Çavuş, & Baker, 2010; Kohnert, 2010; Leonard, 2014; Paradis, 2016).
Several issues stand in the way of valid language assessment of multilingual children: There is a lack of appropriate tools, adequate norms and knowledge of children’s home languages (Paradis et al., 2010). The first of these shortcomings is evident if we look at the status quo for lexical assessment tools, commonly used because the vocabulary is a good indicator of overall skills in a given language (Bates & Goodman, 1997; Conboy & Thal, 2006; Gathercole, Mon Thomas, & Hughes, 2008), as expected by usage-based approaches (Langacker, 1987; Tomasello, 2005). General language tools suitable for cross-linguistic assessment are still exceptional, one such exception being the Bilingual English Spanish Assessment (BESA) for Spanish-English bilinguals in the USA (Peña, Gutierrez-Clellen, Iglesias, Goldstein, & Bedore, 2014), which includes a lexical (semantic) subtest. However, there is a lack of appropriate tools for other combinations of languages spoken by immigrant populations all over the world (Peña, 2007). Assessment tools that are available across multiple languages are typically translated from one language to another. For instance, the Norwegian version (Lyster, Horn, & Rygvold, 2010) of the British Picture Vocabulary Scale II (BPVS II) is largely a direct translation of its British English counterpart (Dunn, Dunn, Whetton, & Burley, 1997). This method poses challenges to the validity of cross-linguistic comparisons because the ‘same’ items may not be equally difficult across languages (Peña, 2007).
Peña (2007) argues that to ensure equivalence across languages, assessment tool construction must consider item difficulty, by including measures such as words’ frequency of occurrence in the target language or their age of acquisition (AoA), that is, how old children typically are when they acquire it. This measure is approximated either from child language data such as Communicative Development Inventory (CDI) norms (Hansen, 2017; Ma, Golinkoff, Hirsh-Pasek, McDonough, & Tardif, 2009) or by collecting subjective judgements from adult first language (L1) speakers (Bird, Franklin, & Howard, 2001; Łuniewska et al., 2016; Morrison, Chappell, & Ellis, 1997). Importantly, an assessment tool for children may need to rely on other measures than a tool for adults; as demonstrated by Goodman, Dale, and Li (2008) and Hansen (2017), frequency in child-directed speech is a better predictor of when children acquire words than frequency in adult written language.
A recent development in this respect is the assessment tool battery Language Impairment Testing in Multilingual Settings (LITMUS) (Armon-Lotem, de Jong, & Meir, 2015), developed through the recent European network COST Action IS0804 Language impairment in a multilingual society: Linguistic patterns and the road to assessment (2009–2013). One of the new tools developed by members of this network is Cross-linguistic Lexical Tasks (CLT) (Haman, Łuniewska, & Pomiechowska, 2015), which assesses receptive and expressive lexical skills through picture identification and picture naming of nouns and verbs. For cross-linguistic validity, this tool is not translated or adapted, but constructed independently for each language based on AoA, measured by subjective ratings from adult L1 speakers (Lind, Simonsen, Hansen, Holm, & Mevik, 2015; Łuniewska et al., 2016) and a composite measure of complexity that comprises phonology, morphology, etymology and exposure obtained for each word in each of the languages involved (Haman et al., 2015). The creators considered basing the selection of words on corpora of child language or child-directed speech, but abandoned this approach due to difficulties with obtaining comparable data across the variety of languages involved (Haman, Szewczyk, Łuniewska, & Pomiechowska, 2011). Concerning the two background variables behind CLT, results from three recent studies (Altman, Goldstein, & Armon-Lotem, 2017; Haman et al., 2017; Hansen, Simonsen, Łuniewska, & Haman, 2017) indicate that the word complexity measure does not successfully predict item difficulty, but AoA does: target words acquired early in life are easier for monolingual as well as bilingual children than target words with a high (late) AoA (Altman et al., 2017; Haman et al., 2017; Hansen et al., 2017). Investigating CLT results from monolingual Polish and Norwegian children as well as bilingual Polish-Norwegian children, Hansen et al. (2017) reported that AoA accounted better for the difficulty of the CLT target words in both languages and among both groups than did the frequency of occurrence in child-directed speech (Haman, Etenkowski, et al., 2011; Hansen, 2017), calculated from Polish and Norwegian CHILDES corpora (MacWhinney, 2000).
CLT versions have been developed for 24 languages so far, and the tool has been used across a variety of cultural contexts, on both monolingual and bilingual children, both with and without language impairment (Haman et al., 2017; Hansen et al., 2017; Kapalková & Slančová, 2017; Khoury Aouad Saliby, dos Santos, Kouba-Hreich, & Messarra, 2017; Potgieter & Southwood, 2016; Simonsen & Haman, 2017). It is not yet normed for any population. However, recent studies have indicated that the tool does differentiate between typical language development and language impairment among monolinguals (Kapalková & Slančová, 2017) as well as bilinguals (Khoury Aouad Saliby et al., 2017).
Furthermore, CLT yields comparable results across languages. Haman et al. (2017) compared the CLT performance of monolingual children across 17 languages (Afrikaans, Catalan, British English, South African English, Finnish, German, Hebrew, isiXhosa, Italian, Lithuanian, Luxembourgish, Norwegian, Polish, Serbian, Slovak, Swedish and Turkish) and found similar results across 16 of these languages. In one language, isiXhosa (a Bantu language), children scored significantly lower than in the other 16, possibly due to a low socio-economic background (Potgieter & Southwood, 2016). Taking a closer look at the results from two languages, Hansen et al. (2017) found no difference in performance between the Polish and Norwegian monolinguals, and argued that for these two languages at least, CLT succeeds to be cross-linguistically equivalent (Hansen et al., 2017). Even with adequate tools, assessing children’s skills in their home language will still be a challenge, as educators and speech-language pathologists rarely understand the minority languages spoken by the children in their care (Kohnert, 2013; McLeod & Verdon, 2017; Williams & McLeod, 2012).
An alternative approach is indirect assessment through parental questionnaires. Combining different (monolingual) adaptations of the MacArthur-Bates CDI (Fenson et al., 2007) or using a bilingual adaptation of the tool (Gatt, 2007; O’Toole & Fletcher, 2010) may be a valid option, but so far only for children up to age 3 (Conboy & Thal, 2006; De Houwer, Bornstein, & Putnick, 2014; Elin Thordardottir, 2015; Gatt, Grech, & Dodd, 2016; Law & Roy, 2008; O’Toole et al., 2017; O’Toole, 2013; Pearson, Fernandez, & Oller, 1993). For children up to age 7, Paradis et al. (2010) demonstrated that responses on a parental questionnaire named the Alberta Language and Development Questionnaire can discriminate between language impairment and typical language development of early second language (L2) learners of English in Canada, as the former group scored lower overall than the latter. The questionnaire asks general questions about the child’s language development, including judgements about the skills in the home language. Although parents are generally good judges of their children’s language skills (Fenson et al., 1994), they may misjudge their children’s skills in the majority language, particularly if they themselves are new to the language (Tuller, 2015). They may also misjudge their children’s competence in the home language, particularly if they are unaware of the differences between descriptive and prescriptive norms. Furthermore, both parental and societal expectations may affect where parents set the benchmark.
Hence, similar parental judgements across different language communities do not necessarily entail similar levels of language skills, and vice versa. As such, it is important to see how well the responses from parents match with results from more direct observations of children’s language skills, for instance by means of structured tasks or tests. Such a comparison may, however, involve an inherent methodological bias since changes with the child’s age and performance in parental report versus direct observation may be affected by different factors, resulting in a non-linear relation or a relatively constant shift across measures, not captured by simple correlations (Bennetts, Mensah, Westrupp, Hackworth, & Reilly, 2016), so its limitations should be also acknowledged.
Initiated within the COST Action IS0804, the current study seeks to contribute to the larger goal of improving the language assessment of children acquiring more than one language, and particularly those growing up in migrant communities across Europe. More specifically, we aim to contribute to the further development of two tools emerging from this network, namely the direct lexical assessment tool CLT (Haman et al., 2015) and the Parents of Bilingual Children Questionnaire (PaBiQ) (COST Action IS0804, 2011; Tuller, 2015), in part based on the Alberta Language Environment Questionnaire (Paradis, 2011) and the Alberta Language and Development Questionnaire (Paradis et al., 2010). We apply these two tools on children of Polish migrants to two Western European countries, Norway and the UK, investigating the concurrence between the tools as well as the degree of similarity between the groups. Our research questions are as follows:
To which extent do the results from these two tools (CLT and PaBiQ) concur?
How similar are the results from each of these tools across the two immigrant populations?
Methods
The current paper compares direct and indirect measures of language skills among children of recent Polish immigrants to the UK or Norway. The participant groups were chosen for three reasons. Firstly, recent Polish immigrants are numerous in both countries (Office for National Statistics, 2016; Statistics Norway, 2016a). In the UK, the Polish community has reached one million (Kułakowska, 2013; White, 2011), and each year ca. 25,000 children are born to Polish families (Office for National Statistics, 2014). This has led to an increase in studies investigating linguistic development of Polish-English bilingual children (Haman, Wodniecka, et al., 2017; Marecka, Wrembel, Zembrzuski, & Otwinowska-Kasztelanic, 2015; Miękisz et al., 2016). In Norway in 2016, the Polish community had reached over 95,000, with over 10,000 individuals of Polish origin born in Norway (Statistics Norway, 2016b). Secondly, both countries offer affordable childcare and have a high formal childcare coverage rate (Eurostat, 2016; Mills et al., 2014). Thirdly, there are clear differences between Polish on the one hand and English and Norwegian on the other, making the two groups’ language contexts linguistically comparable. Polish is a Slavic language, while English and Norwegian are Germanic. As such, the lexical similarities between Polish and the two other languages are limited, but the languages also differ in other respects: Polish has a relatively simple vowel inventory compared to Norwegian and English, but a far more complex consonant inventory, and a diversity of consonant clusters (Gussmann, 2007). Furthermore, Polish has a rich morphology (Laskowski, 1998), while English and Norwegian are morphologically simple (Ragnarsdóttir, Simonsen, & Plunkett, 1999). To provide indirect measures of the child’s current language skills, as well as the linguistic, developmental and socio-economic background, the parents were asked to fill in on paper a Polish pilot version of the PaBiQ, Kwestionariusz Rozwoju Językowego (KRJ) [Questionnaire of Language Development] (Kuś, Otwinowska, Banasik, & Kiebzak-Mandera, 2012). For the direct language assessment, lexical skills were measured with CLT. The participants and procedure for data collection are presented below.
Participants
The participants were 36 children (aged 4;2–6;6) of Polish immigrants to the UK or Norway, half residing in each country. The children lived in the region around the capital (London/Oslo) or a relatively large city (Aberdeen/Bergen) (see Table 1). The families were recruited through day-care facilities, schools, Polish newspapers in Norway and the UK, speech and language therapists, communities at universities, portals about parenting, community groups in social media, Polish Saturday Schools, Catholic churches and Polish shops (for a discussion of the recruitment, see Haman, Wodniecka, Kołak, Łuniewska, & Mieszkowska, 2014; Mieszkowska et al., 2017). All of the Polish-Norwegian children attended pre-school, while most of the Polish-English children attended primary school (out of 18 bilinguals in the UK, 13 attended primary school and four attended pre-school). Presumably, all the children had a typical language development; none had been referred to a speech and language therapist, and none were at a high risk of language impairment, according to information on early linguistic milestones, parental concern regarding language development and the history of language difficulties in the family (see Tuller et al., 2013).
Distribution of age and gender among the two participant groups.

According to information from the background questionnaire, all the children lived with both parents, all of whom were L1 speakers of Polish. Whereas 20 of the 36 mothers had higher education, the same was true for only nine of the fathers (see also Haman et al., 2014). According to Fisher’s exact tests, the proportions of highly educated mothers did not differ significantly between the two groups (Norway: 9, the UK: 11, p = 0.738), whereas there were significantly more fathers in the UK (8) than in Norway (1) with higher education (p = 0.018). Two mothers and six fathers had only basic education, all of whom resided in Norway. These group differences correspond to differences in the populations: Whereas ‘the most recent migration to English-speaking countries is the domain of young and relatively well-educated persons’ (Kaczmarczyk, 2010, p. 175), Polish immigrants to Norway tend to be slightly older and not have higher education (Friberg, 2012).
Ethical considerations
The assessment in Norway was approved by the Norwegian Social Science Data Services, and the assessment in the UK was approved by the Ethics Committee at the Faculty of Psychology, University of Warsaw, Poland. The parents were duly informed about the study, and they signed a consent form. Children provided oral assent. The children received a small gift for their participation at the end of the study, whereas neither parents nor day-care facilities received any recompense. The parents were informed that they would not get diagnostic feedback of an individual child’s performance; the tools used here aim to help identify language impairment in multilingual children, but they are not ready for clinical use as norms have not yet been established. Thus, only analyses on the group level are possible at present.
Materials: Parental questionnaire
In the current study, the questionnaire data are utilized for three different purposes: firstly, to exclude children with a high risk of language impairment (see above); secondly, to profile the participants and, thirdly, to provide an indirect assessment of the children’s current linguistic skills across their languages for the comparison with CLT results. Concerning the second point, participants were profiled by five factors derived from the questionnaire data, following Tuller (2015) and Kacprzak, Kołak, Kacprzak, Kołak, and Łuniewska (unpublished manuscript): the age of onset of exposure to each language, three measures of current language exposure and use and, finally, the parents’ judgements of their own proficiency in the majority language. Regarding the third point, the parents rated their child’s skills in each language, covering phonology, vocabulary, syntax and general communicative skills.
Age of onset of language exposure
According to the background questionnaire, all children had been exposed to Polish from birth. The median child had been exposed to the majority language since age 2;0, but there was considerable diversity among the participants: five participants had reportedly heard the majority language from birth, and another four had been exposed to the majority language already before their first birthday. Note that these nine children (three in Norway and six in the UK) had two Polish parents, and reportedly heard and used Polish more than the majority language with other family members. On the other end of the scale, one of the participants was 4;6 upon first contact with the majority language, Norwegian. Figure 1 illustrates the distributions of age of onset of exposure to the majority language among the two participant groups; according to a Wilcoxon rank sum test, the difference between the two groups is not significant (W = 189, p = 0.401).

Age of onset of exposure to the majority language, by participant group.
Depending on definitions, our participants’ acquisition of the majority language could be considered either as simultaneous with the minority language, because exposure started before age five (Meisel, 2004), or as early L2 acquisition (De Houwer, 2009), as all parents reported to mainly speak Polish to their children. Based on the age of onset alone, one may even argue that some experienced bilingual L1 acquisition (De Houwer, 2009), but note that Polish was by far the dominant language in all these children’s homes, according to their parents. At any rate, in order to improve the recognition of language impairment in multilingual children, it is important to capture the variation in the population(s) (Kohnert, 2010).
Current language exposure and use
In the background questionnaire, parents report the patterns of language use in the home by specifying how often (‘never’, ‘seldom’, ‘sometimes’, ‘often’ and ‘always’) each language is used to the child and by the child in conversations with each parent, sibling and other caregiver living with the family (e.g. grandparents). These data were used to gauge the language balance in the child’s home input and home output (language use by the child at home). Estimated frequencies of use were weighted giving 0–4 points for each response for each language (0 points if a language was ‘never’ used by a speaker, and 4 points if it was ‘always’ used). As the PaBiQ does not ask how much time the child spends with each caregiver, the current paper adopted the rationale that children are likely to spend most of their time at home with parents and siblings, giving twice the weight to these as to other caregivers (Kacprzak et al., unpublished manuscript). The patterns of language use in the family may be key to early language development, but the maintenance of a minority language also rests upon interaction with friends and acquaintances, and its use in activities such as singing and reading (Fishman, 1991). The current study employs a measure of language richness that is a combined index of language use with friends and in a set of leisure activities (reading, watching TV or movies, computer activity and children’s songs or nursery rhymes), following Tuller (2015). The higher the index, the larger was the variety of contexts in which the child had contact with a given language.
The scores for each language were used to estimate the degree of Polish dominance in the input to and output from each child, as well as their language richness, illustrated in Figure 2. The degree of Polish dominance was calculated by dividing the score in Polish on the combined score for both languages. As evident from Figure 2, the majority of the children are biased towards Polish in their input as well as their output, although slightly less so in the latter, whereas the measures of language richness are more balanced between the languages. The two groups do not differ significantly in input (W = 166, p = 0.924), output (W = 184, p = 0.494) or richness (W = 145, p = 0.601), but there is a strikingly large variation in the input of the UK participants, compared to those in Norway.
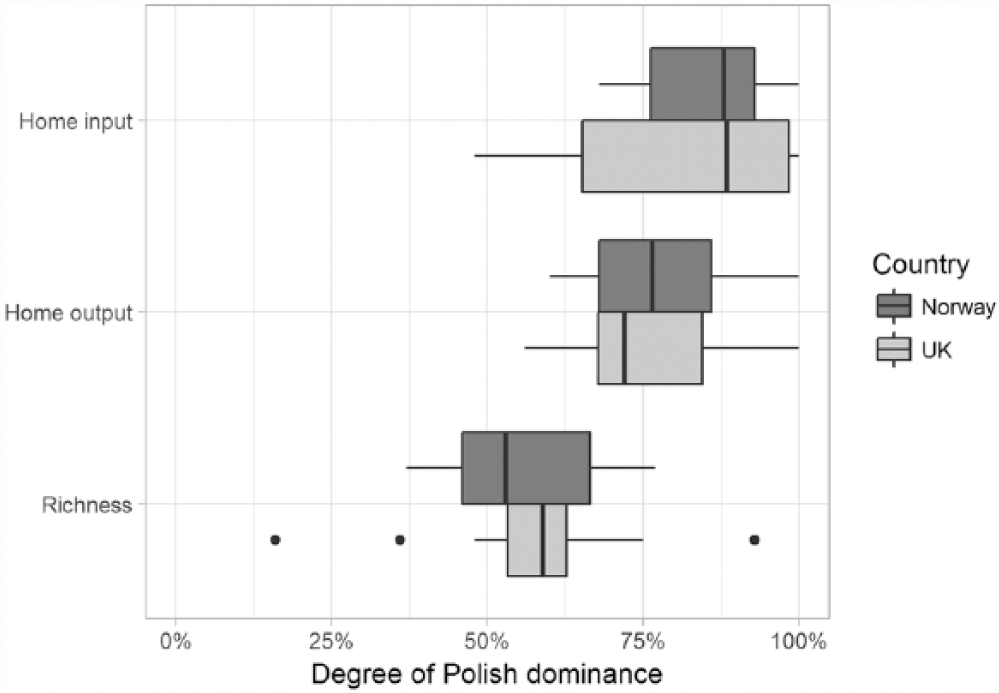
Degree of Polish dominance in the input from and output to other family members.
Parents’ self-evaluation of majority language proficiency
In the PaBiQ, parents rate their own proficiency in each of the languages they know on a five-point scale: (‘only a few words’, ‘gets along, but with difficulty’, ‘basic abilities (gets along)’, ‘well’ and ‘very well’). While as many as 12 of 18 participants in Norway have at least one parent reporting less than basic abilities in the majority language, the same is true for only four of the 18 UK participants. The difference is significant, according to a Fisher’s exact test (p = 0.018).
Parental judgements of children’s overall language skills
The pilot PaBiQ version used here asks parents nine questions about their child’s current skills in their languages, each rated on a four-point scale. The questions cover phonology, vocabulary, syntax and general communicative skills, and tap into both expressive and receptive language (see the Appendix). The current paper follows Tuller (2015) in using the parental judgement to calculate a sub-score of the child’s overall language skills, ranging from 0 (lowest possible rating on all questions) to 27 (highest possible rating on all nine questions); the judgements for the participants ranged from 3 to 27, with a median of 18 points. In addition, the question regarding lexicon size was used to divide the children into two groups: those with a reportedly smaller vocabulary than their peers and those with vocabulary size reportedly similar to or larger than their peers. These scores are compared to direct measures of lexical tasks, collected by means of the lexical assessment tool CLT.
Materials: The Cross-linguistic Lexical Tasks
Direct assessment of the children’s lexical skills was carried out with CLT in Polish (Haman, Łuniewska, Pomiechowska, Szewczyk, & Wodniecka, 2012), UK English (Haman, Łuniewska, Polisenska, & Mieszkowska, 2012) and Norwegian (Simonsen, Hansen, & Łuniewska, 2012). The tool consists of four subtasks, each comprising 32 items: comprehension and production of nouns and verbs. In the comprehension tasks, the participants hear a target word and choose between four different pictures. In the production tasks, they name a single depicted object or action.
As mentioned in the introduction, CLTs have been developed for 24 languages so far. 1 For UK English, German, Norwegian, Polish and Slovak, a computer version is available. Here, the assessment is carried out by means of a computer with a touch screen. Each cue has been recorded from a native speaker, and is played automatically. The participant answers the comprehension tasks by pressing the screen, upon which the computer program registers which picture was pointed at. Production responses are recorded for manual transcription and scoring. Otherwise, the computer version is identical to the paper version of the tool (where the pictures are presented in a printed booklet).
CLT assessment and scoring
All children were assessed in a quiet room in their day-care facility with computer versions of CLT (e-CLT), identical in design to the standard paper versions of CLT. Generally, the gap between the assessment in each language was about a week. L1 speakers carried out the assessment of Polish (in both countries) and Norwegian (in Norway), whereas in the UK, highly proficient L2 speakers of English residing in the UK conducted the English assessment. During the assessment, the experimenter only addressed the child in the tested language.
The order of the four subtasks and the order of the two languages assessed were counterbalanced across children. Each session (four subtasks per language) lasted about 15 minutes. The children received age-appropriate information about the testing, and they were told that they could terminate at any time. All the UK participants completed the tasks in both languages, but three of the participants in Norway did not complete the Polish assessment, and four did not complete the Norwegian assessment. For these seven, only data from the completed language are included in the analyses.
Concerning the children’s production responses, this study followed a scoring system developed within the COST Action IS0804, where any response involving the root of the target word in the assessed language was considered correct, along with regional variants and synonyms. All other responses were considered wrong, including translational equivalents in the other language. Polish-English bilingual competent judges coded the UK production data, whereas the Norwegian data were coded through joint efforts between Polish and Norwegian researchers. The first and second author (native speakers of Norwegian and Polish, respectively) carefully checked the data from Norwegian together to ascertain consistent coding, and to recognize and appropriately score responses involving both languages. The CLT results from each language may potentially range from 0 (no correct answers) to 128 (correct answers on all items); the participants’ scores ranged from 33 to 120, with a median of 87.
Analyses
All statistical analyses were carried out in R (R Core Team, 2015) using RStudio (RStudio Team, 2015). Both measures (parental judgement of children’s overall language skills and vocabulary measure) analysed here are skewed towards top scores; Shapiro–Wilk normality tests revealed significant divergence from a normal distribution for both parental judgements (W = 0.96, p = 0.022) and CLT results (W = 0.94, p = 0.003). The study, hence, focuses on the rank order of the participants rather than the scores: correlations between CLT results and parental judgements of children’s skills were investigated with Kendall’s rank correlation tau (τ), and group comparisons were carried out with Wilcoxon rank sum tests. Group comparisons were carried out both within one language across countries and across languages within one country, with p values adjusted with Holm correction.
Results
Figure 3 illustrates the relationship between CLT results and parental judgements. Overall, there was a significant correlation between the indirect assessment, the parental judgement scores of overall language skills and the direct assessment, the children’s CLT results (rτ = 0.44, p < 0.001). Looking only at the majority language results (UK English in the UK and Norwegian in Norway), the two measures still correlated (rτ = 0.39, p = 0.002). However, there was no correlation between parental judgement scores and CLT results within the participants’ Polish results (rτ = 0.14, p = 0.28). This lack of correlation is observable in Figure 3: most children from both groups scored high on Polish CLT. However, the UK parents judged their children’s skills as lower than the parents living in Norway did, even if their CLT scores were comparable.

Cross-linguistic Lexical Tasks (CLT) results as a function of parental judgements, by language and country.
The group similarities among CLT results are even more apparent in Figure 4. The Polish scores surpassed the scores in the majority language for both the UK (W = 273, p = 0.001) and the Norway groups (W = 196, p < 0.001), and there were no significant between-group differences in either Polish (W = 137, p = 0.971) or the majority language (W = 107, p = 0.940).
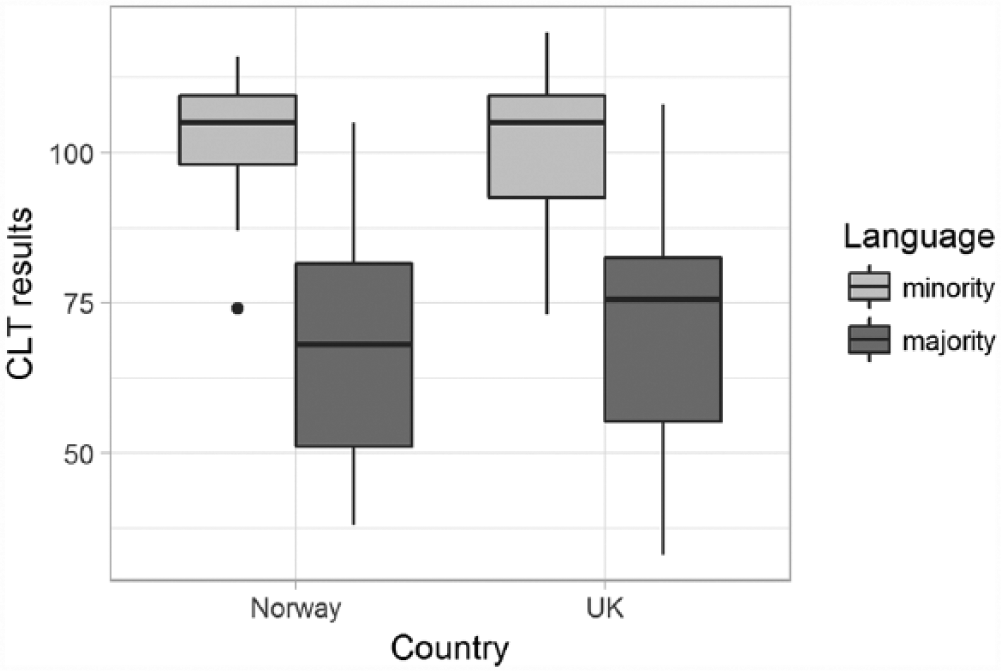
Boxplot of Cross-linguistic Lexical Tasks (CLT) results by country and language.
Figure 5 shows the parental judgements of overall language skills, telling a slightly different story: the children in Norway had significantly higher skills in Polish than in Norwegian, according to their parents (W = 300, p < 0.001), but for the UK group, there is no significant language difference (W = 233, p = 0.050). The parental judgements of the children’s skills in the majority language were not significantly different across the two countries (W = 159, p = 0.937), but the parents residing in the UK judged their children’s Polish skills as lower than did the parents residing in Norway (W = 292, p < 0.001). Isolating the scores on the indirect assessment of vocabulary size from the indirect compound measure, 25 of the 36 children reportedly knew fewer words in the majority language than their peers, with no significant difference between the two countries, according to Fisher’s exact test (UK: 10, Norway: 15, p = 0.15). Only two children, one from each group, were estimated to know fewer words in Polish than other children of the same age do. These also held the lowest scores on the overall indirect measure of minority language skills. Thus, it appears that within the parental judgements of vocabulary skills alone, the picture is more similar to the CLT results than to the indirect compound measure: parents in both groups judged their children to know more words in Polish than in the majority language.
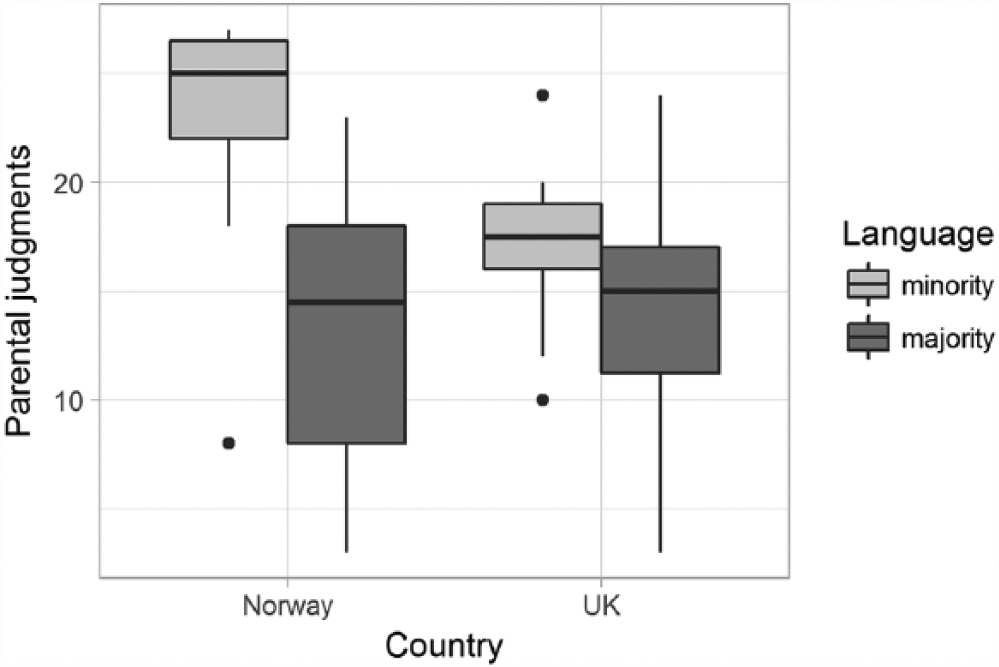
Boxplot of parental judgements of children’s skills, by country and language.
Discussion
The current paper used two tools, the background questionnaire PaBiQ and the lexical test CLT, to assess language skills across the languages of children from two migrant communities, namely Polish immigrants to Norway and the UK, asking to which extent the two tools concur, and how similarly the two groups scored. Firstly, regarding the concurrence between measures, significant correlations were found between the CLT results and parental judgements, both overall and within the majority language, indicating that the two measures do correspond. No correlation was found between parental judgements and CLT results for Polish. The explanation may lie in the distribution of the results: although there is a considerable variation, there is a tendency towards a ceiling effect in Polish on both measures (see Figure 3), potentially masking a significant correlation.
When it comes to our second question regarding the two groups, there was no significant cross-national difference in the children’s CLT results in either language, and no difference in the parental judgement scores of the children’s majority language skills. However, the parents residing in the UK systematically judged their children’s skills in Polish as lower than the parents in Norway did. Although larger datasets are needed to make general conclusions, these findings have implications for the question of how we may establish valid multilingual norms for each of these tools. It appears that CLT norms could be created across groups, for instance based on the methodology of Gathercole et al. (2008), rather than specifically for each language combination. If so, this would make the task considerably more feasible. For the PaBiQ, on the other hand, our results call for caution: it may not be possible to set benchmarks that will be valid across cultural contexts.
The incongruity between the Polish results from the two measures pairs with the surprising lack of a significant correlation between Polish CLT results and parental judgements. There are two possible explanations: firstly, the differences in parental judgements in the two populations may not be due to differences in skills, but because of distinctive benchmarks set by the parents. As stated above, the parental judgements of children’s current language skills are calculated from nine questions (see the Appendix) regarding the parent’s and the child’s satisfaction with the communicative skills, and with regard to whether the child is able to hold a conversation in each language. These are context-dependent questions, and the answers may rest upon parental language ideologies, affected by political, cultural and economic factors (Curdt-Christiansen, 2009). It is worth noting that the UK fathers had more education than those in Norway and tended to hold jobs where their education was relevant, a difference that could impact their own language practices as well as the benchmarks set within the families.
Alternatively, CLT may fail to reveal differences in language performance that the parents are sensitive to. Whereas CLT only measures lexical skills, using nouns and verbs that tend to be acquired early in life (Łuniewska et al., 2016), parents may tap into observations of their children’s morphological, pragmatic or interactional skills. If we rely on the parental judgements, the UK group is more balanced between their languages than the Norwegian group. Although all the children (in both groups) used Polish more than the majority language at home, they used the majority language more than other family members did when conversing. Thus, the participants could be on their way towards a language shift from the minority to the majority language, with the UK children further along the path than their peers in Norway. Alternatively, they may maintain their home language alongside the majority language, but these speculations could only be checked in a longitudinal study.
According to the results from the questionnaire, there were no significant group differences in the families’ language practices. However, the parents in the UK were reportedly significantly more proficient in English than the parents in Norway were in Norwegian. This difference is unsurprising, as English is a global language taught in Polish schools, while few learn Norwegian before moving to Norway. Nevertheless, it means that the participants in Norway would need Polish to communicate with their parents, whereas intergenerational communication does not stand in the way of a language shift for most of their UK peers. Importantly, although proficiency in the majority language may generally be linked to success and privileges (Lane, 2010), Norwegian does not share the global status of English, which may be viewed by the parents as ‘an international super language through which a great many social and economic goals can be achieved’ (Curdt-Christiansen, 2009, p. 363).
Differences in the education systems may contribute to an earlier language shift within the UK group. The British group were slightly older than the Norwegian group and compulsory education starts one year earlier in the UK. Thus, most of the British participants attended school when they took part in the study, whereas the children in Norway attended full-time formal childcare. That is, both groups spent their days in an institution where the majority language was the primary language, but possibly with more emphasis on majority language teaching in the case of the UK participants.
Limitations and future directions
The current study is limited by the available data, and first and foremost by the number of participants. Recruiting participants proved to be more difficult than foreseen, even with the multitude of channels used to reach Polish families in the two countries (see the Methods section, and Haman et al., 2014). The limited number of participants calls for caution regarding statistical methods; the questionnaire offers information on a variety of factors that may affect children’s performance on a lexical test or parental judgements of their children’s language skills, but to compare the potential effects of these factors, more data are needed. One possible direction for future studies would be to include data from other groups of bi- and multilinguals; this could, in addition, shed further light on the comparability of the two tools, and aid the establishment of valid multilingual norms.
A caveat to this study is that with two incongruent measures of language skills, we cannot fully determine which of the tools to trust. A third tool could tip the scale. Other teams have combined the tools used here with other tools from the LITMUS battery (Armon-Lotem et al., 2015), and further investigations could resolve whether we should trust the CLT results, indicating that the UK group’s Polish skills surpass their English skills, or rather rely on the parental judgements, indicating a balance between the languages. It is possible that the discrepancies observed here are related to age, and that the two measures are more concordant at earlier stages. To investigate this possibility, data from a wider age range, in particular from children below age 4, are needed.
Finally, comparisons between parental ratings of children’s performance and scores from a structured task may involve an inherent bias since these measures are prone to fundamentally different factors. To exemplify, subjective parental perceptions may be influenced by personal beliefs about parenting (and educating children), while scores on a structured task may be affected by the child’s shyness. In terms of statistical methodologies, differences in the scales’ ranges could also make parental ratings less sensitive (a scale from 0 to 27) than CLT scores (a scale from 0 to 128). These issues call for further studies involving younger children, larger samples, other cultural contexts and fine-tuned statistical methods.
Conclusion
This paper has documented an overall correlation between parental judgements, measured by the Polish pilot version (Kuś et al., 2012) of the background questionnaire PaBiQ (COST Action IS0804, 2011; Tuller, 2015) and direct measures of Polish-English and Polish-Norwegian children’s lexical skills, measured by CLT (Haman et al., 2015). There was also a significant correlation within the majority language both within and across language communities. However, within Polish, the parental judgements and CLT results did not correlate, and there was an incongruity between the groups: the CLT results from both the minority and the majority language were comparable across the two countries, but the parents residing in the UK judged their children as less proficient in Polish than the parents in Norway did.
The reason for this incongruity could be that the two groups of parents set different benchmarks for their children’s minority language skills. However, it is also possible that the UK children are shifting towards the majority language, mediated by the status of the language and the high proficiency among their parents, whereas their peers in Norway, whose parents speak little Norwegian, have (at least so far) maintained their minority language. As CLT was created to aid the identification of language impairment in multilinguals, and the target words denote concrete objects and actions that presumably are quite frequent in children’s lives, the tool may not be sensitive enough to uncover early stages of language attrition. Importantly, to evaluate the possible accounts discussed above, there is need for further research systematically comparing immigrant children from different language backgrounds over time.
Footnotes
Appendix
The section on current skills from the Polish pilot version (Kuś et al., 2012) of the background questionnaire PaBiQ (COST Action IS0804, 2011; Tuller, 2015), with its English equivalents.

| Czy myśli Pani/Pan, że dziecko mówi tak jak rówieśnicy, którzy znają tylko język…? 0 = zdecydowanie gorzej; 1 = trochę gorzej 2 = bardzo podobnie; 3 = lepiej niż inne dzieci |
Compared to other children of the same age who speak only … (language), how do you think your child speaks the language? 0 = significantly worse; 1 = a bit worse; 2 = very similar; 3 = better than other children |
| Jak Pani/Pana zdaniem dziecko wymawia słowa w danym języku w porównaniu z innym dziećmi w tym samym wieku? 0 = zdecydowanie gorzej; 1 = trochę gorzej 2 = bardzo podobnie; 3 = lepiej niż inne dzieci |
Compared to other children the same age, how do you think your child pronounces words in the given language? 0 = significantly worse; 1 = a bit worse; 2 = very similar; 3 = better than other children |
| Ile Pani/Pana dziecko zna słów w danym języku w porównaniu z innymi dziećmi w tym samym wieku? 0 = zdecydowanie mniej; 1 =trochę mniej 2= tyle samo; 3= więcej niż inne dzieci |
Compared to other children the same age, how many words does your child know in the given language? 0 = significantly fewer; 1 = a bit fewer; 2 = as many as them; 3 = more than other children |
| Czy Pani/Pana rodzinie i przyjaciołom łatwo prowadzić rozmowę z dzieckiem w danym języku? Czy zawsze? 0 = bardzo trudno; 1 = czasem są z tym problemy 2 = zazwyczaj łatwo/łatwo 3 =bardzo łatwo/nie ma problemów |
Is it easy for your family and friends to have a conversation with your child in the given language? Always? 0 = very difficult; 1 = sometimes we experience difficulties; 2 = generally easy/easy; 3 = very easy/no difficulties |
| Czy w porównaniu z innymi dziećmi w tym samym wieku Pani/Pana dziecko radzi sobie z tworzeniem poprawnych zdań? 0 = zdecydowanie gorzej; 1 = trochę gorzej 2 = bardzo podobnie: 3 = lepiej niż inne dzieci |
Compared to other children the same age, do you think your child has difficulties making correct sentences? 0 = significantly worse; 1 = a bit worse; 2 = very similar; 3 = better than other children |
| Czy jest Pani/Pan zawsze zadowolona/zadowolony z tego, jak dziecko rozumie zdania, które wypowiadają do niego inne osoby w danym języku? 0 = zupełnie niezadowolona/niezadowolona 1 = nie całkiem zadowolona/zadowolony 2 = raczej zadowolona/zadowolony 3 = całkowicie zadowolona/zadowolony |
Are you always satisfied with your child’s ability to understand sentences spoken to him/her by other speakers of this language? 0 = not at all satisfied; 1 = not very satisfied; 2 = pretty satisfied/generally satisfied; 3 = very/completely satisfied |
| Czy jest Pani/Pan zadowolona/zadowolony z umiejętności mówienia dziecka w danym języku? 0 = zupełnie niezadowolona/zadowolony 1 = nie całkiem zadowolona/zadowolony 2 = raczej zadowolona/zadowolony 3 = całkowicie zadowolona/zadowolony |
Are you satisfied with your child’s ability to speak the given language? 0 = not at all satisfied; 1 = not very satisfied; 2 = pretty satisfied/generally satisfied; 3 = very/completely satisfied |
| Czy dziecko denerwuje się, że nie umie się porozumieć w danym języku? 0 = bardzo /prawie zawsze; 1 = często 2 = czasami; 3 = prawie nigdy |
Does your child feel frustrated that he/she can’t communicate in the given language? 0 = very/almost always frustrated; 1 = often frustrated; 2 = sometimes; 3 = (almost) never frustrated |
Acknowledgements
We wish to thank all the participants, their parents and day-care centre employees for taking part in the study. We are grateful to Elisabeth Holm, Katarzyna Chyl, Małgorzata M Haman and Ingeborg Ribu for collecting and coding parts of the data, and to Ewa Wapinska and Emilia Dymarczyk for aiding the collection of Polish data in Norway. We would also like to thank members of COST Action IS0804 for discussions on the development of CLT and preliminary results from this study, and Pia Lane and Bente Ailin Svendsen for helpful comments on the manuscript.
Declaration of conflicting interests
The author(s) declared no potential conflicts of interest with respect to the research, authorship, and/or publication of this article.
Funding
The author(s) disclosed receipt of the following financial support for the research, authorship, and/or publication of this article: This study was partially supported by the following institutions: the National Science Centre (Poland; grant no. 809/N-COST/2010/0; project Bi-SLI-PL); the Polish Ministry of Science and Higher Education (contract no. 0046/DIA/2013/42); the Faculty of Psychology University of Warsaw (internal grants BST 1744/4, 1712/18, 177750 and 0181400-26); the Foundation of Polish Science (grant to Zofia Wodniecka); the Council of Norway through its Centres of Excellence funding scheme (project number 223265); and the European Cooperation in Science and Technology (COST) through its funding of Short-Term Scientific Missions (ECOST-STSM-IS0804-121112-023461).