



Abstract
Research questions:
Polinsky argues that speech rate in heritage languages is highly correlated with proficiency level. In sociolinguistics studies, speech rate in monolingual speakers is found to be conditioned by social factors. What occurs when both proficiency and social factors vary? Is speech rate a valid measure of proficiency?
Methodology:
We use two automated methods of measuring articulation rate (syllables per second), cross-referenced to improve accuracy: an orthographic vowel count and an acoustic measure of amplitude changes from syllable nucleus to periphery.
Data and analysis:
Across 51 speakers, each recorded in an hour-long conversation in Heritage Italian, Russian, Ukrainian, or Homeland Italian, we calculate speech rate in more than 10,000 clauses.
Findings:
Linear regression analyses reveal that articulation rate correlates with generation (since immigration) and age, but, surprisingly, not with ethnic orientation, sex or language. Age and generation are partly collinear in our sample, and models with generation fit better than those with age. We also find that articulation rate does not predict performance on sociolinguistic variables (voice onset time for stops, subject pronoun presence) in heritage varieties.
Originality:
This study compares two ways of calculating articulation rate automatically, examining whether speech rate is a viable stand-in for proficiency when social factors and proficiency vary independently. We resolve several obstacles to using articulation rate as a stand-in for more labor-intensive proficiency measures in spontaneous speech data.
Implications:
These findings suggest that speech rate is a valid proxy for heritage language proficiency. The factor with the strongest effect is generation since immigration (indicating the dominant language in the speaker’s childhood community). The effects of the social factors are complex but must be considered in order to interpret the proficiency measure accurately.
Introduction
Linguistic proficiency is understood to reflect the amount and type of input received, so valid and efficient measures of proficiency are essential in heritage language studies. For heritage languages, Polinsky (2008, 2012) observes that speech rate might well be “one of the most sensitive measures reflecting the level of proficiency” (2008, p. 54; see also de Jong & Wempe, 2009, p. 385; Kagan & Friedman, 2003). 1 Polinsky (2008, p. 53) shows that heritage speakers of Russian who have the full system of three genders speak their heritage language (HL) nearly as quickly as monolingual Russian speakers; however, heritage speakers whose gender system is simplified to a binary contrast speak Russian more slowly. More generally, Aalberse et al. (2019, p. 187) note that “HL-speakers tend to speak more slowly than non-HL speakers.” Irizari van Suchtelen (2016, pp. 116–118) found that speech rate differences between directly adjacent generational groups of heritage Spanish speakers in the Netherlands are not significant, but that homeland speakers do speak significantly more quickly than second generation speakers. Polinsky (2012) notes that there are several advantages of using speech rate as a proxy for proficiency: it “does not rely on literacy skills” (p. 106) and is “a very simple measure” (ibid.). However, she notes that it is a measure that requires further empirical investigation and verification, which we offer here.
The development of such a measure is necessary for reliably comparing proficiency in varieties where the norms of the “homeland” or “hearth” variety may not be appropriate benchmarks, that is, when a heritage variety is en route to endonormativity (Schneider, 2008), as has been shown for some heritage varieties (Nagy, 2016). While fluency “constitutes an essential criterion in assessing L2 performance and proficiency” (Kahng, 2014, p. 810), measuring proficiency in a heritage language is a thorny issue, for two related reasons. First, the grammars of heritage languages have not been described thoroughly enough to allow for the sort of proficiency testing that is based on linguistic (grammatical or lexical) knowledge that is available for standardized languages. Second, like all languages, heritage languages evolve over time, perhaps even faster than standardized varieties as a result of intense contact with the community’s dominant language. Thus, any test of linguistic knowledge of a heritage language risks actually testing knowledge of a related standardized language or a potentially outdated version of the heritage variety. Vocabulary size or richness (as measured by counting unique words in an excerpt of elicited or spontaneous speech) has been proposed as a measure of proficiency that circumvents the problem of standardization. However, cross-linguistic comparisons of this measure are difficult, as noted by Tidball and Treffers-Daller (2007), because of typological differences. Additionally, type-token ratios decline with the length of the text (Richards, 1987, p. 204), which necessitates, for spontaneous speech, calculations of the ideal length of text to examine. Furthermore, de Jong and Bosker (2013, p. 19) do not report particularly strong correlations between vocabulary size and their proficiency measures (which have to do with pauses). Our goal, in this chapter, is to understand the range of variation in speech rate in spontaneous speech across multiple generations of heritage language speakers in order to assess whether speech rate acts in ways consistent with a proficiency measure, as a first step toward evaluating the claims of Polinsky (2008). As Kahng (2014, p. 837) notes, L1 and L2 speakers’ fluency differs. Heritage language speakers are neither exactly like L1 nor exactly like L2 speakers, and this makes it critical to conduct research directly with this population.
Data are from the Heritage Language Variation and Change (HLVC) project in Toronto (described in Nagy, 2011). We use samples from three generations of speakers – first-generation immigrants, who speak these languages natively; second- and third-generation, that is, children and grandchildren of immigrants; and homeland speakers. Our use of “generation” is defined in Section 4.1. We consider three languages in order to ascertain whether speech rate operates comparably across languages, and we look for correlates among social factors including responses to an ethnic orientation questionnaire (EOQ). We thus lay the groundwork for future research in which speech rate may act as a proxy for proficiency and be considered as a predictor of other linguistic (e.g. phonological, morphological) patterns. If we find correlations between speech rate and linguistic (e.g. phonetic or syntactic) variation or other measures of proficiency, such as amount of pausing, it will suggest that speech rate reflects acquisition/loss/attrition differences among speakers. On the other hand, correlations between speech rate and social factors (e.g. age, sex, ethnic orientation) suggest that identity-marking is responsible for speech rate variation.
This article thus responds to Polinsky’s call for further investigation by examining the role of speech rate in several heritage languages spoken in Toronto, Canada. We begin by comparing literature on the prosodic variable speech rate as used for a proficiency measure and as a sociolinguistic variable (among monolinguals), then turn to means of measuring speech rate. We report on which factors correlate to speech rate in Toronto heritage speakers and show that, in our data, speech rate does not correlate to sociolinguistic variables expected to show effects of language contact with English.
Speech rate and L2 variation
In L2 research, speech rate has often been found to correlate with fluency or proficiency (see, e.g. Daller et al., 2011; de Jong et al., 2015; Ginther et al., 2010; Kahng, 2014; Kormos & Dénes, 2004; O’Brian et al., 2007; Riggenbach, 1991). For this reason, rate of speech is sometimes used as a proxy for these (see, e.g. Kagan & Friedman, 2003, p. 540) insofar as there may be “a higher speech rate in more advanced learners” (Daller et al., 2011, p. 218). The length and frequency of pauses may also correlate with proficiency (see Chambers, 1997; de Jong & Bosker, 2013; Ginther et al., 2010; Kahng, 2014; Wood, 2001; see also Derwing, 1990), even though that is best considered separately from articulation rate.
Age, sex, and education level “have traditionally been assumed to be relevant for investigations of language attrition” (Schmid & Dusseldorp, 2010, p. 128). As we will see, the data examined here present no evidence of attrition, so we will not discuss this concept further.
Speech rate and L1 variation
In recent years, there has been a surge of interest in speech rate as a sociolinguistic variable. Like conventional phonological and morphosyntactic variables, speech rate can vary according to a number of social and linguistic factors (Jacewicz et al., 2009, pp. 233–234). How much influence geography can have on speech rate is disputed. Some researchers find significant distinctions between dialect regions: for instance, Jacewicz et al. (2009) compared two regions of the United States; for comparisons of regions in Belgium and the Netherlands, see Verhoeven et al. (2004) and Quené (2008). However, some scholars do not find geographic distinctions (see, e.g. Hewlett & Rendall, 1998, who compared regions in Scotland). There is more agreement for other social variables, especially sex. Men tend to speak faster than women, and this appears to be a fairly robust effect in both English and Dutch: Jacewicz et al. (2009) report that their male participants in two American states speak more quickly than their female counterparts; Whiteside (1996, p. 38) finds the same for two dialects in northern England, though she cautions that her sample-size is low and her data come from a reading task. Verhoeven et al. (2004, p. 306) report that Dutch-speaking men spoke 6% faster than Dutch-speaking women; Biemans (2000, Chapter 9), manipulating Dutch speech stimuli artificially, finds a relationship between increased speech rate and perceived masculinity. Age effects on speech rate are also reported: younger adults generally speak faster than older ones (Jacewicz et al., 2009; Verhoeven et al., 2004; Yuan et al., 2006), though the reasons for this may be mostly physiological (Ramig, 1983).
The extent to which speech rate varies across languages has not been probed as much as language-internal factors; the use of data across different languages in the present study raises the question of whether a difference in average speech rate between them can be anticipated. The literature on the matter appears to engender some dispute. On one hand, Roach (1998) surveys cross-linguistic research and concludes that any discrepancies uncovered might well be attributed to social factors alone. That is, speech rate cross-linguistically might be expected to vary from a common baseline as a result of purely cultural distinctions. In opposition are Pellegrino et al. (2011), who find a negative correlation between the “information density” of the language in question and the average speech rate. This suggests that different languages might have different baseline levels in terms of average speech rate (measured in phonological units). Daller et al. (2011, p. 234) conclude their study of proficiency in L2 Turkish and L2 German by calling for subsequent investigation into “automated measures” of fluency and proficiency, preferably across a range of languages.
Methods
In addition to answering the questions raised in the preceding two sections about whether speech rate corresponds to fluency and/or to social factors such as age and sex in spontaneous heritage language speech, we are also reporting on efforts to automate as much as possible the analysis processes that can be used with spontaneous speech. This will increase the potential of analyzing large quantities of naturally occurring speech, while minimizing the loss of accuracy, in order to understand best how language functions in its natural context. We describe in this section the corpus used, several possible methods of measuring speech rate, data reduction methods to optimize outcomes, the multiple regression analysis to which we subject our measurements to determine which factors are the best predictors of speech rate, and tests of correlation with other linguistic performance. All procedures were performed in compliance with local laws and University of Toronto guidelines. The Office of Research Ethics has approved them (REB #24041).
Data
We focus on three heritage languages spoken in Toronto: Russian and Ukrainian, which are closely related to each other, and Italian, which is at a greater taxonomic distance. This allows us to see the extent to which typological differences need to be considered in developing methodology for comparing speakers’ speech rates. To control for dialectal variation, all speakers representing each language have family backgrounds from the same homeland city or region. Russian speakers (or their ancestors) come from Moscow or St. Petersburg, Ukrainians from Lviv, and Italians from Calabria.
We sample speakers across three generations. “Generation” is defined based on immigration history, not age. First generation speakers were born and raised in the homeland until at least age 18 and have subsequently spent 20 or more years in Toronto. Second generation speakers were born in Toronto, or arrived before age 6, and their parents qualify as first generation. Third generation speakers are those whose parents qualify as second generation. In each generation, we sample across age groups as much as possible. In the data examined here, we have speakers in all three generations between the ages of 45 and 50. Our analysis (presented below) shows that the model including
We also compare a sample of homeland speakers from Calabria. This allows us to distinguish effects of limited input on speech rate from other sources of HL variation, as these Homeland speakers and our Generation 1 all grew up in Calabria. As shown in Table 1, we have between 7 and 19 speakers representing each generation, for a total of 51 speakers. This includes 12 Heritage Italian, 12 Russian, and 16 Ukrainian speakers, as well as 11 Homeland Italian speakers. This sample also allows us to test our methods on non-heritage (monolingual) speakers; among them proficiency is constant, so we expect any observed variation to be accounted for by social factors rather than proficiency or quantity/quality of input.
Speaker sample.
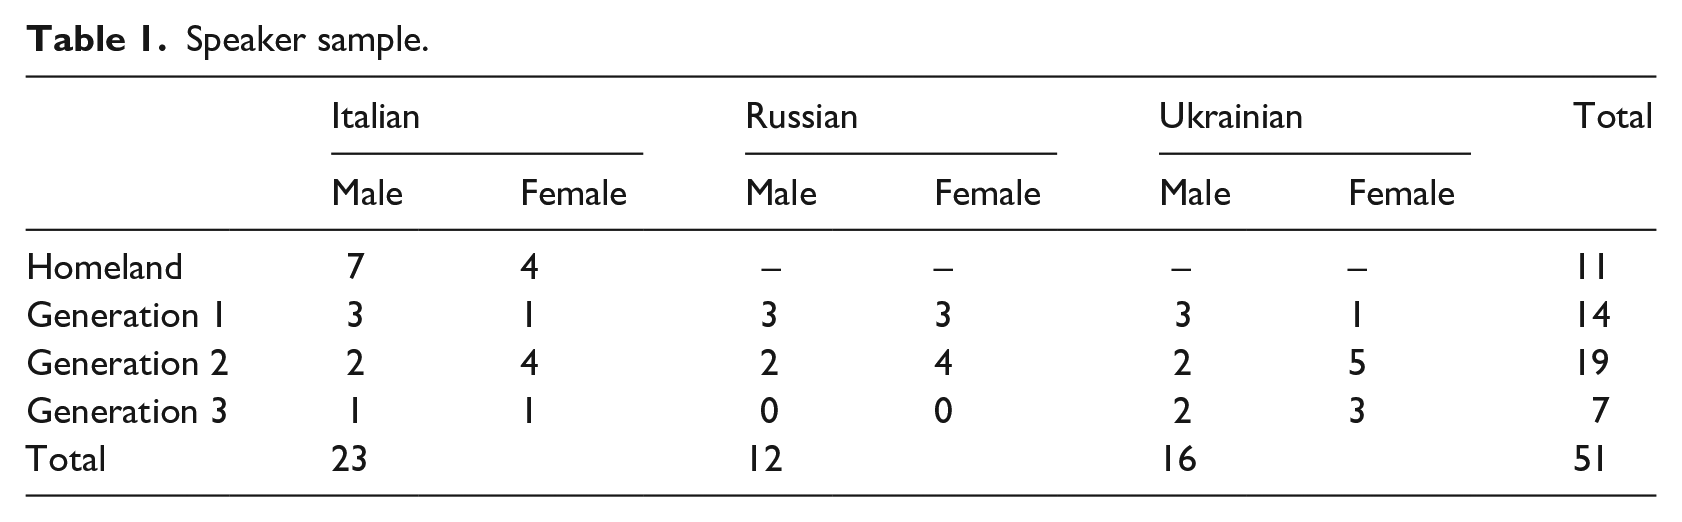
Our spontaneous conversational speech data are from a corpus of sociolinguistic interviews (for details on data collection methods, see Labov, 1984), each about one hour in length, conducted in speakers’ heritage languages. In addition to conversing on various topics of personal interest for approximately an hour, speakers were asked the items in the EOQ. Their oral responses were later coded on a three-point scale to allow for quantitative comparison. For each scale, we assign 0 points to speakers whose answer is oriented toward English use/preference (with various questions exploring various contexts), 2 points to speakers whose answers reflect an orientation toward their heritage language most/all the time, and 1 point for mixed answers. The questionnaire is posted at http://projects.chass.utoronto.ca/ngn/pdf/HLVC/short_questionnaire_English.pdf, and additional methodological details are available in Nagy (2011). Data from all speakers in the corpus whose transcriptions are complete and who responded to the EOQ are included. 2 The speaker sample for this study is shown in Table 1, and individual median speech rate and EOQ scores are in Appendix A.
We looked for effects of ethnic orientation (EO) on speech rate along two paths, considering both the mean score of all 37 questions and the scores related to the subgroup of questions about language use. First, we looked for significant correlations between speech rate and EOQ scores, and then looked for individual predictive effects of EOQ scores in multiple regression analysis. For the latter process, we first identified subsets of EOQ scores that correlated with each other. Only two pairs were too strongly and significantly correlated to run in the same model at once:
Measuring speech rate
There is little consensus on how speech rate is best calculated (Roach, 1998, pp. 151–152; Thomas, 2011, p. 188), and none of the established methods is without flaws. The number of words per unit of time can be measured (Daller et al., 2011; O’Brian et al., 2007; Polinsky, 2008), which seems straightforward. However, there are several problems with this approach, especially for a study that examines more than one language. First, the very definition of “word” is contentious, at least for some languages (Haspelmath, 2011; Roach, 1998, p. 151). Second, average word-length varies across languages. Third, depending on the properties of the language(s) under study, orthographic word-length may not provide a good indication of spoken duration.
Measuring the number of syllables per unit of time is “likely to be a much more reliable way of comparing different languages” when it comes to speech rate (Roach, 1998, p. 152), and this method is commonly used (Hewlett & Rendall 1998, p. 65; Kahng, 2014; Verhoeven et al., 2004). Again, though, there are cross-linguistic differences, this time in syllable structure. If speech rate is measured according to syllables per second, languages with relatively long or numerous consonant clusters will register as slower than languages with preferences for strict consonant-vowel (CV) syllable templates. De Jong et al. (2015) also make this point, specifically about comparing English and Turkish. A third option is to measure the number of phonemes per second; however, this is cumbersome and time-consuming, especially with large amounts of spontaneous speech data.
We measure speech rate in syllables per second. We use two automated methods to identify the number of vowels per second, using each to check the other. Because neither method is foolproof on its own (as discussed in section Stringency criteria), we use the measurements only from cases where the two methods produce comparable results. The first method counts the number of orthographic vowels in the transcript. The second method counts amplitude peaks that mark syllable nuclei in the acoustic signal.
Segmenting the sound files and running the vowel-counting script
The spontaneous speech from sociolinguistic interviews had been previously transcribed by native speakers of each language, using ELAN (Brugman & Russel, 2004) to create annotation segments that are time-aligned to the audio recording (.wav file). Each participant in the conversation is transcribed on a separate tier. 3 The three languages have all been transcribed using the Roman alphabet – Italian in its standard orthography, and Russian and Ukrainian using Comrie and Corbett’s (2002, pp. 827, 832–833) transliteration system. Transcribers were instructed to segment the file into clauses. In as far as a clause is a recursive unit in language, transcribers varied to some extent in the length and complexity of units transcribed in one annotation segment (see the range of examples in Table 2). Such units are similar to the “analysis of speech unit,” “a single speaker’s utterance consisting of an independent clause, or a subclausal unit, together with any subordinate clause(s) associated with either,” used in de Jong et al. (2015, p. 229). For ease of explication, we refer to these annotation segments as clauses.
Excerpt of output from syllable-counting script, comparing the two methods of counting syllables per second.
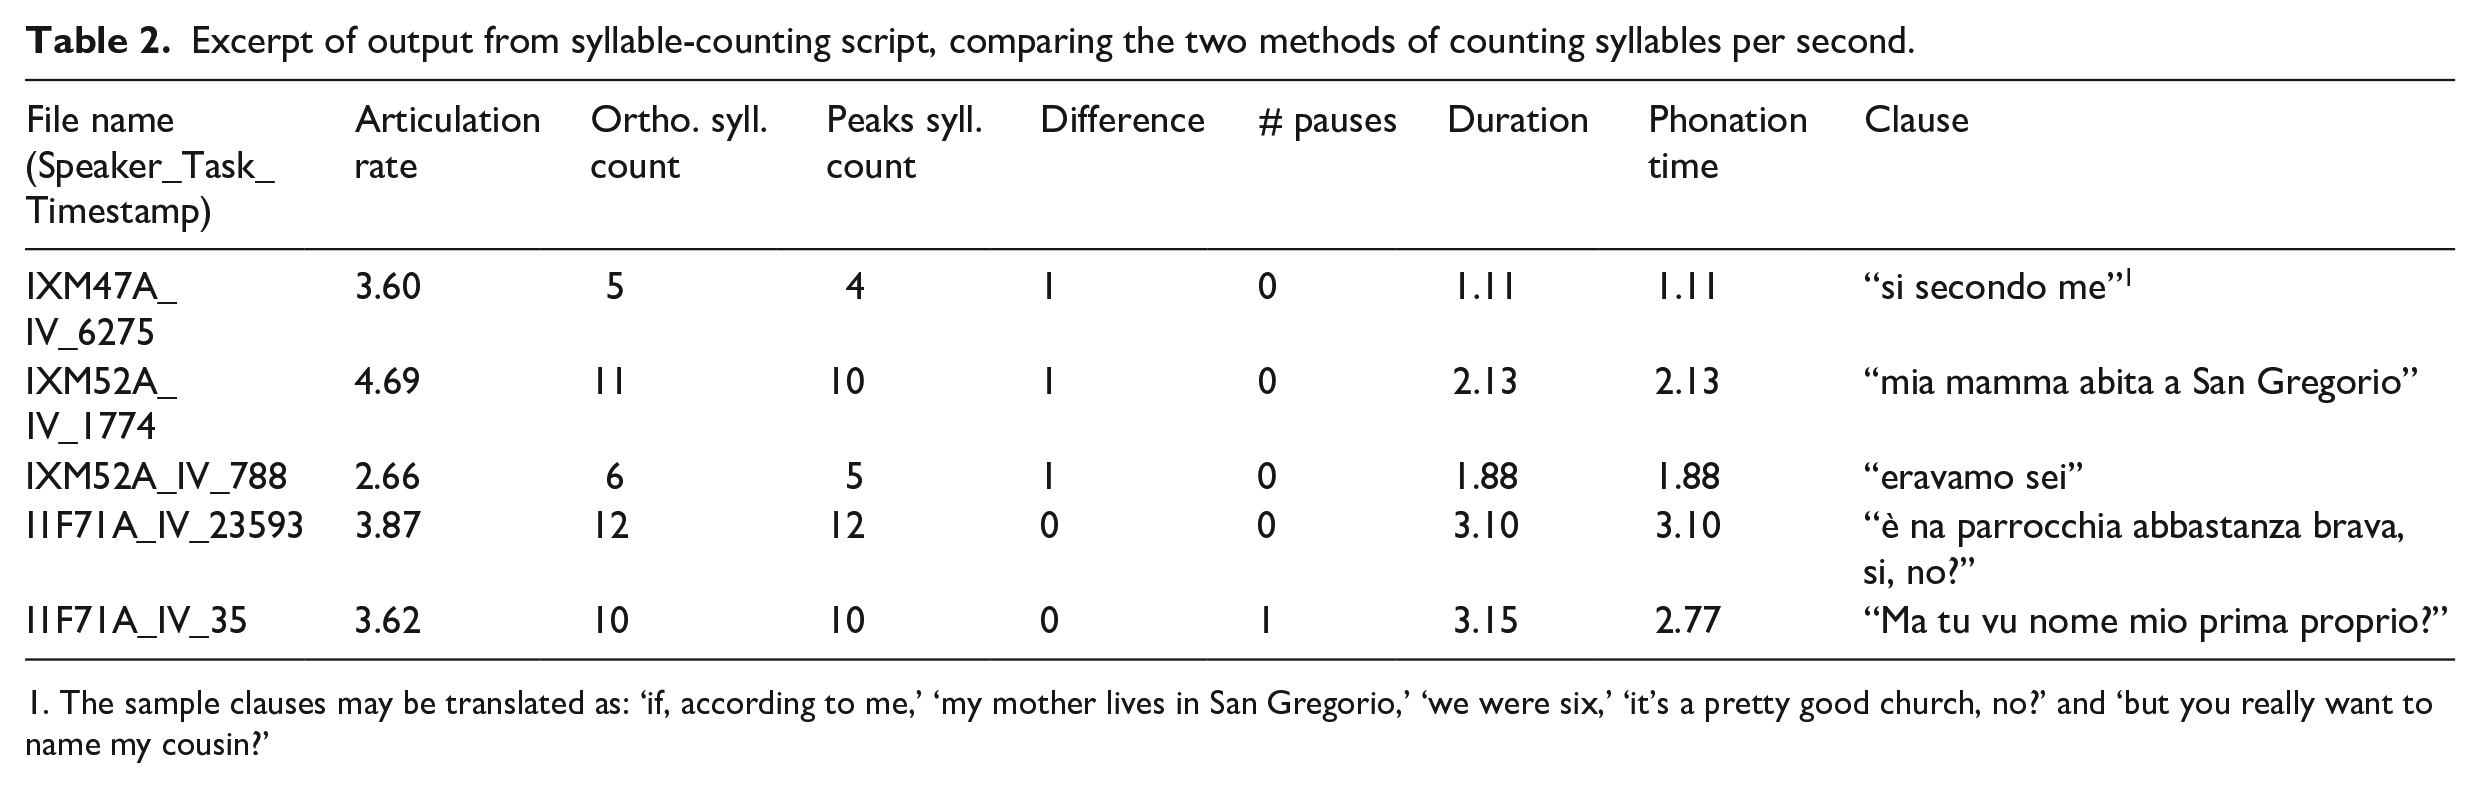
The sample clauses may be translated as: ‘if, according to me,’ ‘my mother lives in San Gregorio,’ ‘we were six,’ ‘it’s a pretty good church, no?’ and ‘but you really want to name my cousin?’
Because this long-running project is dependent on (often short-term) student labor, these transcripts were produced by 23 different transcribers who edited each other’s work. It is not possible to produce useful measures of inter-transcriber reliability because in one case (Russian), the vast majority of the transcripts were produced by one transcriber while in the others, six or seven transcribers worked together in various combinations. Corrections for comparability were made in the editing stage.
To prepare the time-aligned transcription and audio files for processing, we used Lennes’s (2002) script in Praat (Boersma & Weenink, 2015) to split both the audio .wav files and the transcription Praat TextGrid files (exported from ELAN .eaf files) into segments corresponding to each clause. The script was adapted to label the output .txt and .wav files according to their start times in milliseconds and create small text files containing the transcriptions of each clause. 4 This yielded hundreds of short .wav and .txt files for each speaker.
The amplitude-peak counting method is based on a Praat script written by de Jong and Wempe (2009) (for discussion, see Daller et al., 2011; de Jong & Wempe, 2009), modified by Hugo Quené et al. (2010), and then further modified by Maksym Shkvorets to implement the orthographic vowel-counting method. The de Jong and Wempe (2009) script creates a number of numerical measures of speech rate. We use “articulation rate,” which excludes silent portions in the recording when calculating rate (see, e.g. Daller et al., 2011, p. 219). Pauses might reflect planning as well as sociolinguistic variability (Thomas, 2011, p. 188); in fact, the use of pauses and hesitancy can be fairly idiosyncratic (Jacewicz et al., 2009, p. 235). Pauses (defined as silences of > 0.3 seconds) are thus excluded from the duration measured to calculate speech rate (articulation rate) here. This 0.3 second threshold is an intermediary value of the range of thresholds used in previous research: 0.2 s (Daller et al., 2011) to 0.4 s (O’Brian et al., 2007). It falls in the range that produces the strongest correlations between speech rate and vocabulary size in a study by de Jong and Bosker (2013). That article provides additional support for using such a threshold.
This method produces an output file that contains 10,832 clauses. For each, the outcome of two methods of counting syllables, duration of the clause, number of pauses, duration of the clause and phonation time of the clause (the duration including pauses), a time-marker corresponding to the original ELAN .eaf file, and a speaker identifier are provided. See the (simplified) sample output in Table 2.
We treat each clause as a single token of the dependent variable speech rate and subject the set to multiple regression analysis. “Clauses,” as noted above, are defined by the annotation units created by the transcriber. See examples in Table 2. Each clause is treated as an individual token, both for the process of pruning the data and in the multiple regression analysis. Given the limitations of using natural speech data from a corpus of sociolinguistic interviews rather than lab-collected samples, we are unable to control more stringently for length; this is a necessary sacrifice associated with conversational speech data. However, since no individual utterance is smaller than a full clause, differences across utterances in terms of the weight assigned to the syllables in an utterance are small.
From this data set, we aimed simultaneously to maximize the usable data and minimize the number of erroneous measurements produced by our automated measurement techniques. We therefore systematically excluded several types of clauses, as follows.
Turn-length strongly affects speech rate (cf. Quené, 2008, p. 1104; Thomas, 2011, p. 188). The ending of a turn or utterance tends to be prolonged relative to the rest, which means that a shorter utterance (i.e. one where the ending represents a greater proportion) will exhibit a lower speech rate. We therefore omit short clauses (defined in section Stringency criteria). We manually excluded clauses containing English words as we are interested in the rate of speaking the heritage language, rather than English. Excluding all clauses containing words with English phonology means that all code-switches, and likely some borrowings, are excluded.
Stringency criteria
As noted above, we also needed to exclude clauses for which the acoustic and orthographic vowel counts disagreed sharply. The orthographic method picks up vowels from text in the annotations that is not transcribed speech, such as “(laugh)”, “[interruption]” or other transcriber comments. Orthography also misrepresents phonology in several ways. For example, <e> the letters and sometimes signifies specific pronunciations of a preceding <c> or <g> and other times correspond to vowel phonemes. Syllables that contain diphthongs will be miscounted as two syllables. To mitigate the latter, our script counted as only one syllable the following sequences in Italian: <ia>, <ie>, <io>, <iu>, <uo>, <ua>, <ue>. This, overall, should be more accurate than counting each of these sequences as two syllables, although they do sometimes represent that in Italian (cf. g
As for the acoustic method, it is subject to errors relating to background noise. The script will be thrown off by other participants’ speech occurring during an annotation segment for the main speaker, 5 by someone bumping the microphone, or by someone setting a coffee cup down on the table. All of these cause errors because their larger amplitude causes the script to ignore the subtler amplitude differences that actually reflect individual syllables produced by the speaker. Short, unstressed syllables may be missed in any case because they have relatively small changes in amplitude (de Jong & Wempe, 2009, p. 388). Syllables that are lost to complete phonetic reduction (see, e.g. Ernestus & Warner, 2011) will also not be picked up by the acoustic method of measuring syllables per second. While this might seem counterproductive, our goal is to measure clauses that are fully articulated and examine the variation in how quickly they are spoken. If anything, phonetic reduction is conflated with faster speech rates; disregarding tokens for which the acoustic vowel count does not agree with the orthographic count will control for this and enable us to be confident that what we are measuring is indeed speech rate variation, rather than differing degrees of phonetic reduction on top of that. Whether there are effects of generation, sex, and the like on phonetic reduction is a separate question, and one that we leave to future research.
In both directions, then, excluding the cases of disparity between the acoustic and orthographic counts served as a filter against problems with each method. Thus, we need to determine two thresholds: (1) how long the clauses should be in order to provide reliable measurements of speech rate; and (2) how much discrepancy between our two measurements is tolerable. The histograms in Figure 1 represent the distribution of the difference between the orthographic vowel count and the acoustic count (orthographic minus acoustic) for our full data sample (10,832 clauses). We see that there are quite a few tokens with discrepancies between the two measures of up to 10 syllables. For each language the data distribution is centered close to zero but with a slight positive bias. This reflects the tendency for the orthographic script to find more vowels than the acoustic one did (in any given clause).
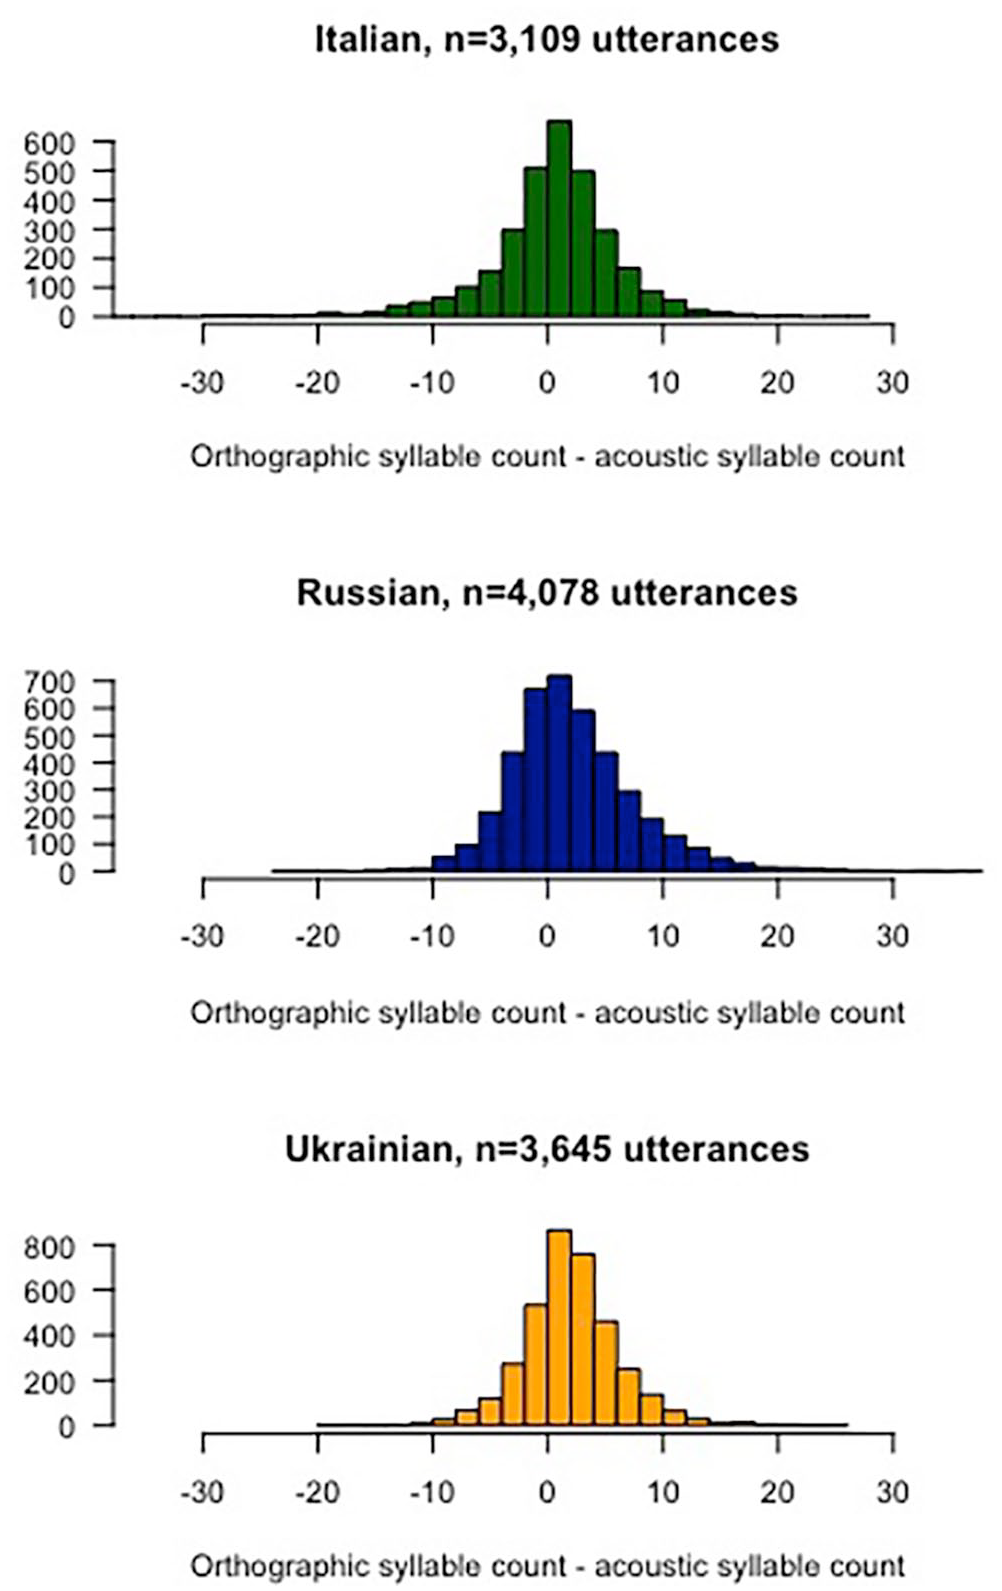
Histogram of differences between orthographic vowels and acoustic vowels found by the two methods.
We first consider the issue of minimal allowable clause length. As utterance-final lengthening causes more distortion in shorter clauses, we investigated the trade-off in amount of data available for analysis versus changes in speaker-rate rankings with three thresholds related to clause length. If we were to retain only very long clauses, where clause-final lengthening would have minimal effect, we would be working with less data. On the other hand, if we include the shorter clauses also, those will contain syllables disproportionately affected by clause-final lengthening (Quené, 2008, p. 1104; Thomas, 2011, p. 188). We compared rankings based on all clauses versus when we excluded only the clauses with fewer than five syllables versus when we excluded only those with fewer than ten syllables, using Pearson’s r. The correlations were stronger in the case of the former (as a comparison between the top and bottom values in Table 3 indicates). This is because fewer exclusions mean larger data sets, which support statistical comparison more robustly. This comparison indicates that we optimize our results by retaining all clauses with five or more syllables. In order to be retained, a clause needed to have at least five syllables according to each of the two counting methods. Worthy of note is that most of the clauses in the study were longer than five syllables to begin with; excluding the short clauses cut only 533 of the original 10,832 clauses. This approach maximizes the amount of data included in our analysis while minimizing the number of clauses that may be too short to represent speech rate reliably (in that they rank the speakers differently compared to when all available data are used).
Comparison of speaker rankings by articulation rate with different thresholds for data pruning (values are Pearson’s r for each measure compared to the ranking resulting from using only data where both measures produce the identical count, p<0.00001 in all comparisons).
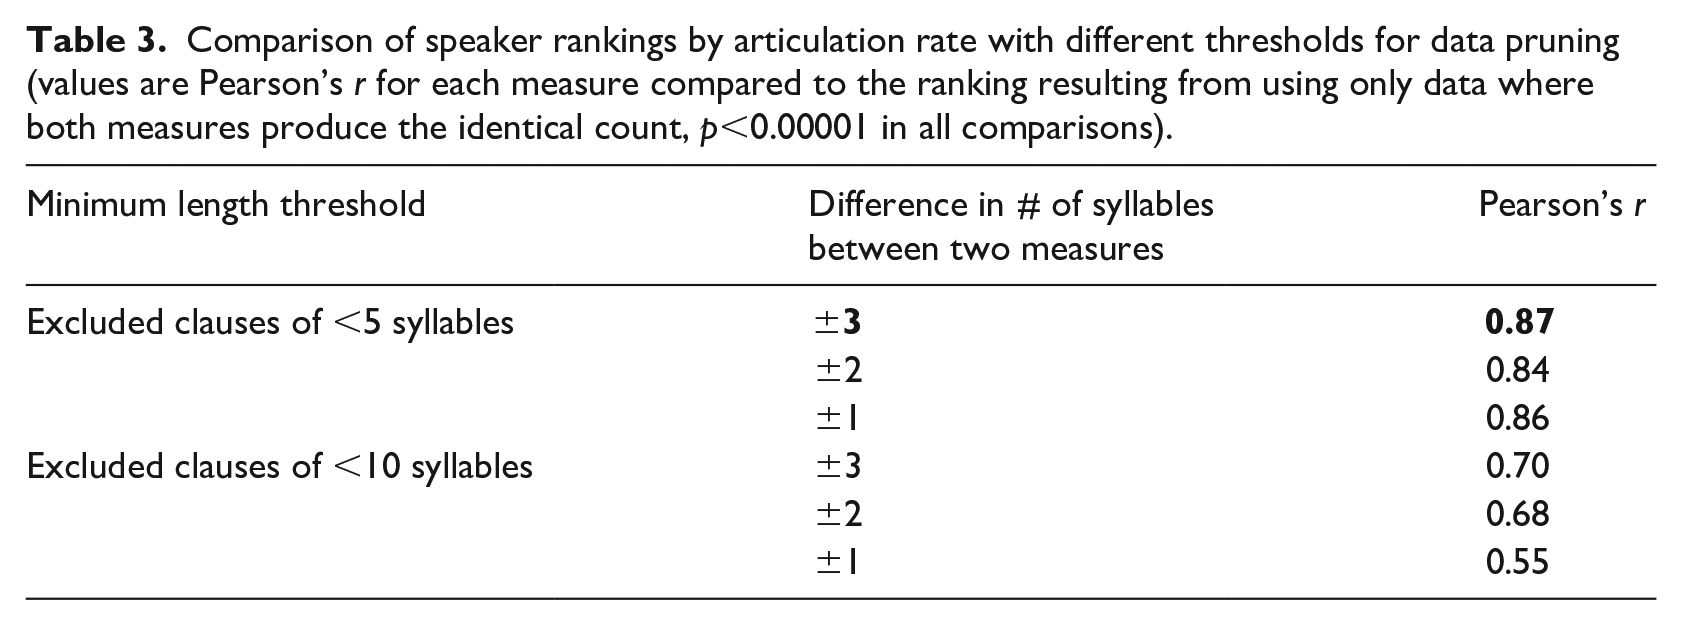
Next, we consider the issue of maximal allowable discrepancy in syllable count between the acoustic and orthographic methods. We tested four levels of stringency by comparing a difference of 0 between the two measurement methods for each token (our baseline) to differences of ±1 syllable, ±2 syllables, and ±3 syllables. For this purpose, we ranked the speakers according to median articulation rate. We then calculated Pearson correlations of the ranking of speakers’ median speech rates between the exact match data set (clauses with no difference in the counts produced by the two methods) and the other three less stringently selected data sets. This allows us to see where a change in methodology results in a re-ranking of speakers according to median articulation rate. Table 3 shows the (strong and significant) correlation of speaker rankings by each stringency level to their ranking when we use only our most exacting criteria (that is, the two methods produce exactly the same number of syllables/clause). Using the median rate for each speaker minimizes the effect of outliers caused by errors in the measurement method as well as aberrant behavior in production.
The best correlation is with exclusion of all clauses where the difference in the outcomes of the two measures is greater than three. Therefore, we include all clauses where the difference in the number of syllables counted by the two methods was three or less, and the clause contained more than five syllables, maximizing the number of clauses available to analyze. The reduction in data produced by these comparisons is shown in Table 4. Other methods of excluding less-than-ideal clauses are possible, but the critical issue of determining what is “too much difference” between methods will remain. We have addressed it by considering the effect of the different measures on the ranking of the speakers by articulation rate.
Number of tokens (clauses) produced and used per language (⩾ 5 syllables, ⩽ 3 syllables difference in counts produced by the two methods).

After the exclusions described in the previous section, our data collection yielded 5,631 tokens across three languages and four generations (including the homeland speakers of Italian as a separate “generation” group; see Table 4). The speakers vary according to language, generation, age, and sex, as well as their responses to the EOQ regarding their language use, attitudes, and cultural practices. The sample is not balanced for these factors as it was not collected in an experimental paradigm. Therefore, we analyze our data in the variationist framework, using linear regression analyses. As elegantly illustrated by Schmid and Dusseldorp (2010), only analyses that consider the effects of a wide range of factors (their “multifactorial web”) can accurately capture the contribution of each.
We used
Additionally, to address the fact that we do not have recordings in the speakers’ other language (English), we also constructed an additional mixed effects model using a data set consisting of only the Homeland and Generation 1 speakers but otherwise the same as the model in the previous paragraph. This allows us to consider the Homeland speakers as a control group.
Based on findings in the experimental literature (cf. Polinsky, 2008), we predict faster speech rates for first-generation speakers (who grew up in their homeland prior to moving to Toronto) than for second- and third-generation speakers (for whom English provided some of their input during the acquisition process as they were born in Toronto or arrived there before the age of six). We also predict more fine-grained differences if we look at specific aspects of language use and ethnic orientation that differ among speakers even within the same generation. We therefore next constructed models that included
Finally, to investigate the relationship of speech rate and structural changes in heritage varieties, we make an exploratory analysis of the relationship between
Results
The model that best fits our data shows significant main effects of clause
Mixed-effects linear regression model with
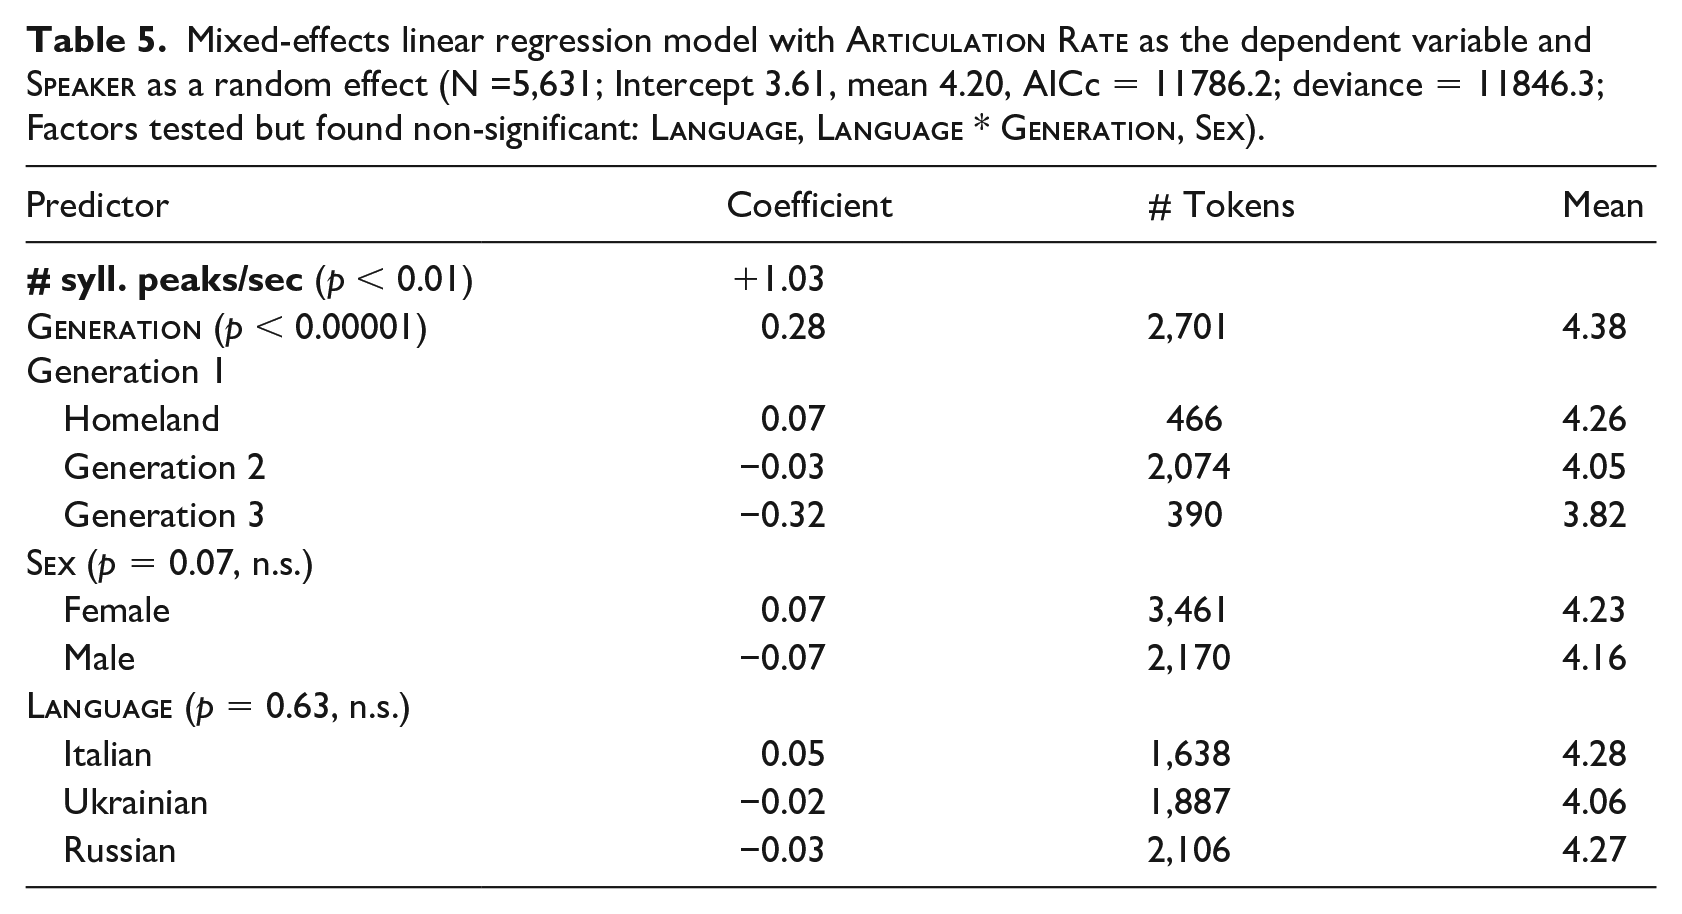
There is no effect of
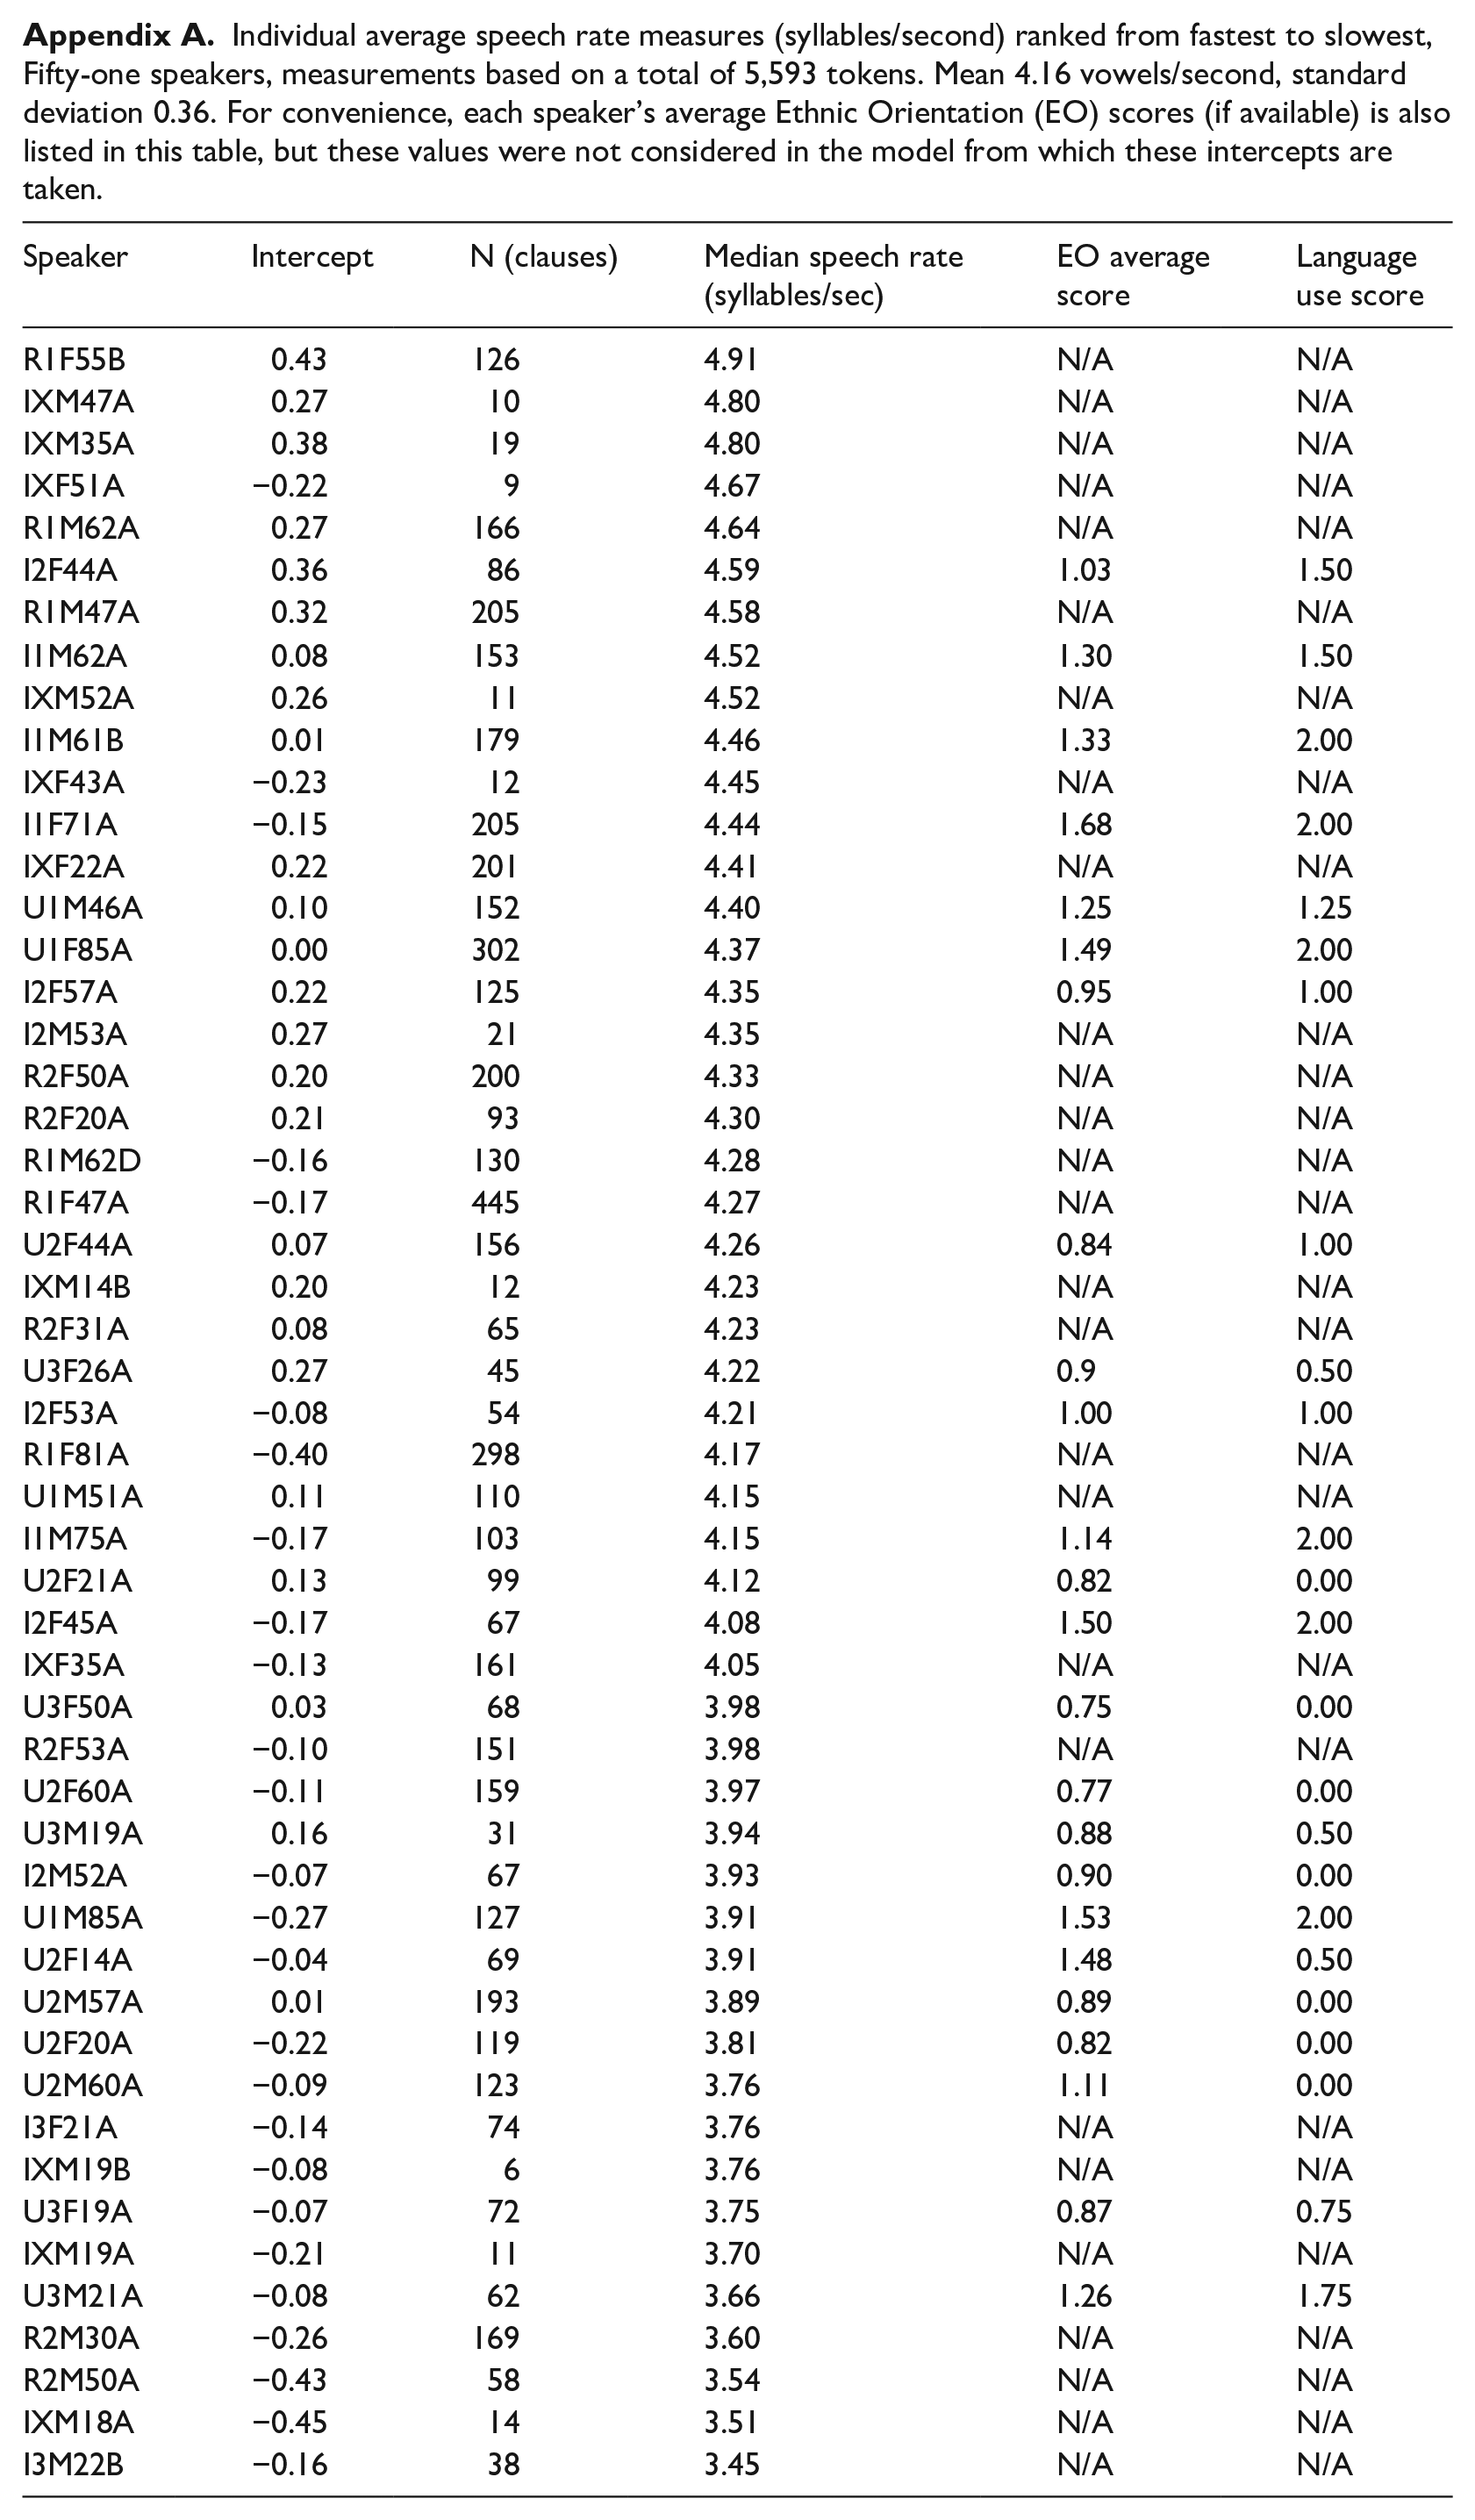
Individual variability was captured by the inclusion of
The
There was no main effect of
Next, we constructed models with overall

Mean
Finally, to compare the effects on
Discussion
Our results are thus a mixed bag, summarized in Table 6.
Predicted and observed correlates to proficiency.

Also surprising is the lack of a
But perhaps the most surprising finding, if we assume that speech rate can serve as a proxy for proficiency, is a set of subsequent results that directly contradict Polinsky’s report on the correlation between speech rate and gender marking (see Nagy, 2015, for discussion of why experimental and corpus-based heritage language data may lead to different results). Considerations of space preclude us from developing complete analyses of sociolinguistic variation in this article, but we have calculated correlations between speakers’ median speech rate and their performance with two previously examined sociolinguistic variables, voice onset time (VOT) and variable null subject presence (prodrop). These two variables are “conflicts sites” (Poplack & Meechan, 1998) in that they are areas of difference between English and the heritage languages studied here: all three have short-lag VOT for voiceless stops while English has long-lag. Similarly, all three heritage languages allow frequent null subjects (50–80% of clauses) while English has virtually categorically overt subjects. Thus, we might expect interference from English among speakers who are less fluent in their heritage language.
However, Table 7 shows the lack of significant correlation to articulation rate in all cases. Correlations of speech rate to average VOT and to percentage of finite clauses with null subjects (by speaker) are calculated as Pearson’s product-moment correlations in R. For methods of analysis for word-initial voiceless stops /p, t, k/, see Nagy and Kochetov (2013); for null subjects, see Nagy (2015). In the case of VOT, a strong negative correlation would mean that people who speak more quickly have shorter VOTs (more like homeland Italian and Russian phonetic patterns) while those who speak more slowly have longer-lag patterns indicative of English interference in production. Similarly, strong positive correlations with variable prodrop patterns would indicate that people who speak more quickly have higher or more homeland-like null subject rates, compared to those who speak more slowly and, under influence from English, produce fewer null subjects in their heritage variety. However, no p-values are significant and no correlations are strong.
Correlations (Pearson’s r) between speech rate and two sociolinguistic variables.

We find the same lack of evidence that speech rate measures proficiency when we compare the number of pauses per second to
Pearson correlations between speech rate and number of pauses (> 0.3 seconds) per second.

Conclusion
We posed and addressed the question of whether speech rate would show signs of being a stand-in for – or at least a correlate of – proficiency in three heritage languages of Toronto. We found effects of
Footnotes
Appendix
Individual average speech rate measures (syllables/second) ranked from fastest to slowest, Fifty-one speakers, measurements based on a total of 5,593 tokens. Mean 4.16 vowels/second, standard deviation 0.36. For convenience, each speaker’s average Ethnic Orientation (EO) scores (if available) is also listed in this table, but these values were not considered in the model from which these intercepts are taken.
| Speaker | Intercept | N (clauses) | Median speech rate (syllables/sec) | EO average score | Language use score |
|---|---|---|---|---|---|
| R1F55B | 0.43 | 126 | 4.91 | N/A | N/A |
| IXM47A | 0.27 | 10 | 4.80 | N/A | N/A |
| IXM35A | 0.38 | 19 | 4.80 | N/A | N/A |
| IXF51A | −0.22 | 9 | 4.67 | N/A | N/A |
| R1M62A | 0.27 | 166 | 4.64 | N/A | N/A |
| I2F44A | 0.36 | 86 | 4.59 | 1.03 | 1.50 |
| R1M47A | 0.32 | 205 | 4.58 | N/A | N/A |
| I1M62A | 0.08 | 153 | 4.52 | 1.30 | 1.50 |
| IXM52A | 0.26 | 11 | 4.52 | N/A | N/A |
| I1M61B | 0.01 | 179 | 4.46 | 1.33 | 2.00 |
| IXF43A | −0.23 | 12 | 4.45 | N/A | N/A |
| I1F71A | −0.15 | 205 | 4.44 | 1.68 | 2.00 |
| IXF22A | 0.22 | 201 | 4.41 | N/A | N/A |
| U1M46A | 0.10 | 152 | 4.40 | 1.25 | 1.25 |
| U1F85A | 0.00 | 302 | 4.37 | 1.49 | 2.00 |
| I2F57A | 0.22 | 125 | 4.35 | 0.95 | 1.00 |
| I2M53A | 0.27 | 21 | 4.35 | N/A | N/A |
| R2F50A | 0.20 | 200 | 4.33 | N/A | N/A |
| R2F20A | 0.21 | 93 | 4.30 | N/A | N/A |
| R1M62D | −0.16 | 130 | 4.28 | N/A | N/A |
| R1F47A | −0.17 | 445 | 4.27 | N/A | N/A |
| U2F44A | 0.07 | 156 | 4.26 | 0.84 | 1.00 |
| IXM14B | 0.20 | 12 | 4.23 | N/A | N/A |
| R2F31A | 0.08 | 65 | 4.23 | N/A | N/A |
| U3F26A | 0.27 | 45 | 4.22 | 0.9 | 0.50 |
| I2F53A | −0.08 | 54 | 4.21 | 1.00 | 1.00 |
| R1F81A | −0.40 | 298 | 4.17 | N/A | N/A |
| U1M51A | 0.11 | 110 | 4.15 | N/A | N/A |
| I1M75A | −0.17 | 103 | 4.15 | 1.14 | 2.00 |
| U2F21A | 0.13 | 99 | 4.12 | 0.82 | 0.00 |
| I2F45A | −0.17 | 67 | 4.08 | 1.50 | 2.00 |
| IXF35A | −0.13 | 161 | 4.05 | N/A | N/A |
| U3F50A | 0.03 | 68 | 3.98 | 0.75 | 0.00 |
| R2F53A | −0.10 | 151 | 3.98 | N/A | N/A |
| U2F60A | −0.11 | 159 | 3.97 | 0.77 | 0.00 |
| U3M19A | 0.16 | 31 | 3.94 | 0.88 | 0.50 |
| I2M52A | −0.07 | 67 | 3.93 | 0.90 | 0.00 |
| U1M85A | −0.27 | 127 | 3.91 | 1.53 | 2.00 |
| U2F14A | −0.04 | 69 | 3.91 | 1.48 | 0.50 |
| U2M57A | 0.01 | 193 | 3.89 | 0.89 | 0.00 |
| U2F20A | −0.22 | 119 | 3.81 | 0.82 | 0.00 |
| U2M60A | −0.09 | 123 | 3.76 | 1.11 | 0.00 |
| I3F21A | −0.14 | 74 | 3.76 | N/A | N/A |
| IXM19B | −0.08 | 6 | 3.76 | N/A | N/A |
| U3F19A | −0.07 | 72 | 3.75 | 0.87 | 0.75 |
| IXM19A | −0.21 | 11 | 3.70 | N/A | N/A |
| U3M21A | −0.08 | 62 | 3.66 | 1.26 | 1.75 |
| R2M30A | −0.26 | 169 | 3.60 | N/A | N/A |
| R2M50A | −0.43 | 58 | 3.54 | N/A | N/A |
| IXM18A | −0.45 | 14 | 3.51 | N/A | N/A |
| I3M22B | −0.16 | 38 | 3.45 | N/A | N/A |
Acknowledgements
We are extremely grateful to the many students and research assistants who collected, transcribed, analyzed and interpreted the data used in this study. They are listed at http://projects.chass.utoronto.ca/ngn/HLVC/3_2_active_ra.php and  . We also thank the editors and reviewers for helpful suggestions for clarifying our findings.
Declaration of conflicting interests
The author(s) declared no potential conflicts of interest with respect to the research, authorship, and/or publication of this article.
Funding
The author(s) disclosed receipt of the following financial support for the research, authorship, and/or publication of this article: This work was supported by the Social Science and Humanities Research Council of Canada [grant numbers 410-2009-2330, 435-2016-1430]; a Shevchenko Foundation Heritage Program grant and the Canadian Institute for Ukrainian Studies.
Notes
Author biography
) Project. She has published recently in Asia-Pacific Language Variation, International Journal of Bilingualism, International Journal of the Sociology of Language, Journal of Phonetics, Journal of Sociolinguistics, Language Documentation and Conservation, Language Learning, Language Variation and Change and Linguistic Approaches to Bilingualism.