
Abstract
Adding to a growing body of work on the psychology of social class, the present research examined implicit and explicit attitudes toward rich people, standing out from much previous work that has focused on negative evaluations of people with low socioeconomic status (SES). Across three studies, we found that participants (who typically identified as middle class) implicitly, but not explicitly, favored the rich over the middle class. Although financial resources represent a continuum objectively, attitudes toward the rich seem to be conceptually distinct from evaluations of low-SES people. Additionally, we demonstrated that implicit prorich attitudes uniquely predict leniency on a rich driver who causes a car accident, while explicit attitudes do not predict such judgments. This work expands and clarifies knowledge of implicit wealth attitudes and suggests that implicit prorich attitudes are an important factor in understanding how social class influences daily life.
Across cultures, societies are organized hierarchically, with some social groups having control of and access to more resources than other groups (Sidanius & Pratto, 2001). At least since the emergence of Marxism over a century ago, scholars in sociology have been interested in the phenomenon of social stratification and how social classes interact with one another in ways that maintain wealth disparities (DiMaggio, 2012; Neckerman & Torche, 2007; Wright & Perrone, 1977), often with the broader goal of understanding how to create more equal societal outcomes (Wright, 2000). More recently, social psychologists have begun to examine the individual-level impacts of wealth disparities, often focusing on how individuals experience the world differently depending on their social class status and sometimes conceptualizing social classes as subcultures (Kraus, Piff, & Keltner, 2011; Kraus & Stephens, 2012; Stephens, Markus, & Phillips, 2014). A small body of work demonstrates that people’s own socioeconomic status (SES) or their subjective sense of their own status can influence both how they view themselves and their own behaviors (Johnson, Richeson, & Finkel, 2011; Kraus, Piff, & Keltner, 2009; Spencer & Castano, 2007; Stephens, Markus, & Fryberg, 2012), and how they relate to others (Fiske & Markus, 2012; Kraus, Côté, & Keltner, 2010; Piff, Kraus, Côté, Cheng, & Keltner, 2010).
Not only do people think and behave differently depending on their own SES, but people also respond differently depending on another person’s perceived social class and have different expectations about people from various social class groups (Gilmore & Harris, 2008; Guéguen & Pichot, 2001; Shriver, Young, Hugenberg, Bernstein, & Lanter, 2008). Generally, preferential treatment is given to people with higher social class backgrounds, an effect that has been observed in many sectors of society, including education, medicine, and involvement in the criminal justice system (Freeman, 2006; Lott, 2002, 2012; Mazzella & Feingold, 1994). In experimental studies, identical behaviors elicit more positive evaluations when coming from a higher versus lower SES person (Freeman, 2006; Goodman & Gareis, 1993; Kirby, 1999; Lott & Saxon, 2002; Osborne & Rappaport, 1985; Skolnick & Shaw, 1997). For example, when Lott and Saxon (2002) asked participants to evaluate a brief biography of a woman and manipulated whether the woman was from a lower class or middle-class background, while keeping all other information the same, participants viewed the lower class character as less suitable for a leadership position and less desirable as a romantic partner than the middle-class character. Using the criminal justice system as an example of how differential treatment based on wealth occurs even when people might wish to be objective, it is said that the court system “reserves its harshest penalties for its lower-class clients and puts on kid gloves when confronted with a better class of crooks” (Reiman, 1998, quoted in Freeman, 2006, p. 2380). This description implicates two types of processes, which likely occur in a wide range of situations beyond the criminal justice system—it suggests that low-SES people are treated more harshly than most, and that high-SES people are treated more leniently than most.
Although, as suggested earlier, people tend to favor those with higher versus lower SES, less is known about the social group attitudes presumably underlying these biased judgments. For example, even questions about the basic structure of social class attitudes, such as whether class bias is best conceptualized as a single vector, always favoring those with greater wealth, or as several functionally independent evaluations of different wealth groups, have not yet been asked. Until now, researchers studying wealth bias have either conflated potentially unique processes (i.e., not distinguishing between prorich and antipoor sentiments) or have primarily focused on negative assessments of lower SES individuals, who face discrimination relative to other groups (R. M. Baron, Albright, & Malloy, 1995; Cozzarelli, Wilkinson, & Tagler, 2001; Darley & Gross, 1983; Lott & Saxon, 2002; Reutter et al., 2009; Tighe, 2012). This gap in the current literature is highlighted in the Report of the American Psychological Association Task Force on SES (American Psychological Association, Task Force on Socioeconomic Status, 2007), which states that within psychological research “there has been an almost exclusive focus on those at the very lowest level of the SES spectrum” (p. 18) and that future work should distinguish between “upward classism (i.e., bias against those perceived to be of a higher social class standing)” and “downward classism (i.e., bias against those perceived to be of a lower social class standing)” (p. 23). In contrast to the majority of work examining the psychology of social class, in the current research we examine whether attitudes toward different wealth groups are conceptually distinct from each other and we primarily focus on understanding how people view those at the top end of the wealth spectrum—namely, the rich. Notably, in our investigation of attitudes toward the upper class, we use the middle class, rather than people with low SES, as a comparison group in order to account for the possibility that evaluations of the upper class are independent of evaluations of those with low SES. Initial support for the need for independent examination comes from one study showing that people believe poverty is caused by individual attributes (e.g., poor people lack drive and perseverance) but that being rich is caused both by individual attributes (e.g., wealthy people are hard-working) as well as by situational factors (e.g., the wealthy receive favoritism in hiring, receive special treatment from the government), opening the door to the possibility that evaluations of these social groups may also occur independently (K. B. Smith & Stone, 1989).
Even though wealth is a continuum objectively, both academics and laypeople tend to carve the wealth spectrum into distinct groups and use these groups’ labels in everyday life. Because people view those with different amounts of wealth as distinct groups, we use an intergroup attitudes approach to understand how social judgments are affected by another person’s membership in a certain wealth and class category (i.e., rich, middle class, poor). Despite some variation in where people place each group’s exact boundaries, there is reasonable consensus among Americans about the meaning of “rich,” “middle-class,” and “poor,” and thus in the current research we examine evaluations of these three wealth groups using these labels (Pew Research Center, 2012b). As survey research indicates, Americans generally view the rich as having an annual household income of at least $150,000 and the middle class as having an annual household income of least $70,000, with low-SES people making less than that (median responses, Pew Research Center, 2012b). People also tend to view wealth groups as meaningful, even in childhood, and can easily list stereotypes associated with each group and assign different attributes to people from each group (del Río & Strasser, 2011; Diesendruck & haLevi, 2006; Fiske, Cuddy, Glick, & Xu, 2002; Woods, Kurtz-Costes, & Rowley, 2005).
Previous research on intergroup attitudes has fruitfully used a dual-attitudes approach, revealing that people have two types of attitudes toward social groups, an explicit (conscious) attitude and an implicit (nonconscious) attitude (Wilson, Lindsey, & Schooler, 2000). Although this perspective has not yet been applied to attitudes toward the upper class specifically, this approach has been used extensively in the study of racism, sexism, ageism, and other forms of bias (e.g., Nosek, Banaji, & Greenwald, 2002). The ideas that people verbalize and report on surveys are typically in line with their explicit attitudes; explicit attitudes are consciously expressed and controlled, and they are traditionally assessed using self-report measures (Wilson et al., 2000). Explicit attitudes are often formed rapidly in response to learning new information and fluctuate over the lifespan (E. R. Smith & DeCoster, 2000). In contrast, implicit attitudes, which are most commonly measured using response-latency tasks such as the Implicit Association Test (IAT; Greenwald, McGhee, & Schwartz, 1998), are automatically activated responses that occur often without conscious awareness (Wilson et al., 2000). Implicit attitudes tend to form from repeated exposure to positive or negative information about a group, either through socialization or direct experience, and can be resistant to change in response to new information (Gregg, Seibt, & Banaji, 2006; Rydell, McConnell, Mackie, & Strain, 2006; E. R. Smith & DeCoster, 2000). Implicit attitudes form early in life and their effects often persist into adulthood, even in the face of divergent explicit attitudes (Rudman, Phelan, & Heppen, 2007). For example, implicit attitudes toward racial outgroups remain consistently negative across the lifespan, even as explicit attitudes change during development to be more egalitarian (Baron & Banaji, 2006; Dunham, Baron, & Banaji, 2008; Rutland, Cameron, Milne, & McGeorge, 2005).
Explicit and implicit attitudes may not only be weakly correlated (in the range of .15 to .25; Dovidio, Kawakami, & Beach, 2001; Hofmann, Gawronski, Gschwendner, Le, & Schmitt, 2005) but may also diverge in valence, particularly in socially sensitive domains such as race (Fazio, Jackson, Dunton, & Williams, 1995; Greenwald, Poehlman, Uhlmann, & Banaji, 2009), reflecting a form of attitudinal ambivalence (Dovidio et al., 2001). For example, the vast majority of White Americans express nonprejudiced views, but they also exhibit a systematic preference for Whites over Blacks implicitly (Dovidio & Gaertner, 2004; Nosek et al., 2002). This type of discrepancy between explicit and implicit attitudes, in which people endorse egalitarian attitudes explicitly while favoring their own group implicitly occurs for religious, national, and sexual-orientation groups as well as race (Cunningham, Nezlek, & Banaji, 2004). Moreover, this divergence of explicit and implicit attitudes toward the same group has implications for behavior. Whereas explicit attitudes predict deliberative and reflective actions, negative implicit attitudes predict bias towards individuals in situations in which people lack the desire or capacity to suppress their responses (Fazio, 1990) or when it is unclear what an “unbiased” response would be (Son Hing, Chung-Yan, Hamilton, & Zanna, 2008; for reviews, see Dovidio, Kawakami, Smoak, & Gaertner, 2009; Perugini, 2005). However, one meta-analysis compared the predictive value of implicit attitudes to the predictive value of explicit attitudes in the domain of racial attitudes and found that implicit attitudes are not always better at predicting outcomes (Oswald, Mitchell, Blanton, Jaccard, & Tetlock, 2013), suggesting that our work examining discrepant social group attitudes in a novel domain, wealth, could add to an ongoing discussion in the field on the predictive value of implicit and explicit attitudes. Therefore, to understand how wealth influences judgments of others, in the current research we aim to identify people’s explicit and implicit wealth attitudes and also begin to examine the consequences of these attitudes.
Our work examining attitudes toward the upper class was conducted with a sample from the United States, a place where, in general, people would like to be rich and see being wealthy as desirable and aspirational (Kasser & Ryan, 1993; Roberts & Robins, 2000; Wicker, Lambert, Richardson, & Kahler, 1984). In fact, becoming rich is such a central cultural value that it is considered part of the “American Dream” (Kasser & Ryan, 1993; Nickerson, Schwarz, Diener, & Kahneman, 2003). Some psychologists assert that the desire to be rich is so pervasive in American society because it is a product of capitalist, consumerist culture (Dittmar, 2007; Kasser, Cohn, Kanner, & Ryan, 2007), while other psychologists see the drive to accumulate wealth as more universal, stemming from a more basic desire to acquire needed resources (Briers, Pandelaere, Dewitte, & Warlop, 2006). Importantly, both of these viewpoints emphasize that having a great deal of wealth is highly desirable.
Despite cultural values that idealize the upper class, many Americans explicitly reject this message. When people respond to questions about how they feel about the upper class, these responses are not wholly positive. Research on the stereotype content model reveals that the rich are viewed ambivalently (competent but cold), in contrast to the poor who are perceived uniformly negatively (incompetent and cold) and the middle class who are perceived uniformly positively (competent and warm; Cuddy, Fiske, & Glick, 2008; Fiske et al., 2002; Fiske, Moya, Russell, & Bearns, 2012). Attitudes toward the upper class as a social group have not been extensively studied within psychology, but surveys reveal that public opinion toward the rich is not very positive: For example, a recent 2012 survey indicates that only 27% of the American population agree with the statement “I admire people who are rich,” while 67% disagree (Pew Research Center, 2012a). When examining these preferences through the lens of political partisanship, Republicans are more likely to agree with the statement about admiration of the rich (40%) than Democrats (26%) or independents (21%), but even among Republicans a majority still disagree (53%; Pew Research Center, 2012a). Additionally, a majority of Americans (60%) believe that the rich are “unfairly advantaged” by the economic system, although again Democrats are more likely to say this than Republicans (Pew Research Center, 2014).
Even though people do not openly favor the rich on surveys, in the current research we examine whether people may hold unknown and unacknowledged positive implicit attitudes toward the upper class. Consistent with this possibility, a small number of previous researchers, in the course of answering larger questions about the structure of explicit and implicit attitudes, have looked at dual-level attitudes toward different wealth groups and found an implicit, but not explicit, preference for the rich over the poor (Cunningham et al., 2004; Rudman, Feinberg, & Fairchild, 2002); however, these studies conflate prorich and antipoor social group attitudes by assessing a relative preference for one group over the other using a Rich–Poor Implicit Association Task (IAT; Cunningham et al., 2004; Rudman et al., 2002). Given the comparative nature of the Rich–Poor IAT, it is unclear whether the observed effects are due to negative implicit attitudes toward people with low SES, positive implicit attitudes toward people with high SES, or a combination of both influences. Similarly, these results cannot tell us how people evaluate these groups relative to the middle class—for example, a relative preference for the upper class could emerge even if both groups were disliked relative to the middle class.
Here, we make the novel prediction that implicit evaluations of the upper class will be positive, even relative to the middle class. Research from developmental psychology supports the possibility that adults may favor the upper class at the implicit level. Just as children’s preference for their racial ingroup remains stable into adulthood at the implicit level while explicit attitudes are shaped by social norms (Baron & Banaji, 2006; Dunham et al., 2008), wealth attitudes may follow a similar diverging developmental trajectory. As early as the preschool years and continuing into adolescence, children show pro-upper-class tendencies and prefer those who have expensive-looking possessions, such as houses, cars, clothes, and toys, over those who have less costly belongings (Belk, Bahn, & Mayer, 1982; Elliot & Leonard, 2004; Horwitz, Shutts, & Olson, 2014; Olson, Shutts, Kinzler, & Weisman, 2012; Roper & La Niece, 2009). These early-emerging wealth preferences are hypothesized to stem from exposure to positively valenced messages from the media or other socializing influences (Belk et al., 1982; Roper & La Niece, 2009), which is the same type of prolonged exposure that also may shape implicit attitudes (Rudman et al., 2007; E. R. Smith & DeCoster, 2000). As children age, the expression of positivity toward the upper class diminishes and evaluations of the upper class become more nuanced and consistent with adults’ stereotypes (Chan, 2006; Sigelman, 2012; Woods et al., 2005). Together, this pattern of findings about children’s wealth preferences is consistent with the idea that prorich preferences develop early and remain in the form of implicit attitudes, while explicit evaluations change as children understand more about wealth. Additionally, both children and adults routinely receive cultural messages that idealize the upper class via the media (Kendall, 2011), and implicit attitudes are also theorized to reflect such cultural values, even when these ideas are not endorsed (Arkes & Tetlock, 2004). We thus hypothesized that, in the current research, people would display positive implicit attitudes toward the upper class, both generally but also relative to the middle class, while explicit attitudes toward the upper class relative to the middle class would be less positive, reflecting more egalitarian values (Baron & Banaji, 2006; Dovidio & Gaertner, 2004).
We also connect our study of wealth attitudes to previous research that has examined evaluations of people with low SES, generally finding that middle-class people have negative views of those with low SES and also act in ways that discriminate against low-SES individuals (Bullock, 1995; Lott, 2002; Lott & Saxon, 2002). A few studies have shown that implicit evaluations of the poor are relatively negative, but these studies have used Rich–Poor IAT measures, which can only reveal a relative preference between the two wealth groups (Cunningham et al., 2004; Rudman et al., 2002). In contrast, we predict that wealth attitudes may be best understood as separate social group evaluations. Although differences in wealth are quantitative, not qualitative, differences, people sometimes perceive individuals varying on a quantitative dimension as members of a limited number of categories that have social significance. The use of group labels (i.e., poor, middle class, and rich) to describe people may facilitate the emergence of unique perceptions about each group, as labels make groups salient and significant to children as young as 3 years old (Patterson & Bigler, 2006). This type of social categorization, in turn, promotes perceptions of similarities among members within a category and differences between members of distinct categories (Jetten & Spears, 2003). Rich and poor wealth groups are essentialized early in development and seen as meaningful social categories (del Río & Strasser, 2011; Diesendruck & haLevi, 2006; Sigelman, 2012), and thus may also form the basis of distinct implicit and explicit attitudes toward the lower class, middle class, and upper class into adulthood.
The present research adds to our understanding of how wealth groups are evaluated and extends our understanding of ambivalent attitudes by investigating the potential divergence between implicit and explicit attitudes toward the upper class and their implications for behavior toward a wealthy person. Across three studies, we test the following hypotheses:
H1. We predicted that (a) participants would explicitly express a relative preference for the middle class over the rich (tested in Studies 1a, 1b, and 2), and (b) that participants would express positive explicit attitudes toward the middle class (tested in Studies 1a, 1b, and 3).
H2. We predicted that (a) on comparative measures of implicit attitudes participants would favor the rich over the middle class (tested in Study 1a, 1b, and 2). This relative preference would result from (b) positive implicit attitudes toward the middle but (c) even more positive implicit evaluations of the rich (tested in Study 3). Thus we expected implicit attitudes would diverge from explicit attitudes in that implicit evaluations would be prorich while explicit evaluations would be pro-middle-class.
H3. In contrast to pattern of implicit, but not explicit, preference for the rich, we predicted that participants would prefer the middle class to the poor at both the (a) explicit and (b) implicit levels, and that this relative dislike for the poor would be distinct from evaluations of the rich at both the explicit and implicit levels (tested in Study 2).
H4. We hypothesized that implicit attitudes would predict favoritism toward an upper class target, specifically in situations where there was not a clear, expected response (tested in Study 3). Ours is the first study that we are aware of that examines the role of implicit wealth attitudes in predicting evaluations of targets with different wealth backgrounds, and as such could also address questions about the predictive power of implicit attitudes in a domain beyond race or ethnicity (Oswald et al., 2013).
We also explore two additional factors to see whether participants from different demographic groups might vary in their wealth attitudes. First, we test whether participants’ political orientation predicts their wealth attitudes. Because conservatives tend to support legislature that reduces wealth distribution and as such can be characterized as benefitting upper class people (Bartels, 2005), we expect that people who are more politically conservative will have more positive explicit attitudes toward the rich, and, as an exploratory measure, we examine whether political orientation relates to implicit attitudes in a similar way. Additionally, because our online samples were recruited without regard to participants’ social class, in our studies we conduct supplementary analyses on only middle-class-identified participants to facilitate comparisons across the samples and to reduce the possibility that results were driven by the inclusion of participants with different attitudes because of their social class background.
Study 1a
Whereas previous research has examined explicit and implicit attitudes toward the rich compared to those with low SES (Cunningham et al., 2004; Freeman, 2006), in Study 1a we investigated people’s explicit and implicit responses to the rich relative to the middle class. Specifically, participants completed a Rich–Middle Class Implicit Association Test (IAT) and then responded to statements expressing positive or negative affect toward the rich and the middle class.
Based on previous work showing that people attribute mixed positive and negative stereotypes to the upper class but uniformly positive stereotypes to the middle class (Fiske et al., 2002; Fiske et al., 2012), we predicted that people would explicitly favor the middle class over the upper class (Hypothesis 1a). By contrast, based on children’s openly expressed preferences for wealthier groups and individuals (Horwitz et al., 2014; Olson et al., 2012), we predicted that people would implicitly favor the upper class over the middle class (Hypothesis 2a).
Method
Participants
Participants were 31 (14 female) online participants recruited though mTurk and located in the United States. This sample size is similar to past studies examining implicit bias using IAT measures (Devos & Banaji, 2005; N = 28) and a power analysis using G*Power (Faul, Erdfelder, Buchner, & Lang, 2009; Faul, Erdfelder, Lang, & Buchner, 2007) indicates that the two-tailed single-category t test for our main hypothesis about implicit wealth preferences had 97% power to detect IAT effects similar in size to those seen in previous research examining bias in very large online samples (Nosek et al., 2002; implicit d = 0.71).
Participants were predominantly White (84%), self-identified as middle class (94%, remaining two participants identified as lower class), and in middle adulthood (M = 39.68 years, SD = 11.86 years, range = 20–60). The two modal responses for annual total household income were from $50,000 to $74,999 (n = 7) and the bracket from $75,000 to $99,999 (n = 7). These income brackets suggest that our sample has a slightly higher income than the typical American; the median annual house income in the United States in 2012 was $51,371 (Noss, 2012).
Procedure
The study was conducted using Inquisit software for web-based studies (Inquisit Version 4.0). Participants, who were recruited for a study involving a “survey and word-categorization task,” completed the implicit measures first (the “word-categorization task”), followed by the explicit measures for attitudes and then demographic questions (the “survey”).
To measure implicit attitudes, participants completed a Brief IAT that assessed associations between wealth categories and positive and negative words (code adapted from Inquisit Version 4.0). The Brief IAT procedure builds upon the logic and structure established in the standard IAT (Greenwald et al., 1998; Greenwald, Nosek, & Banaji, 2003), but is modified to take less time (Sriram & Greenwald, 2009). In this task participants are asked to simultaneously sort lexical items representing rich and middle class wealth categories and lexical items representing positive (e.g., “wonderful”) and negative (e.g., “awful”) categories. Participants are presented with words one at a time and are asked to rapidly respond by making a key press; for example, participants might be asked to press a button for words that belong in either the “Rich” category or the “Good” category. If response times are faster when two categories are paired together for responding (i.e., Rich/Good) than when the opposite categories are paired together (i.e., Rich/Bad), this differential in response time is taken to indicate that these categories are more strongly implicitly associated with one another. The three lexical items representing the Rich category (i.e., “upper class,” “millionaire,” and “rich”) were taken from Rudman et al. (2002). The three lexical items representing the Middle Class category (i.e., “middle class,” “average Joe,” and “blue collar”) were selected from a list of synonyms for middle class that had been generated by an independent sample of participants (N = 29) in response to the prompt, “Please list three words that you could use to describe someone who is MIDDLE CLASS, if you wanted to communicate their social class to another person.” To ensure that the lexical items would be associated with the intended social group, pilot participants were then asked to assign each lexical item (including items representing the rich, and the poor, to be used in Study 2) to one of three wealth groups. Participants in this sample categorized the lexical items as we intended: 98% of the time the items we identified as synonyms for the category Rich were assigned to that category, 87% of the time the middle class synonyms were classified in that category, and 99% of the time the synonyms for poor were selected for that category.
Explicit attitudes toward the social groups were assessed by having participants respond (using 7-point strongly agree–strongly disagree scales) to statements about the rich and the middle class: (a) “I generally like middle-class [rich] people,” and (b) “I don’t like middle-class [rich] people very much” (reverse-coded). Statements were presented in a randomized order across participants. The two items measuring explicit attitudes toward the rich were significantly correlated, r(29) = .585, p = .001, as were the two items measuring explicit attitudes toward the middle class, r(29) = .708, p < .001. The two sets of items were averaged to form separate measures of explicit attitudes toward the rich and the middle class, which were not correlated, r(29) = .124, p = .506.
Participants also provided demographic information about their age, sex, race, SES (specifically, individual income, household income, and education; questions taken from MacArthur Foundation, Research Network on SES & Health, 2008), and social class identity (e.g., upper class, middle class, lower class).
Results
Explicit attitudes
In line with the predictions made in Hypothesis 1a, participants explicitly expressed more positive attitudes toward the middle class (M = 5.66, SD = 1.39) than toward the rich (M = 3.89, SD = 1.42), t(30) = 5.32, p < .001, 95% CI of the difference between means [1.09, 2.46], d = 0.95. In line with Hypothesis 1b, participants’ evaluations of the middle class were positive, compared to the scale midpoint of 4, t(30) = 6.67, p < .001, 95% CI of the difference between mean and midpoint [1.15, 2.17], d = 1.19, and evaluations of the rich did not differ from neutral, t(30) = −0.44, p = .66, 95% CI of the difference between mean and midpoint [−0.66, 0.41], d = 0.08.
Implicit attitudes
For the Rich–Middle Class IAT measuring implicit attitudes, we calculated a D score (code taken from Inquisit Version 4.0; see Sriram & Greenwald, 2009) for each participant by comparing the average response latency while sorting middle class/good and rich/bad items to latencies while completing the opposite sort. Consistent with our prediction in Hypothesis 2a, on the IAT participants implicitly favored the rich over the middle class, mean D = 0.28, SD = 0.34, one-sample t test comparing to zero, t(30) = 4.65, p < .001, 95% CI of the difference between mean and zero [0.16, 0.40], d = 0.83.
Predictors of attitudes
To examine which factors predicted participants’ implicit preference for the rich over the middle class, we ran a linear regression analysis on prorich D scores and entered prorich explicit attitudes, pro-middle-class explicit attitudes, and indications of SES (household income, individual income, and education) as predictor variables. Table 1 displays the correlations between all variables. Table 2 displays the results of this regression model, R2 = .37, F(5, 25) = 2.96, p = .031, demonstrating that participants’ household income was the only significant predictor of implicit preference for the rich over middle class. Participants with higher household income demonstrated greater implicit preference for the rich relative to the middle class.
Correlations between attitudes and SES variables in Study 1a.

p < .01 (two-tailed).
Regression models predicting implicit prorich attitudes as measured by Rich–Middle Class IAT in Studies 1a, 1b, and 2.
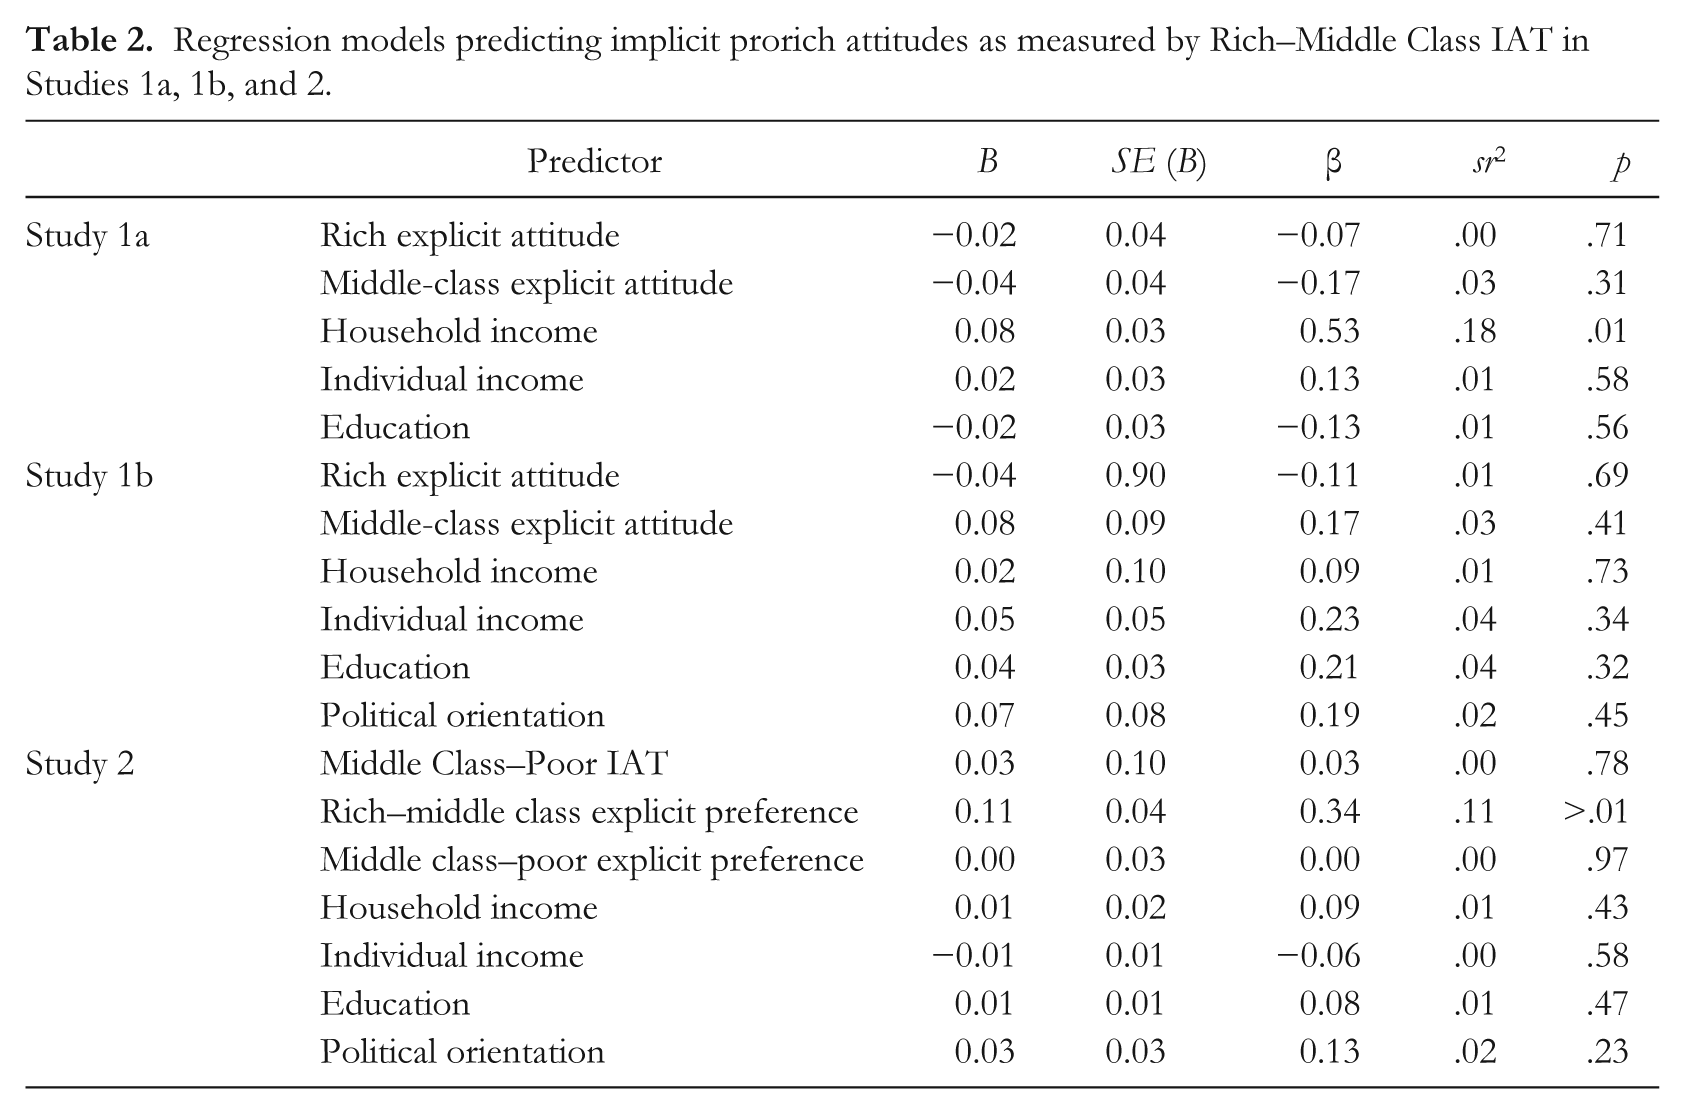
We performed an additional linear regression analysis on participants’ explicit prorich attitudes, including implicit prorich attitudes, explicit pro-middle-class attitudes, and SES indicators as predictors; in this model, R2 = .27, F(5, 25) = 1.87, p = .14, only higher levels of education predicted more positive explicit attitudes toward the rich, b* = 0.52, p = .02, sr2 = .17, all other ps > .45. Last, we ran a regression model on participants’ explicit pro-middle-class attitudes, including explicit and implicit prorich attitudes and SES indicators; this model, R2 = .06, F(5, 25) = 0.33 p = .89, showed no significant relationships, all ps < .31.
Supplemental analyses
Additional analyses including only participants who self-identified as middle class (n = 28) yielded identical patterns of social class attitudes, with participants explicitly favoring the middle class (M = 5.59, SD = 1.43) over the rich (M = 4.04, SD = 1.41), t(27) = 4.58, p < .001, 95% CI of the difference between means [1.09, 2.46], and implicitly favoring the rich over the middle class, mean D = 0.31, SD = 0.32, one-sample t test comparing to zero, t(27) = 5.20, p < .001, 95% CI of the difference between mean and zero [0.19, 0.44]. Additionally, we ran the regression analyses with only participants who self-identified as middle class and found identical results: in the model predicting implicit attitudes, R2 = .31, F(5, 22) = 1.99, p = .12, household income was the only significant predictor, b* = 0.43, p = .052, sr2 = .13, all other ps > .31; in the model predicting explicit attitudes toward the rich, R2 = .25, F(5, 22) = 1.44, p = .25, education was the only significant predictor, b* = 0.51, p = .04, sr2 = .17, all other ps > .48; and in the model predicting explicit attitudes toward the middle class, R2 = .12, F(5, 22) = 0.61, p = .70, there were no significant predictors, all ps > .27.
Discussion
Study 1a demonstrated that adults simultaneously expressed more positive explicit attitudes toward the middle class than toward the rich and showed an implicit preference for the rich over the middle class. This implicit preference for the rich relative to the middle class was stronger for participants from higher SES households but also occurred for participants who self-identified as middle class. This pattern of findings is consistent with previous work indicating that people form positive associations with wealth relatively early in development (Horwitz et al., 2014; Olson et al., 2012), and these associations may persist into adulthood as implicit preferences, even while adults explicitly espouse more positive attitudes toward the middle class than the rich. As an initial examination of implicit wealth attitudes, Study 1a suggests participants have robust, though divergent, explicit and implicit wealth group preferences. Building off of this initial study, Study 1b provides a conceptual replication of the main findings, in line with what is considered good research practice (Roediger, 2012).
Study 1b
In Study 1b we ensure that our findings replicate using a new group of participants and also using a modified set of lexical stimuli for the implicit attitudes measures. As before, participants completed a Rich–Middle Class Implicit Association Test (IAT) and then responded to statements expressing positive or negative affect toward the rich and the middle class. Additionally, we continue to examine the relationships between wealth attitudes and demographic variables, in this study including a measure of political orientation.
Method
Participants
Participants were 29 (14 female) online participants recruited though mTurk and located in the United States. As Study 1b aimed to replicate the results on Study 1a, we used a similar sample size. Participants were predominantly White (72%), self-identified as middle class (83%, remaining five participants identified as lower class), and in middle adulthood (M = 36.2 years, SD = 9.6 years, range = 22–57). The modal response for annual total household income was from $35,000 to $49,999 (n = 7), which is lower than the sample in Study 1a and slightly lower income than the typical American (Noss, 2012).
Procedure
The study procedure was similar to Study 1a, except for modifications made to the set of three lexical items representing the wealth categories and the inclusion of an additional question about political orientation using a scale of 1 (very Liberal) to 6 (very Conservative). These modifications aimed to make the lexical sets more equivalent and to remove any concerns that the results of Study 1a were biased by the inclusion of any unusual items. In the present study, the Rich category included “high income,” “upper class,” and “rich,” and the Middle Class category included “average income,” “middle class,” and “typical.”
Results
Explicit attitudes
In line with Hypothesis 1a and replicating Study 1a, participants explicitly expressed more positive attitudes toward the middle class (M = 5.97, SD = 0.90) than toward the rich (M = 4.33, SD = 1.35), t(28) = 5.88, p < .001, 95% CI of the difference between means [1.07, 2.21], d = 1.09. Supporting Hypothesis 1b, participants’ evaluations of the middle class were positive, compared to the scale midpoint of 4, t(28) = 11.82, p < .001, 95% CI of the difference between mean and midpoint [1.62, 2.31], d = 2.19, and evaluations of the rich did not differ from neutral, t(28) = 1.31, p = .20, 95% CI of the difference between mean and midpoint [−0.19, 0.84], d = 0.24.
Implicit attitudes
For the Rich–Middle Class IAT measuring implicit attitudes, participants implicitly favored the rich over the middle class, mean D = 0.37, SD = 0.43, one-sample t test comparing to zero, t(28) = 4.59, p < .001, 95% CI of the difference between mean and zero [0.20, 0.53], d = 0.86, consistent with Hypothesis 2a and replicating Study 1a.
Predictors of attitudes
To examine which factors predicted participants’ implicit preference for the rich over the middle class, we ran a linear regression analysis on prorich D scores and entered prorich explicit attitudes, pro-middle-class explicit attitudes, indications of SES (household income, individual income, and education), and political conservatism as predictor variables. Table 3 displays the correlations between all variables. Table 2 displays the regression values for this model, R2 = .19, F(6, 21) = 0.80, p = .58; in contrast to Study 1a where participants’ household income predicted implicit preference for the rich over middle class, in the current study there were no significant predictors of implicit prorich attitudes.
Correlations between attitudes, SES variables, and political orientation in Study 1b.
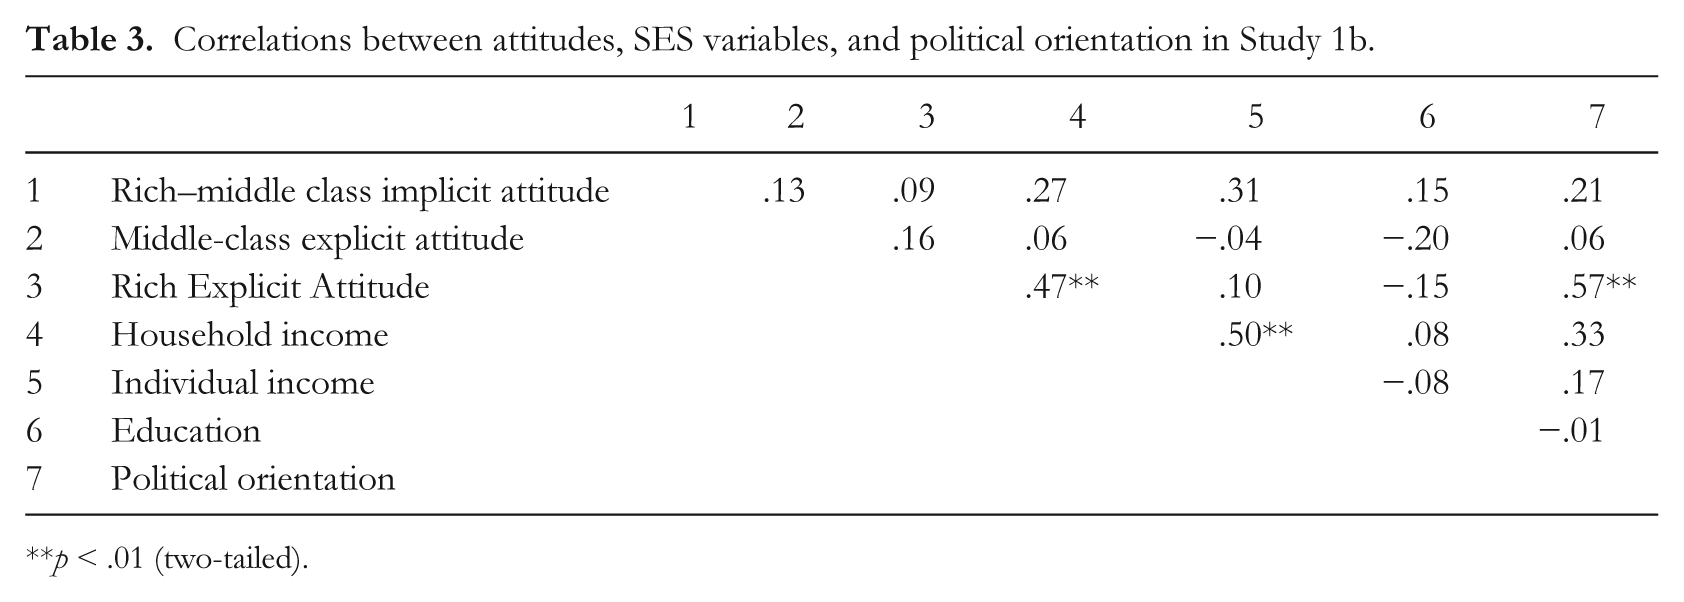
p < .01 (two-tailed).
We performed an additional linear regression analysis on participants’ explicit prorich attitudes, including implicit prorich attitudes, explicit pro-middle-class attitudes, SES indicators, and political conservatism as predictors; in this model, R2 = .48, F(6, 21) = 3.17, p = .02, both higher levels of household income, b* = 0.43, p = .04, sr2 = .13, and more political conservatism, b* = 0.48, p = .009, sr2 = .20, predicted more positive explicit attitudes toward the rich, all other ps > .25, consistent with the prediction that political conservatives would view the rich more favorably. Last, we ran a regression model on participants’ explicit pro-middle-class attitudes, including explicit and implicit prorich attitudes and SES indicators; this model, R2 = .09, F(6) = 0.33, p = .92, showed no significant relationships, all ps < .33.
Supplemental analyses
When looking at only the participants who self-identified as middle class (n = 24), participants still explicitly favored the middle class (M = 5.85, SD = 0.90) over the rich (M = 4.46 SD = 1.28), t(23) = 5.15, p < .001, 95% CI of the difference between means [0.83, 1.96], and implicitly favored the rich over the middle class, mean D = 0.38, SD = 0.38, one-sample t test comparing to zero, t(23) = 4.80, p < .001, 95% CI of the difference between mean and zero [0.21, 0.54]. Additionally, the regression analyses with self-identified middle-class participants found similar results: in the model predicting implicit attitudes, R2 = .19, F(6, 16) = 0.61, p = .72, there were no significant predictors, all ps > .28; in the model predicting explicit attitudes toward the rich, R2 = .48, F(6, 16) = 2.43, p = .07, conservatism was the only significant predictor, b* = 0.52, p = .02, sr2 = .24, all other ps > .23; and in the model predicting explicit attitudes toward the middle class, R2 = .18, F(6, 16) = 0.57, p = .75, there were no significant predictors, all ps > .30.
Discussion
Study 1b replicated the discrepancy observed in Study 1a where participants simultaneously expressed more positivity about the middle class than about the rich but implicitly preferred the rich over the middle class. Building on these initial studies showing that, on average, people hold prorich implicit attitudes, Study 2 was designed to expand the scope of our investigation into the nature of wealth attitudes and specifically examine the relationship between prorich attitudes and antipoor attitudes.
Study 2
Although wealth levels vary along a continuum, the structure of social class attitudes may be somewhat more complex. Social class evaluations may always favor those with greater wealth, or evaluations of different social class groups may develop independent of one another. Building on Studies 1a and 1b that examine evaluations of the rich, in Study 2 we ask whether attitudes toward the upper class are related to attitudes toward those with low SES.
In line with recommendations from the APA Task Force on SES (2007) suggesting that researchers consider how people relate to others who have both lower and higher social class standing, we assess attitudes toward these two wealth groups in the same sample of participants to see whether they are strongly connected, as would be expected if wealth preference was a unitary construct, or whether evaluations of those with low SES and those with high SES are distinct from one another. This approach has been fruitful in the domain of weight bias. To draw a parallel with wealth groups, weight is also a continuous dimension where people generally categorize individuals using social group labels, such as “fat” or “thin.” New advances in the domain of weight bias demonstrate antifat attitudes and prothin attitudes are independent from one another, with different subpopulations showing either one or both types of attitudes (Anselmi, Vianello, & Robusto, 2013; Roddy, Stewart, & Barnes-Holmes, 2010). For example, people of all weights hold prothin implicit attitudes, but only those who are underweight show antifat implicit attitudes (Anselmi et al., 2013); the fact that some people hold only one type of weight bias shows that these two attitudes are distinct and occur independently. These initial findings about the structure of weight bias also have important consequences, such as helping clinicians identify specific attitudinal patterns associated with eating disorders beyond the relative preference for thin over fat seen in the general public (Parling, Cernvall, Stewart, Barnes-Holmes, & Ghaderi, 2012).
Given the success of separately examining attitudes toward fat and thin groups, in Study 2 we used a similar approach to disentangle attitudes toward high-SES and low-SES groups. Therefore, we examined attitudes toward the rich relative to the middle class and attitudes toward the poor relative to the middle class, and the relationship between the two. Based on previous work showing that middle-class people’s explicit evaluations of people with low SES are negative (Cozzarelli et al., 2001; Lott, 2002), and that people discriminate against people with low SES even in situations where they wish to be objective (e.g., judging academic performance; Darley & Gross, 1983), we predicted that participants would explicitly express a relative preference for the middle class over the poor (Hypothesis 3a) and would also implicitly prefer the middle class over the poor (Hypothesis 3b). Most importantly, we hypothesized that this relative dislike for the poor would not be related to liking for the rich at the implicit level, or the explicit level.
Method
Participants
Eighty-eight (53 female) online participants were recruited through a participant pool maintained by the university. This sample size was selected because previous research examining the distinction between antifat and prothin implicit evaluations has used samples around this size (i.e., N = 80 in Roddy et al., 2010). In Study 2 our main question was whether attitudes toward the rich would be identical to or independent from attitudes toward the poor, and thus whether each factor would be significant in predicting the other using a regression model; a power analysis using G*Power (Faul et al., 2009; Faul et al., 2007) indicates that this sample size (N = 88) gave us 80% power to detect a single regression coefficient with an effect size of f2 = .09 in a model with seven predictors and an alpha of .05, two-tailed. Participants were predominantly White (74%), self-identified as middle class (93%, one participant identified as upper class and remaining five participants identified as lower class), and in middle adulthood (M = 34.66 years, SD = 13.56 years, range = 18–74). The modal household income was $100,000 or greater (n = 30), with five participants choosing not to respond to this question. Although this sample has a relatively high annual income compared to our mTurk sample and compared to the national population, they self-identify as middle class and subjective social status reliably predicts a range of psychological effects even when controlling for objective indicators of SES (Kraus & Keltner, 2013; Kraus et al., 2009; Piff et al., 2010).
Procedure
Participants completed the two implicit attitudes measures, followed by the explicit attitudes measures, and, lastly, a demographic questionnaire.
To assess implicit attitudes, in counterbalanced order across participants, participants completed two Brief IATs: a Rich–Middle Class IAT identical to that used in Study 1a, and a Poor–Middle Class IAT. The Poor–Middle Class IAT used identical lexical items to represent the middle class, but used three lexical items taken from Rudman et al. (2002) to represent the “Poor” category (e.g., “lower class,” “poor,” and “welfare”).
To measure explicit attitudes, participants responded on 7-point (strongly agree–strongly disagree) scales to statements that directly compared two of the wealth groups, in order to match the comparative format of the implicit measure. In a randomized order, participants responded to one rich/middle-class statement and one poor/middle-class statement: “I generally prefer people who are rich [poor] over people who are middle class.”
Participants were then asked to provide demographic information about their age, sex, race, SES, and political orientation as in Study 1b.
Results
Explicit attitudes
Consistent with the results of Studies 1a and 1b and in support of Hypothesis 1a, participants explicitly disagreed with the statement favoring the rich over the middle class, M = 3.18 on a scale from 1 to 7, SD = 1.12, compared to the midpoint of 4, t(87) = −6.85, p < .001, 95% CI of the difference between mean and midpoint [−1.06, −0.58], d = 0.73. In addition, in support of Hypothesis 3a, participants explicitly disagreed with the statement favoring the poor over the middle class, M = 3.17, SD = 1.35, t(87) = −5.77, p < .001, 95% CI of the difference between mean and midpoint [0.27, 0.75], d = 0.61.
Implicit attitudes
Implicitly, participants favored the rich over the middle class, mean D = 0.36, SD = 0.37, compared to zero, t(87) = 9.25, p < .001, 95% CI of the difference between mean and zero [0.28, 0.44], d = 0.97, replicating the results of Study 1 and consistent with Hypothesis 2a. On the Poor–Middle Class IAT, new to Study 2, participants showed the predicted preference for the middle class over the poor, mean D = 0.41, SD = 0.37, t(87) = 10.19, p < .001, 95% CI of the difference between mean and zero [0.33, 0.49], d = 1.11, as predicted by Hypothesis 3b.
Predictors of attitudes
Relevant to our question about the distinctiveness of attitudes toward the rich and attitudes toward the poor, and the relationship between attitudes at the explicit and implicit levels, we conducted linear regression analyses on each attitude measure, including in the model all other attitude measures, SES indicators (household income, individual income, education), and political orientation. Table 4 displays the correlations between all variables. Table 2 displays the regression values for this model, R2 = .18, F(7, 79) = 2.43, p = .03. This regression analysis on implicit preferences for the rich over the middle class does not indicate a relationship with implicit preferences for the middle class over the poor, in line with our hypothesis that a preference for the rich is distinct from a dislike of the poor. However, in contrast to Studies 1a and 1b, in this study more explicit positivity about the rich predicted greater implicit preference for the rich over the middle class.
Correlations between attitudes, SES variables, and political orientation in Study 2.
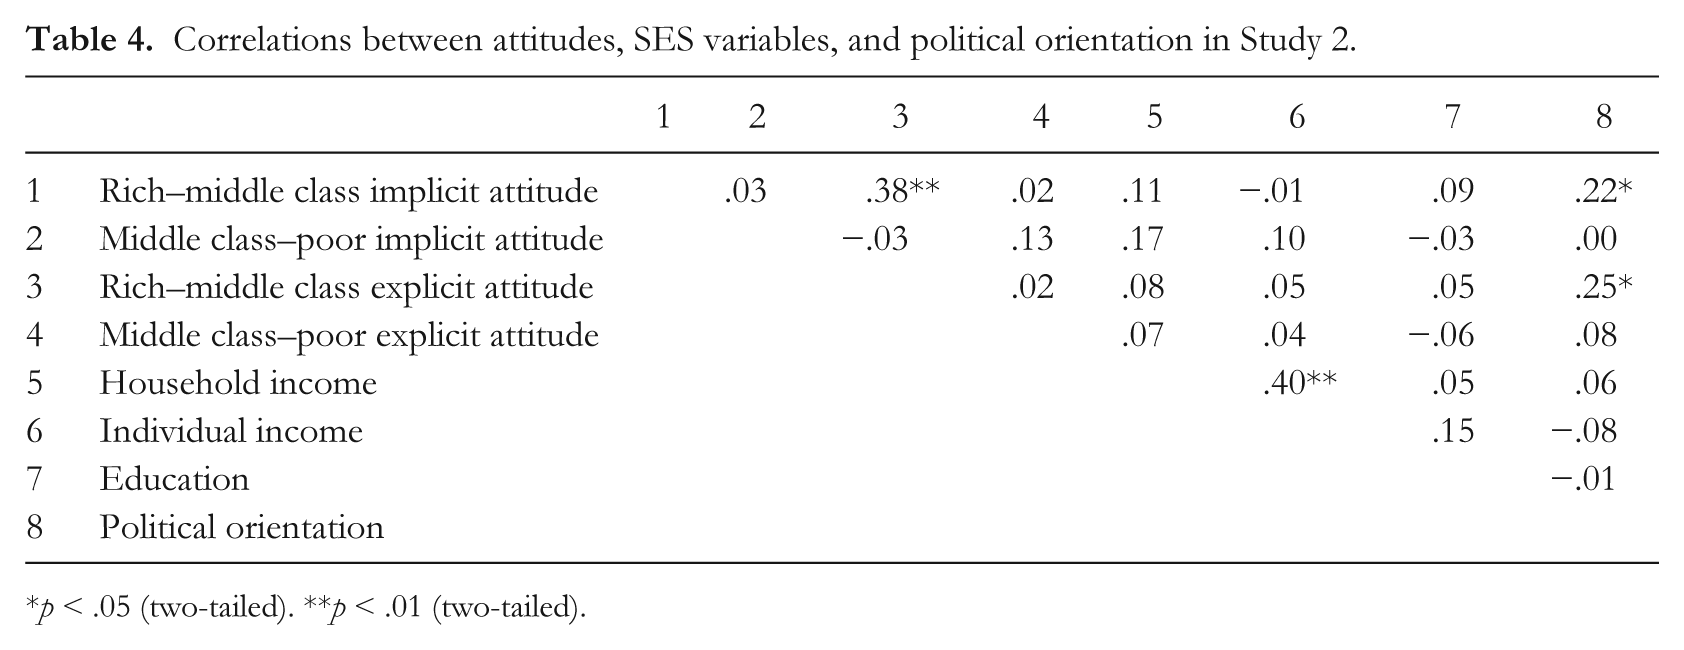
p < .05 (two-tailed). **p < .01 (two-tailed).
A second regression model analyzing the predictors of explicit preference for the rich over the middle class, R2 = .18, F(7, 79) = 2.50, p = .02, revealed that explicit preferences for the rich were predicted by implicit prorich attitudes, b* = 0.34, p = .002, sr2 = .11, and marginally predicted by higher levels of political conservatism, b* = 0.18, p = .10, sr2 = .03, consistent with the hypothesized relationship and the observed relationship in Study 1b. There was no relationship between explicit preferences for the rich over the middle class and preferences for the middle class over the poor, b* = −0.002, p = .98, sr2 = .000, reinforcing the idea that wealth groups elicit distinct evaluations and replicating the nonrelation seen at the implicit level. Regression analyses of implicit and explicit preferences for the middle class over the poor revealed no significant relationships, all ps > .40.
Supplemental analyses
Additional analyses including only participants who self-identified as middle class (n = 82) yield identical patterns of social class attitudes, with participants rejecting statements favoring the rich over the middle class, M = 3.13, SD = 1.07, one-sample t test comparing to midpoint of 4, t(81) = −7.34, p < .001, 95% CI of the difference between mean and midpoint [−1.10, −0.631], as well as statements favoring the poor over the middle class, M = 2.49, SD = 1.11, t(81) = −4.72, p < .001, 95% CI of the difference between mean and midpoint [−0.34, −0.82].
For self-identified middle-class participants, implicit attitudes favored the rich over the middle class, mean D = 0.35, SD = 0.36, one-sample t test comparing to zero, t(81) = 8.69, p < .001, 95% CI of the difference between mean and zero [0.27, 0.43], and the middle class over the poor, mean D = 0.42, SD = 0.35, one-sample t test comparing to zero t(81) = 10.70, p < .001, 95% CI of the difference between mean and zero [0.34, 0.50].
Rerunning the regression analyses with only self-identified middle-class participants yielded similar results; the regression model on implicit preferences for the rich, R2 = .15, F(7, 73) = 1.76, p = .11, indicated that only more explicit positivity about the rich predicted implicit preference, b* = 0.31, p = .007, sr2 = .09; the model on explicit preferences for the rich, R2 = .14, F(7, 73) = 1.75, p = .11, indicated that implicit prorich attitudes were the only significant predictor, b* = 0.31, p = .002, sr2 = .09, and not political conservatism, b* = 0.18, p = .21, sr2 = .02. As with the full sample, models analyzing implicit and explicit preferences for the middle class over the poor did not have any significant predictors, all ps > .18.
Discussion
Study 2 replicated our pattern of results from Studies 1a and 1b in which people explicitly preferred the middle class over the rich but at the same time implicitly preferred the rich relative to the middle class. In Study 2, participants from the online sample, on the whole, had higher income than participants in Studies 1a and 1b. The generalizability of this pattern of findings across studies and the robustness of the findings among participants differing in both actual SES across studies, and social class identity within each study, suggests that wealth attitudes may reflect cultural values that are shared by people with different amounts of personal wealth.
Additionally, Study 2 suggests that attitudes toward the upper class are largely independent from attitudes toward those with low SES, on both implicit and explicit levels. Regression analyses of both implicit and explicit attitudes toward the rich indicated that attitudes toward the rich cannot be explained by attitudes toward the poor. If evaluations of the upper class and people with low SES were both expressions of an underlying unvarying preference for those with more money, we would expect to see a relationship between them. However, as has been shown in the case of weight bias, sometimes groups that differ on objectively continuous dimensions form the basis for distinct and independent evaluations. We are limited in the conclusions we can draw from one study showing a null relationship, but we hope these initial results will inspire future researchers to be aware of the fact that classism is multifaceted and to further explore the relationship between prorich and antipoor bias. Importantly, although Study 2 suggests that prorich and antipoor implicit evaluations are independent, it is likely that they may be related in more nuanced ways that were not measured by our instruments (e.g., when explored through the lens of stereotypes rather than attitudes).
Although the IAT task used in Studies 1a, 1b, and 2 offer more detailed views of implicit wealth attitudes than any previous study, we note that participants’ IAT scores thus far still indicate only a relative preference for one of two social groups, and thus may reflect liking of the rich, dislike of the middle class, or a combination of these two factors. Similarly, our explicit measure, which was designed to match the comparative format of the IAT, also represented only a relative preference for the middle class and the rich. To distinguish among these three possibilities, in Study 3 we used a modified version of the IAT, a single-category IAT, in order to examine positive and negative associations with each wealth group individually, and examined the consequences of wealth attitudes.
Study 3
In Study 3 we investigated the relationship between implicit and explicit wealth attitudes and evaluations of individuals with different wealth backgrounds. Given that people explicitly prefer the middle class over the upper class but implicitly prefer the upper class over the middle class, as shown in Studies 1 and 2, evaluations of upper class compared to middle-class individuals could be relatively negative if related to explicit attitudes, or they could be relatively positive if related to implicit preference. Outside of the domain of wealth attitudes some researchers have found that implicit preferences predict behavior in socially sensitive situations where people are concerned about appearing prejudiced (Greenwald et al., 2009) or in situations in which appropriate behaviors are not clearly defined (Dovidio & Gaertner, 2004; Dovidio et al., 2009; Son Hing et al., 2008). However, other researchers have concluded from their meta-analyses of ethnic and racial discrimination that “IATs were poor predictors of every criterion category except brain activity, and the IATs performed no better than simple explicit measures” (Oswald et al., 2013, p. 171).
The present study provides a unique opportunity to examine the potential predictive power of explicit and implicit attitudes in a new domain, outside of ethnic or racial discrimination, in which explicit and implicit preferences for the upper class versus middle class do not just differ in magnitude but actually favor opposite groups. We acknowledge that a single study, limited to a specific context, cannot definitively address the issue of whether explicit or implicit preferences are generally more valid predictors of responses but a finding that implicit preferences for the upper class predict more positive responses to a wealthy person, particularly in the context of explicitly expressed negative attitudes, would contribute to the literature on the construct validity of implicit measures.
We examined whether people’s explicit and implicit attitudes would predict their judgments about upper class and middle-class targets in a situation where two drivers, one upper class and one middle class, jointly caused a car accident. Given that blame in the car accident vignette was ambiguous, we hypothesized that in this situation implicit prorich attitudes would lead to increased leniency on the wealthy target (Hypothesis 4). Consistent with our hypothesis that people will be implicitly biased in favor of the rich, one meta-analysis suggests that high-SES defendants receive lighter punishments than low-SES defendants (Mazzella & Feingold, 1994; see also Freeman, 2006), even though this is a situation in which people typically strive to be unaffected by a criminal’s social background. To isolate the impact of implicit prorich attitudes, in the current study participants completed two single-category IATs (SC-IAT), one for the rich and one for the middle class, assessing the positive or negative associations with each group separately and providing evidence for Hypotheses 2b and 2c, and completed similar single-category explicit measures.
Method
Participants
Seventy-eight (36 female) online participants, located in the United States, were recruited through mTurk. Our sample size was selected after considering past research that has used similar methods to disentangle the effects of implicit and explicit attitudes on biased responses with sample sizes as small as 40 participants (Dovidio, Kawakami, & Gaertner, 2002). In Study 3 our main question was about how specific types of attitudes predict social evaluations in a regression model, and specifically whether implicit prorich attitudes would predict favoritism; a power analysis using G*Power (Faul et al., 2007) indicates that in the model with eight predictors, an alpha of .05, and assuming a two-tailed test we had 97% power to detect effects the same size as those seen in similar past work examining the predictive value of implicit and explicit attitudes (i.e., Dovidio et al., 2002; N = 40; r2 = .168).
Participants were predominantly White (76%), self-identified as middle class (82%, remaining 18% participants identified as lower class), and middle-aged (M = 36.10 years, SD = 11.51 years, range = 18–67). The modal household income was from $35,000 to $49,999 (n = 20), suggesting that our sample has a slightly lower income than the typical American (Noss, 2012).
Procedure
Participants first completed the explicit attitudes measures, next responded to the car accident vignette, and then performed the implicit attitudes measures. Last, participants completed a demographic questionnaire.
In contrast to previous studies that assessed implicit attitudes first, in the current study we first assessed participants’ explicit attitudes, to avoid any potential demand characteristics that could possibly arise from completing explicit attitudes measures after reading a vignette about misbehavior. We assessed explicit attitudes toward the rich and middle class using the same four items (randomized order across participants), two for the rich and two for the middle class, used in Study 1a: (a) “I generally like middle-class [rich] people,” and (b) “I don’t like middle-class [rich] people very much” (reverse-coded). The two items measuring explicit attitudes toward the rich were highly correlated, r(76) = .60, p < .001, as were the two items measuring explicit attitudes toward the middle class, r(76) = .66, p < .001, and the items were averaged to create separate measures of explicit attitudes toward the rich and toward the middle class. The prorich and pro-middle-class explicit measures were correlated, r(76) = .36, p = .001.
Participants next read a vignette describing a car accident between a rich driver and a middle class driver. Motivated by past research showing that implicit attitudes have a greater impact in unstructured situations rather than clear-cut situations (Dovidio et al., 2009; Perugini, 2005), our vignette described an accident between two drivers who both exhibited risky behavior (i.e., one was rushing while the other was distracted by their cell phone), thus making it ambiguous who was at fault. The type of risky behavior was counterbalanced with respect to the target’s wealth (rich vs. middle class), which was manipulated by changing the target’s occupation (a financial executive vs. a sales assistant) or leisure activity (box seats for a football game vs. watch a football game on TV), and car (a new Jaguar XK roadster vs. an old Toyota Corolla). Given our focus on the impact of wealth attitudes on social judgments, and the fact that stereotypes and attitudes are unique forms of bias (Amodio & Devine, 2006), we aimed to make our vignette stereotype-neutral such that the behaviors of the characters were equally plausible when performed by either character. The complete vignettes are included in the Appendix.
After reading the vignette, participants responded to three questions about each of the drivers. Using 7-point scales, participants were asked to indicate how bad the driver’s behavior was, how careless the driver had been, and how responsible the driver was for causing the accident. Notably, participants evaluated the blame associated with each driver independently and not as a zero-sum construct, so the blame assigned to one driver did not dictate the blame assigned to the other. As a manipulation check, participants were asked to indicate which driver was wealthier.
After responding to the vignette, participants completed the implicit attitudes measures. Although in some situations implicit attitudes can be influenced by exposure to positive or negative exemplars from a social group (Dasgupta & Greenwald, 2001), these effects may not be particularly robust across experimental variations (Joy-Gaba & Nosek, 2010) and our participants were exposed to merely “slight wrongdoing” about both groups in question, rather than just one group. To measure implicit attitudes, participants completed two SC-IATs, a Rich SC-IAT and Middle-Class SC-IAT (in counterbalanced order across participants), following the procedure of Karpinski and Steinman (2006). In these tasks, participants are asked to rapidly categorize words representing the wealth group, positive words, and negative words. In contrast to the comparative measure used previously, in the SC-IAT participants evaluate only one social group at a time in the absence of any comparison group. For example, in one block of the Rich SC-IAT participants are asked to press one key for words representing a social category and an evaluative category (i.e., Rich and Good) and press a second key just for words that represent the opposite evaluative category (i.e., Bad); reaction times on this sorting task are then compared to a sorting task where Rich and Bad categories are paired together. A positive D score on the SC-IAT indicates that the target group is more strongly associated with positive items than with negative items and suggests that participant has a positive implicit attitude toward the group. These tasks used the same lexical items as Studies 1a and 2 to represent the wealth groups.
Finally, participants were asked to provide demographic information about their age, sex, race, SES, and political orientation (with 63% of participants selecting the “Liberal” half of the scale and the rest indicating “Conservative”), as in Study 2, but with the highest income response options increased to “$250,000 and greater.”
Results
Explicit attitudes
On explicit measures, the results of Study 3 replicated the findings from Study 1: As predicted by Hypothesis 1a, participants expressed more positive attitudes toward the middle class (M = 5.62, SD = 1.05) than toward the rich (M = 4.14, SD = 1.48), t(77) = 8.87, p < .001, 95% CI of the difference between means [−1.82, −1.15], d = 1.15. Supporting Hypothesis 1b, participants expressed positivity toward the middle class, one-sample t test comparing to midpoint of 4, t(77) = 13.67, p < .001, 95% CI of the difference between mean and midpoint [1.39, 1.86], and participants’ attitudes toward the rich did not differ from neutral, t(77) = 0.80, p = .43, 95% CI of the difference between mean and midpoint [−0.20, 0.47].
Implicit attitudes
The results of the SC-IATs offer further detail about implicit attitudes toward the rich and the middle class. The order of the SC-IATs did not affect scores on either the Rich SC-IAT, t(76) = 0.58, p = .56, or the Middle-Class SC-IAT, t(76) = −0.01, p = .99. For the Rich SC-IAT, participants implicitly associated the rich with positive rather than negative items, mean D = 0.21, SD = 0.30, compared to zero, t(77) = 6.09, p < .001, 95% CI of the difference between mean and zero [0.14, 0.27], d = 0.70, as predicted by Hypothesis 2c. Similarly, participants implicitly associated the middle class with positivity, mean D = 0.10, SD = 0.32, compared to zero, t(77) = 2.66, p = .009, 95% CI of the difference between mean and zero [0.02, 0.17], d = 0.31, as predicted by Hypothesis 2b. However, consistent with the comparative IATs used in Studies 1 and 2, a paired-samples t test revealed that participants’ scores on the Rich SC-IAT were significantly higher than on the Middle-Class SC-IAT, t(77) = 2.21, p = .030, 95% CI of the difference between means [−0.21, −0.01], d = 0.35, suggesting that participants viewed the rich more positively than the middle class, in line with Hypothesis 2a.
Predicting social judgments
For the main analyses of Study 3, we examined participants’ responses to the vignette about a car accident between a rich person and a middle-class person. First, we created a “blame” score by averaging participants’ judgments about the badness, carelessness, and responsibility of each driver (rich, α = .77; middle class, α = .69). Overall, we found no difference in the blame placed on the middle class driver (M = 5.24, SD = 1.04) compared to the rich driver (M = 5.31, SD = 1.10), t(77) = 0.50, p = .62.
To answer our primary question about the relationship between social class attitudes and subsequent bias, we conducted two linear regression analyses on blame scores (one for blame of the rich driver and one for blame of the middle-class driver), including as predictors the two implicit measures of attitudes toward the rich and toward the middle class (i.e., the Rich SC-IAT and the Middle-Class SC-IAT), the two measures of explicit attitudes toward the rich and toward the middle class, indicators of participant SES, and political orientation. Table 5 displays the correlations between all variables.
Correlations between attitudes, SES variables, political orientation, and blame judgments in Study 3.
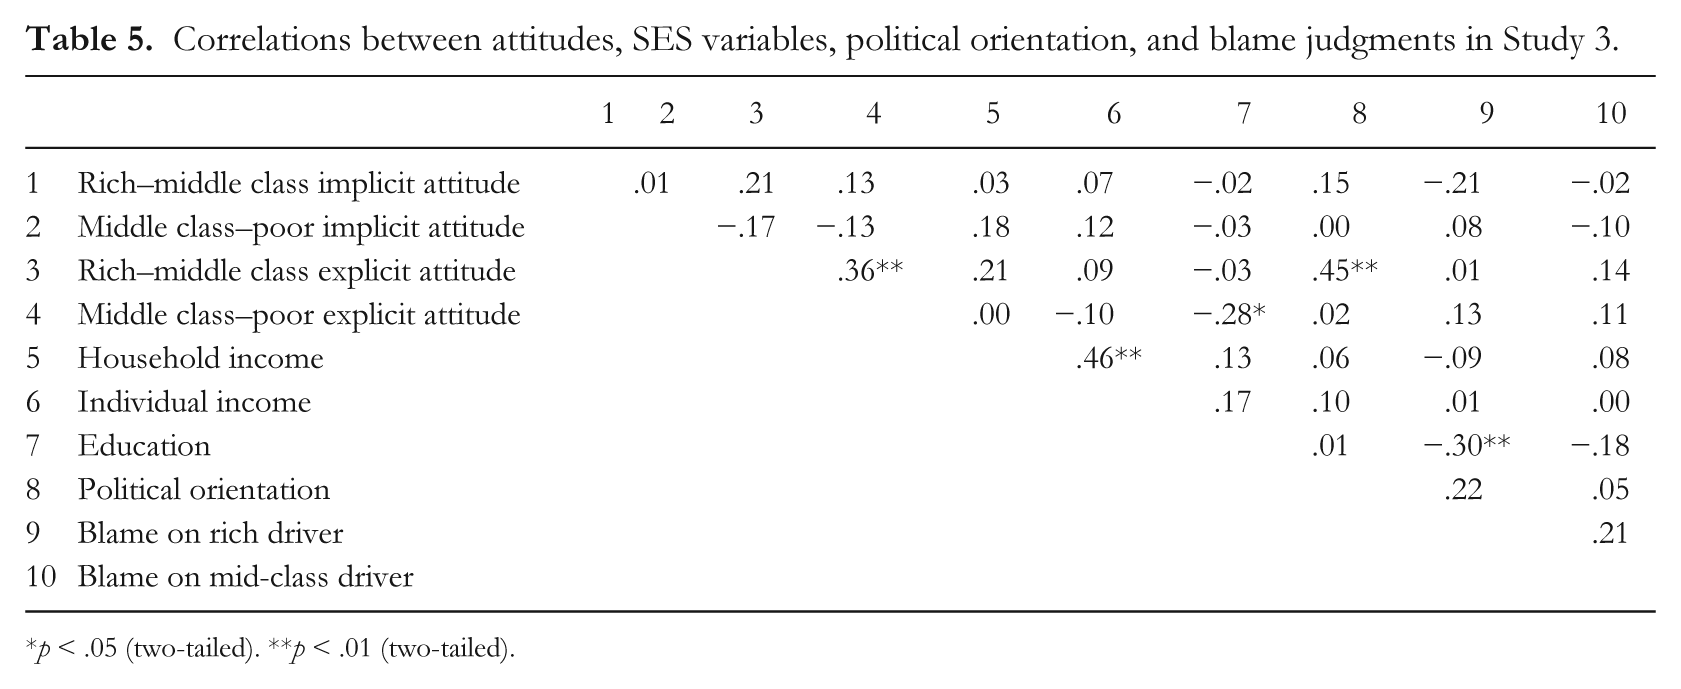
p < .05 (two-tailed). **p < .01 (two-tailed).
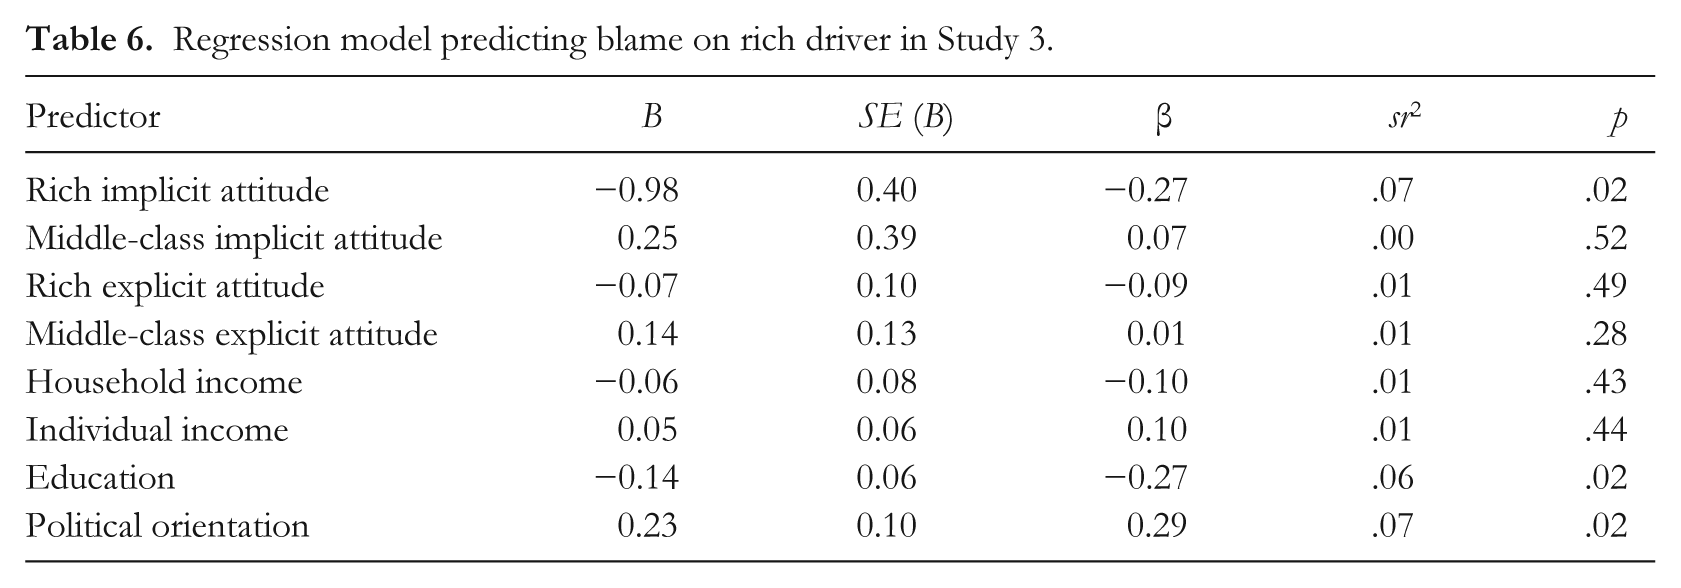
Table 6 displays the regression values from the analysis of blame on the rich driver, R2 = .23, F(8, 69) = 2.63, p = .01. As predicted, in this model the only attitude measure that predicted judgments about the rich was implicit attitudes toward the rich, such that implicit positivity toward the rich predicted less blame on the rich driver. Additionally, blame on the rich driver was predicted by lower levels of education and a more conservative political orientation. The model yielded no effect of implicit attitudes toward the middle class, explicit attitudes toward the rich, or explicit attitudes toward the middle class, demonstrating that implicit positivity toward the rich, but not other types of wealth attitudes, predict subsequent favoritism toward the wealthy. In a supplementary regression analysis that also controlled for evaluations of the middle-class driver, R2 = .26, F(9, 68) = 2.65, p = .01, the pattern of significant predictors remained the same. The regression model on blame of the middle-class driver, R2 = .07, F(8, 69) = 0.69, p = .70, did not reveal any significant predictors, all ps > .13.
Regression model predicting blame on rich driver in Study 3.
Predictors of attitudes
To complement the previous studies, we analyzed the relationships between implicit attitudes and explicit attitudes toward each wealth group, and between attitudes and demographic information. We ran four regression models, one on each attitude measure, that included all three other attitude measures, SES indicators (household income, individual income, education), and political orientation. These analyses yielded no significant predictors of implicit attitudes toward the rich or middle class. The regression model on prorich explicit attitudes, R2 = .39, F(7, 70) = 6.47, p < .001, revealed that explicit attitudes toward the rich were predicted by pro-middle-class explicit attitudes, b* = 0.32, p = .002, sr2 = .09; household income, b* = 0.21, p = .051, sr2 = .03; and conservatism, b* = 0.41, p < .001, sr2 = .16. Pro-middle-class explicit attitudes, R2 = .24, F(7, 70) = 3.17, p = .006, were predicted by prorich explicit attitudes, b* = 0.40, p = .002, sr2 = .11, and lower levels of educational attainment, b* = −0.26, p = .02, sr2 = .06.
Supplemental analyses
Limiting our sample to only middle-class-identified participants, (n = 64), we find identical patterns of results. Participants explicitly expressed positive attitudes toward the middle class, M = 5.59, SD = 1.06, t(63) = 12.01, p < .001, 95% CI of the difference between mean and midpoint [1.32, 1.85] and attitudes toward the rich did not differ from neutral, M = 4.10, SD = 1.38, t(63) = 0.59, p = .56, 95% CI of the difference between mean and midpoint [−0.24, 0.45]. Participants were significantly more positive about the middle class than the rich, t(63) = 7.95, p < .001, 95% CI of the difference between means [1.11, 1.86]. Results from the SC-IATs demonstrate that participants had positive implicit associations with the middle class, M = 0.12, SD = 0.33, t(63) = 2.97, p = .004, 95% CI of the difference between mean and zero [0.04, 0.20], as well as positive implicit associations with the rich, M = 0.21, SD = 0.30, t(63) = 5.64, p < .001, 95% CI of the difference between mean and zero [0.14, 0.29], although in this sample these two means were not significantly differently from each other, t(63) = 1.59, p = .12, 95% CI of the difference between means [−0.02, 0.21].
Our results about the influence of implicit attitudes on blame judgments also held in this sample; in the regression model predicting blame on the rich driver, R2 = .30, F(8, 55) = 2.88, p = .009, the only attitude measure that predicted judgments about the rich was implicit attitudes toward the rich, such that implicit positivity toward the rich predicted less blame on the rich driver, b* = −0.31, p = .010, sr2 = .09. The model also revealed that greater blame on the rich driver was predicted by lower levels of education, b* = −0.26, p = .035, sr2 = .06, and higher conservatism, b* = 0.32, p = .01, sr2 = .09. In the regression model on blame on the middle-class driver, R2 = .10, F(8, 55) = 0.76, p = .64, there were no significant predictors, all ps > .14.
Discussion
Study 3 demonstrates that implicit prorich attitudes, which are significantly more positive than pro-middle-class attitudes, are a unique predictor of leniency when evaluating a rich person’s behavior, and neither implicit attitudes toward the middle class nor explicit wealth attitudes predict such judgments. To our knowledge, this is the first study to show that implicit wealth attitudes, as assessed by any form of implicit association task, have an impact on subsequent social judgments. Understanding the impact of positive implicit attitudes toward the rich on evaluations of their actions, even when explicit attitudes generally appear negative, can help illuminate one psychological factor that compounds the material advantages that the rich enjoy in society.
We note, however, that more positive attitudes toward the middle class did not predict greater leniency for the middle-class target. One possibility is that in our vignette the symbols of being rich (e.g., a Jaguar automobile) are particularly distinctive, and thus salient, while the information indicating middle-class status (e.g., a Corolla) was much less distinctive (i.e., the Corolla is quite common; Automotive World, 2013), and thus likely much less salient. Although participants encoded the targets’ relative wealth, based on the manipulation check, the relatively lower salience of the middle-class symbols may have made people’s pro-middle-class attitudes less accessible and thus less impactful when evaluating the middle-class driver, consistent with previous work showing that accessibility influences which target dimensions and attitudes will influence judgments (Young & Fazio, 2013). A second possibility is that the middle-class driver may have been seen by our participants as belonging to a different social class (e.g., lower class), and thus judgments of the target would not be expected to reflect pro-middle-class attitudes.
Future research might thus consider refining the stimuli used to examine wealth bias. Specifically, it would be beneficial to conceptually replicate the current findings using standardized vignettes about wrongdoing with better scales to assess the blame placed on the upper and middle-class targets. It would also be valuable to expand upon the range of situations presented to participants generally (e.g., looking at judgments of rich individuals who exhibit morally neutral or positive behaviors) to better understand how implicit attitudes regulate favoritism and discrimination in everyday life. Similarly, our initial investigation specifically aimed to assess the influence of attitudes in a stereotype-neutral scenario and future work could extend our findings to look at how explicit and implicit wealth stereotypes affect social judgments. For example, the upper class is stereotyped as being “cold” (Fiske et al., 2002), and it would be interesting to see whether upper class individuals also benefit from favoritism when they engage in stereotype-consistent cold, negative behavior—in other words, would an upper class person who ignores a request for help be disliked less than a middle-class person who did the same thing? These initial findings showing that implicit wealth attitudes can lead to favoritism open up many new avenues for research about how people evaluate others with different amounts of wealth.
General Discussion
Although wealth is an objectively continuous dimension, attitudes toward the rich, middle class, and poor are distinct and elicit distinct social evaluations. Across three experiments, we demonstrate support for our hypotheses that people have explicit preferences for the middle class over the rich (Hypothesis 1a), and that this relative preference is likely driven by positive evaluations of the middle class (Hypothesis 1b). Additionally, our research demonstrates implicit preferences for the rich over the middle class (Hypothesis 2a), which are distinct from an implicit dislike for the poor (Hypothesis 3b), and which result from positive middle-class implicit attitudes (Hypothesis 2b) but even more positive prorich implicit attitudes (Hypothesis 2c). Moreover, in Study 3 implicit, but not explicit, attitudes toward the rich predicted judgments about reckless driving by a rich person (Hypothesis 4).
Our main findings about the valence of implicit and explicit wealth attitudes were robust to replication across the three studies. We are happy to conform to advice from Roediger (2012) who offers the simple directive that, “Researchers should always, whenever possible, replicate a pattern of results before publishing it” (“A Tale of Two Studies,” para. 1). However, one limitation present in this set of studies is that our explicit measures probed participants’ attitudes using only two of the lexical items from the implicit attitudes measures; thus, it is possible that the divergent attitudes seen across studies actually stem from differential responses to specific lexical items. A more thorough investigation of implicit and explicit wealth attitudes using a wider range of measures would offer additional insight into this new area of research. A second limitation to the generalizability of our results is that our participants were American, predominantly White, and predominantly identified as middle class, although there was some variation in reported income in our samples; these participants may have specific social and cultural experiences that shape their wealth attitudes. It would be beneficial to replicate our studies with participants from a wider range of nationalities, races, and social classes in order to see if our observed patterns of implicit and explicit wealth attitudes are also present in other populations.
Compared to other types of intergroup attitudes, attitudes toward the rich have an uncommon structure in which implicit attitudes are relatively positive, despite the fact that our participants generally do not self-identify as members of this social group or express explicit positivity about this group. In addition to differing in valence (prorich implicit but seemingly neutral explicit) and in how well they predict judgments of rich targets, implicit and explicit attitudes toward the rich appear to be relatively independent from one another. As research in other domains shows, it is not unusual for there to be a modest correlation between implicit and explicit attitudes toward a social group (e.g., implicit and explicit racial attitudes are typically correlated in the range of .15 to .25; Dovidio et al., 2001; Hofmann et al., 2005). Yet, in only one of our samples (Study 2) did we observe a significant relationship between explicit and implicit preferences. Interestingly, this sample had a fairly high average income, both relative to the other samples and relative to the average U.S. income, although still predominantly self-identified as middle class. As income was only sometimes related to implicit attitudes (Study 1a) and explicit attitudes (Studies 1b and 3), future work that directly examines how income levels, as well as other factors that are related to income level, shape implicit as well as explicit attitudes would help us further understand the nature of wealth attitudes and how they form. Similarly, future work could also include more fine-grained measures of participants’ SES beyond their income, such as asking about participants’ parents’ income, education, and homeownership. Beyond examining differences in objective SES, it would be interesting to examine the role of wealth group identification; for example, examining whether attitudes vary among those who identify as middle class depending on the strength of identification with the middle class, and also testing whether the patterns observed in our samples generalize to those who identify as members of the upper or lower classes.
One possibility for why explicit and implicit attitudes differ from one another in valence is that they may have different ontogenetical origins, as has been proposed in the study of racial attitudes. Baron and Banaji (2006) found that young White children had relatively negative attitudes toward Blacks both implicitly and explicitly, while older children had similar negative implicit racial biases but, presumably because of their recognition of egalitarian values, expressed less bias explicitly. In terms of evaluations of the rich, children appear to develop prowealth attitudes at a relatively early age (Horwitz et al., 2014; Olson et al., 2012) and these prowealth associations may persevere implicitly, while explicit attitudes toward the rich may become more negative through exposure to adults’ attitudes, media portrayals, or prevalent cultural messages.
It would also be beneficial to better understand what messages about wealth children, teenagers, and adults, are exposed to over development, and which ones are able to shape explicit versus implicit attitudes. In the United States, people may be exposed to a variety of different messages about the value of various social groups, for example, being wealthy is often both exalted and condemned by the media (Kendall, 2011), which may influence wealth attitudes. Similarly, American culture notably embraces the notion of meritocracy to explain how and why people have different amounts of wealth, and these beliefs about root causes of wealth groups could shape wealth attitudes (Cozzarelli et al., 2001; K. B. Smith & Stone, 1989). Future studies could experimentally manipulate these factors in order to see whether they impact subsequent wealth attitudes or, alternatively, another way to examine the role of these cultural messages would be to examine wealth attitudes in cultures that have different wealth-related beliefs and values. For example, in countries where having a great deal of wealth is associated with high levels of corruption and immorality, people may have more extreme negative evaluations of the rich at both explicit as well as implicit levels.
Over the course of development and throughout adulthood, people may also learn about their own place in the wealth hierarchy, aspire to change their status, and view this change as more or less possible. Because membership in wealth categories is seen as changeable, in contrast to fixed categories such as race or gender, or attributes such as age, which are destined to change but are not controllable, the factors shaping wealth attitudes are likely unique from those shaping attitudes toward other commonly studied types of groups. Notably, people’s perceptions about their own economic reality are often not accurate, and Americans tend to underestimate the disparities between wealth groups as well as overestimate upward social mobility (DiPrete, 2007; Kraus & Tan, 2015; Norton & Ariely, 2011). Additionally, not only do many Americans believe it possible to become wealthier, they also aspire to it, a phenomenon that may be present universally but particularly strong in America (Dittmar, 2007; Kasser et al., 2007). Perceptions about one’s current and future position in the wealth hierarchy could shape social group attitudes. For example, if people believe that they will be rich in the future, they may feel positively about the rich because they are seen as a “future ingroup.” In this case, we might expect that people’s explicit attitudes would remain unchanged as people know, explicitly, what group they belong to, but wealth aspirations may affect implicit attitudes, which can be influenced by personal connections with outgroups (Phills, Kawakami, Tabi, Nadolny, & Inzlicht, 2011; Todd, Bodenhausen, Richeson, & Galinsky, 2011). This idea could be fruitfully explored by manipulating people’s perceptions of their own upward mobility and measuring subsequent attitude changes.
Our initial investigation into wealth attitudes also fosters larger theoretical questions about how and why certain continuous dimensions, such as wealth, are divided into social categories that then become the basis for biased social evaluations while other dimensions do not (e.g., weight but not height). As past research has shown that the use of group labels can trigger processes that produce intergroup biases, even on dimensions that were previously irrelevant (e.g., overestimators, underestimators; Diehl, 1990; Patterson & Bigler, 2006), the common use of labels to describe people’s wealth level may help explain why certain categories influence social evaluations. Future research might ask about how less commonly labeled categories, such as “upper middle class,” “lower middle class,” or “working class” also elicit positive or negative evaluations and whether individuals from these categories are the recipients of discrimination or favoritism. Such work might find that commonly used labels are particularly important for the development of implicit evaluations, which can form after repeated exposure to pairings between a group label and positive or negative stimuli (De Houwer, Thomas, & Baeyens, 2001; Walther, Nagengast, & Trasselli, 2005), but that the development of explicit group evaluations may not require frequent use of the group labels.
Additional consideration should be given to the potential importance of distinctions within wealth categories, as well as between different wealth groups. In the current studies we assessed attitudes toward wealth categories at a very broad, abstract level, but future work could examine attitudes toward rich subtypes, which are subordinate categories that have distinct representations and thus may elicit unique evaluations (Brewer, Dull, & Lui, 1981). One study suggests that rich subtypes based on how people acquire their wealth (entrepreneur vs. inheritance vs. lottery winner) influence perceptions of their personality (Christopher et al., 2005). Depending on how wealth attitudes form, these subcategories might also elicit different patterns of evaluations implicitly and explicitly. For instance, people may have generally positive implicit attitudes toward wealthy people because of early positive associations, but explicit views about the legitimacy of economic disparities may lead people to explicitly favor those people who earned their wealth (i.e., if this is seen as legitimate) while expressing negativity toward those who inherited it (i.e., if this is seen as illegitimate). Alternatively, if implicit wealth preferences stem from seeing the rich as a “future ingroup” (e.g., for people who want to be rich one day), implicit subgroup preferences may instead align with people’s own potential pathways to wealth. That is, people who play the lottery may like those who receive a windfall more than those who amassed wealth through earnings, whereas those who aspire to become wealthy through their work may have more positive attitudes toward people who earned their wealth, compared to those who inherited it or won the lottery.
Understanding implicit and explicit wealth attitudes can help illuminate psychological processes that advantage the rich in ways that promote wealth inequality. Because people do not explicitly favor the rich, and because these are the attitudes that people are aware of and can verbalize, the general public may not be particularly concerned about favoritism of the rich. However, the work here is an initial step in demonstrating that people’s implicit attitudes favor the rich and have the potential to elicit biased judgments in at least one type of situation. As work in other domains has shown that implicit bias influences social judgments in many domains, such as healthcare, and hiring (Jost et al., 2009), we should be aware that the implicit wealth bias identified here likely has the potential to influence judgments in many domains as well. Research on cumulative advantage has shown that what initially seems like a “small” divergence from equal treatment can have snowballing effects and result in large disparities, for example a slight sex preference in hiring and promotion decisions can lead to a very skewed workforce (Martell, Lane, & Emrich, 1996). With these cumulative processes in mind, those who wish to bring about a more equal society should be aware of the challenges posed by biased wealth attitudes.
Footnotes
Appendix
Funding
This research was supported in part by a National Science Foundation Graduate Research Fellowship to the first author.