
Abstract
Recent years have witnessed a widespread rise of right-wing populism—an ideology maintaining that the will of the people is supreme, but is subverted by antagonistic elites. Drawing on uncertainty-identity theory, three studies (total N = 5,882) tested the hypothesis that uncertainty would only strengthen support for populism among low authoritarian respondents. Studies 1 and 2 were secondary analyses of American National Election Survey (ANES) 2012 and 2016 data. They supported our key hypotheses in explaining support for the populist American Tea Party (Study 1, N = 1,917), and support for right-wing populist ideology and voting preference for Donald Trump rather than Hillary Clinton (Study 2, N = 2,520). Study 3 (N = 1,445) experimentally manipulated self-uncertainty to allow a causal interpretation, and focused on right-wing populist ideology. The results are discussed in terms of their contribution to uncertainty-identity theory, and their societal relevance in an environment of growing populism.
A wave of right-wing populism has changed the political landscape in the United States and elsewhere in the world (Bos et al., 2018; Nai & Maier, 2018), and populist tactics are widely deployed as an election strategy to garner popular support (Ernst et al., 2017). The risk and promise of populist strategies seem clear when considering some of the most high-profile political events in recent years, including the U.K.’s 2016 Brexit referendum, the 2016 U.S. national election, and the widespread success of populist parties and leaders across Europe (Nai & Maier, 2018).
In this article, we develop a psychological motivational account of the processes responsible for this shift in voter preferences towards right-wing populist leaders and their messages. We focus on human motivational and personality dynamics that, in certain circumstances, make populist leaders and messages attractive. Specifically, in three studies involving a total of 5,882 participants, we explore and show how people’s feelings of uncertainty, ultimately about themselves and their social identity in society, occupy just such a motivational role. Drawing on uncertainty-identity theory (Hogg, 2007, 2012, 2014, 2021a), we argue that an important factor driving support for populism and populist ideology is the aversive self-related uncertainty that structural flux arouses in people. Such uncertainty needs to be managed, and such management is effectively achieved by identification with a distinctive and clearly defined identity.
We propose that uncertainty accounts for the shift in attitude for those who would not otherwise support right-wing populism, thereby explaining some of the macro-level shifts in political behavior. Aversive self-uncertainty leads individuals to seek leaders who appear strong and decisive, and causes populist leaders to appear more attractive to people who are not normally swayed by such characteristics. Identification reduces and helps people manage their self-related uncertainty. For individuals who already support right-wing populist rhetoric, such as those who score high on authoritarianism, uncertainty matters less.
In the following, we briefly review the literature on populism and our relevant psychological factors. We then present our approach and hypotheses, which combine an individual difference perspective on authoritarianism with the social-identity-based approach of uncertainty-identity theory.
Defining Populism
Apart from the academic value in exploring the antecedents of populism (Bougher, 2017), the fact that populism is associated with xenophobia, intergroup hostility, autocracy, and erosion of democratic institutions (Ernst et al., 2017) makes the study of antecedents important for society. Increased support for populism elevates the risk of more extreme political behavior in the future, including illegal activism and violence (Iyengar et al., 2012; Rogowski & Sutherland, 2016). However, defining populism is not straightforward.
Attempts at defining populism have been described as suffering from an “inherent incompleteness” (Taggart, 2004), and many different approaches now exist. Some argue that in contrast to what are called “thick” ideologies in society, such as liberalism and socialism, populism can be described as a “thin” ideology. We define thin ideology as a collection of ideas rather than a complete integrated framework through which events are given meaning. Thin ideology exists both on the left and the right (Ernst et al., 2017; Mudde, 2017), thus preventing populism to be a priori defined as a phenomenon of the right. Other researchers have argued that we should not understand populism as a political ideology at all, but rather a style of political rhetoric (Bonikowski & DiMaggio, 2016) or discourse tied to the notion of discursive frames (Aslanidis, 2016; Hawkins & Kaltwasser, 2018). In this paper, we limit our focus to right-wing populism, which we define as having two components: (a) the perceived sovereignty of the people and (b) the perception of an antagonistic “system” or “elite” that the people are in opposition to. Importantly, populism is different from extremism in so far as extremist views can be framed in populist terms (if the response to the antagonistic entity involves, for example, political violence), but populism does not necessarily include calls for extreme or radical action, and vice versa (Gøtzsche-Astrup et al., 2020; Hogg & Gøtzsche-Astrup, 2021).
While our definition fits the concept of thin ideology (Ernst et al., 2017), it does not preclude an understanding of populism as a discursive structure or populist frame (Hawkins & Kaltwasser, 2018). In our conceptualization (also see Hogg & Gøtzsche-Astrup, 2021), proponents of populist ideology present themselves as the guarantors of the people’s will, and as strong leaders who can protect and promote popular sovereignty and the people’s will, despite attempts by antagonistic groups to thwart this will (Jagers & Walgrave, 2007).
The Populist Voter
Sociostructural and individual psychology including personality dispositions are relevant to understanding the etiology of populism. Research has often explored populist parties, such as the emergence of the United States Tea Party (e.g., Mead, 2011), and the personalities of populist leaders such as Donald Trump (e.g., Nai & Maier, 2018). In this paper, we focus on the reasons why ordinary citizens come to support populist leaders.
Several causes of populism have been proposed, for example, economic uncertainty (Kakkar & Sivanathan, 2017) and status threat (Mutz, 2018). We do not oppose these explanations, but rather seek to add to the story. One explanation for these varying accounts may be that there is no one populist voter. According to the congruency model of political preference (Caprara & Zimbardo, 2004), voters tend to support political candidates with personality traits that match their own. For example, in a large cross-country study, low agreeableness predicted support for European populist parties (Bakker et al., 2016).
Other studies have pointed to the importance of authoritarianism in explaining support for autocratic and dominant leaders (Adorno et al., 1950; Altemeyer, 1998). Passini (2017) argues that the present rise in right-wing populist parties has elements of the rise of fascist ideology in Europe in the first half of the 20th century. In Altemeyer’s (1998) conceptualization, authoritarianism denotes a triad of submission to authorities, aggression towards “outsiders,” and adherence to conventional norms. Duckitt et al. (2010), later replicated by Passini (2017), found empirical support for the notion that authoritarianism can be broken down into these three subdimensions. Authoritarianism is positively related to conformity, tradition, and prejudice, and negatively related to universalism, benevolence, and self-direction (Ludeke et al., 2018; Passini, 2017).
People with relatively authoritarian personalities may, for a variety of reasons, support and endorse populist ideologies and leadership, and thus contribute to an apparent rise in populism. However, the rise of populism may also create a social environment in which people become more authoritarian—much as Pettigrew argued in his classic analysis of prejudice (Pettigrew, 1958; also see Reynolds et al., 2001).
Self-Uncertainty and Populism
We propose that the factors implied in the literature share a common psychological element of self-related uncertainty—as opposed to other kinds of psychological uncertainty—as a central situation-dependent determinant of support for populist ideology and populist leaders, and that it may explain the processes through which other factors lead people to support right-wing populism (Hogg & Gøtzsche-Astrup, 2021).
Building on facets of social identity theory (Turner et al., 1987; also see Hogg, 2018b; Hogg et al., 2017), uncertainty-identity theory (Hogg, 2007, 2012, 2021a) argues that feelings of uncertainty about one’s self and identity in society, and about perceptions, feelings, and behaviors that reflect on one’s self-concept, motivate self-uncertainty reduction. One of the most effective ways to reduce self-uncertainty is to identify with, and define oneself in terms of the attributes of, a social group. A meta-analysis of 35 studies involving 4,657 participants found that self-uncertainty accounted for significant variance in group identification, explaining as much as 6.8% of variance, depending on research paradigm and on how uncertainty and identification were operationalized (Choi & Hogg, 2020).
An extension of this research argues that highly entitative groups that are distinctive and well-structured and have a clearly defined, unambiguous, and consensual identity are better at reducing uncertainty. Under uncertainty, people are driven to identify with such groups (e.g., Hogg et al., 2007). This lays the foundation for an important development of uncertainty-identity theory—under uncertainty, people are particularly attracted to more extreme groups and to authoritarian leaders who provide a simple and unambiguous message about the group’s distinctive identity (e.g., Hogg, 2014, 2018a, 2021b; Hogg & Adelman, 2013; also see Hogg & Wagoner, 2017; Rast & Hogg, 2017).
Uncertainty strengthens endorsement of and identification with more radical and extreme groups (e.g., Hogg & Adelman, 2013; Hogg et al., 2010); enhances political and identity polarization (e.g., Gaffney et al., 2014); and strengthens people’s need for leadership per se (e.g., Rast et al., 2012), particularly for leaders who are autocratic (e.g., Rast et al., 2013). While the link between self-related uncertainty and authoritarianism has been suggested (e.g., Hogg & Adelman, 2013), and other kinds of uncertainty (such as electoral uncertainty and economic uncertainty) are related to authoritarianism, we do not know of studies looking at the triad of uncertainty, authoritarianism, and populism (but see Hogg & Gøtzsche-Astrup, 2021, for a theoretical discussion).
The Present Research
We propose that situationally induced self-related uncertainty combines with authoritarianism to lead people to support and identify with populist groups and identities, and to support populist leaders. No study has yet (a) explicitly focused on populism as strictly defined and characterized in the relevant literature discussed above while (b) considering how personality, specifically authoritarianism, might interact with situational uncertainty to predict populism.
The current research addresses these lacunae by investigating the effect of uncertainty and authoritarianism on support for right-wing populism. Informed by the congruency model of political preference, we hypothesized (H1) that high authoritarianism predicts support for populist ideology and populist leaders. We expect to replicate the positive association between authoritarianism and support for populist leaders and populist ideology. From uncertainty-identity theory, we hypothesized (H2) that high uncertainty, motivating individuals to seek a way to manage it, drives support for populist ideology and populist leadership. However, we also hypothesized (H3) that this effect is stronger for people with middle or low authoritarianism, who would not otherwise support populism. In other words, we expect uncertainty to explain the shift to populism by those who would not otherwise support it. In contrast, people high in authoritarianism may already support populism and therefore be relatively unaffected by situational factors that increase self-uncertainty. In essence, we predict a “ceiling effect” of uncertainty. From the findings that uncertainty tends to create a shift towards more decisive leadership and strong norms, we do not expect an opposite “floor effect” among those with lower authoritarianism.
The last two hypotheses speak to the process through which support for populism comes about. The aversive experience of self-uncertainty motivates attempts to lessen it. One way of doing so is by adopting a right-wing populist narrative of being a victimized populace demonized by an outgroup elite. This narrative paints the individual’s uncertainties as the result of unjust outside interference, absolving the individual from responsibility for their own situation and lessening uncertainty.
We tested these hypotheses in three studies. We chose the U.S. context as the focus for our research. Much of the recent literature on populism investigates the United States, and our definition of right-wing populism is drawn from American studies. Recent scholarly and general interest in populism is influenced by developments in the United States, most importantly the 2016 U.S. presidential election. Furthermore, because our theory concerns ordinary citizens broadly understood, it was important to use highly representative samples. The American National Election Studies (ANES) offer large-sample, representative, high-quality secondary samples of American citizens that fit our purpose.
Study 1 investigated the impact of uncertainty and authoritarianism on support for a right-wing populist political movement, the Tea Party, in the 2012 U.S. national elections, using data from the 2012 ANES dataset. Study 2 investigated uncertainty and authoritarianism as predictors of support for populist ideology and for a right-wing populist leader, Donald Trump, using ANES data from the 2016 U.S. national election. Study 3 used original data representative of the U.S. adult population to remedy the limitations of the first two studies. In it, we measured authoritarianism and experimentally manipulated levels of uncertainty to investigate their effect on preference for populist political candidates and populist ideology.
Study 1
Method
Study 1 was a secondary data analysis of survey data from the 2012 ANES web-based time series study. The data were collected between October 2012 and January 2013, and the survey asked a range of questions concerning electoral participation, voting behavior, and public opinion. Details of recruitment and a complete list of variables are available in the ANES (2014) user’s guide and codebook.
From the survey, our focal predictor variables were measures relating to (a) uncertainty and (b) authoritarianism, and our key criterion measure was attitude towards the populist Tea Party, which has been described as representing the most prominent populist movement during the 2012 election (Akkerman et al., 2014; Aslanidis, 2016). As controls, we included a measure of Big Five personality traits to control for other personality variation than authoritarianism. Furthermore, as we do not focus on party identification or socioeconomic status per se, we included controls for political ideology as well as age, gender, and education.
Participants
The sample comprised 1,917 U.S. citizens aged 18 or older. There were 1,016 men (53.0%) and 901 women, with an mean age of 41.7 years (SD = 13.1). The majority (70.1%) self-identified as White, with 11.9% Black, 11.1% Hispanic, and 2.9% Asian. In relation to education level, 57.5% reported having a high school but no university qualification, 23.5% had a bachelor’s degree, and 14.0% had a graduate degree.
Measures
Uncertainty
Self-uncertainty is characterized as uncertainty related to an individual’s self, identity, place in the world, and future. No scale in the ANES targeted this specifically. However, guided by existing literature, we constructed an approximate six-item index to capture the individual’s experience of self-related uncertainty. In constructing this index, we drew on the literature positing economic uncertainty (Kakkar & Sivanathan, 2017) and status threat (Mutz, 2018) to be central to populism, and our theoretical proposition that self-related uncertainty plays a central part in this link.
Participants reported how worried they were about (a) their current financial situation, (b) their ability to pay for healthcare in the near future, (c) their current health, (d) their financial status now compared to a year ago, (e) their financial status in a year’s time, and (f) their job/employment security (1 = not at all, 5 = extremely; α = .62, M = 2.55, SD = 0.69). Importantly, all questions were related to self-uncertainty rather than structural factors such as the economy as a whole, the job market, or the healthcare sector. Research has shown that these indirect indices of self-uncertainty map onto feelings of self-uncertainty (Hogg & Mahajan, 2018), generally affect behavior as predicted by uncertainty-identity theory (Choi & Hogg, 2020), and have been used previously (Gøtzsche-Astrup, 2019).
An exploratory factor analysis was conducted on the 2012 data. Only one factor had an eigenvalue greater than unity, and factor loadings were all positive and greater than .30. The average interitem covariance of .31 is within the recommended range for shorter scales (Briggs & Cheek, 1986; Clark & Watson, 1995). While the alpha reliability coefficient was low at .62, removing any one item from the index did not improve reliability. This limitation was a necessary trade-off in enabling the use of the large and highly representative ANES sample, and is remedied in the third study, where we experimentally prime uncertainty. Furthermore, as the indicators are formative rather than reflexive of uncertainty, there is no principal issue with low reliability, as items are thought to each influence uncertainty rather than reflect the underlying construct. Using the 2016 dataset, we conducted a confirmatory factor analysis (CFA) using the six items as manifest indicators of the latent factor of uncertainty. Using Hu and Bentler’s (1999) two-index approach, the fit indices were acceptable (TLI = 0.95, SRMR = .03, RMSEA = .05, CFI = .98).
Authoritarianism
Although the 2012 ANES study did not include direct measures of authoritarianism as conceptualized above, it did include measures of traditionalism and authoritarian submission, two dimensions of authoritarianism (Duckitt & Bizumic, 2013). There were four items where participants indicated what attributes were more important for a child to have ((1) independence or (3) respect for elders, (1) curiosity or (3) good manners, (1) obedience or (3) self-reliance, (1) being considerate or (3) well behaved; scored 1 to 3, with 2 indicating no preference), and four statements measuring support for tradition (moral flexibility, new lifestyles, moral tolerance, traditional family ties; 1 = disagree strongly, 5 = agree strongly). All items were coded such that 1 indicated low authoritarianism, and 5 high authoritarianism.
An exploratory factor analysis on these eight measures revealed a single factor with an eigenvalue greater than unity (eigenvalue = 1.90), which accounted for 62% of variance and loaded with factor loadings greater than .30 (.41–.66) on all but one item (factor loading of .24). An authoritarianism index was constructed from these eight items (α = .67, M = 3.37, SD = 0.86). While this measure may be less valid than longer, direct measures of authoritarianism (e.g., Duckitt et al., 2010), the psychometrics were acceptable, and Studies 2 and 3 remedy this limitation.
Populism
Populism was measured using a 100-point “feeling thermometer” on which participants indicated how they would rate their attitude toward the Tea Party (0 = very unfavorable, 100 = very favorable; M = 41.63, SD = 27.39). Although using a single-item response as the dependent variable can be criticized, feeling thermometers have been used as indicators of support for parties in previous research (e.g., Abramowitz & Webster, 2018). We take caution not to overinterpret the results, and in Study 2 we triangulate our findings by operationalizing our populism concept through voting intentions and a composite populist ideology index.
Big Five personality traits
The Big Five personality traits were assessed with the short Ten Item Personality Inventory (TIPI), which measures each of the five personality traits (extraversion, agreeableness, conscientiousness, neuroticism, openness) using two items (Gosling et al., 2003). Each item present two practically synonymous descriptors (e.g., “critical, quarrelsome”), and respondents rate how well they think the pair of descriptors describe them (1 = extremely poorly, 7 = extremely well). This short form is strongly correlated with longer measures of Big Five personality traits (Gosling et al., 2003). Interitem correlations within scales, and scale means and standard deviations were as follows: extraversion (r = .29, M = 4.13, SD = 1.27), agreeableness (r = .17, M = 5.13, SD = 1.09), conscientiousness (r = .37, M = 5.61, SD = 1.13), neuroticism (r = .36, M = 3.05, SD = 1.23), openness (r = .24, M = 4.85, SD = 1.14).
Political ideology
Political ideology was measured with the question “Generally speaking, do you think of yourself as a Democrat, a Republican, or an independent?” Respondents who answered “Democrat” or “Republican” were asked if they considered themselves strong or not very strong Democrats or Republicans. Those who answered “independent” were asked whether they were closer to Democrats or Republicans. The response categories were recomputed and combined into a single 7-point scale (1 = strong Democrat, 7 = strong Republican; M = 3.50, SD = 2.10).
Analysis and Results
We conducted hierarchical linear regressions to investigate whether uncertainty and authoritarianism explained support for and positive feelings towards the Tea Party over and above the Big Five personality traits, political ideology, age, and gender. Table 1 displays correlations between the independent variables and controls, and Table 2 displays the results of the regression analysis. At Step 1 (Model 1), we entered age, gender, political ideology, and the Big Five personality constructs (neuroticism, extraversion, openness, agreeableness, and conscientiousness); at Step 2 (Model 2), we entered authoritarianism; at Step 3 (Model 3), uncertainty; and at Step 4 (Model 4), the interaction of uncertainty and authoritarianism.
Unweighted correlations (Pearson’s r) between predictor variables and controls: Study 1.
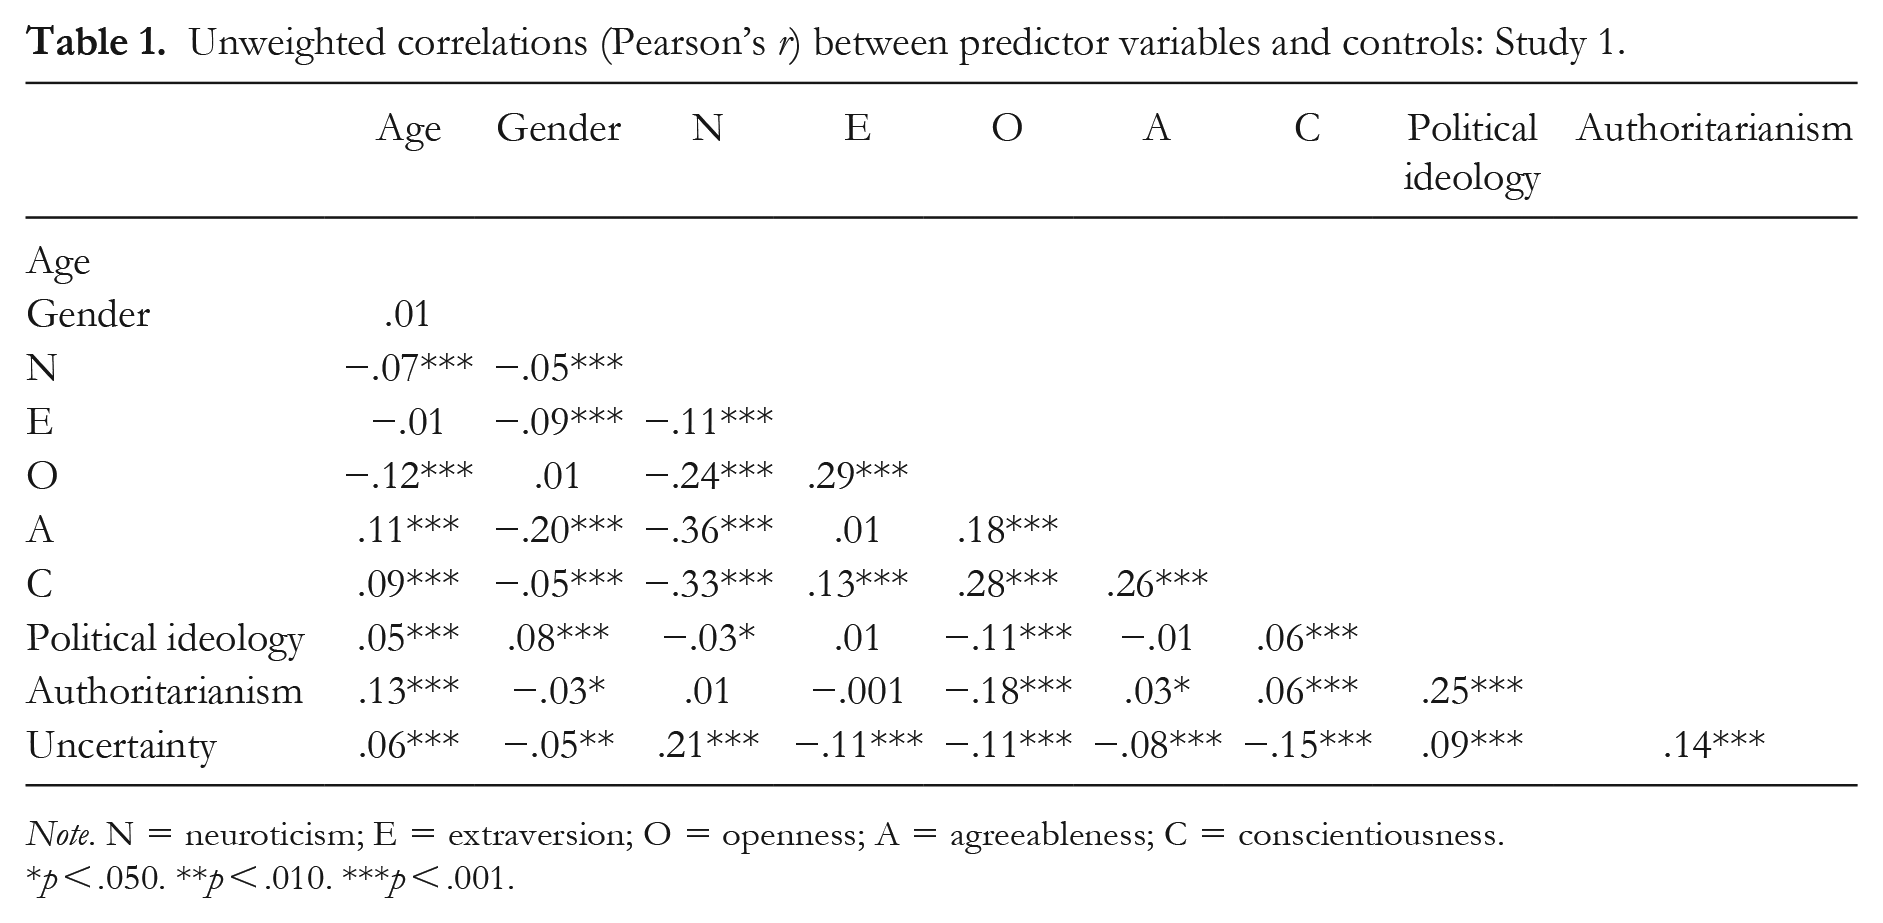
Note. N = neuroticism; E = extraversion; O = openness; A = agreeableness; C = conscientiousness.
p < .050. **p < .010. ***p < .001.
Hierarchical linear regression predicting feeling thermometer support for the Tea Party: Study 1.
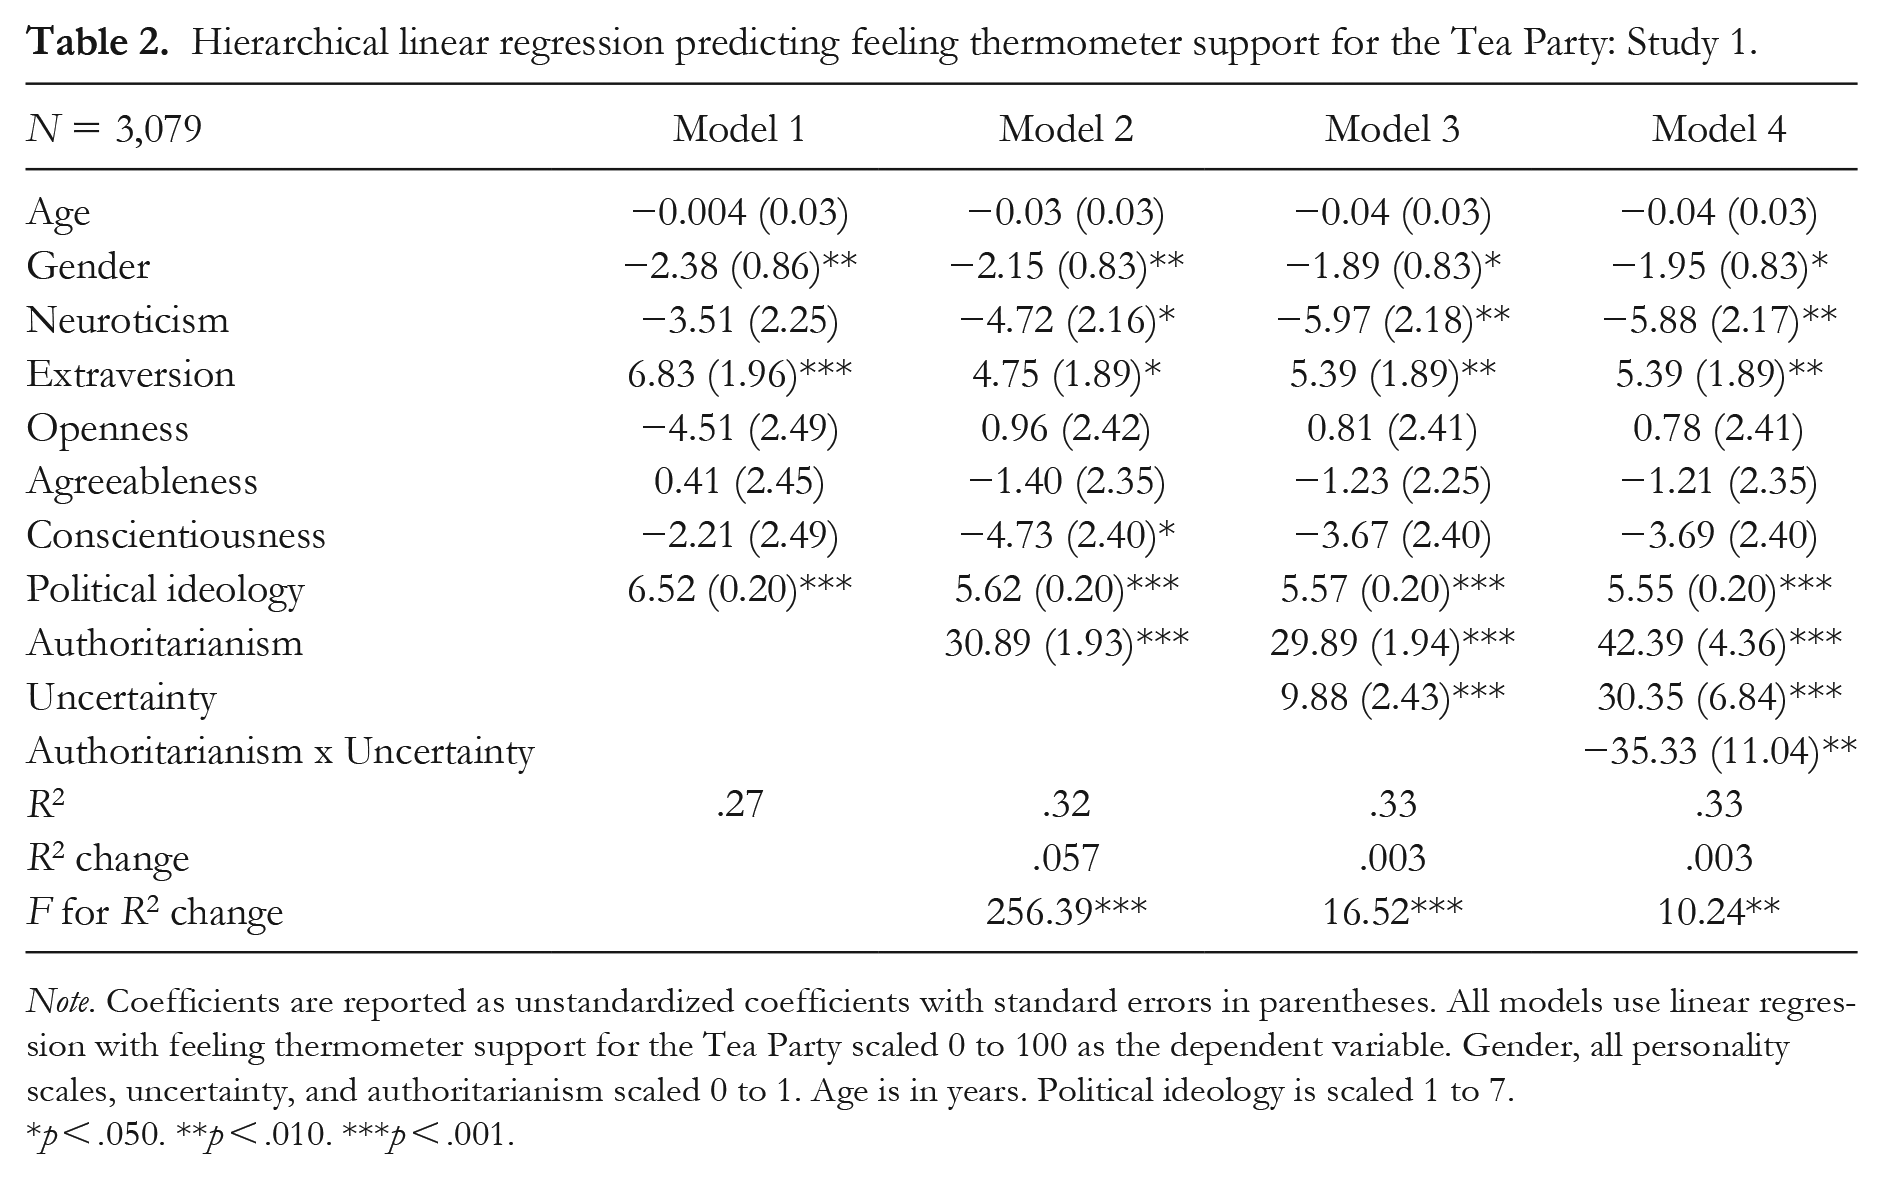
Note. Coefficients are reported as unstandardized coefficients with standard errors in parentheses. All models use linear regression with feeling thermometer support for the Tea Party scaled 0 to 100 as the dependent variable. Gender, all personality scales, uncertainty, and authoritarianism scaled 0 to 1. Age is in years. Political ideology is scaled 1 to 7.
p < .050. **p < .010. ***p < .001.
As predicted under H1, authoritarianism significantly predicted support for the Tea Party over and above personality and political ideology (β = .25, t = 16.01, p < .001, 95% CI [27.10, 34.67]). As predicted under H2, uncertainty statistically significantly predicted support for the Tea Party over and above personality, political ideology, and authoritarianism (β = .06, t = 4.06, p < .001, 95% CI [5.11, 14.64]). Greater uncertainty was positively related to stronger support for the Tea Party, as were higher levels of authoritarianism and stronger identification as a conservative. The model that included authoritarianism and uncertainty explained additional variance in Tea Party support.
The two-way interaction between authoritarianism and uncertainty was also significant (β = −.18, t = −3.20, p = .001, 95% CI [−56.98, −13.68]). This indicates, as predicted under H3, that as authoritarianism increases, uncertainty becomes a weaker predictor. The predicted support for the Tea Party at different levels of uncertainty and authoritarianism are plotted in Figure 1. Increased uncertainty was significantly associated with increased support for the Tea Party among low authoritarians 2 (β = .15, t = 4.73, p < .001) and 1 (β = .11, t = 5.16, p < .001) SDs below the mean, as well as at the mean of authoritarianism (β = .06, t = 3.89, p < .001), but not among high authoritarian participants 1 (β = .01, t = 0.55, p = .586) or 2 (β = −.04, t = −1.04, p = .297) SDs above the mean (Figure 1a). Higher authoritarianism was associated with greater support for the Tea Party under low uncertainty 2 SDs below the mean (β = .32, t = 10.39, p < .001), at the mean (β = .22, t = 14.57, p < .001), and at high uncertainty 2 SDs above the mean (β = .12, t = 3.63, p < .001; Figure 1b). Effect sizes, as measured by incremental change in variance explained, were small.
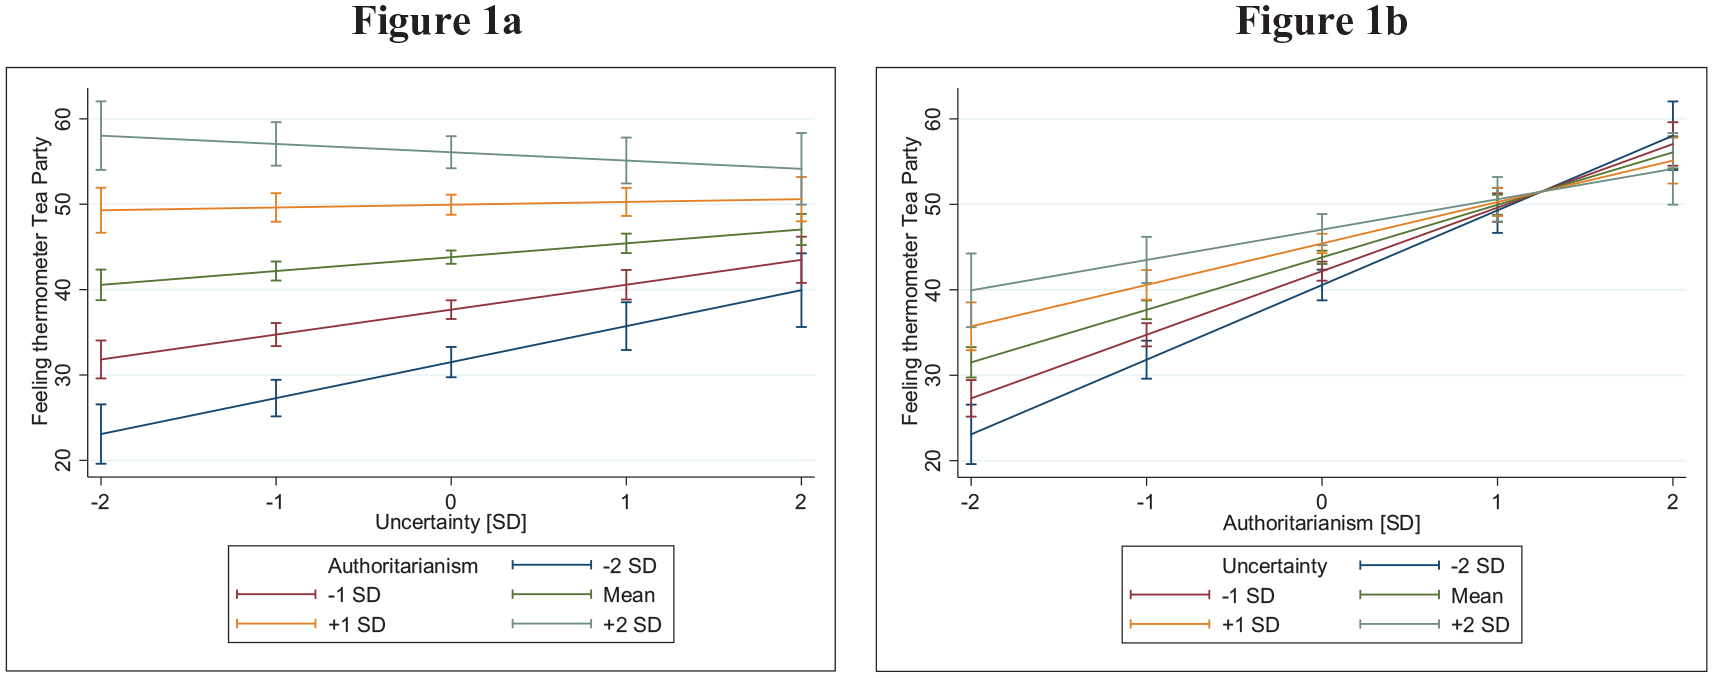
Figure 1a shows the marginal relationship between uncertainty and support for the Tea Party at 5 different values of authoritarianism(-2SD, -1SD, M, +1SD, +2SD), and Figure 1b plots the marginal relationship between authoritarianism and the feeling thermometer score for the Tea Party at 5 different values of uncertainty (-2SD, -1SD, M, +1SD, +2SD): Study 1.
Discussion
While Study 1 provided support for the hypothesized relationships in H1 to H3 in a highly population-representative sample, it is limited by measuring only a populist movement and not populist ideology as such. Furthermore, the dependent variable consisted of a single score on the feeling thermometer. We therefore conducted Study 2 to replicate Study 1’s results and to more precisely measure populism by including support for populist leadership.
Study 2
Method
Study 2 was a secondary data analysis of survey data from the 2016 ANES. Data were collected between November 2016 and January 2017. As for the 2012 ANES, the survey asked a range of electoral participation, voting behavior, and public opinion questions. It also asked questions that enable more valid operationalizations of authoritarianism and populism than Study 1. Further details of the recruitment and interviewing procedure are summarized in the methodology report for the ANES 2016 Time Series Study (DeBell et al., 2018).
Our focus in Study 2 was again measures related to (a) uncertainty and (b) authoritarianism. Our key criterion measures were (a) populist attitudes and (b) voting for Donald Trump rather than Hillary Clinton in the 2016 U.S. presidential election. Controls were measures of the Big Five personality traits, political ideology, age, gender, and education.
Participants
Our sample comprised 2,520 U.S. citizens aged 18 or older. There were 1,301 men (51.6%) and 1,219 women, with an mean age of 42.3 years (SD = 14.7). A majority (68.7%) self-identified as White, while 10.9% identified as Black, 11.8% as Hispanic, and 3.1% as Asian. In terms of education level, 56.7% reported not having a university qualification, 25.4% had a bachelor’s degree, and 17.9% had a graduate degree.
Measures
Uncertainty
Uncertainty was measured using the same six-item index as in Study 1. The mean uncertainty score (1 = not at all, 5 = extremely) was 2.53 (SD = 0.67, α = .55). As reported for the uncertainty measure in Study 1, a CFA indicated acceptable fit indices.
Authoritarianism
In contrast to Study 1, the 2016 ANES included a three-item direct measure of authoritarianism. Participants were asked to indicate their agreement with three statements: (a) “The country would be great if everyone honored the ways of their forefathers, submitted to authority, and got rid of ‘rotten apples,’” (b) “The country needs free thinkers that defy traditional ways” (reverse-scored), and (c) “The country needs a strong, determined leader to crush evil and take the country back on the ‘true’ path” (1 = disagree strongly, 5 = agree strongly; α = .63, M = 2.90, SD = 0.91). While reliability was lower than the ideal, it is not unreasonable given the very short three-item measure of a complex construct. In Study 3, we remedy this limitation by using a longer scale (Duckitt et al., 2010).
Populism
Populism was measured in two ways: with an index of populist ideology and by self-reported voting for Donald Trump rather than Hillary Clinton in the 2016 U.S. presidential election. In line with the definition of right-wing populism described above (the perceived sovereignty of the people and the existence of an antagonistic system), the populism index was constituted by three statements: (a) “Compromise in politics is selling out on one’s principles,” (b) “A strong leader in government is good for the US, even if the leader bends the rules to get things done,” and (c) “The will of the majority should prevail over the rights of minorities” (1 = disagree strongly, 5 = agree strongly; α = .50, M = 2.80, SD = 0.84). Despite a low coefficient of α = .50, the average interitem correlations for these three items were .35, between the values of .20 and .40 acceptable for small scales (Briggs & Cheek, 1986). We conducted an exploratory factor analysis (principal components) to further investigate the individual items. A single factor emerged, with loadings on the three items between .42 and .48.
Big Five personality traits
The Big Five personality traits were assessed as in Study 1, with the TIPI. Interitem correlations within scales, and scale means and standard deviations were as follows: extraversion (r = .36, M = 4.24, SD = 1.37), agreeableness (r = .21, M = 5.15, SD = 1.14), conscientiousness (r = .37, M = 5.70, SD = 1.11), neuroticism (r = .39, M = 3.03, SD = 1.26), openness (r = .24, M = 5.11, SD = 1.11).
Political ideology
Political ideology was measured as in Study 1. Participants had a mean score of 3.80 (SD = 2.10; 1 = strong Democrat, 7 = strong Republican).
Analysis and Results
Table 3 displays the correlations between the independent variables and controls in the study. Table 4 displays the results of the regression analyses. At Step 1 (Model 1), we entered education, political ideology, age, gender, and the Big Five personality constructs; at Step 2 (Model 2), we entered authoritarianism; at Step 3 (Model 3), uncertainty; and at Step 4 (Model 4), the interaction of uncertainty and authoritarianism.
Unweighted correlations (Pearson’s r) between predictor variables and controls: Study 2.
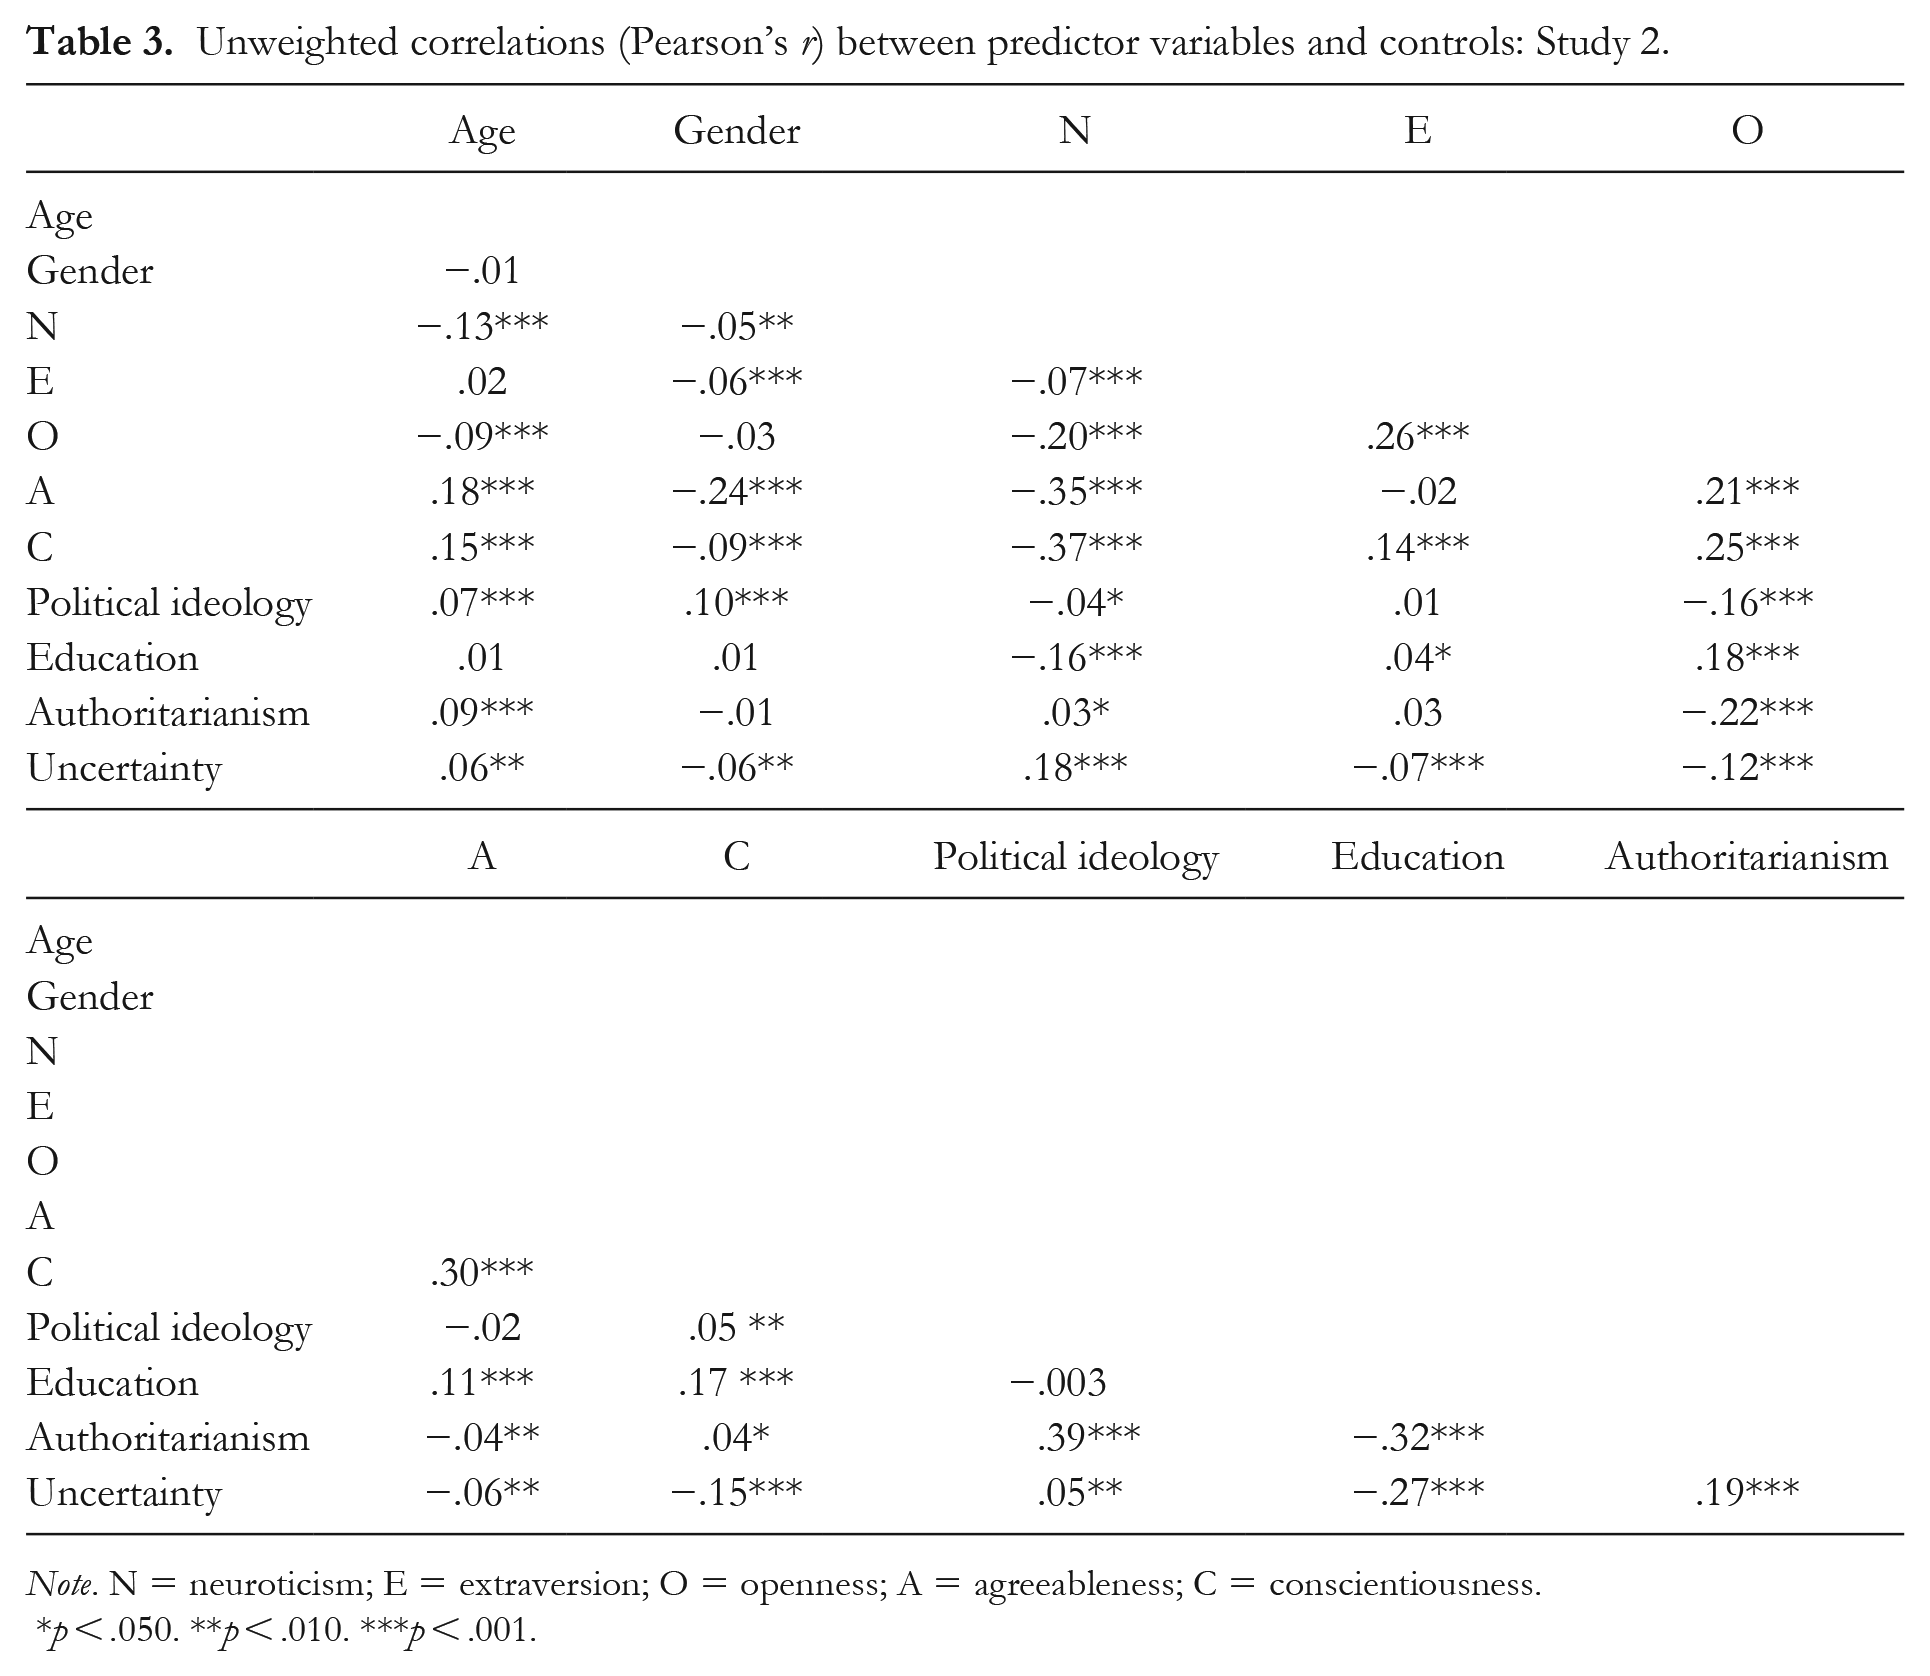
Note. N = neuroticism; E = extraversion; O = openness; A = agreeableness; C = conscientiousness.
p < .050. **p < .010. ***p < .001.
Results of hierarchical linear regression predicting score on populism: Study 2.
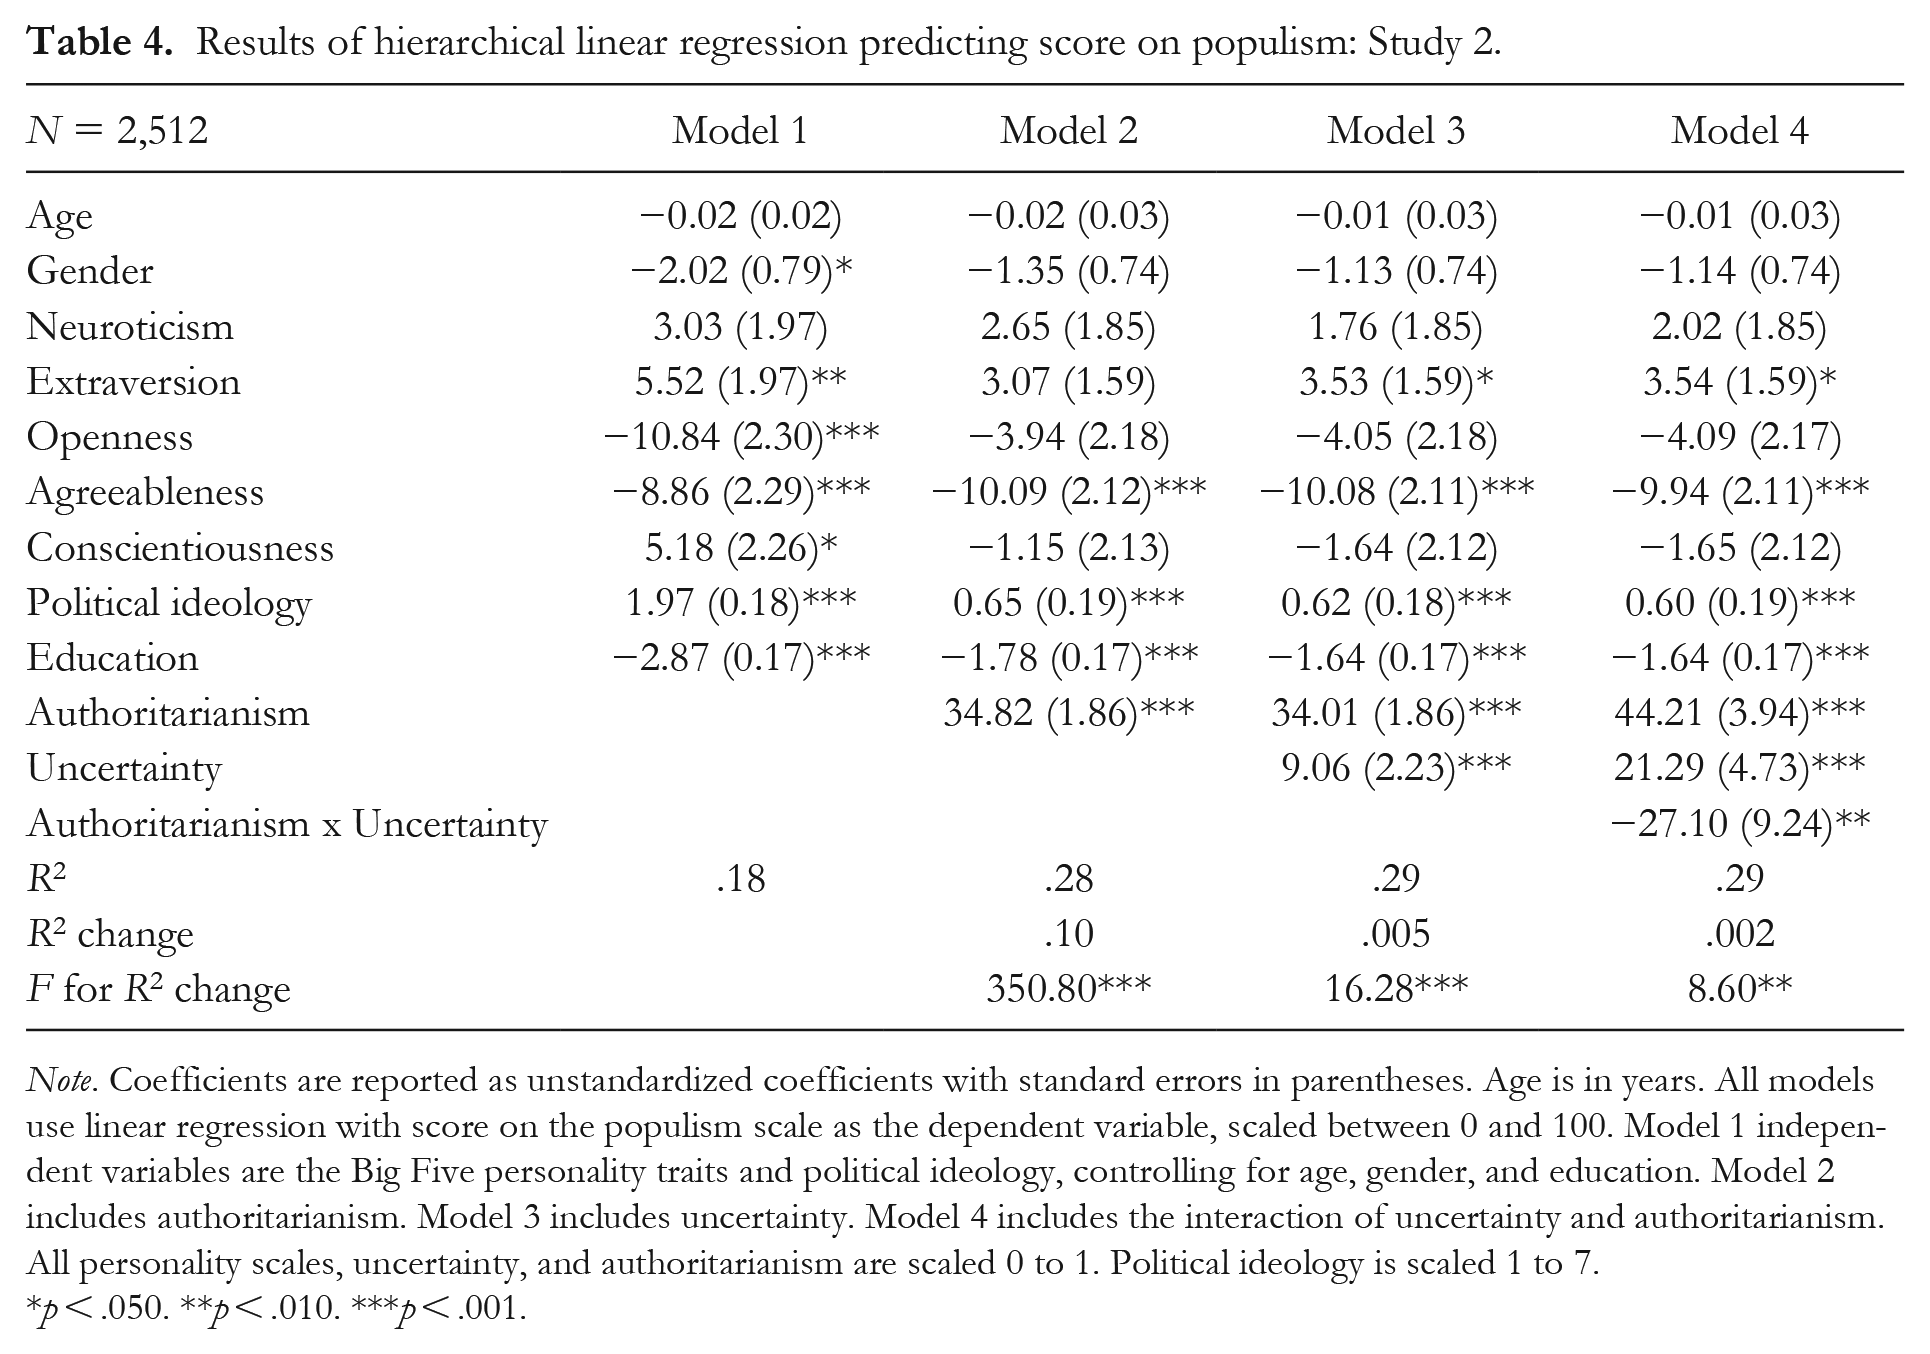
Note. Coefficients are reported as unstandardized coefficients with standard errors in parentheses. Age is in years. All models use linear regression with score on the populism scale as the dependent variable, scaled between 0 and 100. Model 1 independent variables are the Big Five personality traits and political ideology, controlling for age, gender, and education. Model 2 includes authoritarianism. Model 3 includes uncertainty. Model 4 includes the interaction of uncertainty and authoritarianism. All personality scales, uncertainty, and authoritarianism are scaled 0 to 1. Political ideology is scaled 1 to 7.
p < .050. **p < .010. ***p < .001.
The results were substantially identical to Study 1. As predicted under H1, authoritarianism predicted higher populism score (β = .37, t = 18.73, p < .001, 95% CI [31.17, 38.46]); and as predicted under H2, uncertainty significantly predicted populism over and above demographics, partisan identity, personality, and authoritarianism (β = .07, t = 4.03, p < .001, 95% CI [4.66, 13.46]). Greater uncertainty was related to stronger support for populist ideology.
Again, as predicted under H3, authoritarianism and uncertainty interacted to effect populism (β = −.17, t = −2.93, p = .003, 95% CI [−45.22, −8.99]). Higher uncertainty was significantly associated with increased support for populism among low authoritarians 2 (β = .20, t = 5.55, p < .001) and 1 (β = .15, t = 6.50, p < .001) SDs below the mean, as well as at the mean of authoritarianism (β = .10, t = 5.60, p < .001), but not among high authoritarian participants 1 (β = .05, t = 1.85, p = .065) or 2 (β = −.004, t = −0.11, p = .911) SDs above the mean (Figure 2a). Higher authoritarianism was associated with greater support for populism under low uncertainty 2 SDs below the mean (β = .53, t = 13.67, p < .001), at the mean (β = .42, t = 21.84, p < .001), and at high uncertainty 2 SDs above the mean (β = .32, t = 8.02, p < .001; Figure 2b). The results support all three of our hypotheses. Effect sizes were again small.
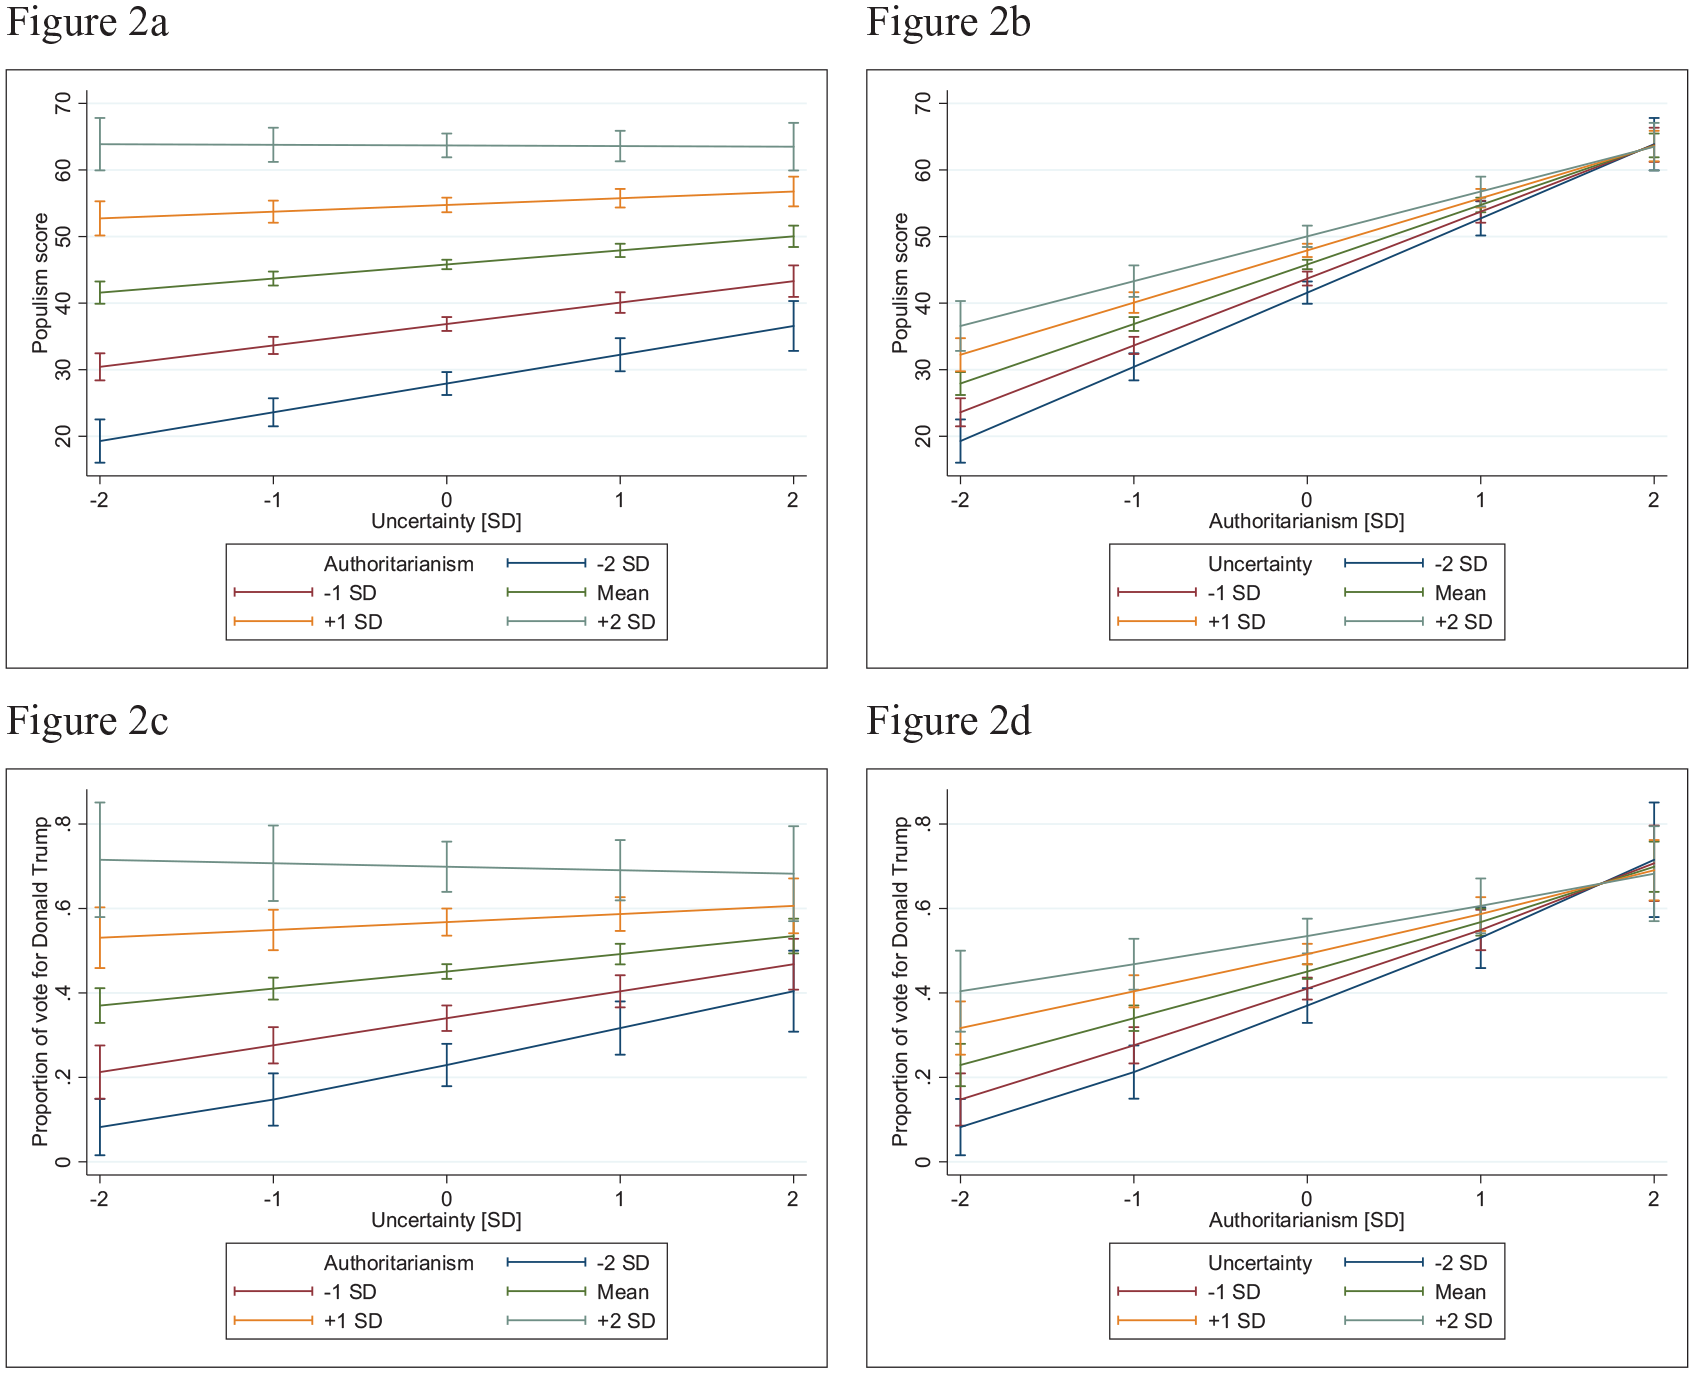
Figure 2a indicates the marginal relationship between uncertainty and populism score at 5 values of authoritarianism (-2SD, -1SD, M, +1SD, +2SD); Figure 2b indicates the marginal relationship between authoritarianism and uncertainty at 5 levels of uncertainty (-2SD, -1SD, M, +1SD, +2SD); Figure 2c plots the marginal relationship between uncertainty and the predicted proportion of vote for Donald Trump at 5 values of authoritarianism (-2SD, -1SD, M, +1SD, +2SD); Figure 2d plots the marginal relationship between authoritarianism and the predicted proportion of the vote for Donald Trump at 5 values of uncertainty (-2SD, -1SD, M, +1SD, +2SD). Study 2.
In our second analysis, we tested if our hypotheses were supported using reported voting behavior as the criterion. Using binomial logistic regression, we contrasted casting one’s vote for Donald Trump rather than for Hillary Clinton. We contrasted these two choices since the relevant literature indicates that Donald Trump was viewed as more populist than Hillary Clinton (Visser et al., 2017). Table 5 displays the results. The variables entered in Steps 1 to 4 (Models 1–4) are the same as in the first analysis.
Results of hierarchical logistic regression predicting voting for Donald Trump over Hillary Clinton: Study 2.
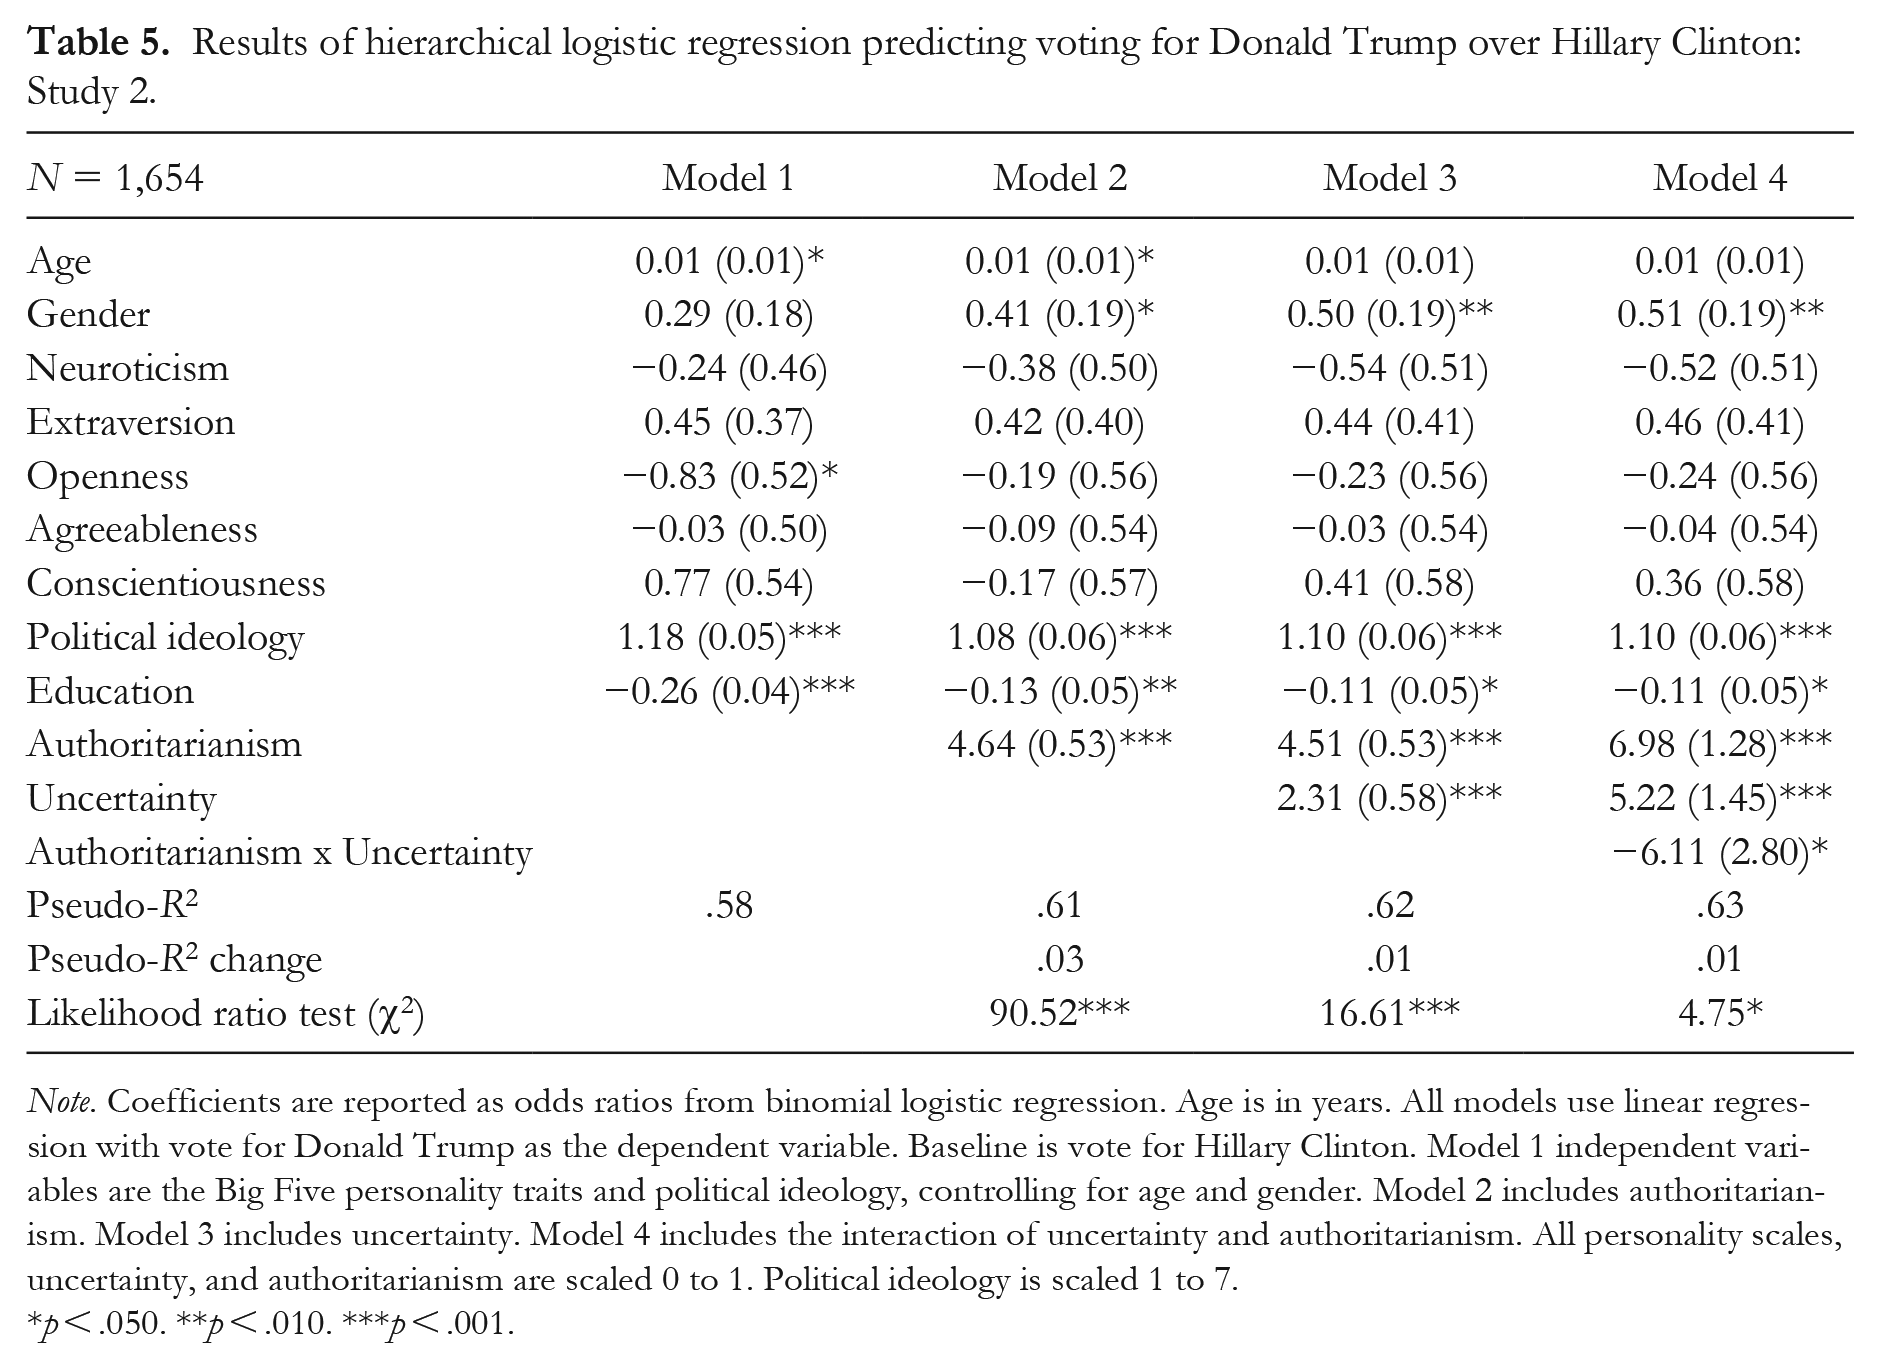
Note. Coefficients are reported as odds ratios from binomial logistic regression. Age is in years. All models use linear regression with vote for Donald Trump as the dependent variable. Baseline is vote for Hillary Clinton. Model 1 independent variables are the Big Five personality traits and political ideology, controlling for age and gender. Model 2 includes authoritarianism. Model 3 includes uncertainty. Model 4 includes the interaction of uncertainty and authoritarianism. All personality scales, uncertainty, and authoritarianism are scaled 0 to 1. Political ideology is scaled 1 to 7.
p < .050. **p < .010. ***p < .001.
The results of the binomial logistic regression conform to the pattern observed for support for the Tea Party and for populist ideology. In general, Donald Trump voters scored 15.5 points higher than Hillary Clinton on the populism measure (SE = 0.83, p < .001). Those who scored higher on authoritarianism were more likely to vote for Donald Trump than for Hillary Clinton, even after controlling for political ideology. One standard deviation increase in authoritarianism corresponded to an almost threefold increase in the likelihood of voting for Donald Trump (OR = 2.87, z = 8.82, p < .001, 95% CI [3.61, 5.67]). Higher uncertainty increased the likelihood of voting for Donald Trump over and above the other factors (OR = 1.48, z = 4.02, p < .001, 95% CI [1.18, 3.44]). Again, the interaction between authoritarianism and uncertainty was significant and negative (OR = 0.79, z = −2.18, p = .029, 95% CI [−11.60, −0.62]).
The results of the two hierarchical analyses, using the populism score and the likelihood of casting a vote for Donald Trump (rather than for Hillary Clinton) are represented graphically in Figure 2. One standard deviation increase in uncertainty was significantly associated with an increased likelihood of voting for Donald Trump among low authoritarians 2 (8.37 percentage points, z = 4.13, p < .001) and 1 (6.64 percentage points, z = 4.61, p < .001) SDs below the mean, as well as at the mean of authoritarianism (4.03 percentage points, z = 4.46, p < .001), but not among high authoritarian participants 1 (1.87 percentage points, z = 1.23, p = .220) or 2 (−0.82 percentage points, z = −0.29, p = .769) SDs above the mean (Figure 2c). Higher authoritarianism was associated with greater likelihood of voting for Donald Trump under low uncertainty 2 SDs below the mean (12.01 percentage points, z = 7.20, p < .001), at the mean (8.84 percentage points, z = 10.46, p < .001), and at high uncertainty 2 SDs above the mean (5.93 percentage points, z = 3.36, p = .001; Figure 2d).
Discussion
In Study 2, we again found support for our hypotheses H1 to H3. The fitted model shows that the difference can be substantial. However, the study was cross-sectional. Therefore, Study 3 was designed to address the question of causality.
Study 3
Method
Our Study 3 measured authoritarianism and experimentally manipulated uncertainty to examine the effects on support for populism. Data were collected in the United States in June and July of 2018 by an international survey panel company.
The predictor variables were (a) primed uncertainty and (b) measured authoritarianism, and our key criterion measure was populist ideology. After giving informed consent to participate, participants provided demographic information and completed a short personality measure and a measure of authoritarianism. They were then randomly assigned to a condition in which they were presented with a short prime designed to either increase or to decrease self-uncertainty. Finally, participants completed a six-item measure of support for populist ideology and a manipulation check, and were debriefed and thanked for participating.
Power analysis
To estimate the number of participants needed, we conducted a power analysis using an alpha level of .05, a power of .90, and a small expected effect size (f = .10), which yielded a minimum sample size of 1,422.
Participants
Participants were 1,445 U.S. citizens aged 18 or older, sampled from a web-based panel to be representative of the population on age, gender, and U.S. region. There were 721 men (50.0%) and 724 women, with an mean age of 43.62 years (SD = 15.36). Participants were given the option to indicate one or more races of which they considered themselves to be; 1,174 identified as White, 156 as Black, 65 as Asian, 11 as Pacific Islander, and 68 as other; 69 participants identified with at least two categories. In terms of education level, 51.9% reported having no university qualification, 25.3% had a bachelor’s degree, and 12.0% had a graduate degree.
Measures
Uncertainty
Uncertainty was experimentally primed using a two-stage procedure adapted from Goldman and Hogg (2016) and widely used in uncertainty-identity theory research (for a meta-analysis [35 studies, 4,657 participants], see Choi and Hogg (2020). Participants were asked to spend some time thinking about the things that made them most uncertain/certain about themselves, their lives, and their future. Then they were asked to write down the three things that made them feel most uncertain/certain about themselves, their lives, and their future. Although this is a conventional priming technique, we also administered a simple check on the prime at the very end of the study. Participants were asked to indicate how uncertain they felt (1 = not very much, 7 = very much).
Authoritarianism
We measured authoritarianism using the six-item short-form measure from Duckitt et al.’s (2010) Authoritarianism–Conservatism–Traditionalism Scale. Participants indicated their agreement with six statements (1 = strongly disagree, 5 = strongly agree): (a) “Strong, tough government will harm not help our country” (reverse-coded), (b) “Being kind to loafers or criminals will only encourage them to take advantage of your weakness, so it’s best to use a firm, tough hand when dealing with them”, (c) “Our society does NOT need tougher government and stricter laws” (reverse-coded); (d) “The facts on crime and the recent public disorders show we have to crack down harder on troublemakers, if we are going preserve law and order”, (e) “Our prisons are a shocking disgrace. Criminals are unfortunate people who deserve much better care, instead of so much punishment” (reverse-coded), (f) “‘The way things are going in this country, it’s going to take a lot of “strong medicine” to straighten out the troublemakers, criminals, and perverts.” All items were calibrated such that 1 indicated low authoritarianism, and 5 indicated high authoritarianism (α = .71, M = 3.28, SD = 0.87).
Populism
We constructed a six-item Populism Scale based on the definition of populism described above as a thin ideology. The first three items were statements similar to the ones used to measure populist ideology in Study 2 (the ANES [2016] survey): (a) “What people call compromise in politics is really just selling out on one’s principles”, (b) “Having a strong leader in government is good for my state even if the leader bends the rules to get things done”, and (c) “The will of the majority should always prevail, even over the rights of minorities”. The last three items were new statements: (a) “The interests of the American people should be politicians’ first priority”, (b) “The elites are responsible for most of what is wrong with America today”, and (c) “We should distinguish sharply between the American people and all others”. For all six items participants indicated their agreement on a 7-point scale (1 = disagree strongly, 7 = agree strongly).
An exploratory factor analysis (principal factors) of these six items revealed a factor with an eigenvalue of 2.26 accounting for 38% of the variance, with factor loadings ranging from .32 to .76. We created an overall populism index from all six items (α = .63, M = 4.41, SD = 0.98).
Big Five personality traits
The Big Five personality traits were assessed using the TIPI, as in Studies 1 and 2 and recoded to range from 0–1. Interitem correlations within scales, and scale means and standard deviations were as follows: extraversion (r = .37, M = .44, SD = .44), agreeableness (r = .19, M = .69, SD = .20), conscientiousness (r = .36, M = .77, SD = .20), neuroticism (r = .43, M = .35, SD = .23), openness (r = .16, M = .65, SD = .21).
Political ideology
We asked participants to indicate their position on a 7-point scale (1 = extremely liberal, 4 = moderate: middle of the road, 7 = extremely conservative). Participants had a mean score of 4.01 (SD = 1.64).
The uncertainty prime was, as described above, checked with a single item administered at the very end of the study. To check on the effectiveness of the prime, we conducted a multiple regression analysis regressing the uncertainty manipulation and all the other predictors and covariates onto the uncertainty check. Table 6 shows that the uncertainty prime statistically significantly increased self-reported uncertainty (β = .07, t = 2.60, p = .009). The uncertainty manipulation worked as intended.
Results of the uncertainty manipulation check, including all predictor variables and covariates: Study 3.
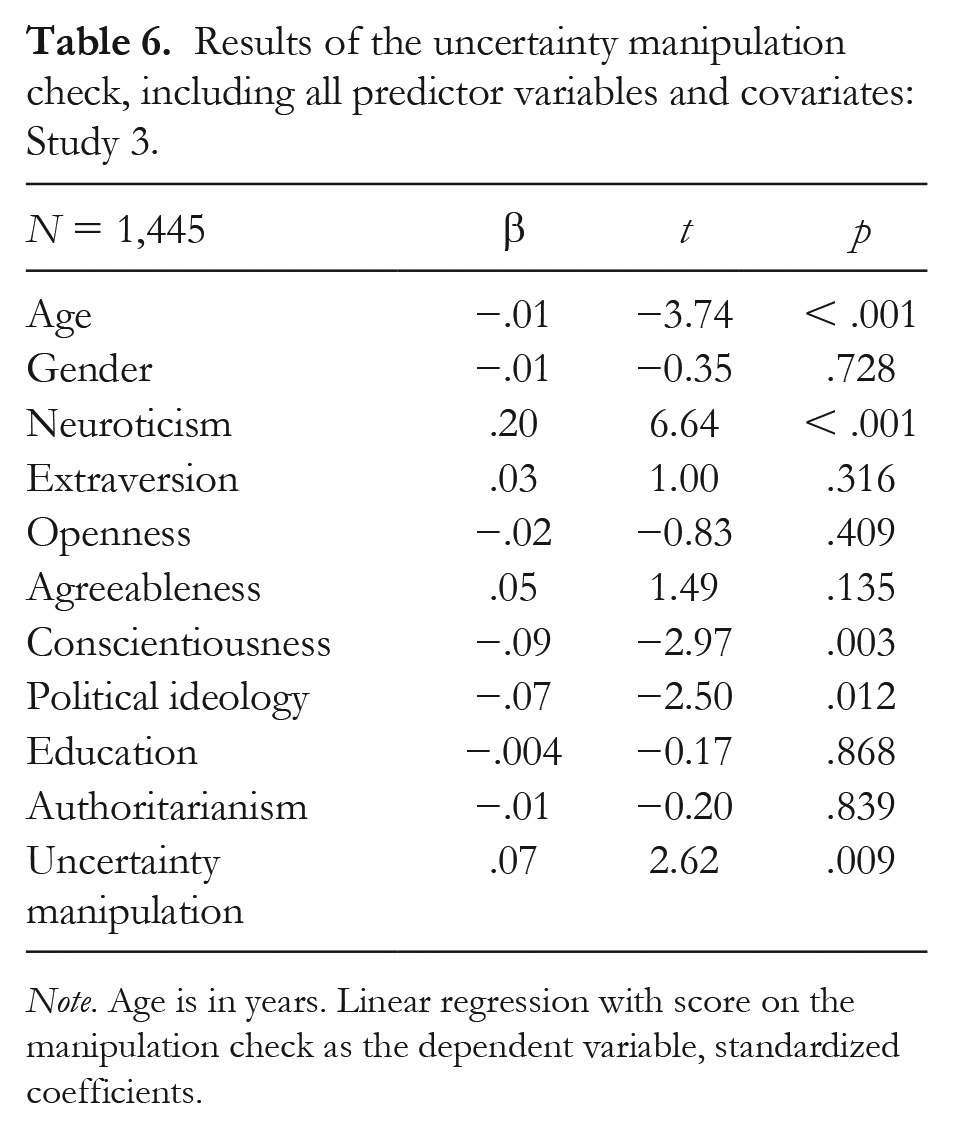
Note. Age is in years. Linear regression with score on the manipulation check as the dependent variable, standardized coefficients.
Analysis and Results
Table 7 displays correlations between the independent variables and controls in Study 3. The main focus of Study 3 was to test H3, the interactive effect of uncertainty and authoritarianism on populism. We also wanted to replicate the findings from Studies 1 and 2 relating to H1 (authoritarianism predicts populism) and H2 (uncertainty predicts populism).
Unweighted correlations (Pearson’s r) between predictor variables and controls: Study 3.
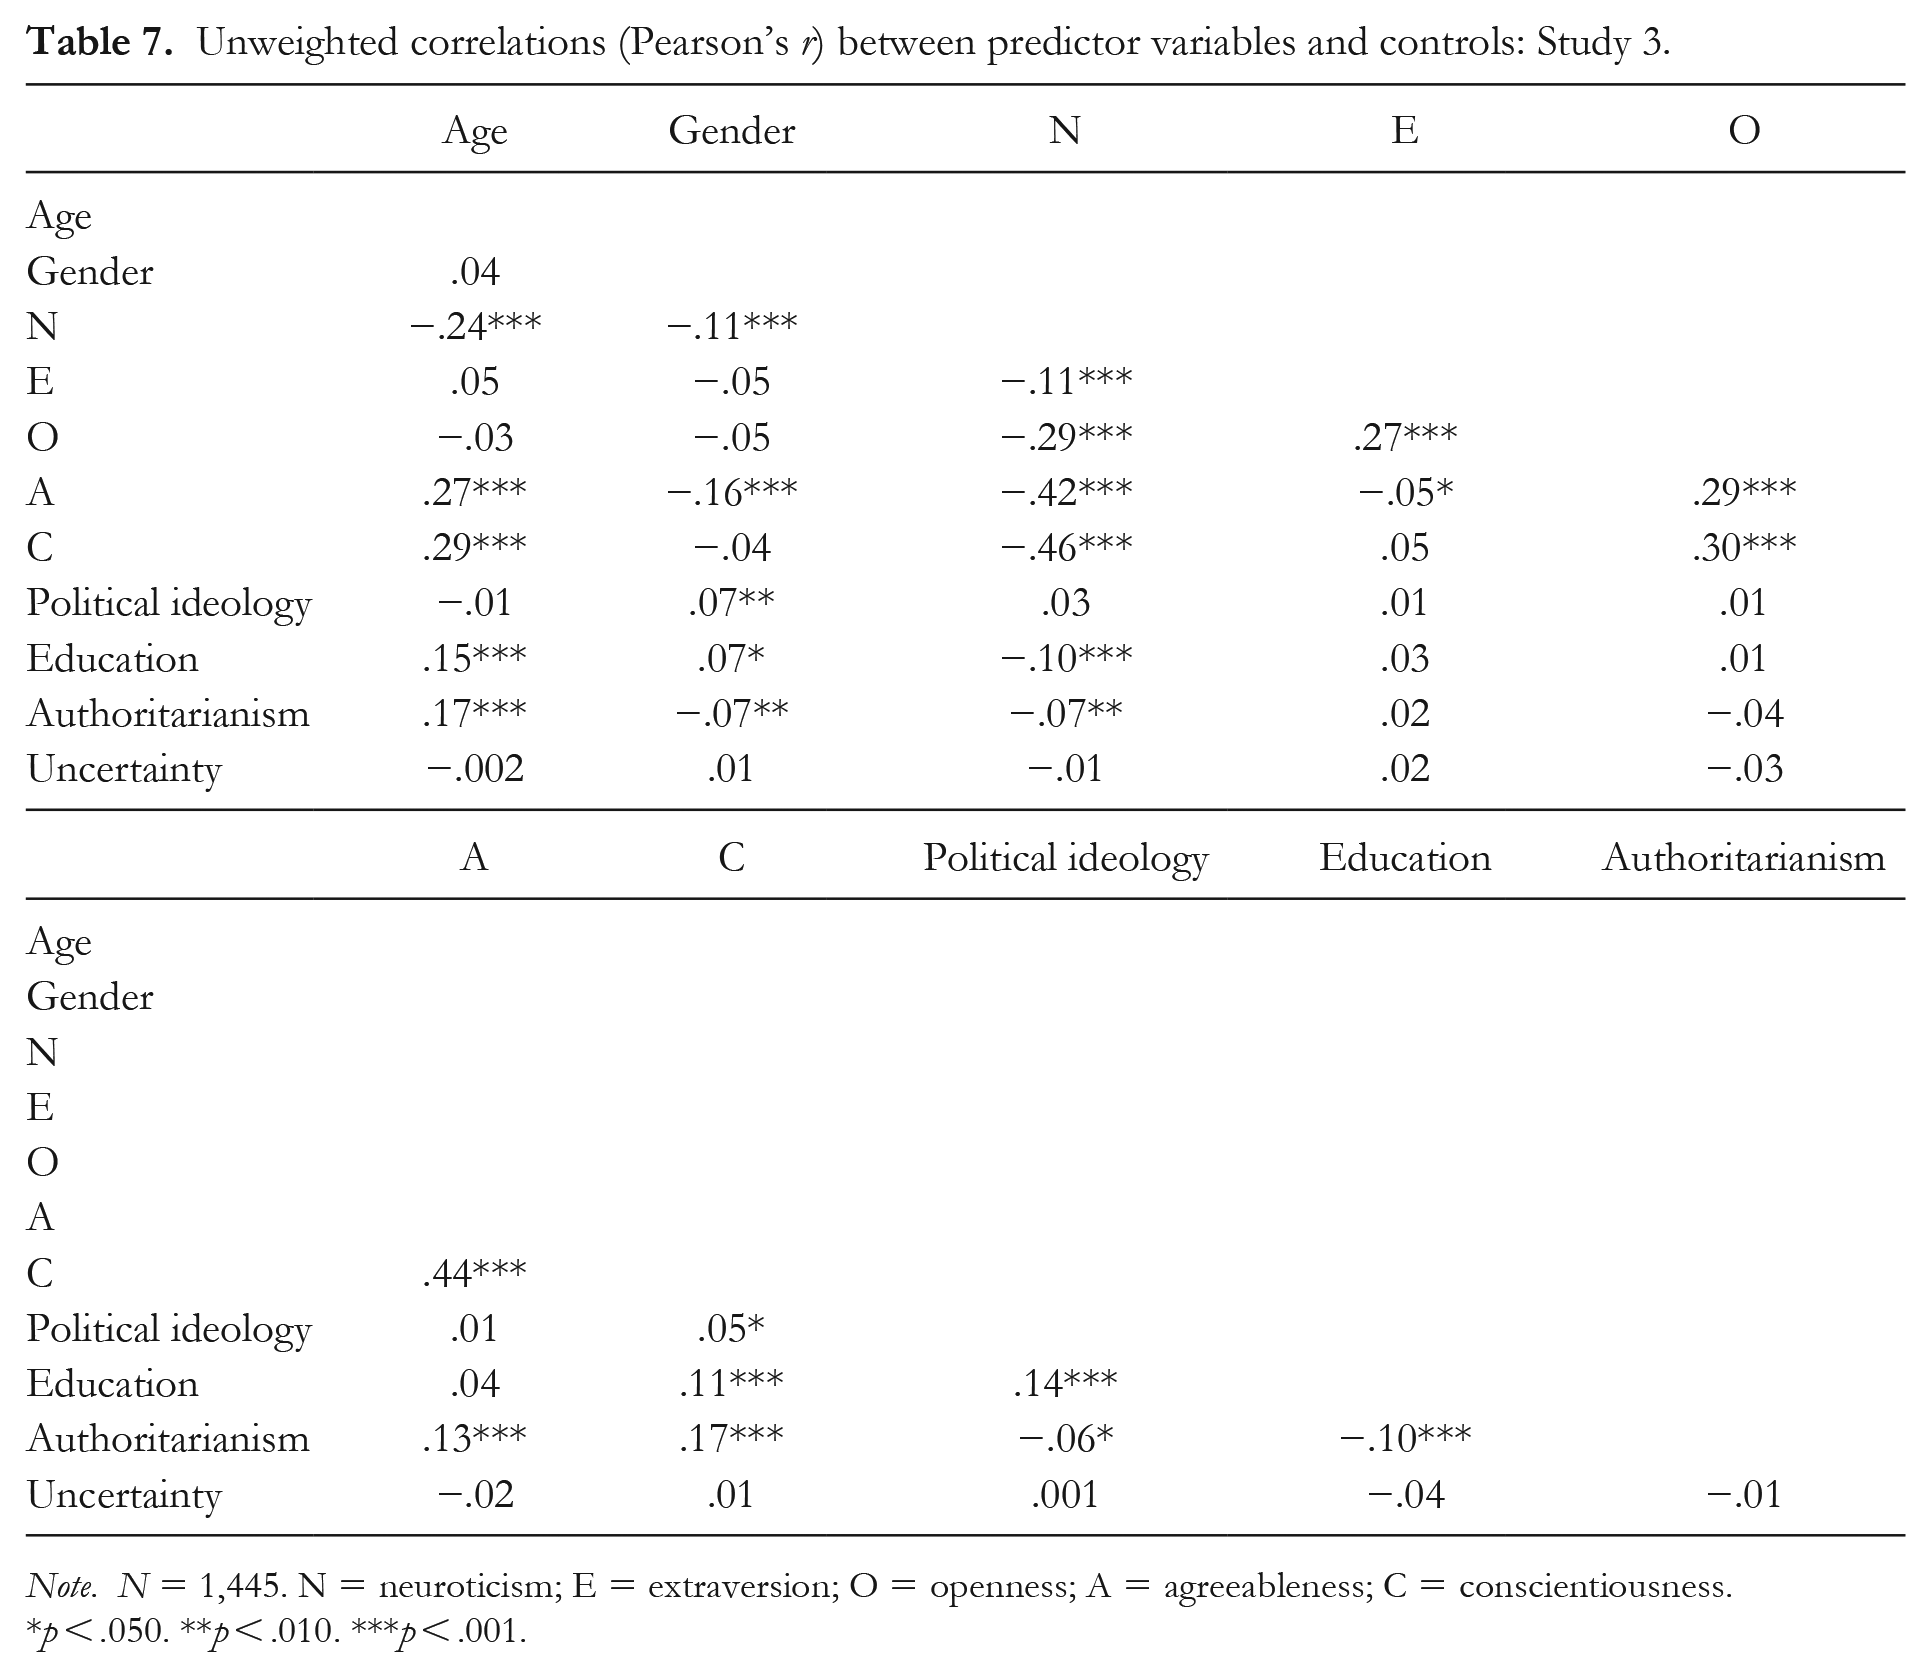
Note. N = 1,445. N = neuroticism; E = extraversion; O = openness; A = agreeableness; C = conscientiousness.
p < .050. **p < .010. ***p < .001.
We tested these hypotheses using a similar procedure as in Studies 1 and 2. Table 8 displays the results. At Step 1 (Model 1), we entered education, age, gender, and the Big Five personality traits; at Step 2 (Model 2), we entered authoritarianism; at Step 3 (Model 3), the self-uncertainty prime; and at Step 4 (Model 4), the interaction of uncertainty and authoritarianism. Although authoritarianism was significantly associated with populism in Model 2 (β = .33, t = 11.84, p < .001, 95% CI [24.44, 34.14]), supporting H1, the uncertainty manipulation did not significantly effect populism in Model 3 (β = .01, t = 0.61, p = .574, 95% CI [−1.12, 2.02]), failing to support H2.
Results of hierarchical linear regression predicting score on populism: Study 3.
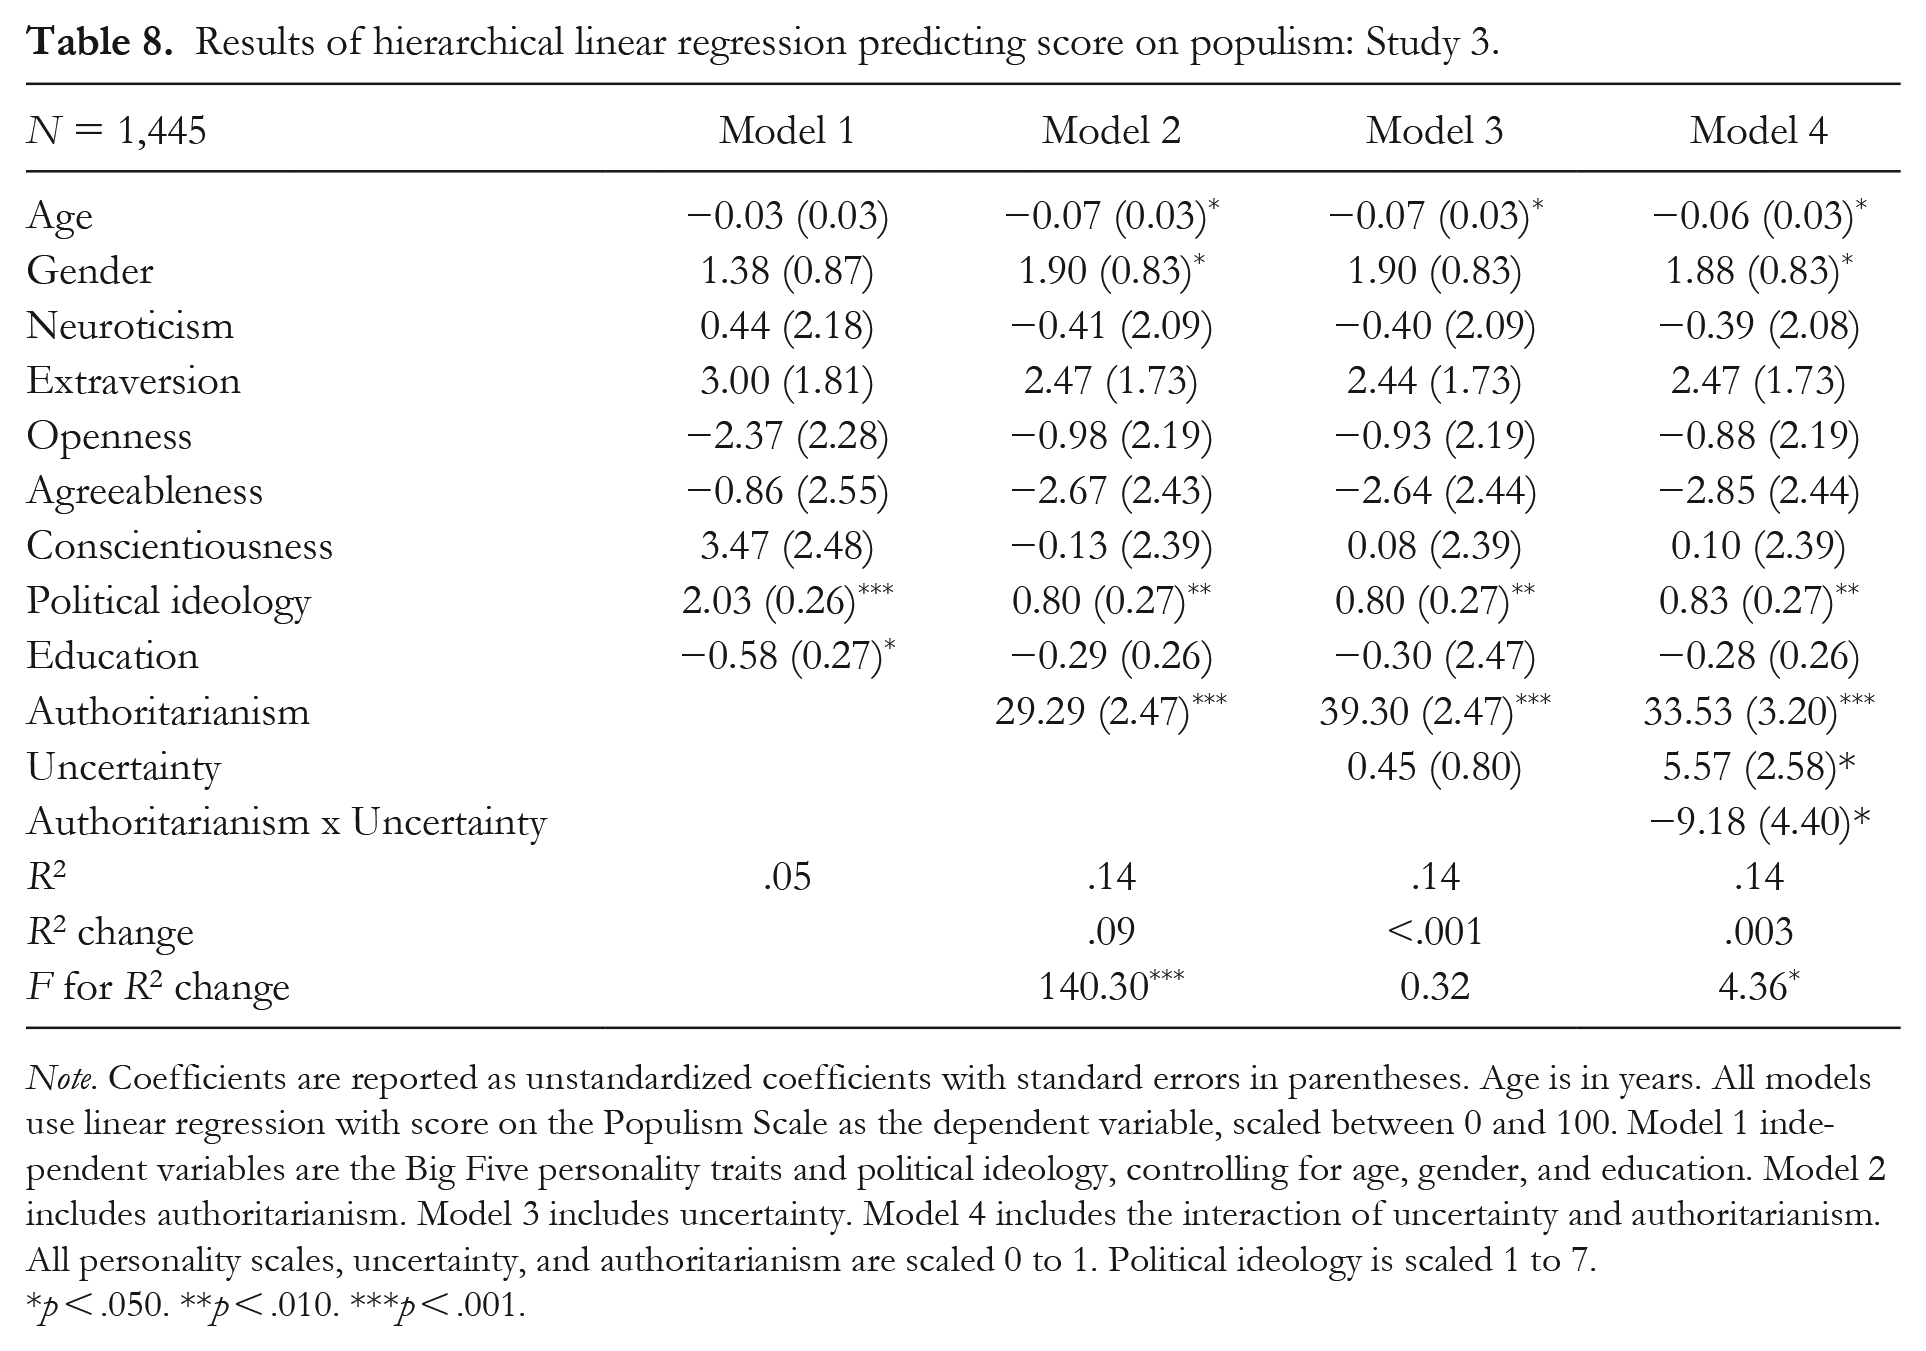
Note. Coefficients are reported as unstandardized coefficients with standard errors in parentheses. Age is in years. All models use linear regression with score on the Populism Scale as the dependent variable, scaled between 0 and 100. Model 1 independent variables are the Big Five personality traits and political ideology, controlling for age, gender, and education. Model 2 includes authoritarianism. Model 3 includes uncertainty. Model 4 includes the interaction of uncertainty and authoritarianism. All personality scales, uncertainty, and authoritarianism are scaled 0 to 1. Political ideology is scaled 1 to 7.
p < .050. **p < .010. ***p < .001.
However, as predicted under H3, authoritarianism and uncertainty significantly interacted to predict populism in Model 4 (β = −.17, t = −2.09, p = .037, 95% CI [−17.81, −0.56]; see Figure 3). The uncertainty prime was not significantly associated with increased support for populism among participants with average authoritarianism scores (t = 0.55, p = .580) or among participants with authoritarianism scores 1 SD (t = −1.08, p = .279) and 2 SDs above the mean (t = −1.62, p = .106), but became significant among those with authoritarian scores 1 SD (t = 1.87, p = .062) and 2 SDs below the mean (t = 2.16, p = .031; Figure 3a). Higher authoritarianism was associated with greater support for populism in both the low- (t = 10.49, p < .001) and high-uncertainty conditions (t = 7.11, p < .001; Figure 3b). The effect of increased uncertainty became stronger among participants with lower authoritarianism scores.
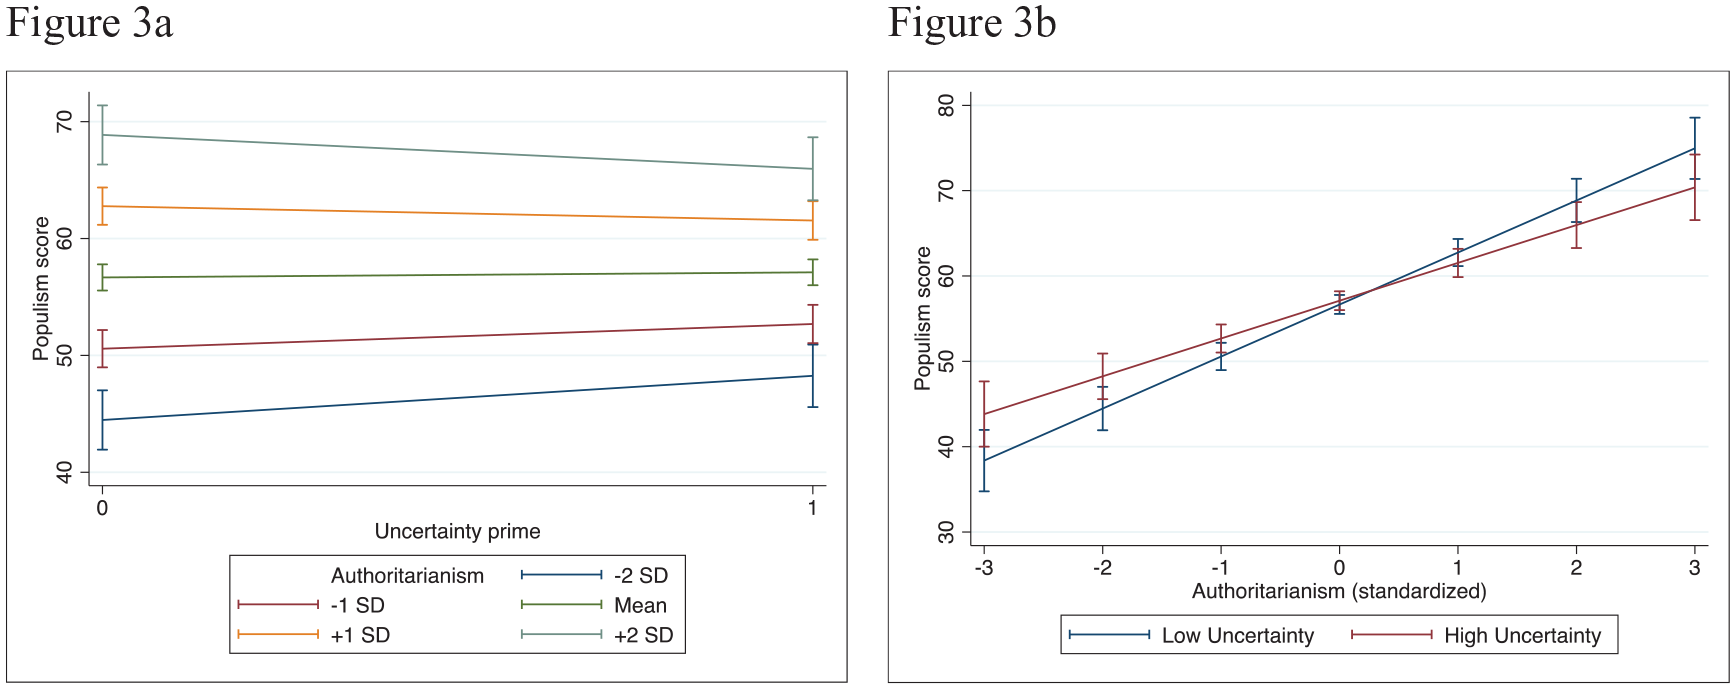
Figure 3a shows the simple slopes for the effect of uncertainty on populism at 5 values of authoritarianism, and Figure 3b shows the marginal relationship between authoritarianism in the low- and high-uncertainty conditions: Study 3.
General Discussion
Recent years have witnessed a rise in support for populist ideologies, identities, and leadership in Western democratic societies. In this article, we have drawn from social psychology to understand the motivational dynamics that may contribute to support for populism. We have characterized right-wing populism as a thin ideology that maintains that the will and sovereignty of the people is supreme, but that it is subverted and opposed by an antagonistic “system” or “elite” that the people are in opposition to (Ernst et al., 2017).
From previous psychological research (Altemeyer, 1998; Passini, 2017), we expected supporters of populist ideology and leadership to be predominantly people with relatively authoritarian personalities, a personality structure defined by conformity, tradition, and prejudice rather than universalism and benevolence. This formed our first hypothesis (H1).
However, from uncertainty-identity theory (Hogg, 2007, 2012, 2014, 2021a, 2021b), we also expected self-uncertainty to play a role in support for populism (our second hypothesis, H2). Uncertainty-identity theory argues that the aversive experience of self- and self-related uncertainty motivates uncertainty reduction. This motivation is satisfied by identification with social groups and categories that are distinctive, have strong leadership, and have an unambiguous and clearly defined identity. Thus, we predicted that elevated uncertainty would be associated with increased support for right-wing populist ideology and for leaders espousing such an ideology. Populism offers such an uncertainty-reducing identity.
Finally, we expected authoritarianism and uncertainty to interact to affect support for populism (our third hypothesis, H3). Because authoritarians are dispositionally more likely to support populist ideology, this orientation is unlikely to be affected by uncertainty. Low authoritarians, those who would not otherwise support populism, are vulnerable to uncertainty—for these individuals, uncertainty increases support for populism.
We tested these hypotheses in three studies involving a total of 5,882 U.S. adults. Studies 1 and 2 found authoritarianism to predict support for the Tea Party movement, for populist ideology, and reported voting for Donald Trump rather than for Hillary Clinton, over and above a range of demographic and personality controls, including participants’ position on the political spectrum (H1). Uncertainty, which we constructed as an approximate index of uncertainty-inducing experiences, explained further variance in all three factors, even over and above authoritarianism (H2). Uncertainty and authoritarianism interacted to predict indices of populism (H3). The third study was an experiment in which uncertainty was primed and populism was operationalized as support for populist ideology. Authoritarianism predicted support for populist ideology (H1); however, although the uncertainty prime did elevate uncertainty, it did not significantly affect support for populism (H2). As found in Studies 1 and 2, uncertainty and authoritarianism interacted such that uncertainty affected support for populist ideology among those with lower authoritarianism (H3).
All three studies found that at 1 SD above the mean level of authoritarianism, uncertainty no longer predicted populism. Why is this so? One possibility is that there is a real-world “ceiling” to the effect of uncertainty. For example, the proportion of the vote for Donald Trump peaks at above 60% among high authoritarians, but it is unchanged by different levels of uncertainty. Those with lower levels of authoritarianism with elevated uncertainty may calculate that the populist candidate, while not in line with their personality, nevertheless offers the best chance of handling the uncertainties they experience in their lives. Furthermore, support for the populist candidate remains substantially lower among high-uncertainty low authoritarians than even low-uncertainty but high authoritarians, indicating the impact of dispositional differences. Overall, those with a conservative political identity and lower education were more supportive of populism, while the Big Five personality traits seemed to matter less. These correlations, however, were less robust, and future studies should corroborate them using more robust measures, including politically neutral measures of authoritarianism and, arguably, populism.
Our studies are limited in their focus on right-wing authoritarianism, a concept that has been criticized for unduly restricting the phenomenon to the political right (Duckitt, 2022; Gøtzsche-Astrup & Hogg, in press). A budding literature on left-wing authoritarianism (Conway et al., 2018) has begun to remedy this situation, but validated short-form measures are still few (or, in the case of previous ANES iterations, not included). Measures free from ideological content (e.g., questions on child-rearing) come with other limitations, and may not tap authoritarianism as we define it here (Duckitt, 2022). Future studies should look at populism on the left while incorporating new knowledge on left-wing authoritarianism. We operationalized populism in different ways, variously using direct measures and more proxy measures such as Tea Party support and vote choice for Donald Trump over Hillary Clinton. With these choices, we acknowledge a possible trade-off between precision and coverage, which we believe to be necessary given the controversial nature of the populism concept (Serhan, 2020).
All three of our studies were surveys conducted by phone or online through a survey company. The strength of surveys is the availability of large, population-representative samples. The limitations are well known, and include loss of control over the study setting, issues of compliance, and possible threats to ecological validity. These limitations are relevant to our studies. However, several factors ameliorate the threat they pose to our findings. First, the methods employed are similar to those used by polling companies to gauge support for political candidates and positions in elections. The theme of this research therefore lends itself well to survey designs.
Second, rather than asking participants about some hypothetical factor that could influence their lives, the experimental prime and questions measuring uncertainty and authoritarianism concerned participants’ actual life and experiences—an approach that helps increase realism and reduces threats to ecological validity. However, the survey method permitted only a relatively short and minimal uncertainty prime—a longer prime would have been practically problematic to administer. This likely reduced the efficacy of the prime, leading to smaller observed effects than would be possible in a laboratory study.
The small effect sizes are less problematic for the validity of our findings, but illustrate the limits of survey studies for generalizations of effect sizes rather than mechanisms. While this suggests that the true effect of uncertainty is likely small, we prioritized an aggressive control strategy to rule out alternative explanations as well as a highly representative sample. These choices may have adversely impacted operationalization and depressed the estimated variance explained by the independent variables.
Concluding Comments
Our research demonstrates how and when self-uncertainty may lead to increased support for populism. As such, it is an important development and extension of uncertainty-identity theory. It also maps out the interplay of authoritarianism and context (in this case, uncertainty) in the emergence of populism. Future research could use longer personality measures to investigate the relation between personality and populism, as well as focusing on including socioeconomic measures to investigate if uncertainty acts differently across class and individual differences.
The research also addresses a pressing social issue, and thus has applied and policy implications. We have shone a light on why citizens in a wealthy and peaceful society may support populist ideologies and leaders who espouse right-wing populist views. By operationalizing uncertainty in terms of real-world uncertainties surrounding employment, health, and personal finances, and directly as self-related uncertainty, we show how macro-level changes can be translated into individual uncertainties. We show that populist ideologies and messages can be attractive not only for a subset of the population with a specific set of personality or demographic characteristics, but also for people who would otherwise reject such ideology. These findings should also be informative to those seeking to reduce the attractiveness of populism. Rather than condemning populist messages, countering uncertainty-inducing influences and offering strong alternative identities might be more effective.