
Abstract
A new composite structural system that is able to enhance constructability and is suitable for realization of long-span structures was developed. Steel beams, steel reinforced concrete columns, reinforced concrete drop panels, and slabs are placed in the system. To determine the structural performance of the system, the gravity and lateral load resisting properties of the system were investigated. It was found that the presence of a reinforced concrete drop panel at the top of a column brings about a reduction of the negative moment at the top of the column. Also, it was observed that a reinforced concrete drop panel on the top of the column significantly affected the deflection-control of the beam. In a lateral load resisting test, cracks in slabs of the new structural system disperse in a better manner than is the case for crack patterns in the conventional composite system. Also, via push-over analysis using a package of structural analysis software, it was found that the developed structural system is effective in the prevention of stress concentration in the column zone.
Introduction
In order to solve issues in the construction industry, such as the rationalization of long-span structures and the completion of structural systems that are easy to build, many researchers have been developing new composite structural systems that consist of steel and concrete materials. From the viewpoint of cost-saving, the completion of long-span structures will be an essential future work (Bradford and Gilbert, 1992; Oechlers and Bradford, 1999). In particular, for the effective usage of inner spaces in public facilities such as parking lots, rational long-span structural systems are necessary. Since any increase in the span of a structure leads to an increase in the deflection of girders or beams, deflection-control should be preferentially achieved in any designed long-span structural system. In buildings with reinforced concrete systems, except for special structural systems such as stadiums, a span of approximately 13 m is the maximum that is generally allowed. In order to develop a long-span structural system with a span of over 13 m, therefore, a new composite structural system using state of the art structural engineering technologies is required.
Certain composite structural systems able to realize long-span structures, including S-SRC Bar, Eco-Prestressed Concrete Beams, The SEN Steel Concrete (TSC) method, and so on, have been developed (The Korea Construction Transport New-Technology Association, 2011). Slim-Steel Reinforced Concrete (S-SRC) Bar consists of steel girders and “Z-shaped” steel plates filled with concrete, as shown in Figure 1(a). With high flexural rigidity due to the concrete in the compressive zone, the sectional depth of the steel girders can be effectively reduced. In Eco-Prestressed Concrete beams (Figure 1(b)), it is expected that cracking of concrete members can be prevented by introduction of prestress. The TSC method (Figure 1(c)), which employs “U-shaped” steel girders and concrete, can improve the weak flexural rigidity of steel girders filled with concrete and integrated with concrete slabs. Beyond these methods, many previous studies on the structural performance of structural systems with steel beams of various types have also been conducted (El-Shihy et al., 2010; Gőrkem and Hűsem, 2013; Li et al., 2014; Shanmugam and Min, 2007; Vu et al., 2013; Zhu et al., 2013). However, since the structural systems mentioned above need a high level of construction technology and still have limits in terms of constructability, they have not been aggressively applied to practical construction projects so far.
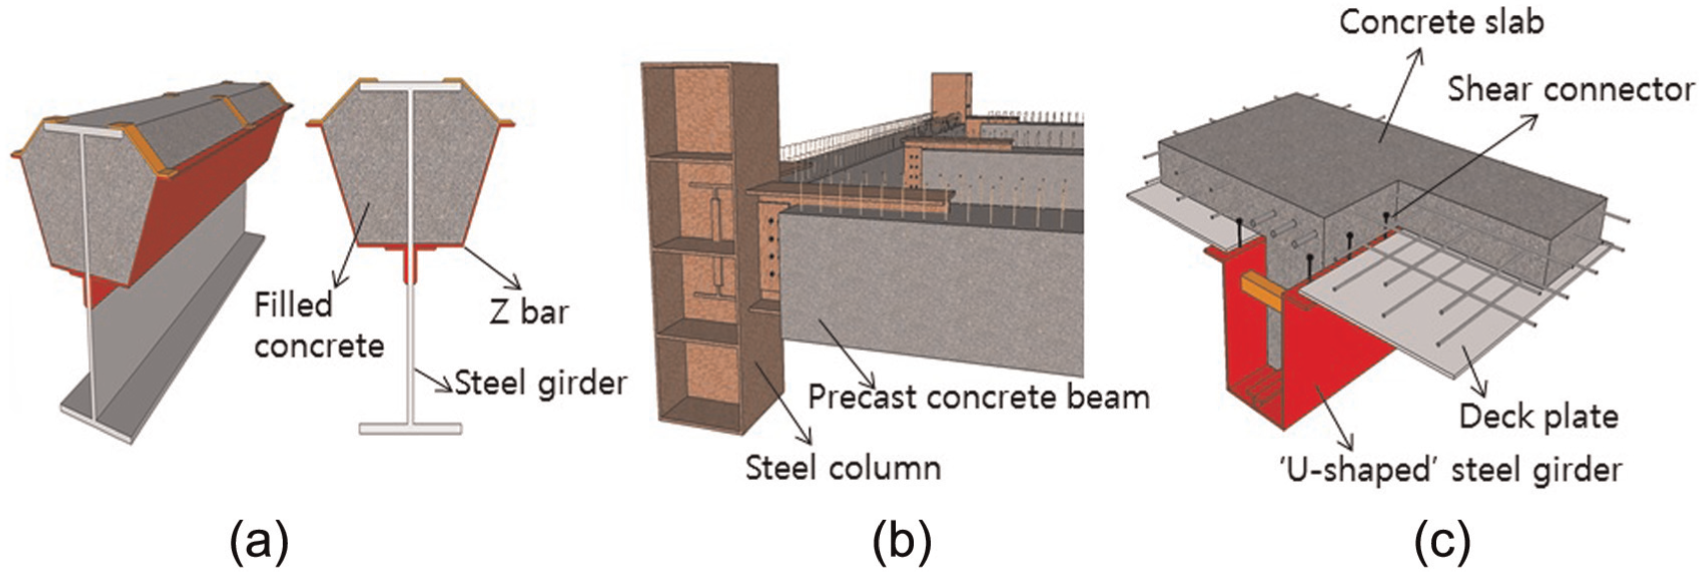
Conventional composite structural systems: (a) S-SRC bar, (b) eco-prestressed concrete beam, and (c) TSC method.
In order to develop a composite structural system that is easy to build, a new structural system, the so-called composite double beam system (CDBS), was proposed, as shown in Figure 2. The system consists of steel beams, steel reinforced concrete (SRC) columns, reinforced concrete slabs, and drop panels. The drop panels are formed by double steel beams penetrating adjacent to the top of the SRC columns. The general distribution of bending moment by gravity load is indicated in Figure 3. In the CDBS, therefore, reduction of the span length and negative moment at the column zone can be achieved, as shown in Figure 3. Also, the presence of drop panels in the CDBS will influence the distribution of cracks or damage in the slabs. Therefore, since the CDBS can prevent columns from accruing a concentration of damage, the CDBS will facilitate an enhancement of the capacity of lateral resistance as well as the gravity load resistance.
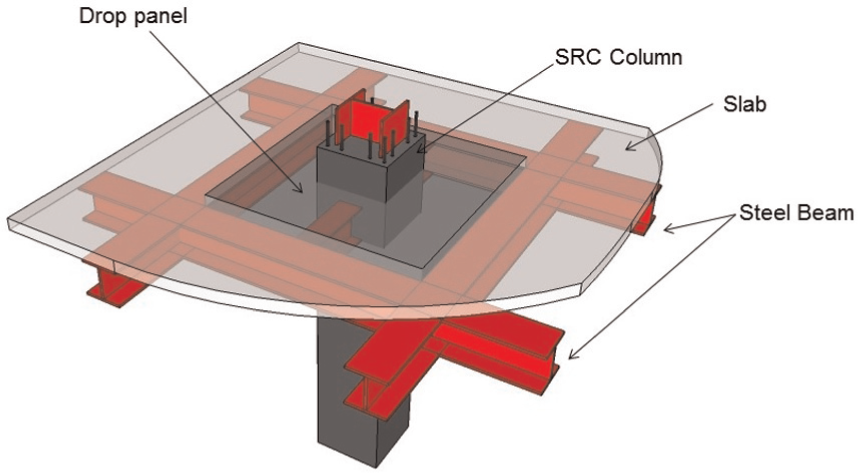
Proposed structural system (composite double beam system).
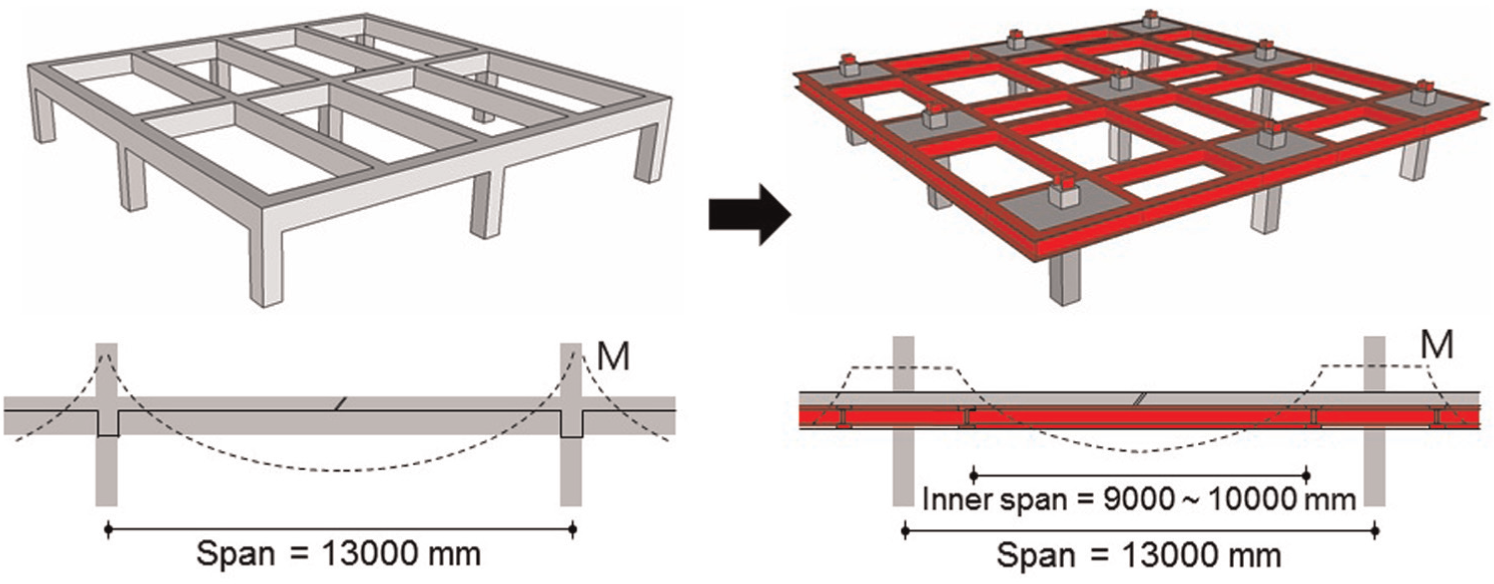
Reduction of negative moment by the proposed structural system.
Furthermore, the CDBS is useful for practical construction sites in which the top-down method is applied. The top-down method is effective in limited construction spaces such as downtown areas surrounded by numbers of conventional buildings because the basement concrete slab acts as lateral bracing for the perimeter wall system and no retaining wall is necessary. In the conventional top-down method, a work for the temporary struts such as percussion rotary drill (PRD) is essential. However, the work is cumbersome and difficult in the whole procedure, including the excavation and casting. This inconvenience results in delays over the whole construction period. On the other hand, acceptance of the CDBS for the top-down method in construction sites facilitates savings in the construction period and enhancement of the constructability because the double steel beams and temporary columns support the reinforced concrete slab during excavation and the SRC column is completed after the excavation, as shown in Figure 4. In cases in which the CDBS is applied to construction sites, an approximately 10%–20% cost-saving effect and 50% construction-period-saving effect can be achieved compared to the conventional top-down method using temporary struts (Baro Construction Technology, 2010a, 2010b).
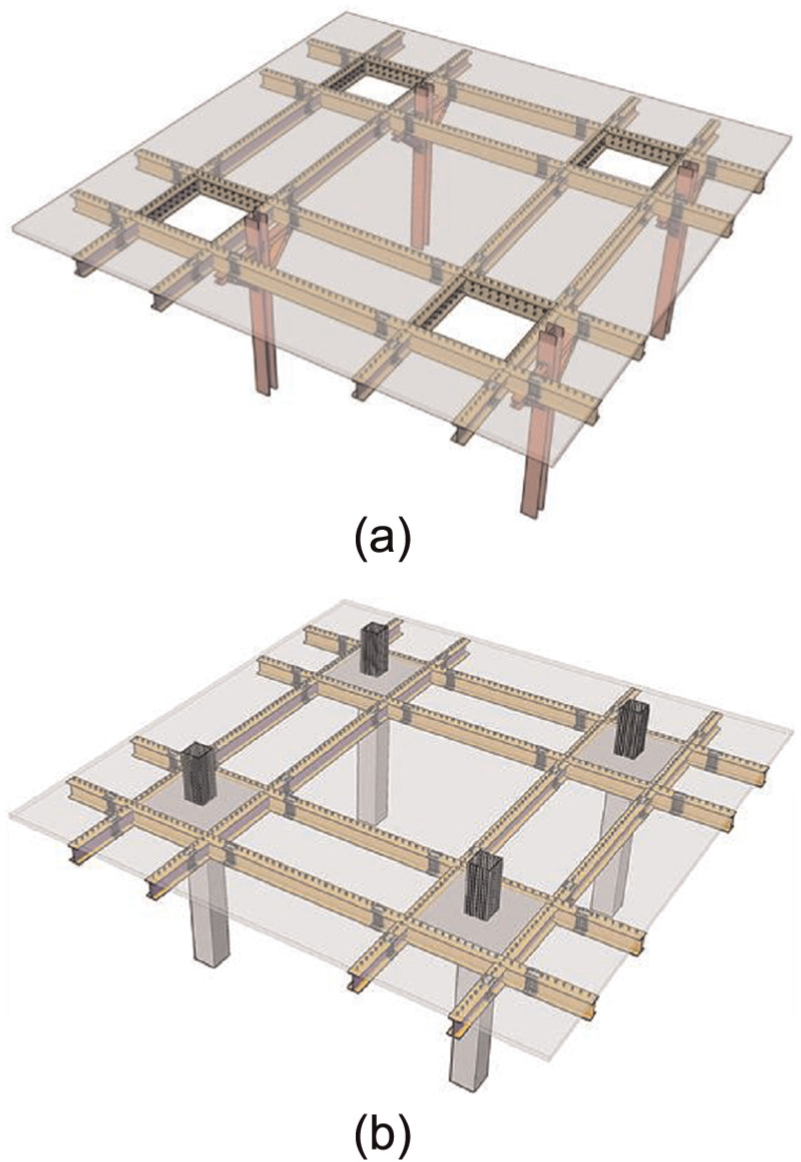
Top-down method by CDBS: (a) during excavation and (b) after excavation.
In this study, two series of tests to investigate the gravity and lateral load resisting properties of the CDBS were conducted. A total of four (two specimens for the gravity-resisting test and two for the lateral-resisting test) specimens were constructed and tested. This article mainly covers the discussion of the experimental results obtained from the two series of tests. Analytical results (such as stress or deflection distribution of the CDBS) determined by finite element analysis will also be discussed and compared to observed results from the test.
Structural performances of CDBS against gravity load: gravity-resisting properties
Design and construction of specimens
Two series of tests were conducted in this study. An outline and results of the gravity-resisting test will be discussed in this section. In order to investigate the structural performance of the CDBS against gravity load, two specimens of 30% scale were constructed and tested. Each specimen was designed to fail in flexure prior to shear. Figure 5 illustrates the section and reinforcing details of one of the specimens. Specimens consisted of steel beams, SRC columns, reinforced concrete slabs, and drop panels. As can be seen in the figure, each specimen was constructed for two half-bays on the right and left of the SRC column. The length and sectional specifications of the steel beams were 4800 mm and H-150×75×5×7 (SM490), respectively. Volumetric size of the drop panel was 1200 mm× 750 mm× 150 mm. Also, the elements were designed so that punching shear failure of the drop panel zones did not occur prior to flexural yielding. The number of longitudinal bars in the drop panel, Ard , was selected as an experimental parameter. Table 1 summarizes the main specifications and the experimental parameters allotted to each specimen. Specimen CDBS1 was selected as a standard specimen. Deformed rebar D13s were arranged in the drop panel of each specimen (D13@130 mm for CDBS1 and D13@190 mm for CDBS2). This resulted in sectional areas of the longitudinal bars in the drop panels, Ard , equal to 1013.6 mm2 for CDBS1 (ρs = 0.57%) and 633.5 mm2 for CDBS2 (ρs = 0.39%). The appropriate amount of rebar in the drop panel in the standard specimen, CDBS1, was determined as the number of rebars in the drop panel needed to resist the maximum tensile stress, which was obtained by finite element analysis using a package of structural analysis software, MIDAS (Ver. 835), with results shown in Figure 6. Using a comparison between CDBS1 and CDBS2, the possibility of a more economical design of the drop panel can be determined. The overall section size of the column was 250 mm× 300 mm, and H-steel (H-150×75×5×7 (SM490)) was set in the column. The thickness of the reinforced concrete slab was set at 60 mm. Deformed bars D10 in 300 mm pitches were arranged in the top and bottom layers of the slab. To prevent slip deformation between the reinforced concrete slab and the steel beam, steel studs were wedged at 300 mm pitches. Table 2 summarizes the mechanical properties of the materials applied for each specimen. Compressive strength of 30 MPa was measured in the concrete used in CDBS1 and CDBS2. Yield strength values of the deformed bars equaled 385.3 MPa for D13 and 353.2 MPa for D10. Yield strength of the steel plate used in the flanges of the steel beams (t = 5 mm) was 379.6 MPa.
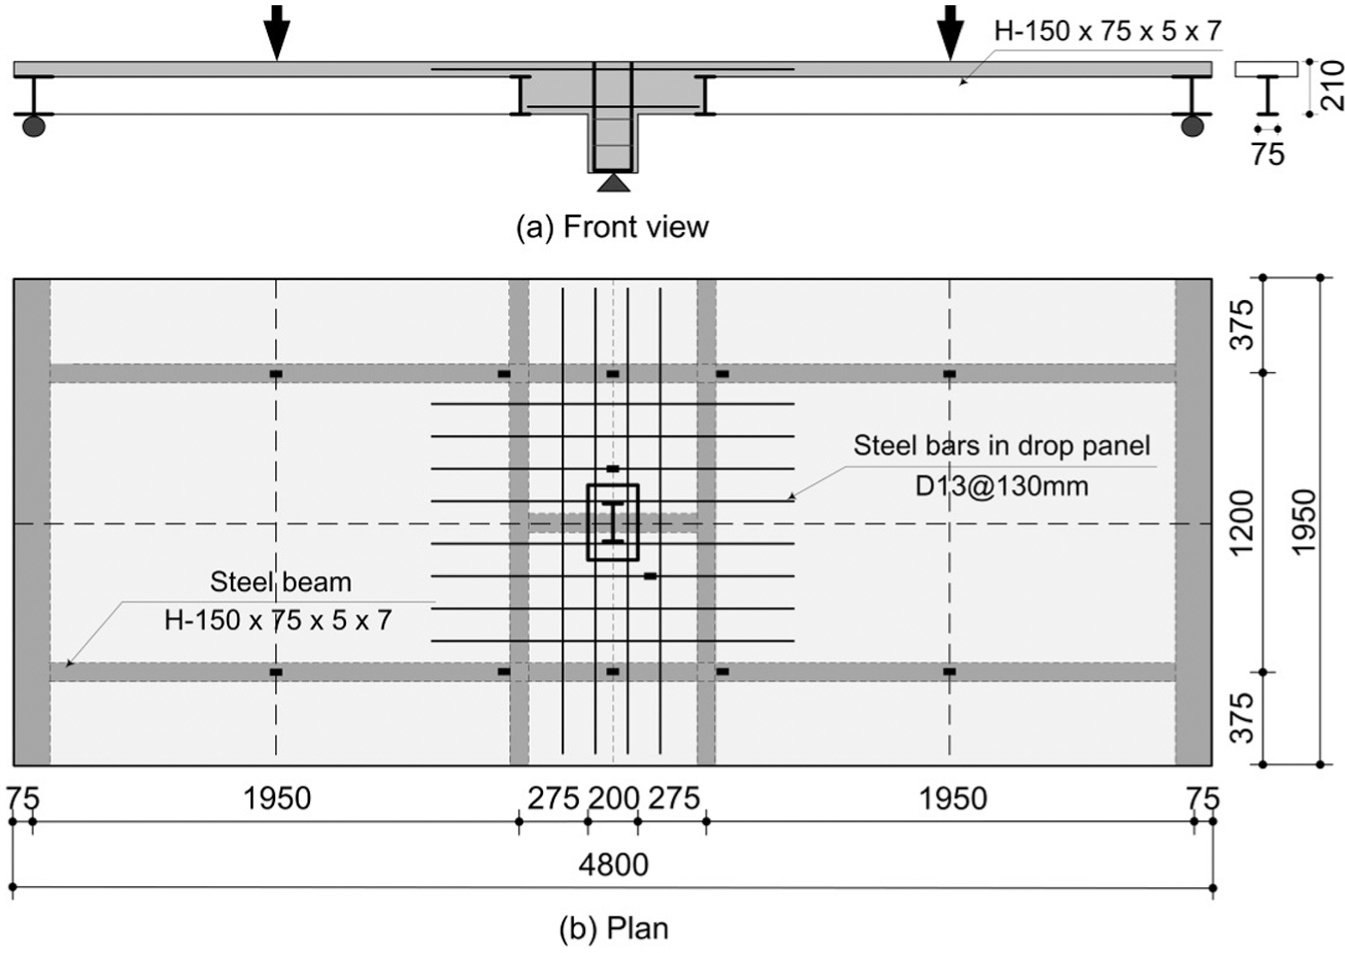
Section and reinforcing details of specimen for the gravity-resisting test.
Main specifications and experimental parameters allocated to each specimen.

b: sectional width; h: overall depth; d: effective depth; w: length in longitudinal direction; CDBS: composite double beam system.
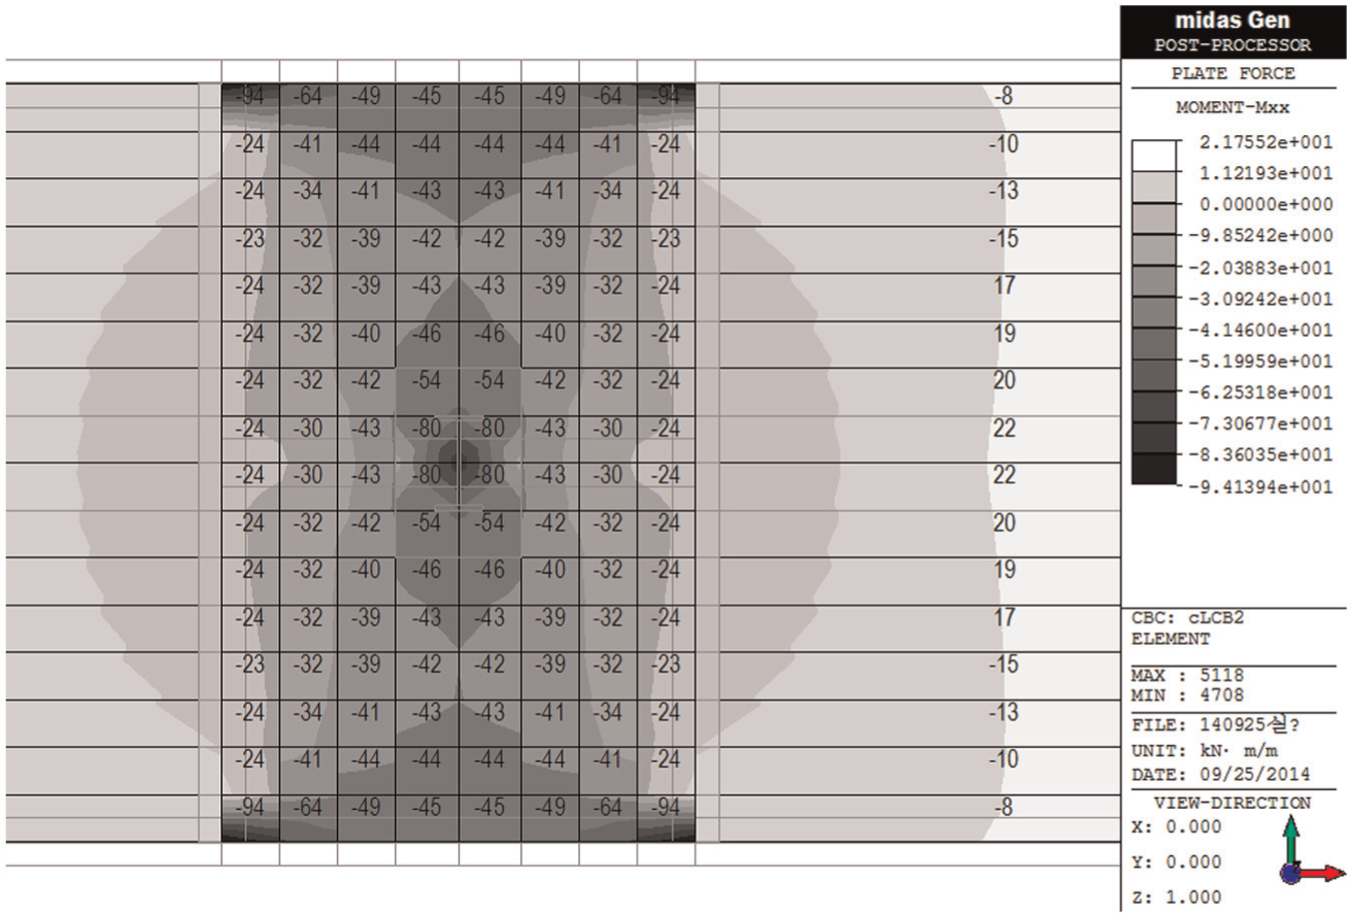
Calculation of maximum tensile stress in slab by MIDAS.
Mechanical properties of the materials used in this study.
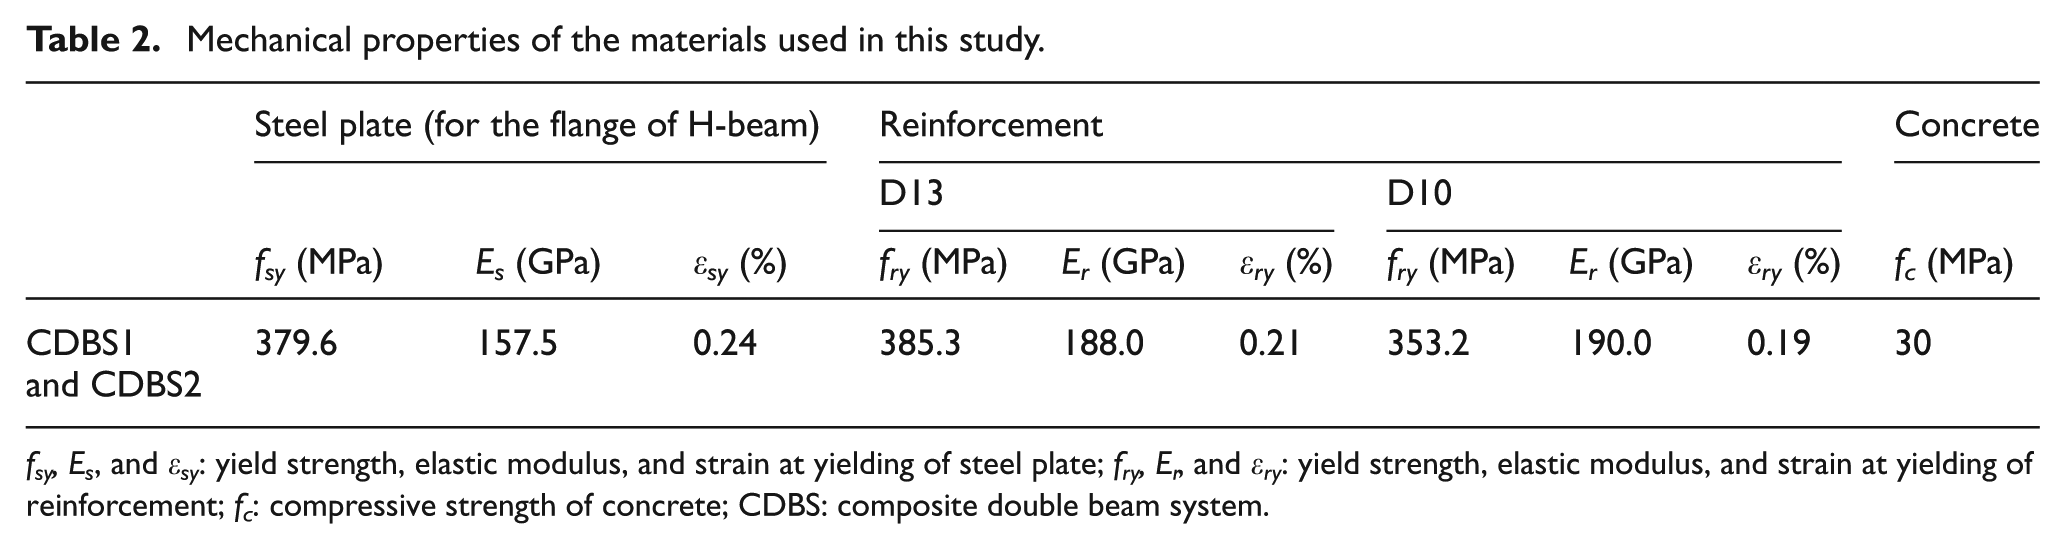
fsy, Es , and εsy : yield strength, elastic modulus, and strain at yielding of steel plate; fry, Er , and εry : yield strength, elastic modulus, and strain at yielding of reinforcement; fc : compressive strength of concrete; CDBS: composite double beam system.
Loading and measurements
Figure 7 illustrates a loading set-up for the specimens for the gravity-resisting test. Specimen has pin-support at both the right and left ends and rigid-support at the center of the column. Ramp loading was provided at mid-span of the left and right steel beams using a hydraulic jack. The deflections at mid-span of the beam, at the adjacent drop panel, and at a distance 1/4 span from the center of the column were measured using linear displacement transducers, as shown in the figure. Strains of the longitudinal bars in the drop panel and of the lower flange of the steel beam were measured using strain gauges attached to each reinforcement (the place at which strain gauges were attached is illustrated in Figure 5). The load, deflection, and strains were consecutively monitored and recorded.
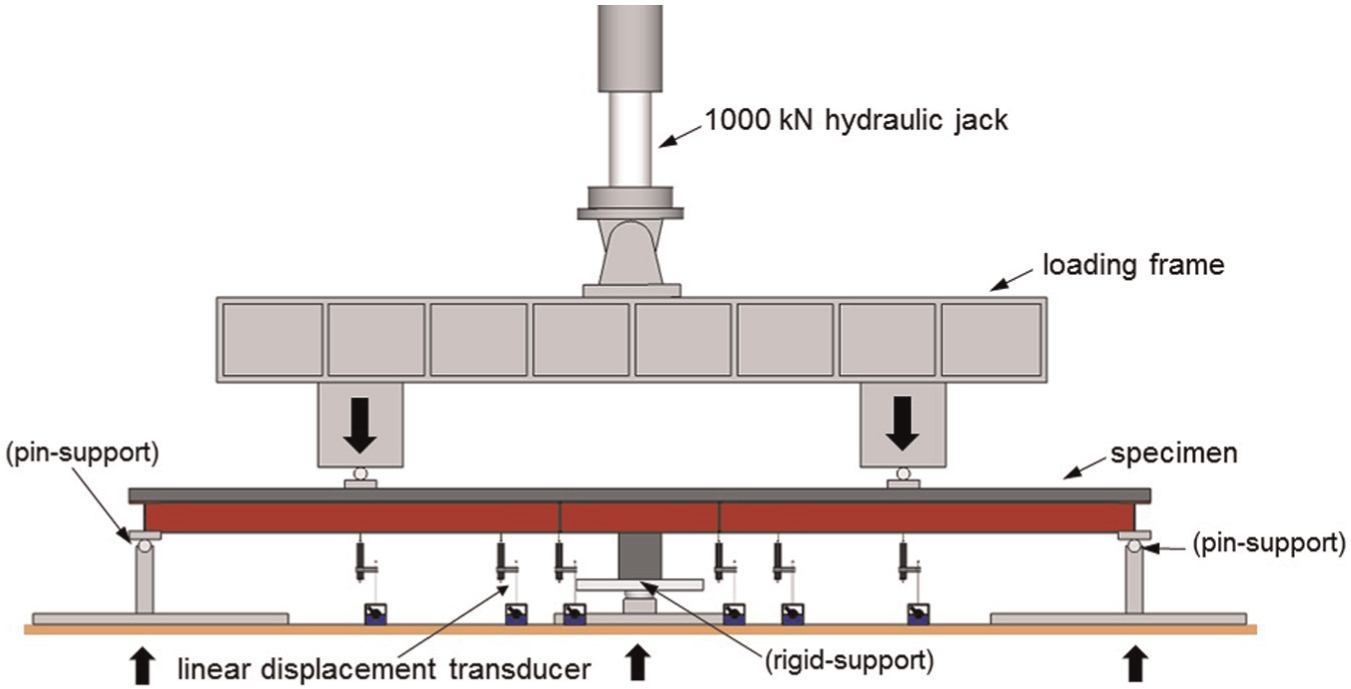
Loading set-up of gravity-resisting test.
Loading–deflection relationship
Figure 8 plots the loading–deflection relationships, V-Δ, of each specimen. Horizontal and vertical axes represent the deflection and the load, respectively. The deflection in the figure, Δ, represents the deflection at mid-span of a steel beam in which the tensile strain of the lower flange first reaches its yield strain. Symbols in Figure 8, solid circles, triangles, and rectangles, indicate the points of service load, primary yielding of the lower flange of the steel beam, and maximum load-carrying capacity of the specimen, respectively. Table 3 summarizes the experimental results, Δ s , Vs , Δ y , Vy , Δ peak , and Vpeak , for each specimen. Notations Δ s and Vs in the table represent the deflection and the load-carrying capacity of the specimen at the service load corresponding to the tensile stress in longitudinal bars of 0.6fy , where fy is the yield strength of the longitudinal bar in the beam. Also, Δ y and Vy in the table indicate the deflection and load-carrying capacity of the specimen at the primary yielding of the lower flange of the steel beam, while Δ peak and Vpeak represent the deflection and the load at peak load.
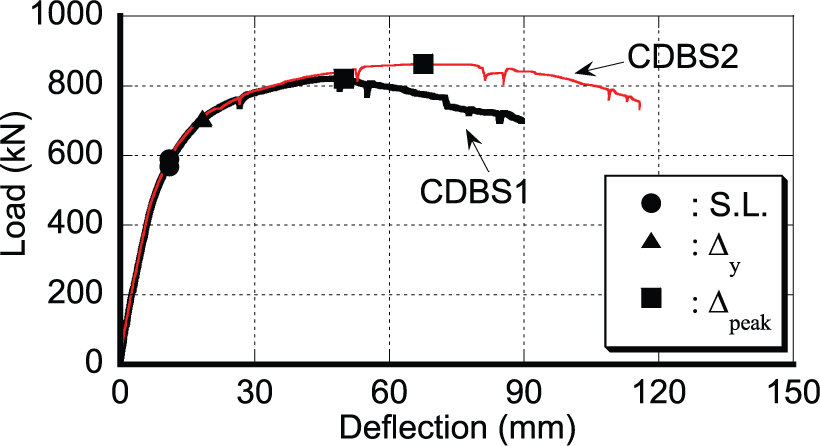
Load–deflection relation.
Summary of experimental results in gravity-resisting test.
CDBS: composite double beam system.
In CDBS1, flexural yielding (yielding of the lower flange in the steel beam) was observed at a deflection of 5.6 mm, corresponding to 370.5 kN. In CDBS2, the load and deflection corresponding to Δ y and Vy were 5.3 mm and 377.5 kN, respectively. Also, it should be noted that the fact that CDBS1 and CDBS2 reached peak load at Δ peak = 57.6 and 67.9 mm results in CDBS2 exhibiting a somewhat more ductile manner compared to that of CDBS1 in terms of the deformation capacity of the specimens. This points out that an increase in Ard led to an increase in the deformation capacity of the specimen. However, as shown in Figure 8 and Table 3, since 10Δ y of all specimens equals approximately 55 mm, it can be seen that all specimens maintained their capacity levels until Δ = 10Δ y . The observations above reveal that all specimens exhibited ductile characteristics, and Ard , adopted in the design of the specimens, is appropriate. No difference of the initial stiffness for any difference of Ard was observed.
Crack patterns
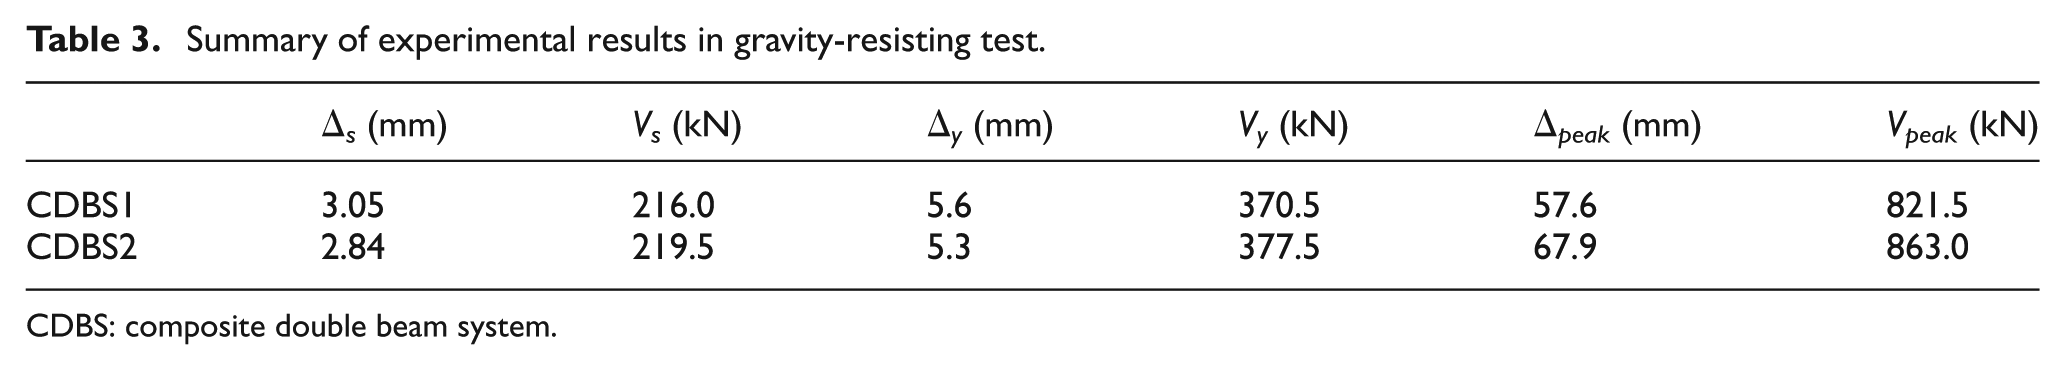
Crack patterns of the reinforced concrete slabs were first observed at the deflection corresponding to the primary yielding of the lower flange in an H-steel beam, Δ y . After that, the crack patterns were observed at the deflection corresponding to the integer times, 2Δ y , 4Δ y , and 6Δ y . The test was terminated when the load-carrying capacity of the specimen dropped below 85% of the maximum load. Figure 9 illustrates the crack patterns of each specimen at the termination of the test. Primary cracks in the slabs were initiated adjacent to the column base. With increasing of the load, cracks were found to propagate in longitudinal and transverse forms. Cracks reached the boundary between the drop panel and the slab (alternate long and short dash lines in Figure 9) and radially propagated toward the loading lines. The majority of the cracks were found to rapidly develop approximately after yielding of the lower flanges in the steel beams. Ultimately, CDBS1 and CDBS2 failed due to excessive opening of cracks at the boundaries of the slabs and the drop panels (bold straight line in Figure 9). This points out that the flexural rigidity of the drop panels was determined by the number of rebars in the drop panels, which influences the failure mode of the proposed system. In the design of specimens, punching shear failure was prevented by taking a larger punching shear strength of the slab adjacent to the column zone than the flexural strength corresponding to the yielding of the lower flange in the steel beam. As expected in the design of the specimen, no specimen failed due to punching shear, while some cracks due to punching shear were observed.
Crack patterns at termination of test.
Deflections
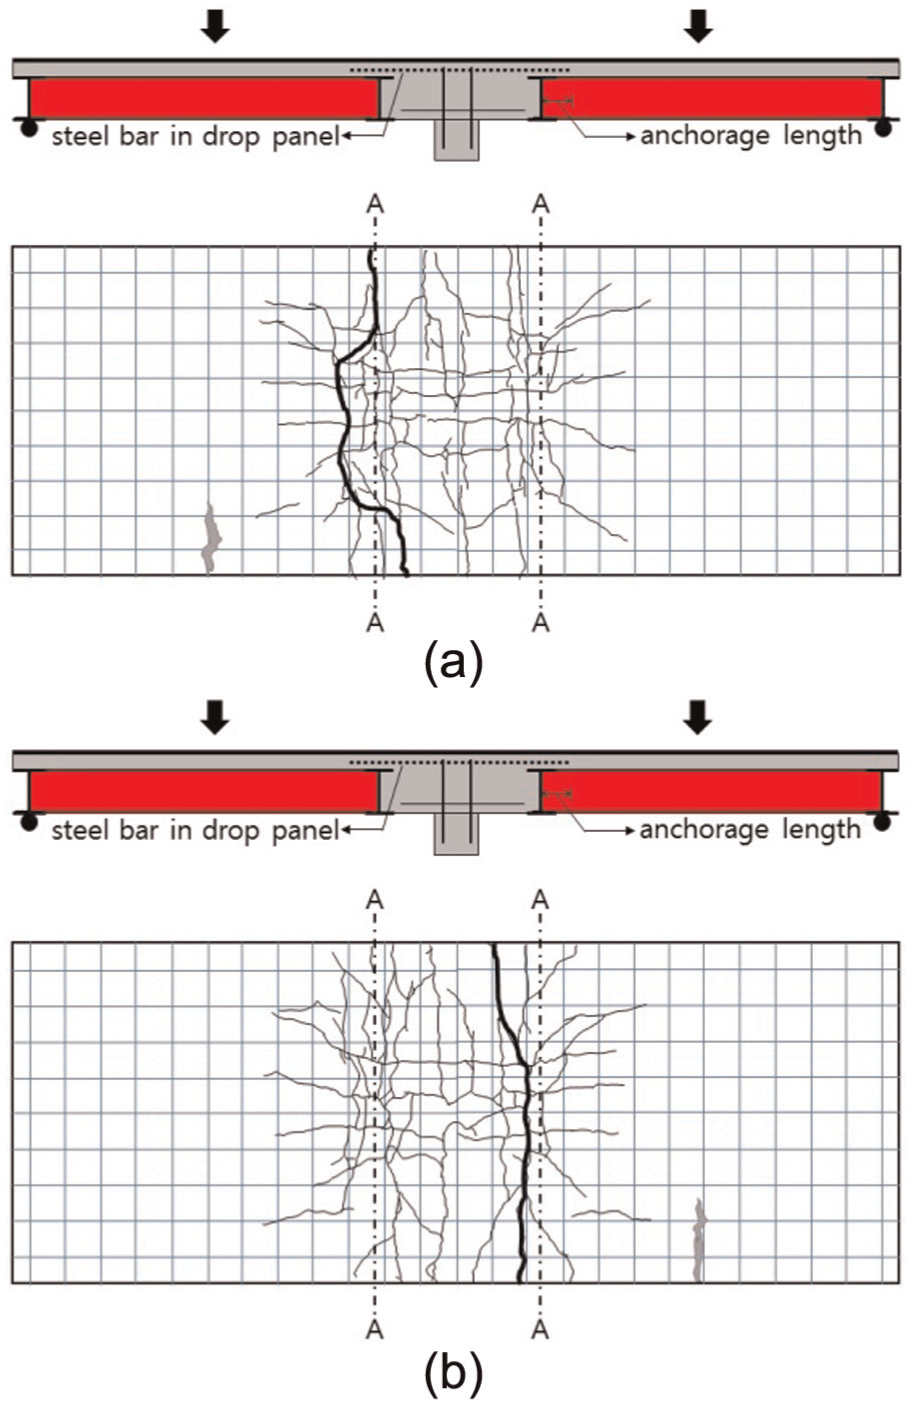
Deflection is the most important factor indicating the structural performance of the CDBS in terms of a gravity-load-resisting system. In order to study the applicability of the CDBS from the viewpoint of serviceability and safety, deflection at service load, at the yielding of the lower flange of the steel beam, and at peak load will be discussed in this section. Figure 10 plots the relationship between the ratio of longitudinal bars in the drop panel, ρs , and the deflections, Δ: (a) at service load, Δ s ; (b) at yielding of the lower flange in the steel beam, Δ y ; (c) at peak load, Δpeak. The horizontal and vertical axes of Figure 10 represent ρs and Δ: (a) Δ s , (b) Δ y , and (c) Δ peak . The allowable deflection proposed in ACI 318-11(ACI Committee 318, 2011) (= l/480, where l is the span length of a beam) is also plotted in the figure. Symbols, solid circles and triangles, indicate the measured deflection for CDBS1 and CDBS2, respectively. As can be seen in Figure 10(a), the deflection at the service load, Δ s , in CDBS1 is perceived to be similar with Δ s in CDBS2. It can be seen that there is almost no effect of ρs on the serviceability. Also, it should be noted that the measured deflections at service load in all specimens are smaller than the allowable deflection, Δ allow = 3.75 mm. This means that the structural system proposed in this study is satisfactory for the requirement of allowable deflection, l/480, where l is span length.
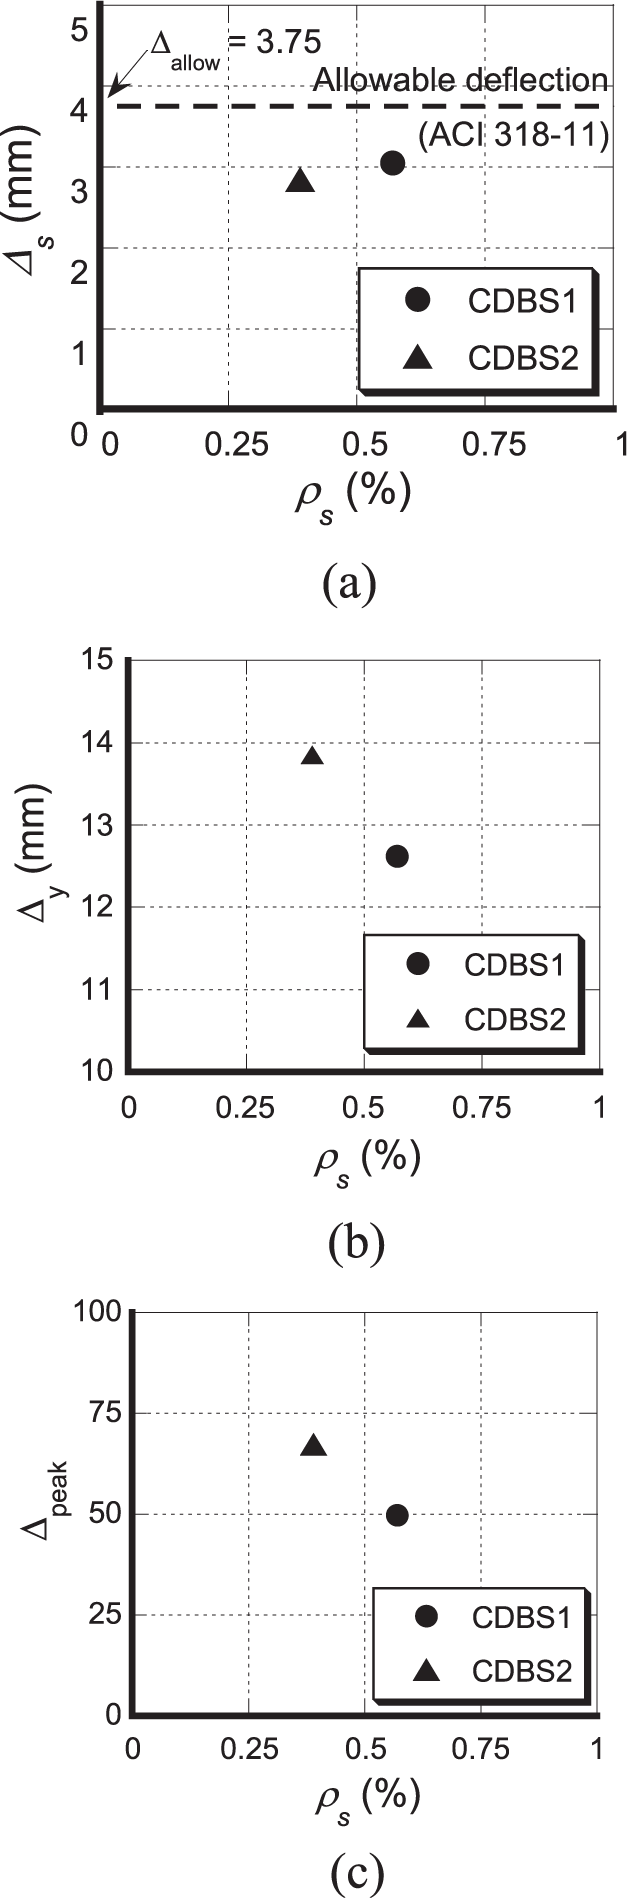
Relationship between deflection and ratio of rebar in drop panel: (a) at service load, (b) at yielding of steel beam, and (c) at peak load.
In the deflection at yielding of the lower flange in steel beams and at peak load, an increase in ρs leads to a decrease in the deflection, as shown in Figure 10(b) and (c). This is because a “stiff drop panel” with large ρs effectively contributes to the redistribution of stress that was generated from the mid-span of the beam to the drop panel zone. Gravity load at mid-span of the beam results in stress concentration at the mid-span of the steel beam first. After that, once the steel beam has yielded, the contribution of the drop panel to the external load rapidly increases and the tensile stress of the reinforcement in the drop panel also reaches its yield strength. The presence of a number of reinforcements in the drop panel can dissipate a large amount of energy from the steel beam. This results in the release of stress concentration in the drop panel and uniform distribution of stress along the drop panel to the beam. Therefore, it can be seen that ρs affects the deflection after yielding of the steel beam.
Reduction of negative moment
In CDBS, placement of a drop panel in the column zone can provide a reduction of the deflection of the beam by reducing the negative moment in the column zone and redistributing the moment from the mid-span of the beam to the drop panel zone. The reduction of negative moment and redistribution of moment in the CDBS can be observed from the strain distributions of the lower flange in the steel beam. Figure 11 plots the distribution of the strain in the lower flange of the steel beam. The vertical and horizontal axes in the figure represent the measured strain in the steel beam and the location at which the strains were obtained. In the figure, yield lines for the strain in the beam are also indicated. Dashed hair lines indicate data corresponding to service load and Δ y . The straight hair line indicates data for 2Δ y . Dashed and straight bold lines represent the data at 4Δ y and 6Δ y , respectively. In the figure, yield strains of the flanges in the steel beams are also indicated (alternate long and short dash lines in the figure). Since the strain plotted in the figure was the measured strain from the lower flange of the steel beam, positive strain in the figure means that the specimen behaved in a “U-shaped” manner. As shown in Figure 11, maximum tensile strains were observed at mid-spans of beams (locations 900 and 3600 mm in Figure 11) for all specimens. Strains in the drop panel zone (locations 1800, 2250, and 2700 mm in Figure 11) were found to be uniformly distributed. It can be seen that the negative moment in the column zone is effectively reduced due to the placement of the drop panel, and that the drop panel in the CDBS is effective in realizing a long-span structure. Also, the fact that negative moment in the column zone of CDBS2, which has a ρs of approximately 40% in CDBS1, is similar with that of CDBS1 provides a possibility in terms of the economical design of drop panels in CDBS. Therefore, it is perceived that the establishment of a rational design method for drop panels in the CDBS is required to achieve practical application of the CDBS to buildings.

Distribution of tensile strain at the lower flange of steel beam.
Structural performances of CDBS against lateral load: lateral-resisting properties
Design and construction of specimens
In order to investigate the structural performance of the CDBS against lateral load, two specimens, the CDBS and the conventional composite structural system (the so-called non-double beam system (DBS)), were constructed and tested. Figure 12 illustrates the reinforcing details of the two specimens. H-steel, H-150×75×5×7 (SM490), was used in an SRC column that had a sectional size of 250 mm× 300 mm. For the steel beams in the specimens, H-150×75×5×7 (SM490) for the CDBS and H-248×124×5×8 (SM490) for the Non-DBS were used. The number of longitudinal bars in the drop panel applied to the CDBS for the lateral-resisting test was same as that in the standard specimen for the gravity-resisting test, CDBS1 (Ard = 1013.6 mm2). The thickness and the number of rebars in the reinforced concrete slab of the CDBS in the lateral-resisting test were also the same as those in the standard specimen for the gravity-resisting test (CDBS1 in section “Structural performances of CDBS against gravity load: gravity-resisting properties”). In a similar manner to that employed for the gravity-resisting test, steel studs were wedged at 100 mm pitches to prevent slip deformation between the reinforced concrete slab and the steel beam. In Figure 12, the place at which the strain gauges were attached is also indicated. Geometric dimensions of the specimens and mechanical properties of the materials used in the lateral-resisting test are summarized in Tables 4 and 5. The compressive strength of the concrete used in the lateral-resisting test was 35 MPa. Yield strength values of the deformed bars were equal to 380.0 MPa for D13 and 373.3 MPa for D10.

Section and reinforcing details of specimen for the lateral-resisting test: (a) CDBS and (b) Non-DBS.
Main specifications and experimental parameters allocated to each specimen.
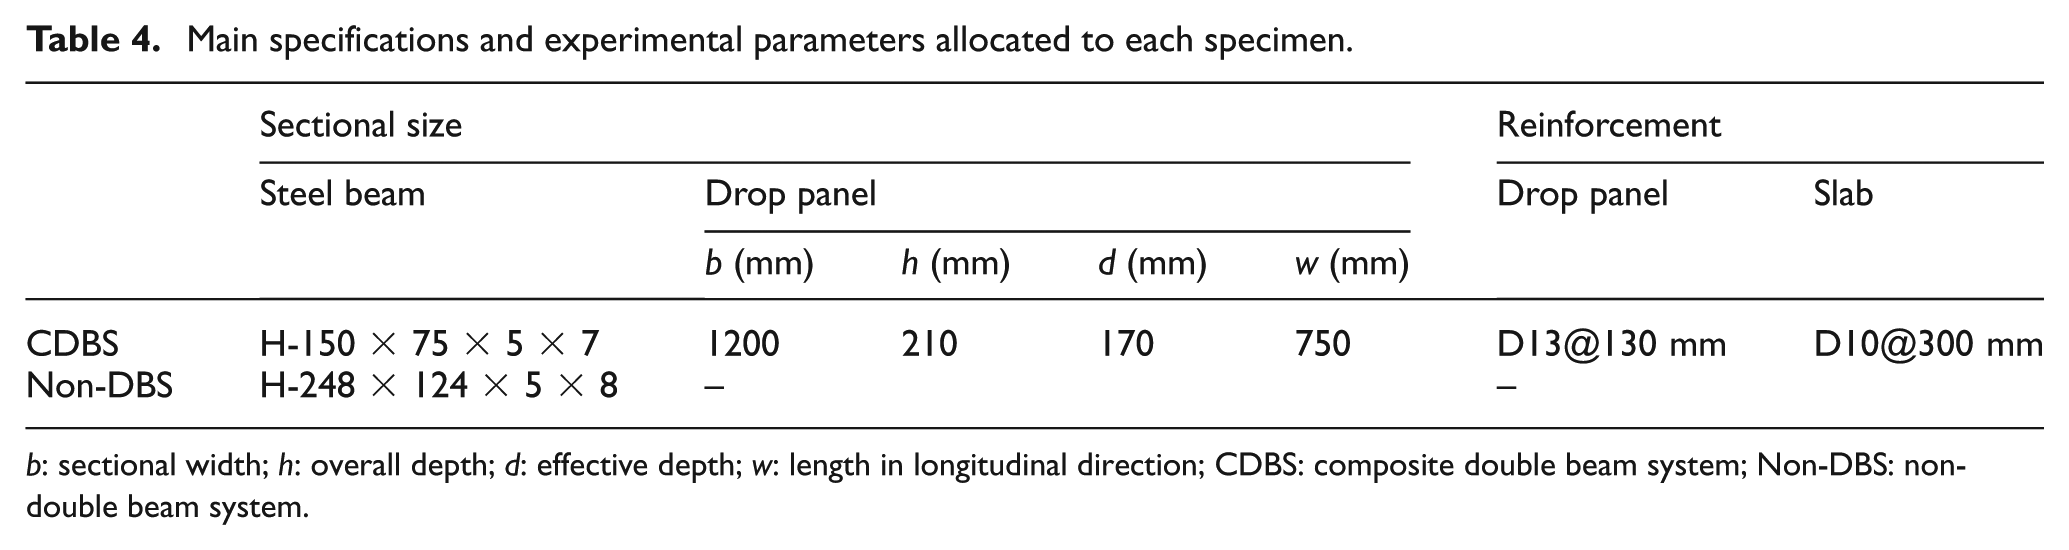
b: sectional width; h: overall depth; d: effective depth; w: length in longitudinal direction; CDBS: composite double beam system; Non-DBS: non-double beam system.
Mechanical properties of the materials used in this study.
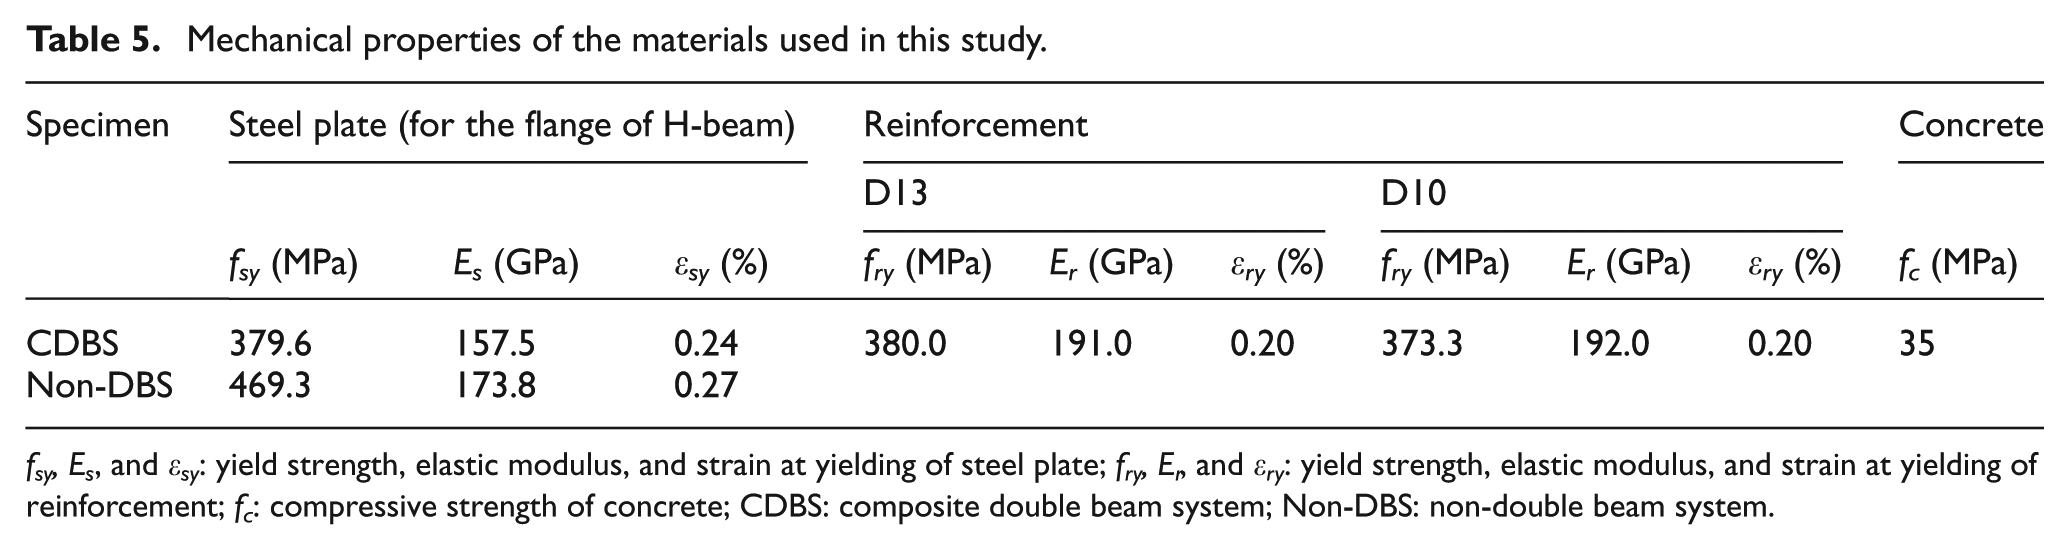
fsy, Es , and εsy : yield strength, elastic modulus, and strain at yielding of steel plate; fry, Er , and εry : yield strength, elastic modulus, and strain at yielding of reinforcement; fc : compressive strength of concrete; CDBS: composite double beam system; Non-DBS: non-double beam system.
Loading and measurements
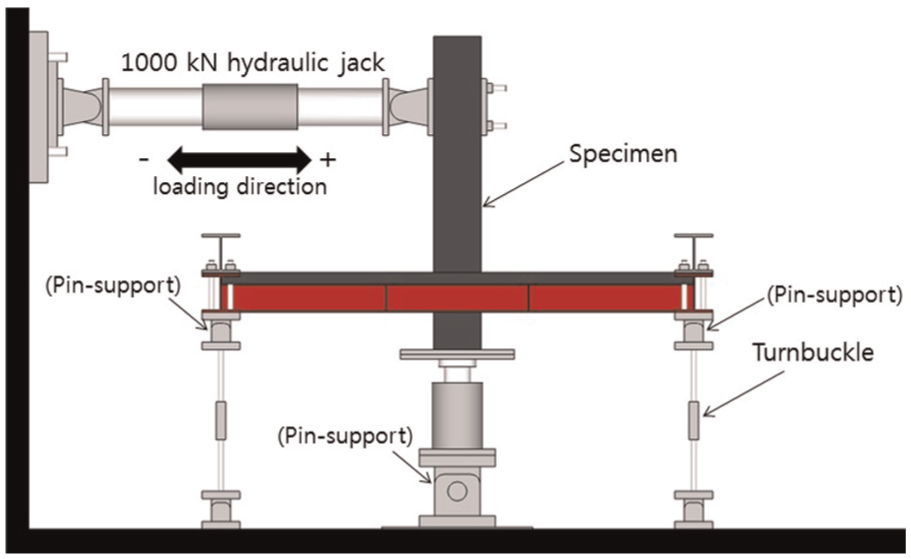
Figure 13 illustrates the loading set-up for the specimens of the lateral-resisting test. Specimen has pin-support at the right and left ends, and at the column base. Reversed cyclic loading was provided to the top of the column in the lateral direction using a hydraulic jack of 1000 kN. The first loading cycle was up to the member drift angle, R = 0.5%, and was followed by a series of drift angles comprising two full cycles to each of the drift angles of 1.0%, 1.5%, 2.0%, 2.5%, and 3.0%. Loading direction is also indicated in Figure 13.
Loading set-up for the lateral-resisting test.
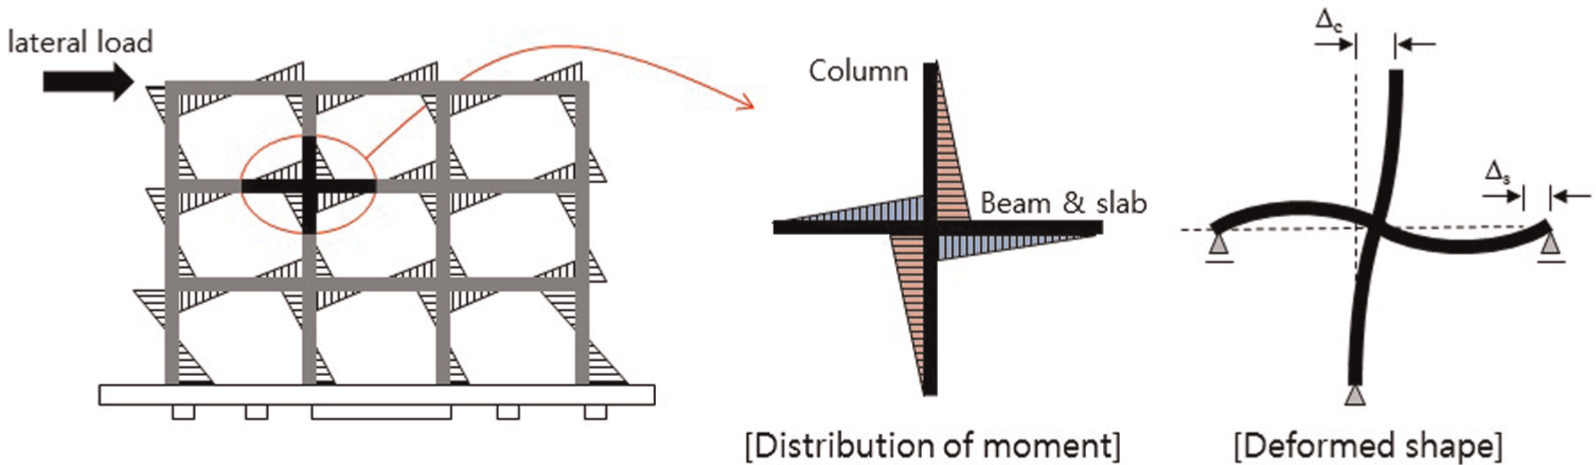
If lateral load, such as that from an earthquake or wind, acts on a building, the frame, consisting of columns, beams, and slabs, generally behaves in double-curvature moments along the lengths of the beams and columns. Therefore, it is desirable for structural engineers to perform a simulation with double-curvature moments for the investigation of the lateral-resisting system. This study covers a moment-resisting frame consisting of beams/slabs and columns of half-length. In the loading set-up in this study, since turnbuckles at the left and right ends of the slabs keep the initial vertical displacement at zero, distribution of the double-curvature moments, as shown in Figure 14, will be generated in the specimen.
Moment-resisting frame subjected to double-curvature by lateral load.
Shear force-drift angle relations
Figure 14 plots the shear force (lateral load)–drift angle relations of the CDBS and Non-DBS. Drift angle in this study, R, is defined as the ratio of the relative displacement of the columns and slabs, δ (= Δ c − Δ s ) to the column height, H (= 1055 mm). Column height, H, is obtained according to the distance from the hydraulic jack to the center of the composite section, consisting of reinforced a concrete slab and steel beam. The horizontal and vertical axes in the figure indicate the drift angle and the lateral load (shear force), respectively. As can be seen in Figure 15, the lower flanges of the steel beams in the Non-DBS yielded at R = 1.17% of the R = 1.5% cycle. Also, initial stiffness starts to decay at approximately R = 1.0% in the Non-DBS, while initial stiffness in the CDBS was maintained until R = 2.5%. This is because the steel beams only dissipate energy generated from external forces in the Non-DBS, while the drop panels and steel beams in the CDBS resist the external force together. No rapid degradation of load-carrying capacity of the CDBS or Non-DBS was observed up to the conservative drift limit, R = 1.5%, as was suggested by the structural design provisions (ACI Committee 318, 2011). The test was terminated at the R = 2.5% cycle due to unexpected tensile failure of the longitudinal bars in the column base wedged with the steel plates in the loading apparatus. Maximum loads of 105.9 kN for the CDBS and 77.9 kN for the Non-DBS were observed at R = 2.5%. Table 6 summarizes the experimental results observed for the positive loading cycles in this test.

Lateral load–drift angle relations.
Summary of experimental results in lateral-resisting test.
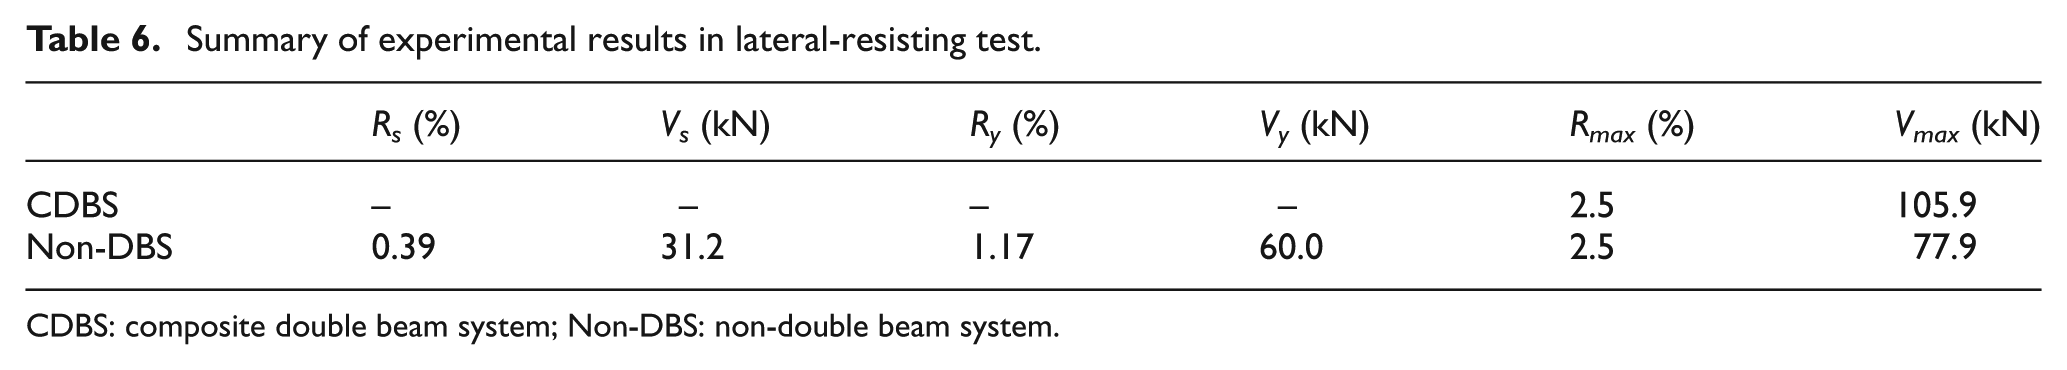
CDBS: composite double beam system; Non-DBS: non-double beam system.
Crack patterns
Figure 16 illustrates the crack pattern of each specimen at termination of the test. Primary cracks in the slabs were initiated adjacent to the column base. With increasing of the drift angle, the cracks propagated in longitudinal and transverse forms. While most cracks of slabs in the Non-DBS concentrate in the vicinity of the steel beams or columns, cracks of slabs in the CDBS were evenly distributed across the whole faces of the slabs. Also, excessive opening of cracks was observed in the Non-DBS. It should be noted that the tensile stress in the Non-DBS was concentrated adjacent to the steel beams or columns. Hence, it can be seen that most of the energy from the external force is dissipated by the steel beams only in the Non-DBS. This points out that compared to the conventional composite structural system, the CDBS is effective at preventing the concentration of damage at specific portions in the structures and the catastrophic collapse of buildings. Furthermore, since the test was terminated at R = 2.5%, no crushing of concrete was observed.
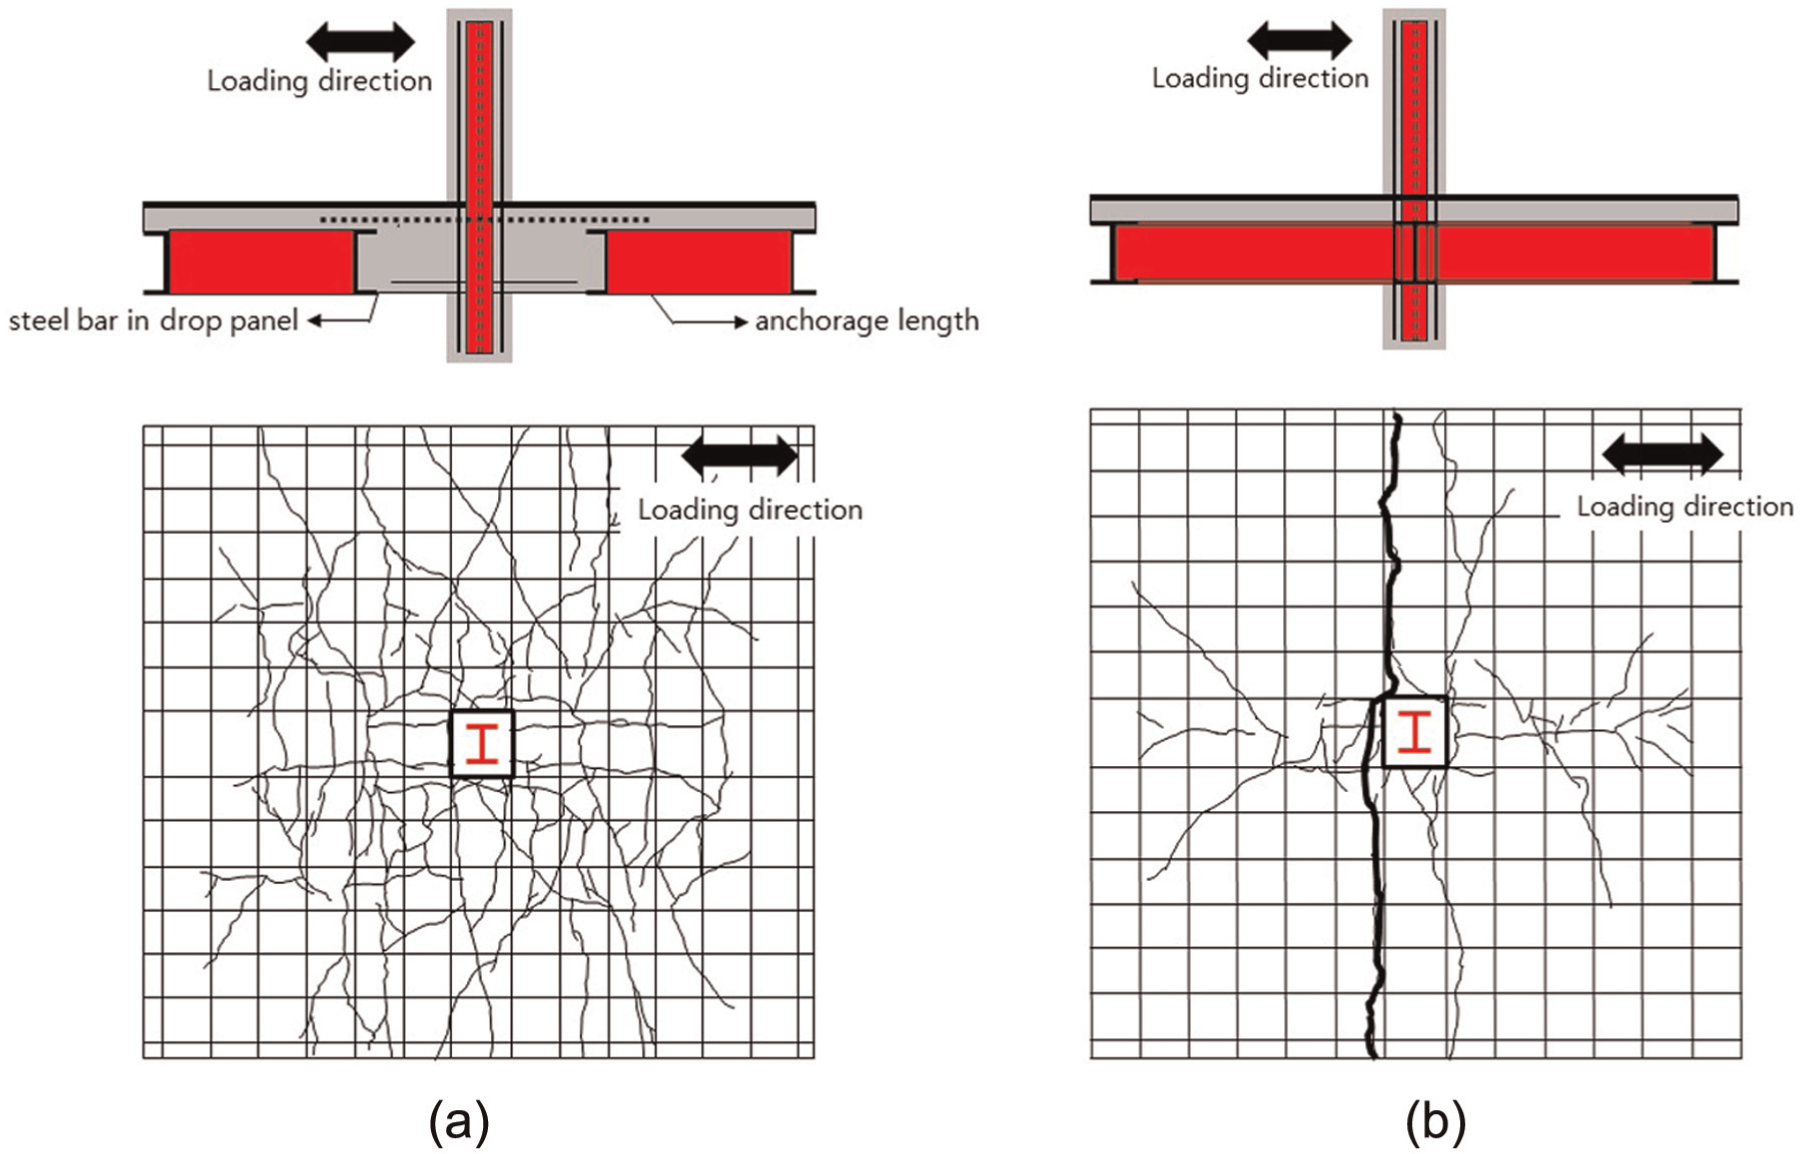
Crack patterns at termination of test: (a) CDBS and (b) Non-DBS.
Strain distribution in steel beam
Since the specimens in this test were subjected to double-curvature, the right half of the slabs in specimens deformed in an “inverted-U shape” under positive loading. In the same manner, the left half of the slabs deformed in an “inverted-U shape” under negative loading. Figure 17 plots the distribution of the strains in the lower flanges of the steel beams and reinforcements of the drop panels. The strains were obtained using strain gauges attached to the lower flanges in the steel beams and to reinforcements in the drop panels. The vertical and horizontal axes indicate the measured strains and the locations at which the strains were measured. The strains under positive and negative loading are plotted on the right-half and left-half sides of the horizontal axis in Figure 17. As can be seen in Figure 17, tensile strains of the flanges in the steel beams in the Non-DBS reached their yield strain at the R = 1.5% cycle. Tensile strains of steel beams in the CDBS were distributed along the drop panel zones, while those in the Non-DBS were concentrated in the column zones. This points out that the CDBS is effective at dispersing the tensile stress generated in the column zone to the drop panel zone. In the test, there is a limitation in terms of investigating the tensile stress generated adjacent to the column zone. Using push-over analyses with a package of structural analysis software, the distribution of the stress adjacent to the column zone will be investigated in the next section.

Distribution of strain.
Push-over analysis of CDBS for the lateral-resisting properties
Outline of finite element analysis modeling
Push-over analyses using a package of structural analysis software, MIDAS (Ver. 835), were carried out on the CDBS and Non-DBS specimens. Since the aim of the analysis was to compare the lateral resistance properties of the CDBS and Non-DBS, composite structural systems with and without drop panels were selected as the analytical specimens (drop panel only was set as the analytical parameter). The analyses of the CDBS and Non-DBS were carried out with R = 2.5% in the same manner with the static loading test. The analytical results were compared with the experimental results and scrutinized to determine the lateral-resisting properties of the CDBS. In the analysis, the same geometrical and material properties used for the specimens in the test (Tables 4 and 5) were applied.
Domain discretization
Elements formed in the analyses are illustrated in Figure 18. Each element in the specimen ranges from 75 to 87.5 mm long in the longitudinal direction depending on the location of the steel beams, slabs, and drop panel zones. The domain discretization in the transverse direction is 100 mm long.
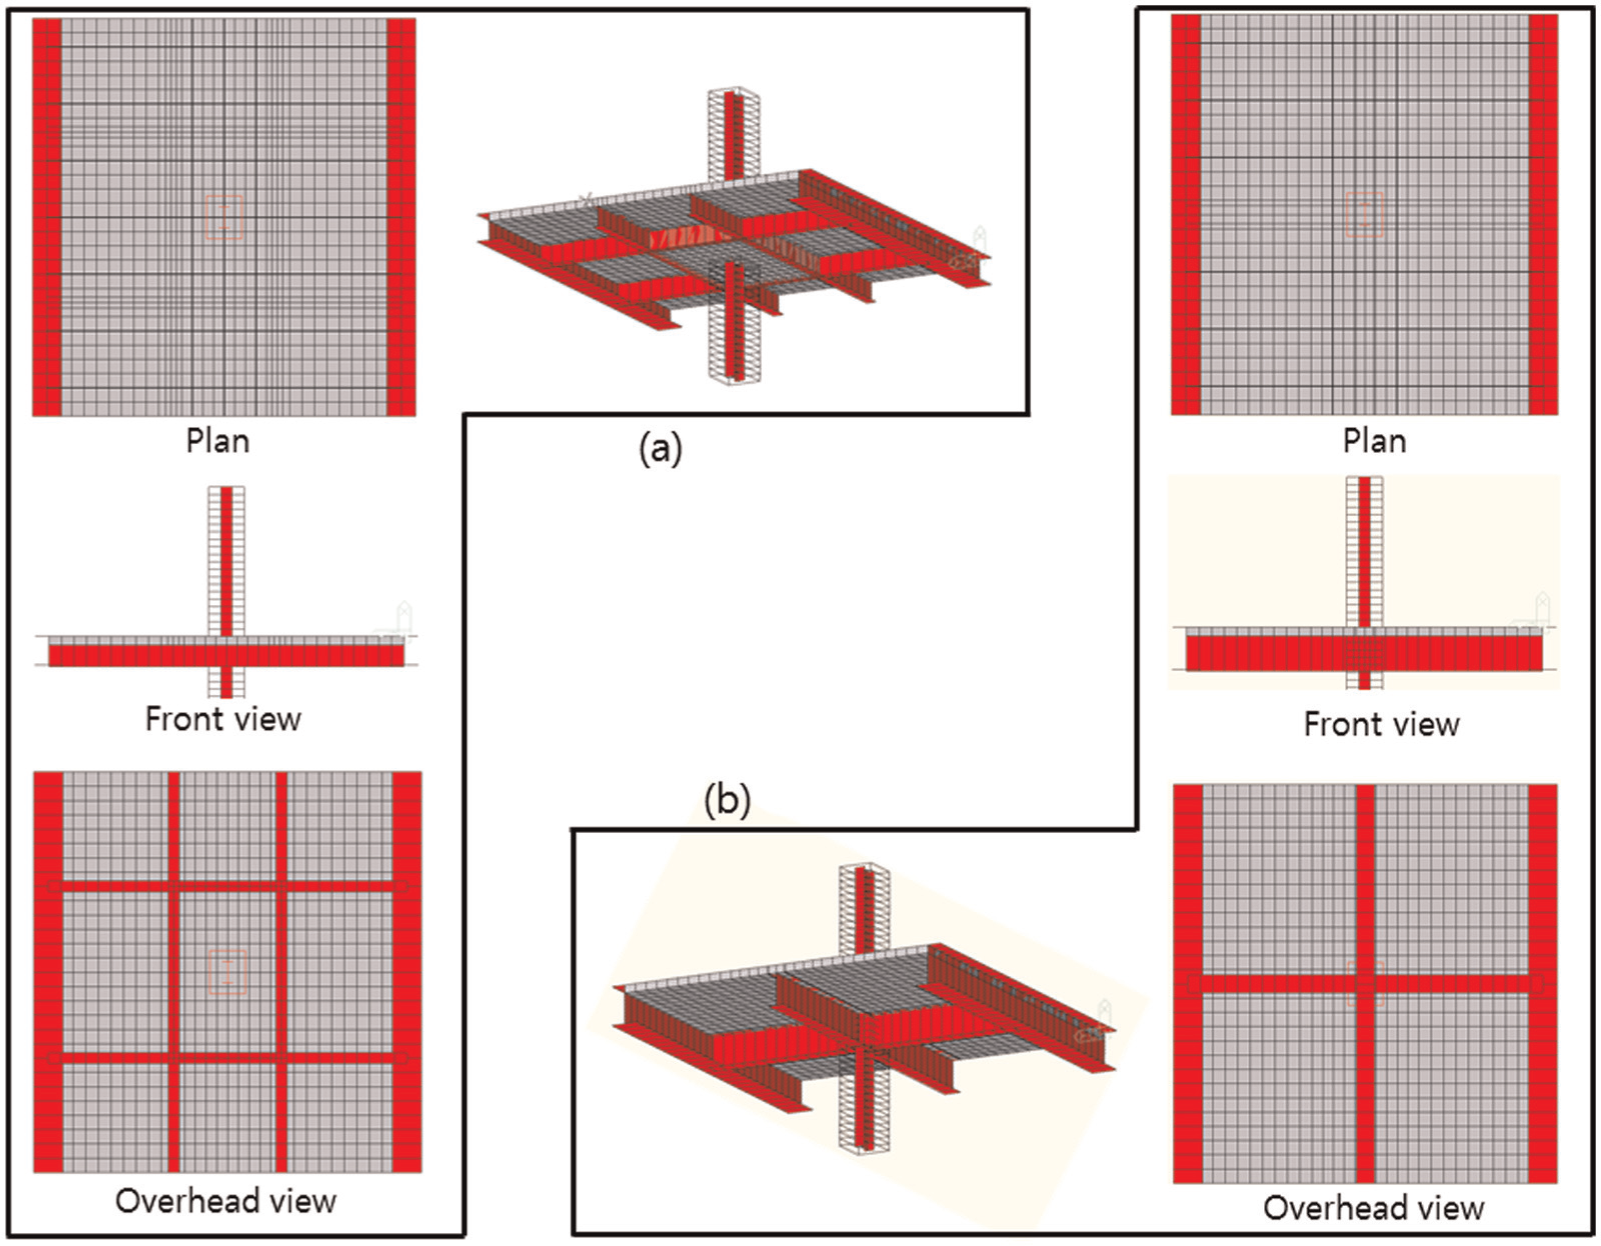
Analytical models for the push-over analysis: (a) CDBS and (b) Non-DBS.
Material constitutive laws: concrete
Plate elements for which it is possible to neglect the displacement in the thickness direction were used for the concrete slabs. Since no crushing of concrete was observed up to R = 2.5% in the test, the stress–strain relation of concrete was assumed to be elastic (linear).
Material constitutive laws: steel plate (flange and web of H-beam) and reinforcement
For steel plates in the flanges and webs of H-beams in the CDBS and reinforcements in all specimens, the stress–strain curve can be defined as elastic (linear). For the Non-DBS, in which the H-beams yielded, it is assumed that plastic deformation of the H-beams is concentrated in the column zone. A bilinear type for the properties of the plastic hinges in the Non-DBS is applied, as shown in Figure 19.
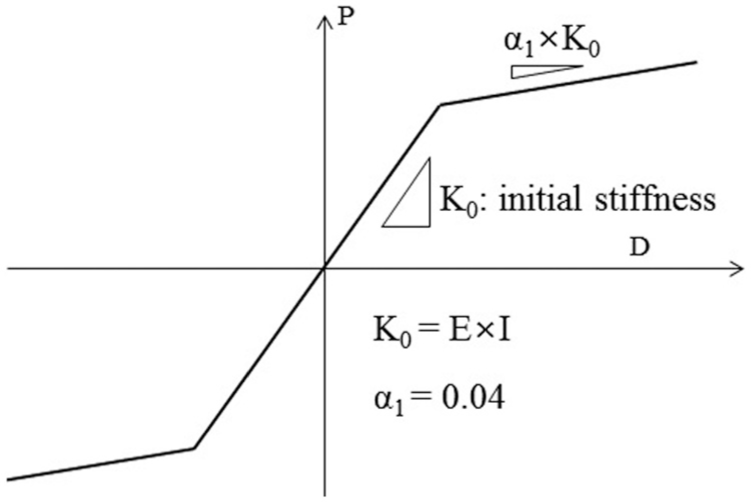
Property of plastic hinge of steel beam.
Comparison of analytical results with experimental ones
Figure 20 plots a comparison between the observed lateral load–drift angle relations and the predicted ones. The horizontal and vertical axes in Figure 20 indicate the drift angle and the lateral load, respectively. Also, stress distributions of the H-beams and drop panels in the longitudinal direction are plotted in Figure 21. The horizontal and vertical axes in Figure 21 represent the location in the longitudinal direction of the specimen and the tensile stress in the flanges of H-beams, respectively. Observed stresses in Figure 21 were obtained by taking the product of the elastic modulus of the steel plate and the strain, as measured by the strain gauges. As can be seen in Figures 20 and 21, the analytical results obtained by analysis matched the experimental results closely. The analyses also showed the stress distribution in the reinforced concrete slabs.
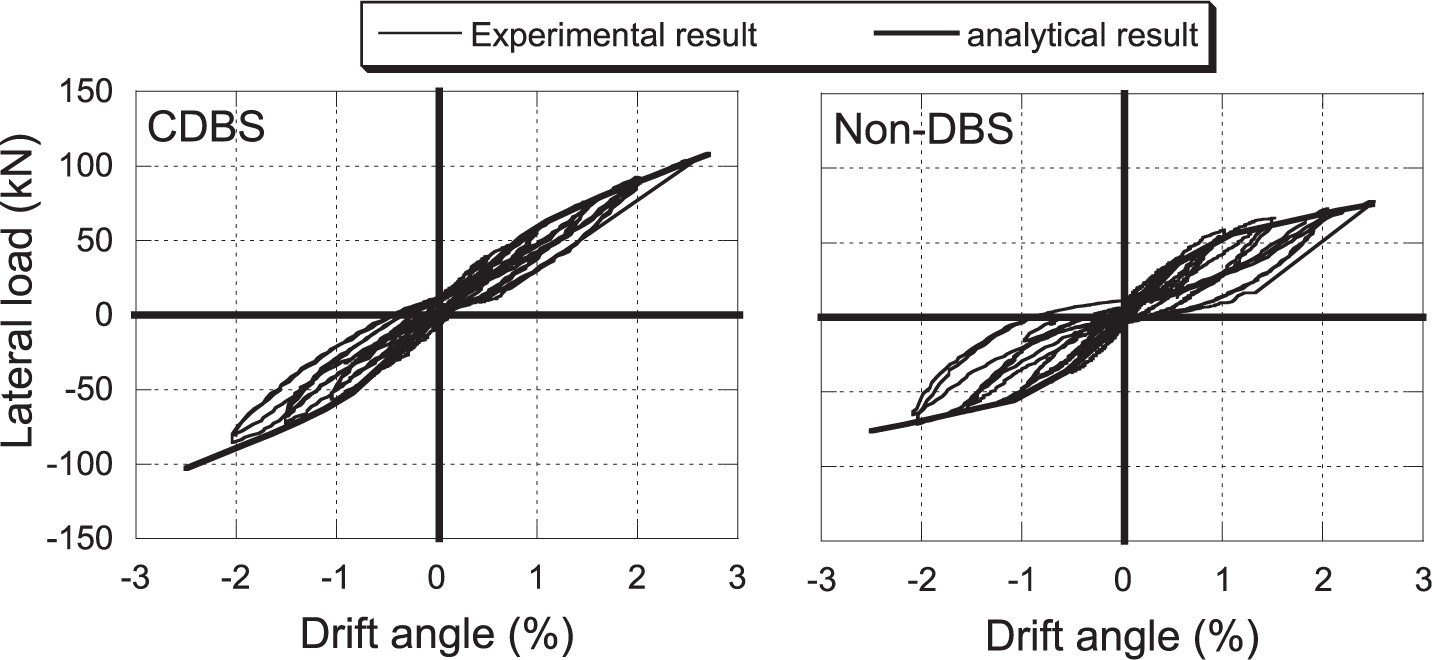
Comparison of observed lateral load–drift angle relations with predicted ones.
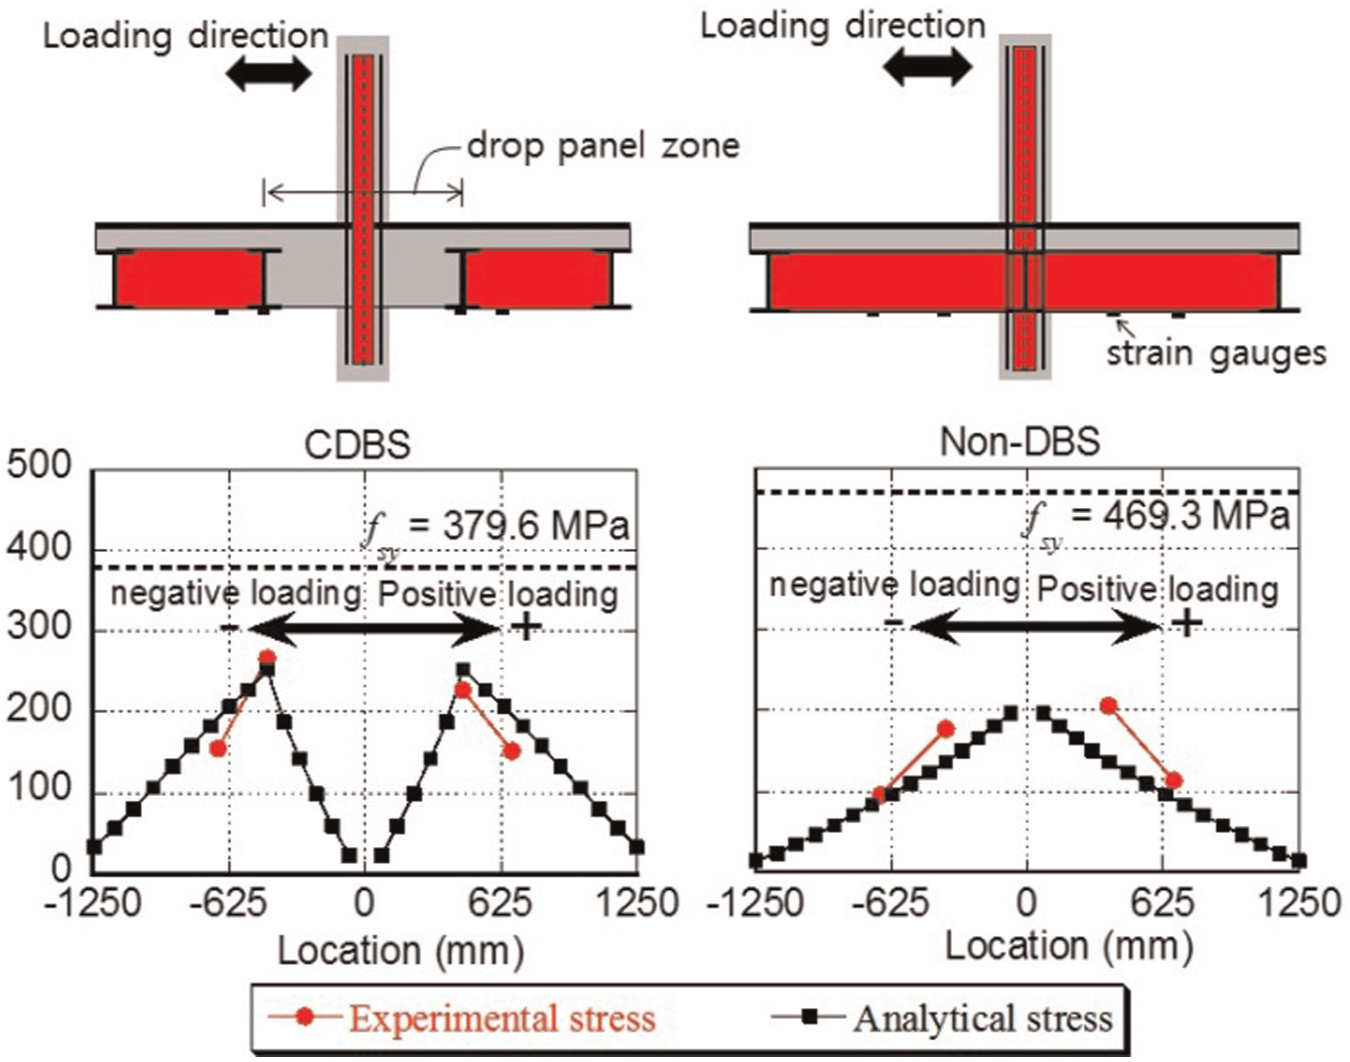
Comparison of experimental and analytical strain in steel beam and drop panel.
Figure 22 plots the tensile stress distribution contour of the plate element (slab) at R = 2.5% in gray-scale. The deep color in the contour represents the high tensile stress. In Figure 22, crack patterns at R = 2.5% observed in the test are also indicated. As can be seen in Figure 22, the tensile stress of the slabs in the CDBS was evenly distributed along the longitudinal and transverse directions, while the stresses in the Non-DBS were concentrated in the vicinity of the boundary between the longitudinal steel beams and the slabs. Figure 22 points out that the presence of a drop panel in the structural system has an effect on the dispersibility of the tensile stress in the column zone and in the prevention of the catastrophic failure of columns.
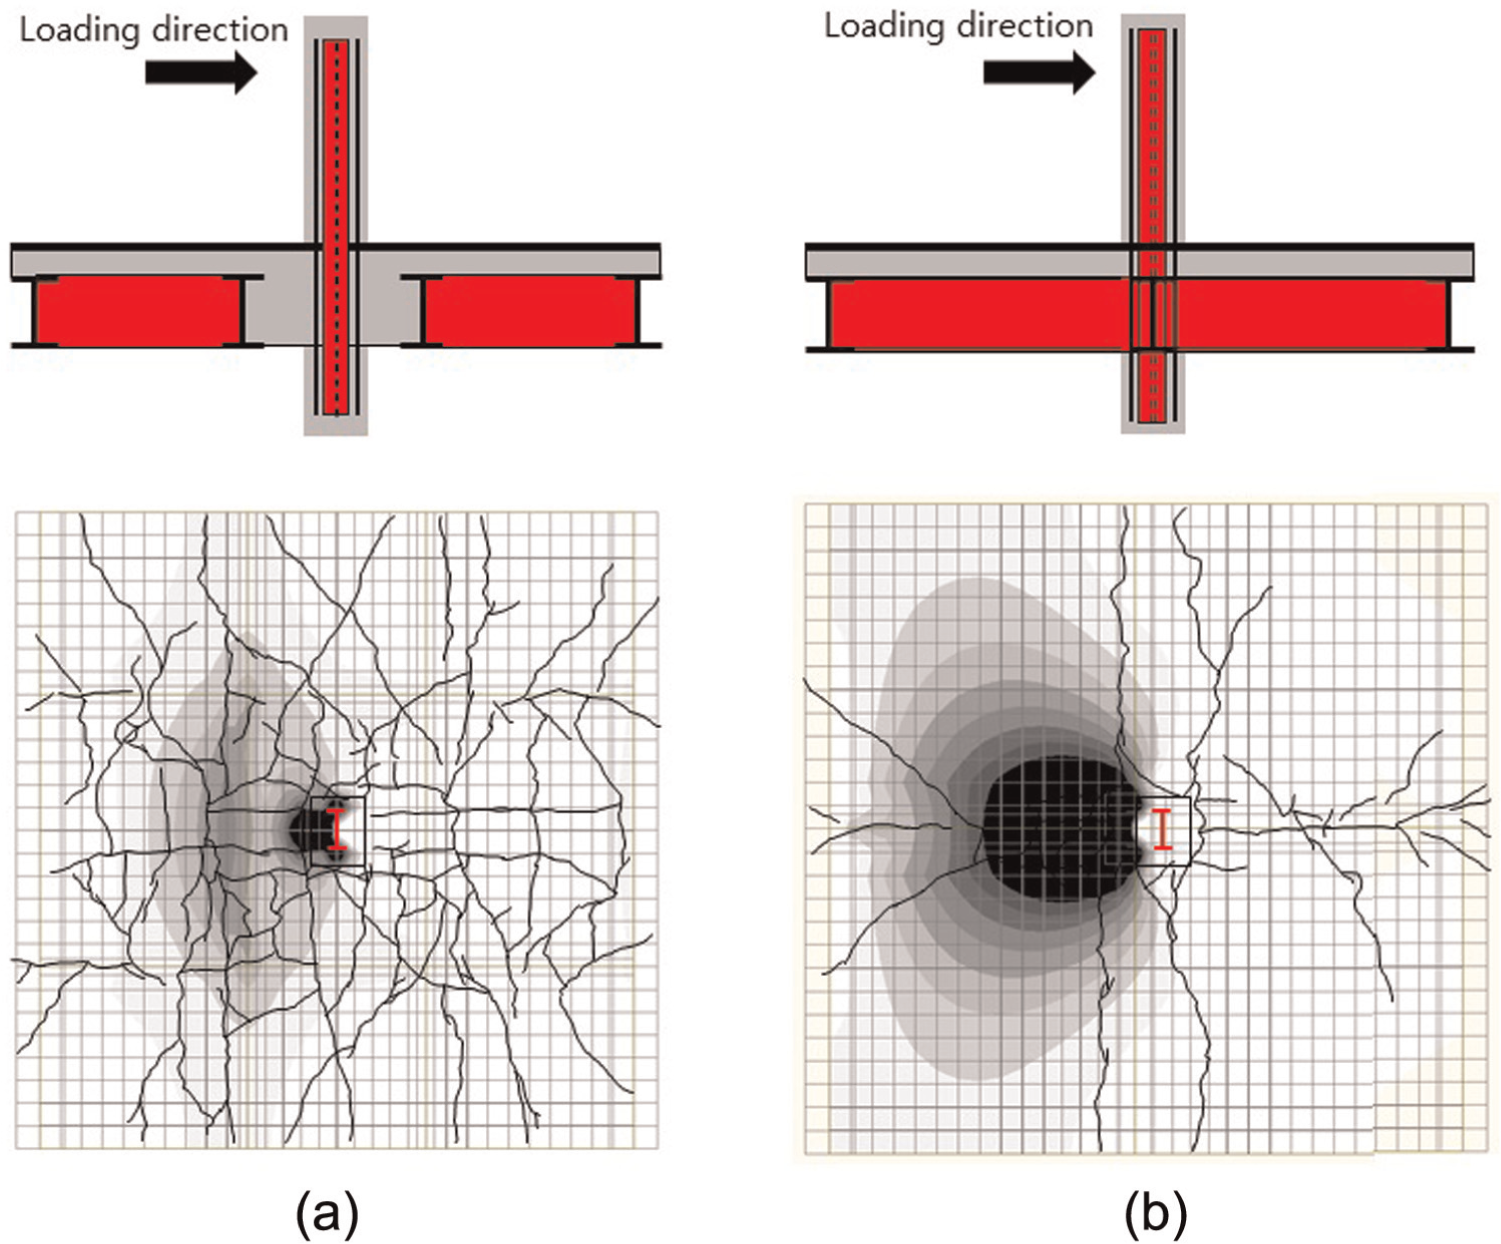
Contour of tensile stress distribution in slab of each specimen: (a) CDBS and (b) Non-DBS.
Conclusion
A new composite structural system consisting of double steel beams, drop panels, SRC columns, and reinforced concrete slabs was developed in this study. In order to investigate the gravity- and lateral-resisting properties of the proposed system, static loading tests of two series were conducted. In the investigation of the system for its lateral-resisting properties, a push-over analysis using a package of structural analysis software, MIDAS, was also carried out. The summarized findings below were obtained:
In terms of the gravity-resisting properties, all specimens (CDBS1 and CDBS2) exhibited ductile behavior; Ard , adopted in the design of the specimens, was appropriate. Also, the number of rebars in the drop panels, Ard , is effective to control the deflection of the beams. It can be concluded that the placement of a drop panel in the structural system significantly contributed to the reduction of deflection of the beams.
In the test of the system in terms of its lateral-resisting properties, it was found that a system with drop panels, compared to the conventional composite structural system, was effective at preventing the concentration of damage at specific portions of the structure and the catastrophic collapse of the building. This corresponds to the analytical results in which it was found that the tensile stresses in reinforced concrete slabs are evenly dispersed.
All members in the CDBS behaved in an integrated manner, while those in the conventional composite structural system (Non-DBS) behaved in a separated manner. This was obtained by the “well-simulated” push-over analysis using the structural analysis software, MIDAS.
Footnotes
Declaration of Conflicting Interests
The author(s) declared no potential conflicts of interest with respect to the research, authorship, and/or publication of this article.
Funding
The author(s) disclosed receipt of the following financial support for the research, authorship, and/or publication of this article: This work was supported by the National Research Foundation of Korea (NRF) grant funded by the Korea government (MSIP)(No. NRF-2015R1A2A2A01003397, 2014R1A1A2005431) and Functional Districts of the Science Belt support program, Ministry of Science, ICT ad Future Planning (2015K000281). A special thanks are also extended to Kwang-Man Kim, CEO of Baro Construction Technology, for supporting and making advice in conducting this research.