
Abstract
Tensegrity tower structures are innovative lightweight structures that feature a system of tension members arranged such that compressive members do not directly interact. In this article, a 7-stage tensegrity tower structure was designed and a modified genetic algorithm was used to optimize the prestress distribution within and shape of the tower. The optimization result shows the structure’s lateral stiffness improves considerably compared with the initial model. Moreover, in order to determine the construction process, a construction scheme utilizing initial prestress and compensating prestress was proposed and a computational program named compensating prestress design program was developed. This program can help identify target tension and joint coordinates at each construction step such that the cable tension distribution in the completed structure meets designer-specified target values. Sensitivity analysis was also introduced in this program and Key Cable Theory was proposed as a result in order to improve the precision of compensating prestress design program. An illustrative example showed after applying compensating prestress design program, tension errors were all controlled within a small range.
Introduction
Tensegrity structures are prestressable truss-like systems involving tensile cable elements and compressive struts. In recent years, the concept of tensegrity has been widely used to build long-span roof structures, such as cable domes, but its application in vertical direction is seldom reported, except for some sculptures and non-functional structures, for example, Needle Tower (Snelson, 1990) and Warnow Tower in Rostock (Schlaich, 2004). This structural form has received much attention in aerospace engineering because of its lightweight, deployable, and controllable characteristics (Sultan et al., 1999, 2001, 2002a, 2002b; Sultan and Skelton, 1997, 1998a, 1998b). Despite these potential advantages, however, tensegrity towers seldom see practical use. In this article, a 7-stage tensegrity tower structure is proposed to function as TV tower, while also providing a tourist platform on the top storey.
Tensegrity structures are usually designed by trial and error and engineering intuition. Yet, structural efficiency of tensegrity structures is highly dependent on its shape and distribution of prestress, and thus, optimization can offer advantages in systematically exploring this design variable space. Several optimization attempts have been made on cable domes (Kawaguchi et al., 1999; Yuan and Dong, 2002), where design variables included prestress distribution, shape, and cross-section area. Masic et al. (2006) used Sequential Quadratic Programming (SQP) to optimize the topology and geometry of some tensegrity structures, including a singular valve decomposition (SVD) tensegrity tower. All these attempts proved optimization played a critical role in improving structural behavior.
Since tensegrity tower structures are seldom built, and thus, there is not much literature or experience regarding their construction. The Warnow Tower, 62.3 m in height, is an exception to this. Its tensegrity units were all pre-fabricated off-site and then hoisted for connection to the base structure. Its struts of adjacent stages are linked on ends, which technically violates the definition of tensegrity that compressive members should be discrete (Motro, 1992), but this simplification made construction much easier. As for other prestress structures like cable domes and suspen-domes, in-depth studies on constructions have been made (Guo et al., 2009; Wang et al., 2012; Yuan and Dong, 2001) and many practical structures have been built. It should be mentioned that prestress compensation methods refer to situations when prestressing cannot be performed only once, but rather tension change requires subsequent tensioning in an iterative manner. Numerically, this is often performed by iteratively applying compensating temperature loads to the cables, often used in space grid structures (Zhuo and Koichiro, 2004) and suspen-domes (Wang et al., 2012).
This article is organized as follows. In section “Introduction to the model,” an introduction of the model is made, including topology, geometry, nomination, and so on. In section “Optimum design of tensegrity tower structure,” prestress and shape optimization are conducted. In section “Illustrative example,” a methodology for construction process design is proposed along with a computational program compensating prestress design program (CPDP). An example of this methodology is given in section “Illustrative example” and we finish with some conclusions in section “Conclusion.”
Introduction to the model
This proposed structure’s topology is largely inspired by Snelson’s Needle Tower. It consists of seven 3-bar tensegrity units, which are connected with draw and sling cables. As the struts are discrete, it is a true tensegrity structure. There is a 30° rotation angle between the upper and lower triangle of the unit, and the rotation directions of two adjacent units are opposite in order to offset the twisting behavior of the entire structure. A tube for the elevator with a diameter of 3.5 m was added inside the structure and attached to the outer structure with tube draw and sling cables. The configuration of the structure is shown in Figures 1–4. Each cable name represents a group, including three cables, which share the same design tension. Both draw and sling cables include two sets of length: the shorter is named draw/sling cable A and the longer is named draw/sling cable B. A prefix denoting position is added to each group of cables, for example, “1-stage upper horizontal cable” represents the upper horizontal cables of the first stage unit, “1-2-stage draw cable A” represents the draw cables A connecting the first and second stage units, and the same goes for other cables.

3-bar tensegrity unit.

Connection between units.
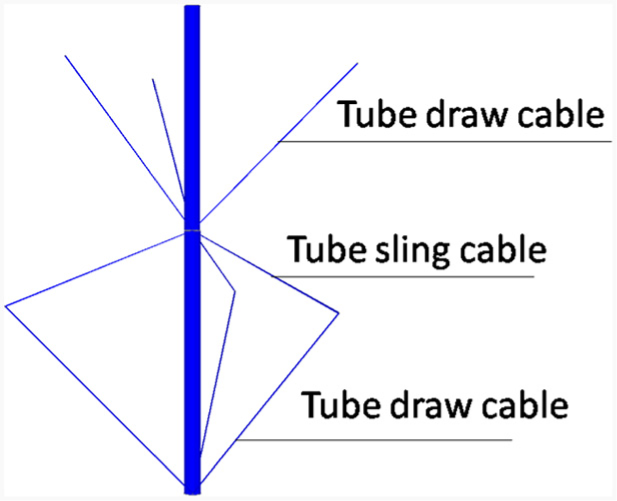
Cables for the elevator tube.
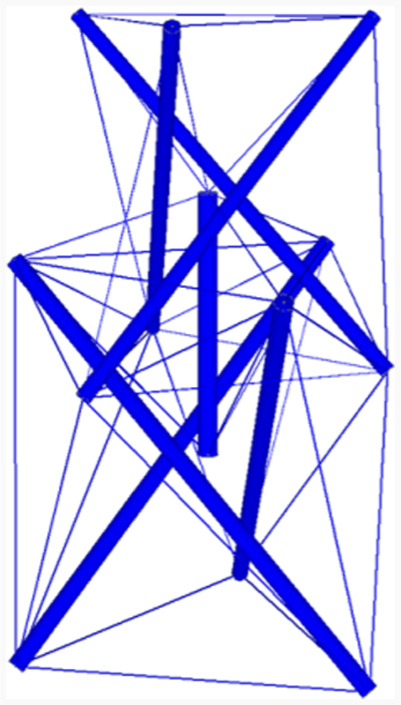
Combination of two stages.
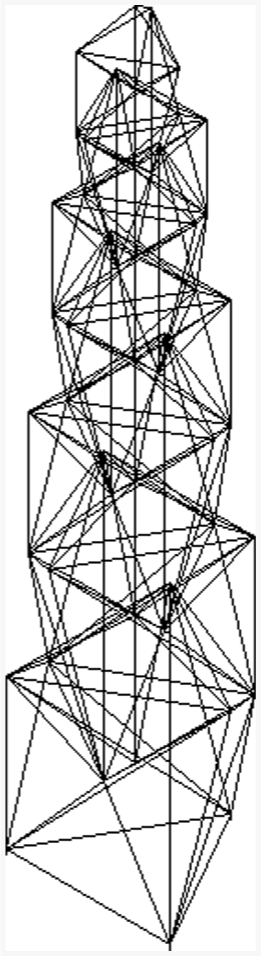
The total height of this structure is 86.28 m, and an antenna will potentially be added on the top making it to reach 120 m high. The elevation view and 3D view are shown in Figures 5 and 6, respectively.

Elevation view.
3D view.
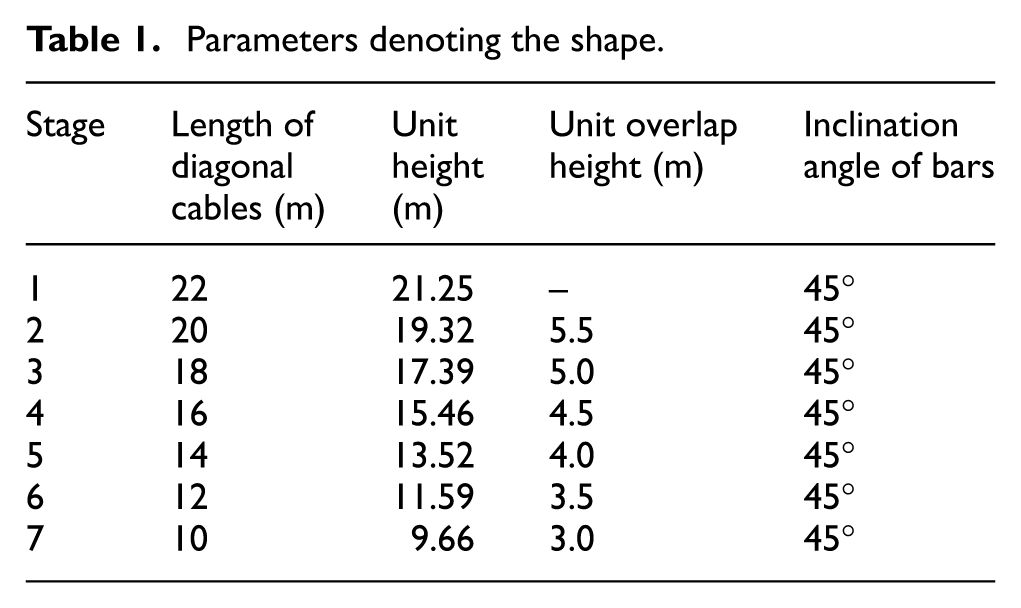
The compressive bars are made of steel tubes with a Young’s modulus of 206 GPa, and the cables are made of steel wires with a Young’s modulus of 195 GPa and yield stress of 1870 MPa. The parameters denoting the shape are shown in Table 1. The assignment of sections is shown in Table 2.
Parameters denoting the shape.
Assignment of sections.

A special joint is specifically designed to facilitate compensating prestress. The joint, referred to as the Dragon Claw Joint, is shown in Figure 7 and consists of a hollow sphere joint that is attached to the end of struts, with some antenna tubes on it. A set of threaded tubes is welded to the antenna tube and the cable goes through the threaded tubes. The tension of the cables is then adjusted by screwing the threaded tubes.
Dragon Claw Joint.
A common finite element (FE) software, SAP2000, is used in this article for nonlinear solving. Cables and struts are simulated with two-node frame element.
Optimum design of tensegrity tower structure
In a typical genetic algorithm (Goldberg, 1989), the evolution starts with a population of randomly generated designs that are encoded into binary strings (genes). The population in each iteration is called a generation. In each generation, the fitness of every design in the population is evaluated and the designs with larger fitness have a higher possibility of being selected from the current population to serve as “parents.” New designs are then creating by mixing components of two parent designs through operations known as crossover and mutation. In this work, we use two-point crossover with mutation rates of 1%. The resulting new designs represent the next generation, and this evolution continues until convergence, typically defined as a large number of iterations that the best, or elite, design is unchanged.
The prestressed tensegrity tower problem is challenging in that it is very easy for the system force distribution to lead to cables slack. To help overcome this challenge, we have modified the typical genetic algorithm slightly. If an elite design has slack cables and remains elite for 50 generations while some cables are still slack, the mutation rate of genes of the slack cables is changed from 1% to 50%, which significantly increases the versatility of the population and helps avoid early convergence of infeasible designs with slack cables. If the elite design then changes, the mutation rate is returned to 1%.
Design variables
In most FE software, a common approach to applying prestress in cable models is to apply an internal temperature load to the cables. There are 58 groups of cables in the proposed structure, the temperature loads of these 58 groups were defined as design variables, denoted as Tn , with n = 1, 2,…, 58.
The structure’s height was prescribed, and thus, only four design variables denoting the structure’s shape are used as follows:
D 1: the length of diagonal cables in the first stage, equal to the diameter of circumscribed circle of three upper or lower horizontal cables;
d: the length difference of diagonal cables in two adjacent units. That is to say, the length of the second stage diagonal cables is
Definition of
We introduce some limits to these variables to prevent significant shape changes.
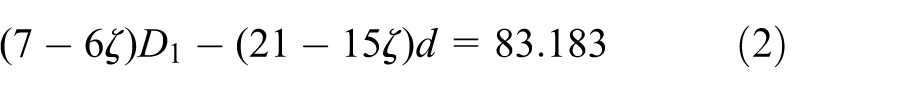
Since the total height is fixed to 83.183 m, the following constraint is needed
where
Equation (1) can be written as
Considering the constraints of D
1 and
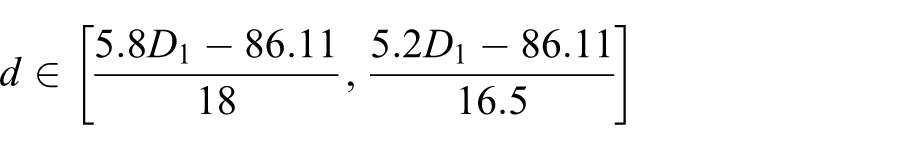
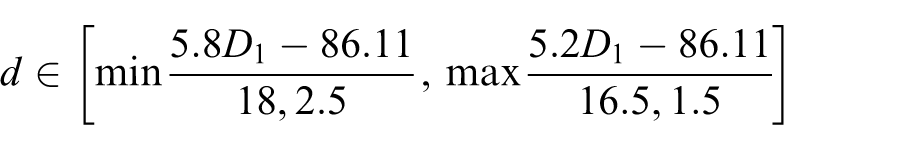
In order to prevent some unreasonable values of d which may make the structure out of shape, we introduce some limits to d
Objective function
The governing load in tensegrity towers is typically lateral wind loads and, with generally low lateral stiffness, lateral displacements and vibrations often become the governing design constraints. We therefore look to minimize the lateral deflection

A nonlinear FE analysis is performed to calculate deformations under self-weight and wind load according to Chinese Structural Load Code 2012.
The stress in the members is constrained as follows
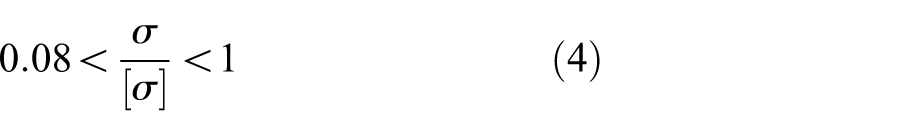
where
As typical in genetic algorithms, a penalty function is used to penalize infeasibility. This is computed as
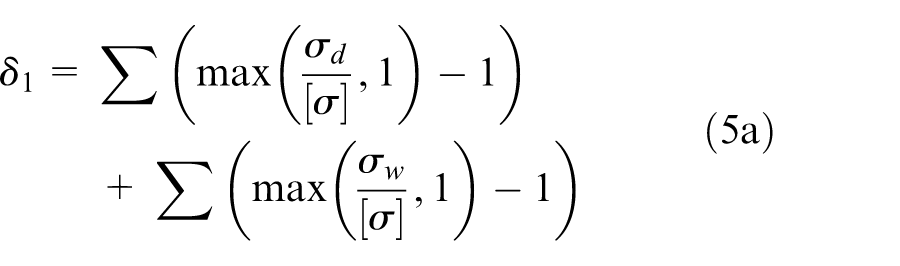
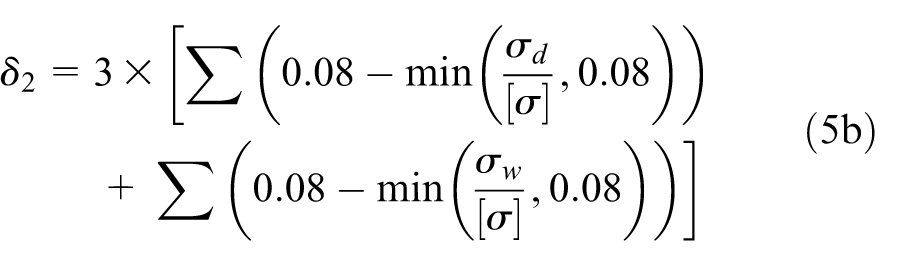
where
Then our objective function can be written as

The optimization problem is expressed as follows

Optimization result
Before running the optimization, we attempted to design the prestress distribution by trial and error, as is often done in practice. This proved to be quite challenging due to the complexity and scale of the tower. Modifications to individual cable prestressing frequently led to slack being introduced somewhere in the structure, and satisfying the constraints conditions was quite time-consuming and challenging. After a significant number of iterations, we arrived at a feasible solution having a top node displacement of 0.474 m (K = 2.108). This solution had the least displacement in all feasible solutions we got in this trial-and-error process, and no cable was slack.
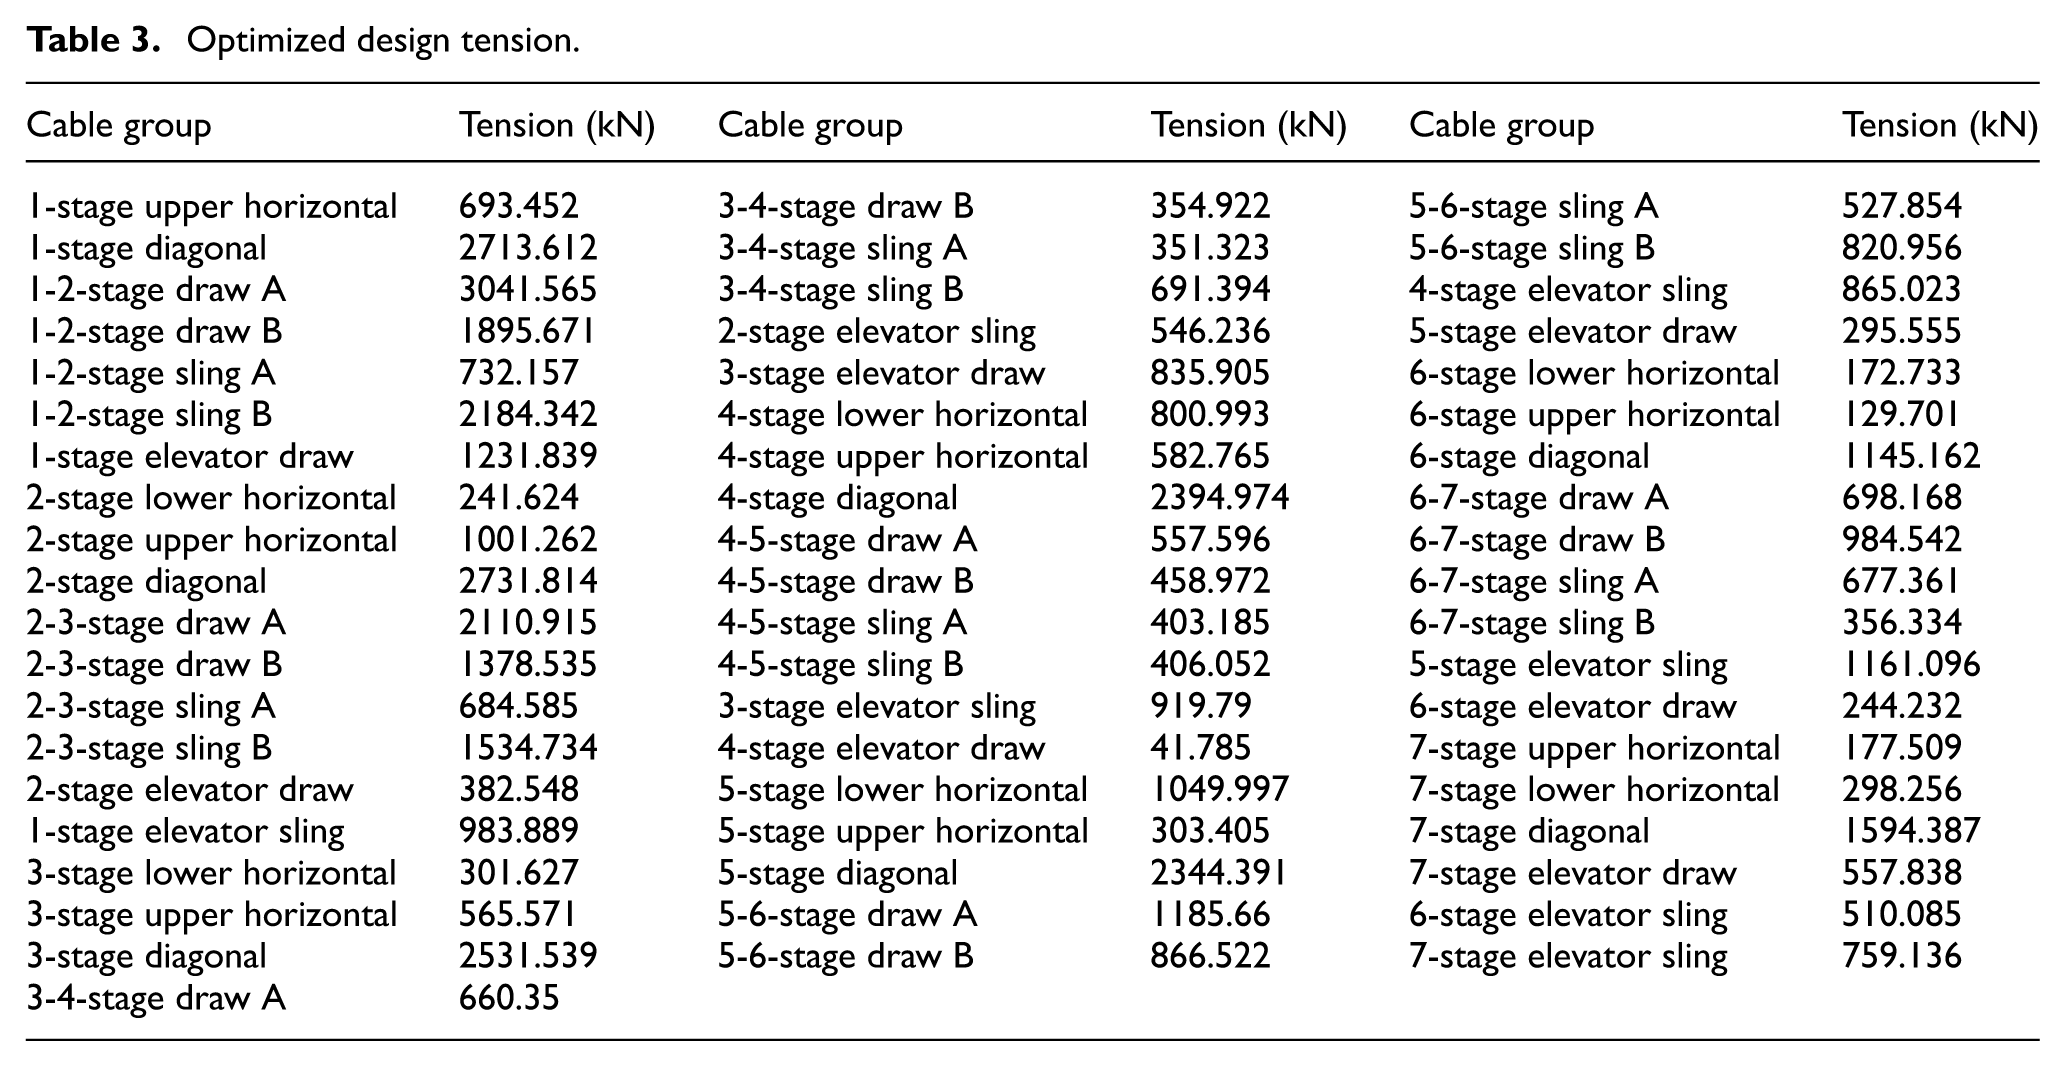
The optimization problem was then solved with the genetic algorithm using a convergence criterion of 100 generations without a change in the elite design. The optimized solution is feasible and features a top point displacement of 0.268 m on the top (K = 3.731), an improvement of 77% over the ad hoc-designed case. No cable experiences slack or exceeds the stress constraint under both dead and wind load case. The optimized shape parameters are D 1 = 22.453 m, d = 1.884 m, ζ = 0.2959, µ = 0.3324. Although these shape parameters provide only minor shape change over the original design, they have significant impact on the structural behavior. The evolution of fitness function is shown in Figure 9. The optimized design tension of cables is shown in Table 3.
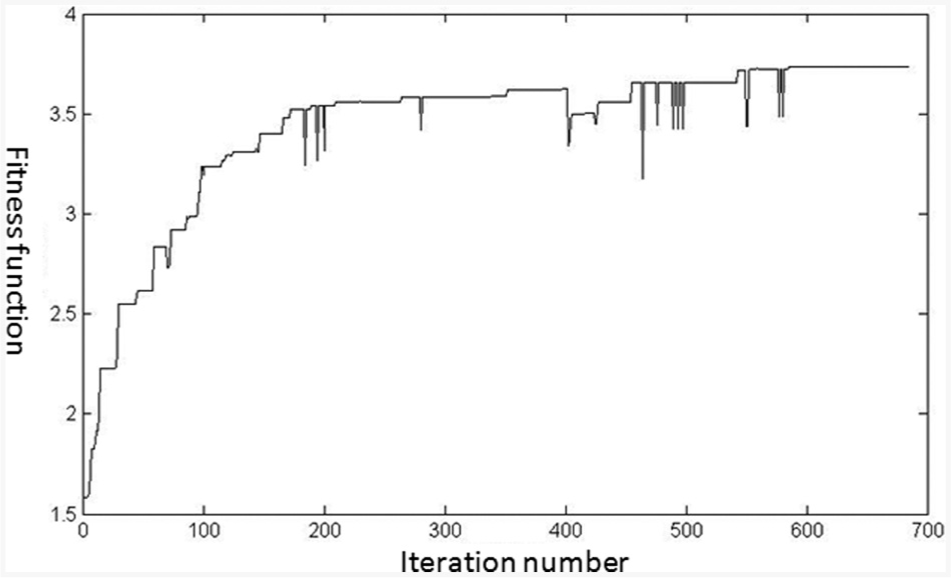
Evolution of fitting function.
Optimized design tension.
CPDP
The construction process of tensegrity structures is extremely critical to the final stress state and may be quite challenging to optimize since prestressing of new cables may lead to significant changes in already installed cables. For towers, this problem becomes more severe as gravity loads accumulate in vertical direction and any twisting or deformation will be enlarged. Unlike roof structures, tensegrity towers should be built stage by stage rather than prestressing as a whole. Our analyses show that after initial prestress, cables usually cannot achieve the design tension and some cables even get slack, so compensating prestress is required. Thus, the whole construction process can be divided into two parts: initial prestress and compensating prestress. In order to have all cable tension achieve our target tension, a compensating prestress design method is proposed, along with a computational program named CPDP.
Basic assumptions
During construction, cables are prestressed in groups. As defined above, each group includes three cables with the same design tension. However, the tension of cables in the same group may vary during construction because of inevitable twisting behavior of the structure. Considering the number of prestressing devices, feasibility, and precision, it is assumed that not more than four groups of cables are prestressed at the same time. Since construction errors are not considered here, each cable will undergo compensating prestress for only once, rather than time and time again.
Birth and death elements technique is adopted for construction process analysis in this section. Elements get “killed” when their stiffness multiply by a severe reduction factor, like 10−6. In the same manner, elements become “alive” when their stiffness return to their full original values. We first “kill” all elements and make them alive stage by stage; thus, construction process is simulated (Computers and Structures, Inc., 2015).
The parameters related to the prestressing are defined as follows:
In the kth iteration of CPDP,
Key Cable Theory
Sensitivity analysis is innovatively introduced in this methodology to figure out the cables that have the most influence on the system, herein termed Key Cables. These Key Cables are sensitive to the tension change of other cables or are more likely to influence other cables tension. These cables were identified by computing Spearman’s rank correlation coefficient for Monte Carlo simulation as described below.
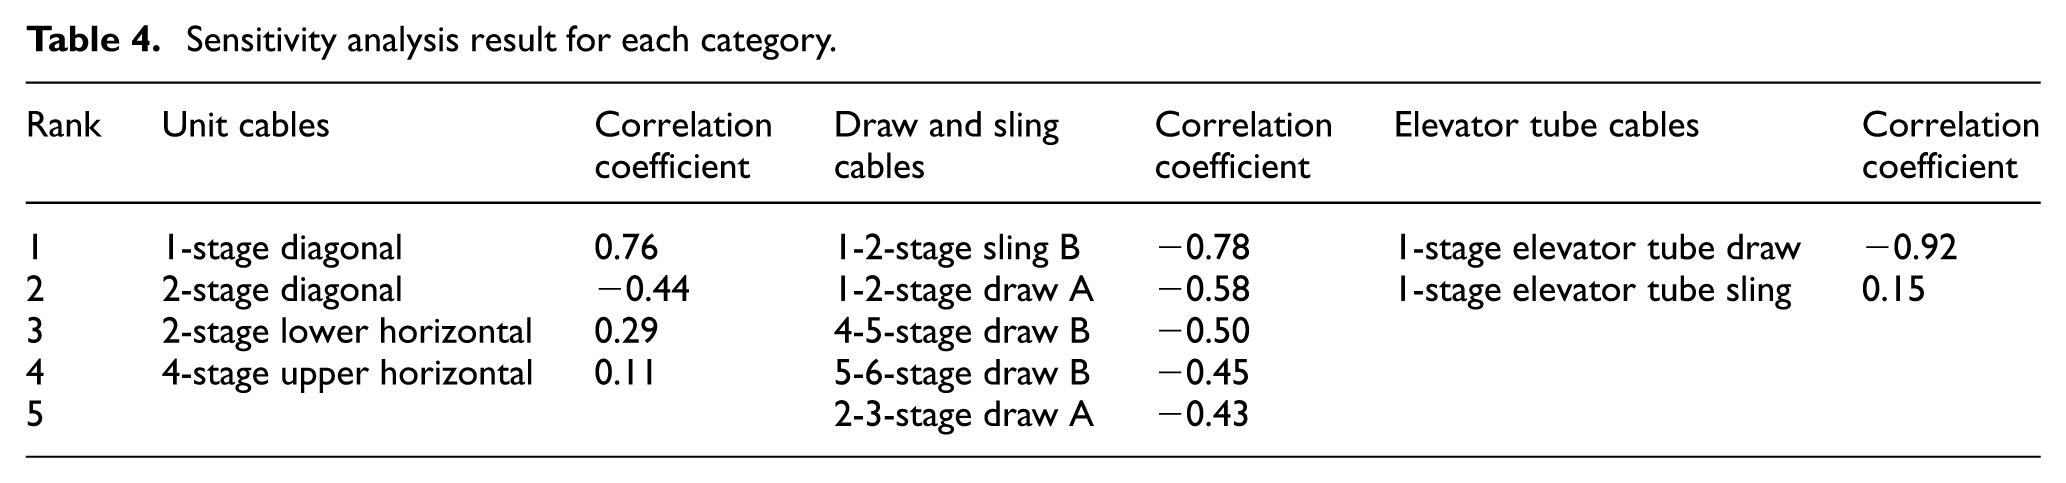
Since there are many cables in the model, we divide all cables into three categories to conduct sensitivity analysis separately, selecting the most influential cables in each category, and then put these cables together to conduct sensitivity analysis to find out the Key Cables for the whole structure. The three categories are as follows: unit cables (including all diagonal cables, upper and lower horizontal cables), draw and sling cables (including all draw and sling cables A/B), and elevator tube cables (including all elevator tube draw and sling cables). The variation from the target prestress magnitude (temperature load in the FE model) of each cable was assumed to follow a normal distribution with unit mean and a standard deviation of 0.04. 20,000 simulations was performed and Spearman’s rank correlation coefficient was calculated according to the displacement of the top point of the tower. The results are shown in Table 4 where cables with small correlation coefficient are omitted.
Sensitivity analysis result for each category.
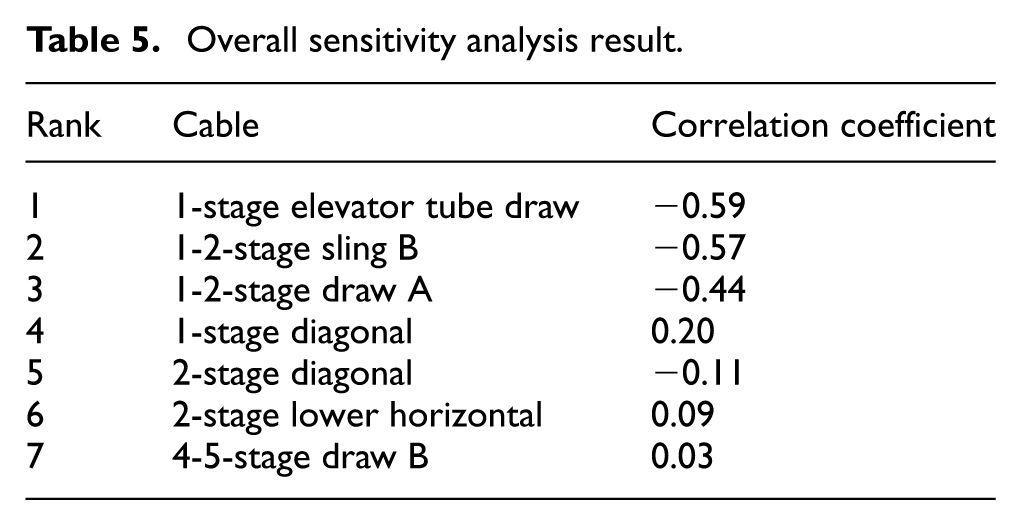
The 11 cables listed in Table 4 are selected to conduct the overall sensitivity analysis. The result are listed in Table 5, cables with small correlation coefficient are omitted. We can see that the tension change of 1-stage elevator tube draw cable, 1-2-stage sling cable B, and 1-2-stage draw cable A exhibits the most influence on the structure. Also the influence of 1-stage diagonal cable, 2-stage diagonal cable, and 2-stage lower horizontal cable is not negligible. These cables can be defined as Key Cables.
Overall sensitivity analysis result.
Computational procedure of CPDP
Temperature compensation is the fundamental numerical method in CPDP, which means applying a compensating temperature load according to the difference between design tension and actual tension. We introduce a parameter
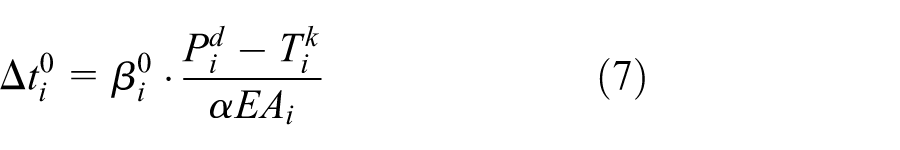
where
Simply speaking, the ultimate goal of CPDP is to find
Step 1. Build the FE model.
Step 2. Customize
Step 3. Run initial prestress load case using birth and death elements.
Step 4. Calculate
Step 5. Run compensating prestress load case, using
Step 6. Extract cable tension
Although
Step 7. Identify Key Cables; customize maximum tension error errmax and maximum iteration number kmax .
Step 8. For Key Cables,
Step 9. Extract cable tension
Step 10. For Key Cables, if
Step 11. If all
Step 12. Output
The flow chart of CPDP is shown in Figure 10.
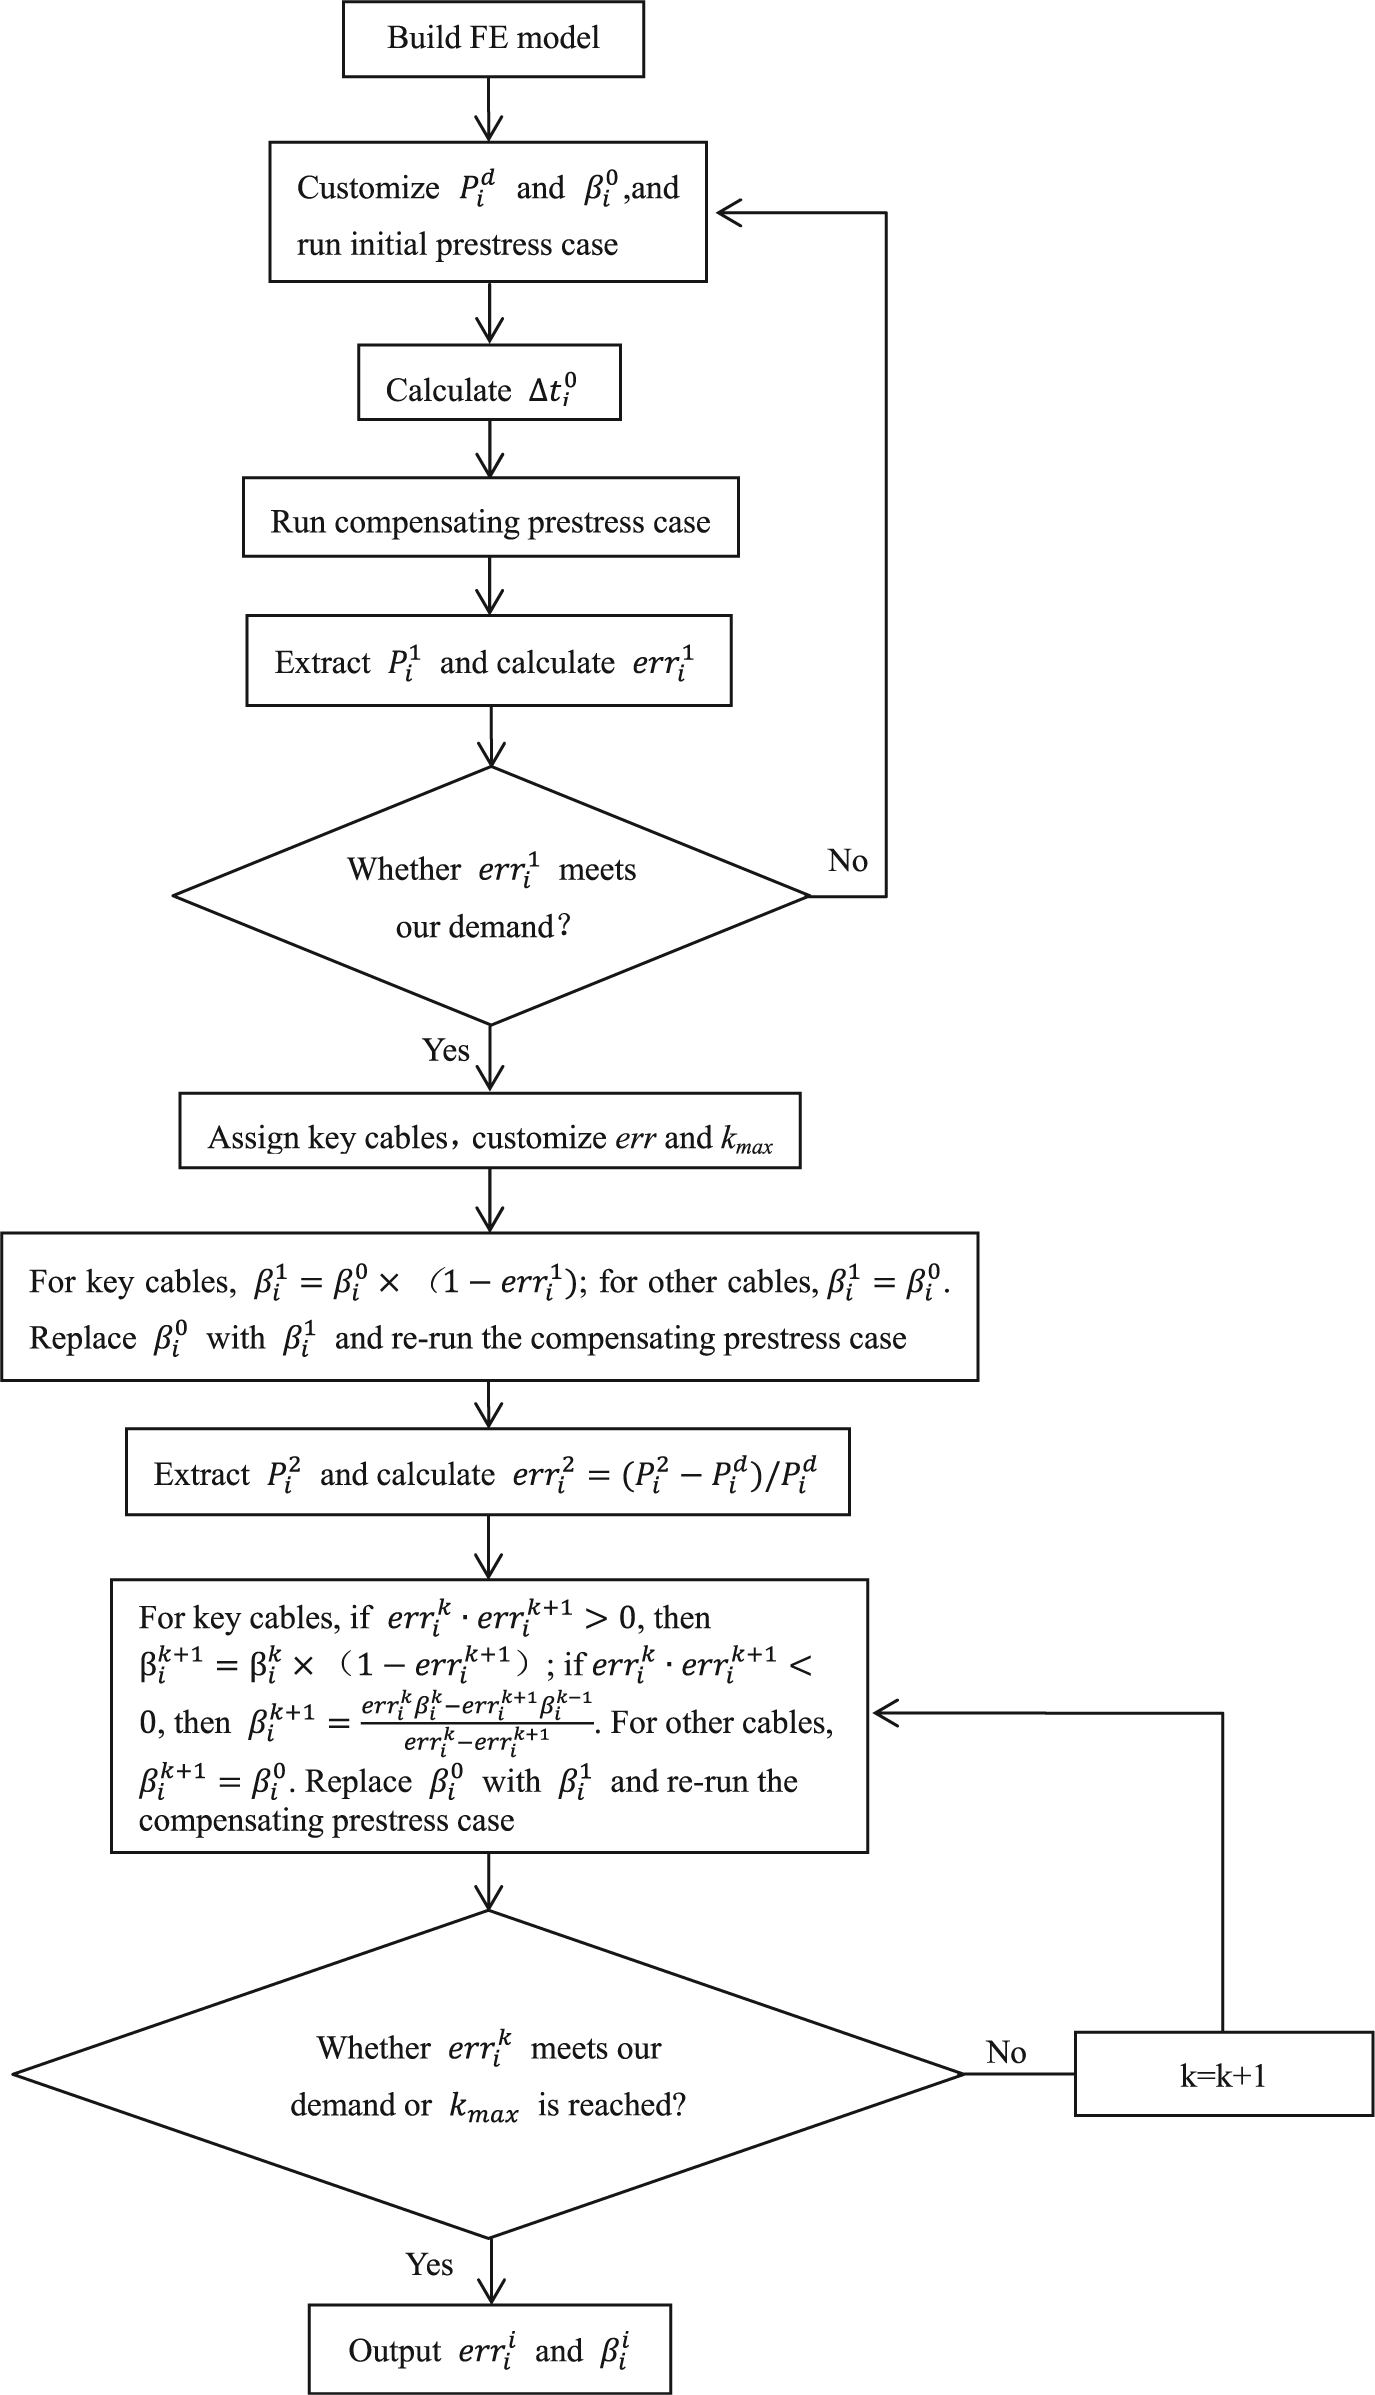
Flow chart of CPDP.
Illustrative example
Considering feasibility and constructability, an initial prestress process is proposed as follows:
Step 1. Prestress the 1-stage unit and fix the lower ends of struts to the ground with hinges.
Step 2. Hoist the 1-stage elevator tube to position and prestress the elevator tube draw and sling cables at the same time to connect the tube to the 1-stage unit.
Step 3. Prestress the 2-stage unit on the ground, then hoist it to position with some measures to prevent it from wavering. Three hoisting strings are used to hoist the unit, shown in Figure 11.
Step 4. Prestress 1-2-stage draw and sling cables at the same time to designated tension.
Step 5. Remove the hoisting strings of the 2-stage unit.
Step 6. Hoist the 2-stage elevator tube to position and prestress the elevator tube draw and sling cables at the same time to connect the tube to the 2-stage unit. Then, weld the 2-stage tube with 1-stage tube.
Step 7. Iterate steps 3–6 until all seven stages are finished, 26 steps in total.
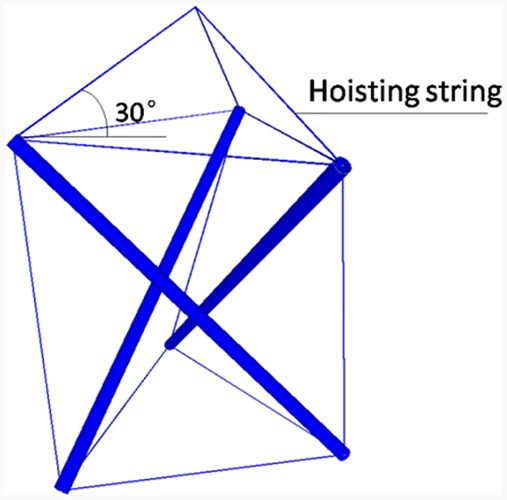
Hoisting of a unit.
In this example, we assign design tension
Summary of cable tension errors after initial prestress load case.
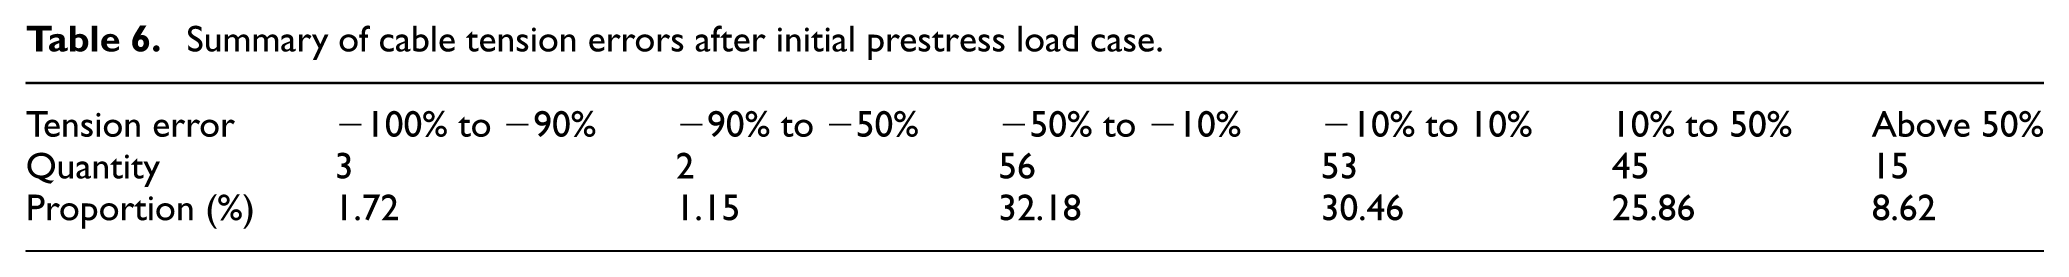
Detailed statistics show that all three 1-2-stage sling cable B are slack, with a tension error of −96.55%. If we require all tension error less than 10%, then only 53 cables (30.46%) meet our requirement. We also find that the cable tension of cables in the same group varies as a result of twisting behavior.
We then conduct the compensating prestress. Since the initial prestress is from bottom to top, the compensating prestress is from top to bottom; thus, it can start right after initial prestress is completed. The compensating procedure is as follows:
Step 1. Compensate 7-stage elevator tube draw and sling cables.
Step 2. Compensate 7-stage unit cables, including diagonal and horizontal cables.
Step 3. Compensate 6-7-stage draw and sling cables.
Step 4. Iterate steps 1–3 for lower modules until all 1-stage cables are compensated, 20 steps in total.
Next, we conduct steps 4–6 of CPDP to determine
Summary of tension errors after compensated by
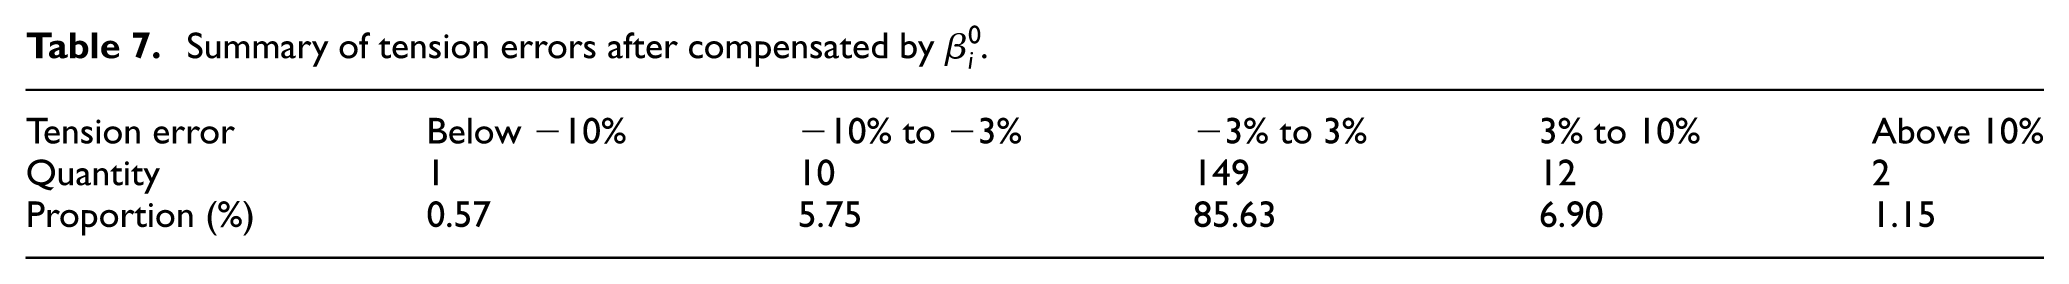
Detailed data show only three cables have tension errors that are larger than 10%, including a 1-2-stage sling cable A (−14.5%), a 1-stage upper horizontal cable (10.4%), and a 3-stage elevator tube draw cable (12.0%). We then progress to the second part of CPDP, starting with assigning Key Cables. It is a critical step for the processing of CPDP because proper assignment of Key Cables improves the precision dramatically. The assignment and reasons are shown as follows:
According to the sensitivity analysis mentioned above, 1-stage elevator tube draw cable, 1-2-stage sling cable B, and 1-2-stage draw cable A are assigned as Key Cables.
Since 1-2-stage sling cable A becomes slack after initial prestress, as tension is relatively small and is easily influenced by other cables but hardly influences others, we assign this group as Key Cables.
The tension error of 1-2-stage sling cable A and 3-stage elevator tube draw cable are larger than 10%; moreover, their tension is relatively large, which means they are difficult to be influenced by other cables, so we put these two groups as Key Cables.
If we only assigned cables mentioned above as Key Cables, after running CPDP we find that the 3-stage and 5-stage elevator tube draw cables deviate from design tension considerably, so we also assign these two groups as Key Cables.
We customize errmax = 5%, kmax = 5 and continue conducting steps 8–12. When k = 2, CPDP ends and the summary of final tension errors is shown in Table 8.
Summary of tension errors after CPDP ends.
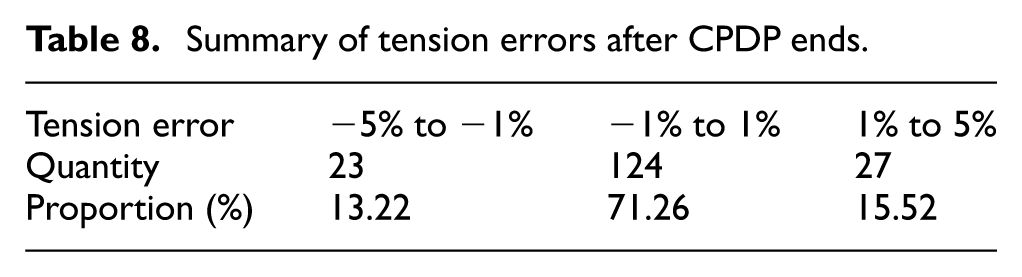
The maximum tension error is 4.4%, and most tension errors lie within the range of −1% to 1%, which is quite satisfactory. Then, we can extract the target tension and joint coordinates of each construction step to guide our actual construction process.
Conclusion
In this article, a 7-stage tensegrity tower structure was designed and its prestress distribution and shape were optimized. After optimization, all cables satisfied stress constraints and the lateral stiffness was improved dramatically compared with those designed manually by trial and error.
A methodology to design compensating prestress procedure was proposed and a computational program CPDP was coded. This program is based on temperature compensation method, seeking compensating temperature load at each construction step to simulate the prestressing magnitude. Taking the optimized structure as example, this methodology successfully helped us to find a feasible construction process and tension errors were controlled within a small range. Since the outcomes of CPDP heavily rely on the assignment of Key Cables, we should fully consider all factors to make the best assignments. It is worth mentioning that the methodology and CPDP may also be applied to other prestressed structures.
Footnotes
Declaration of Conflicting Interests
The author(s) declared no potential conflicts of interest with respect to the research, authorship, and/or publication of this article.
Funding
The author(s) received no financial support for the research, authorship, and/or publication of this article.