
Abstract
A new beam-to-column connection developed for precast concrete-resisting frames was proposed in this article. This connection provided adequate structural integrity in the connections and could be constructed easily and rapidly by eliminating the need for welding, bolting, and post-tensioning, and it also avoided reinforcement congestion or obstruction in connection regions. Five full-scale beam-to-column connections, including a monolithic specimen, were tested under reversal cyclic loading. One precast specimen was manufactured following all the proposed details. For comparison purpose, the other precast specimens were made without one or two structural details like additional bars and making a certain length of the two bottom deformed bars debonded near the end of U-shaped hollow in a precast beam. After analysis on the hysteretic behavior, strength, deformability, stiffness, and energy dissipation, it was showed that the proposed connection exhibited good seismic resistance, thus could be used in seismic regions. Furthermore, the existence of additional bars showed more necessity in such a system than the detail of making a certain length of the two bottom deformed bars debonded. Finally, a theoretical analysis curve was proposed.
Introduction
Since precast concrete structures have more advantages than conventional cast-in-place systems in terms of quality control, speed of construction, and cost efficiency, they have been widely adopted in many countries such as the United States (Khoo et al., 2006), New Zealand (Park, 2002), Japan (Shiohara and Watanabe, 2000), and China (Chen et al., 2012; Guo, 2014). Beam-to-column joints are the vital parts of precast concrete frames; they transverse horizontal shear, axial tension, and compression, sometimes bending moment and torsion between precast components (Choi et al., 2013). Thus, the seismic behavior of beam-to-column connections has a significant influence on the overall response of the moment-resisting frames. However, precast connections are considered to constitute the weakest link in the structures, and the precast concrete structures are not implemented extensively in high-seismic regions of most countries (Korkmaz and Tankut, 2005; Moon et al., 2007).
For the precast concrete structures, the construction flexibility is an important concern which affects large-scale applications. Problems like reinforcement congestion or obstruction can hinder practical installation of precast concrete components. Due to lack of suitable moment-resisting connection details, which have both excellent seismic behaviors and construction flexibility, the industries of precast concrete frames are still facing the challenges to promote large-scale applications. Thus, the development of moment-resisting connections for precast concrete frames remains one promising area that requires further investigation (Yee et al., 2011).
This article aims to propose a new precast beam-to-column connection providing adequate structural integrity, satisfactory seismic performance, and construction flexibility. In this article, the seismic behaviors of the proposed connection and a reference monolithic connection were investigated. In order to examine the effect of two important structural details, another three precast specimens were also tested under reversal cyclic loading.
Literature review
Park and Bull (1986) conducted tests on three full-scale composite beam-exterior column subassemblies incorporating precast prestressed concrete (PC) beam shells. The results showed that units designed for seismic loading would indeed be satisfactory for use in ductile seismic-resisting frames. Cheok and Lew (1991, 1993) experimentally investigated the performance of 14 one-third scale beam-to-column connections including 10 post-tensioned precast concrete specimens. The results indicated that the post-tensioned precast specimens had comparable connection strength and higher ultimate displacement ductilities, but lower energy dissipation. Restrepo et al. (1995) investigated two beam-to-column joints of cruciform shape. One of them was formed by a cast-in-place concrete column and two composite beams whose bottom bars were anchored inside the beam-to-column joint core. The results revealed that the connection detail can be successfully designed and constructed to emulate cast-in-place construction.
Alcocer et al. (2002) tested two full-scale beam-to-column connections under uni- and bi-directional cyclic loading, respectively. One of them achieved the beam bottom longitudinal reinforcement continuity by overlapping U-shaped prestressing strands, and the other did by hoops placed around the extensions of the 90° hooks at beam bottom longitudinal reinforcement ends. It was concluded that the structural performance of both beam-to-column connections was satisfactory. Ertas et al. (2006) performed experiments on four types of beam-to-column connections and concluded that all tested precast concrete connections, except bolted connection, were suitable for high-seismic zones in terms of strength properties and energy dissipation.
Xue and Yang (2010) researched the behavior of four full precast concrete connections at different places of a frame under simulated seismic loading. They concluded that all the precast concrete connections exhibited a strong-column weak-beam failure mechanism and plastic hinges at the fixed beam ends were formed. Cai et al. (2012) reported a pseudo-static test of beam-to-column connections in SCOPE systems. The prestressed strands were utilized as longitudinal bars of precast beams with U-shaped shells at both ends. The precast beams were connected to a precast column through two U-shaped conventional steel bars and cast-in-site concrete in the joint zone and the beam cores. The consequences showed that these structural systems can provide full hysteretic loops and good energy dissipation capacity.
Im et al. (2013) presented tests of six cruciform beam-to-column connections under cyclic loading. The precast concrete connections are composed of precast columns, beams of U-shaped shells, and cast-in-place concrete in the beam–column joint and the beam cores. They reported that the reinforced concrete (RC)-emulated precast beam–column exhibited good deformation capacities, but decreased stiffness and energy dissipation. Moreover, a strengthen method using headed bars was proposed. Maya et al. (2013) proposed and tested an alternative precast beam–column connection using ultra high-performance fiber RCs to take advantage of the short reinforcement splice lengths. Results showed that further research and detailing improvements are needed to consider seismic energy dissipation systems.
Parastesh et al. (2014) developed a new ductile moment-resisting connection in precast concrete frames and tested six precast specimens under cyclic loading. This connection consisted of a prefabricated concrete column and precast beams with a hollow U-shaped cross-section. The connection zone was filled with cast-in-place concrete and the bottom longitudinal reinforcement bars were spliced in the cast-in-place area of the beam. Results showed that the proposed precast connection could provide adequate strength, ductility, and energy dissipation capacity. Ha et al. (2014) proposed a new precast concrete beam–column joint for moderate seismic regions and conducted lateral cyclic loading tests of six semi-PC joint specimens. The structural system is composed of PC column, PC slabs, PC beams with U-shaped strands, and topping cast-in-situ concrete. The test results showed that the proposed structural system with transverse reinforcements at the joint was sufficient to use in moderate seismic regions.
Yuksel et al. (2015) experimentally researched two different precast types of exterior beam-to-column connections made of normal-strength concrete under cyclic displacement reversals. They are industrial type using both dry and wet type installment techniques and residential type that was wet connections. Results showed stable load–displacement cycles with high energy dissipation up to structural drift of 2%.
From the literatures, it is observed that the precast beam-to-column connections can be detailed nearly as strong as conventional monolithic connections following the principle of emulating monolithic RC construction, which is commonly adopted in precast concrete industry (Park, 1995). Most emulative precast connections are wet connections which are comprised of precast columns and conventional precast beams. To achieve continuity, the bottom longitudinal bars of precast beams either extrude and anchor into the joint cores or are just spliced by additional bars crossing the joint cores. However, for the precast connections with bottom longitudinal bars anchoring into the joint cores, not only placement of reinforcements but also manufacturing and erecting plan of precast components require high carefulness to avoid obstruction of reinforcements. Small errors would lead to uselessness of precast components and increase the scrap rate, which counteract merits of precast concrete structures. For the precast connections achieving reinforcement continuity by splicing additional bars, the seismic resistance is not quite as satisfactory as monolithic structures especially in high-seismic regions.
Hence, for this study, a new type of beam-to-column connection is developed with pretensioned beams for precast concrete frames in seismic active regions. Utilizing prestressing strands anchoring into the joint cores, reinforcement obstruction can be easily avoided for the flexibility of strands. Additional bars are also added into the joint zone to improve the overall seismic resistance. Compared to conventional precast concrete structures, the proposed connection eliminates the demand for welding, bolting, and post-tensioning and reduces the possibility of reinforcement congestion or obstruction in the joint zone. Therefore, it has great advantages in real application for lower cost, easier construction, and less requirement of skilled labors. Moreover, the developed detailing can provide better integrity between precast concrete beams and columns by enhancing the flexural strength, ductility, and energy dissipation capacity. More details are described in the next section.
Developed beam-to-column connection
Figure 1 depicts details of the proposed beam-to-column connection for precast concrete frames. In this developed system, columns are prefabricated with grout sleeves to connect each longitudinal bar of lower columns. The longitudinal bars can be laid in the same manner as conventional RC bars, which is familiar to skilled labors of construction industry. The length of precast columns can be the height of each floor or several storys with a free space in the joint core to connect beams.
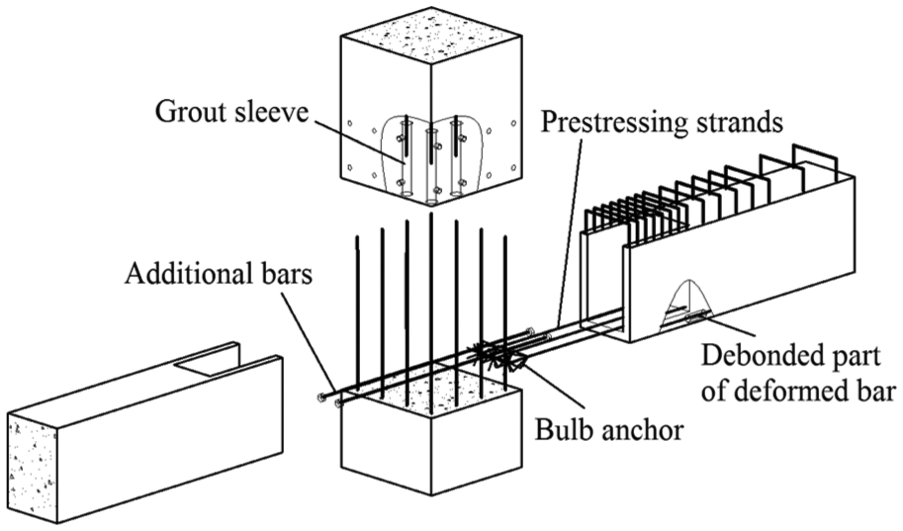
Detailing of reinforcement in the connection zone of the precast elements.
The precast beams in this system are pretensioned beams with a hollow U-shaped cross-section in the connection zone, and the U-shaped hollow is designed to be 400 mm long. In order to improve strength, confinement, and deformability of the beam ends, the spacing of the rectangular stirrups is reduced to 50 mm at the precast concrete beam shells. Adequate amount of pretensioned strands are placed at the bottom of precast beams, they act as longitudinal reinforcement and increase the capacity of beams to resist vertical loads. The long strands with bulb-shaped dead ends, called bulb anchors (Zhang et al., 2008), extend from the beam into the joint core or even the hollow of the opposite beam for anchorage. It is very cost-effective to make bulb anchors with a special bulb forming jack that unravels the ends of strands. The anchorage part of a strand is of no prestress. Two D16 deformed bars and two D10 plain bars are placed at the bottom and middle of the precast concrete beam shells, respectively; they are used to form reinforcement cages of beams with rectangular stirrups and help to provide tensile strength to resist installation loads. However, these bars are not considered in the calculation of moment-resisting capacity of beams because they are not connected to the joint. The two bottom deformed bars are made debonded with concrete for a certain length to reduce crack resistance at the end of U shape hollow, where precast and cast-in-place concrete interface and main plastic hinges are intended to form. That is aimed at making a contribution to forming plastic hinges away from the interface between the column and beams. The surface of the U section zone is manufactured coarsely to increase the bond capability between precast and cast-in-place concrete.
In the process of installation, precast concrete columns are erected first, and then the precast concrete beam shells are seated on the cover concrete of the columns. After that, two short ordinary additional bars with anchor plates at both ends are put into the bottom of the connection zone. Simultaneously, continuous top reinforcement bars are fixed through the joints and along the beams. Finally, cast-in-place concrete is poured to integrate the beams, the columns, and the joints (as shown in Figure 2).
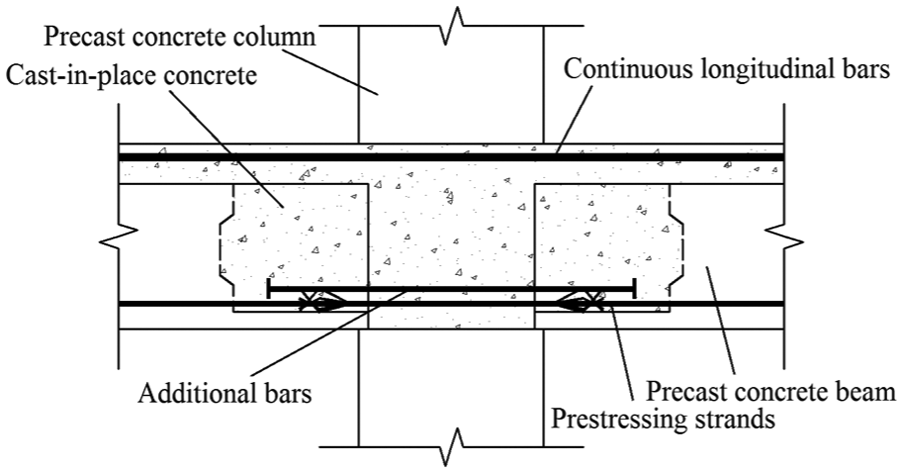
Detailing of precast connection.
The proposed precast connection can be assembled easily and rapidly, avoiding obstruction of reinforcement bars by substituting the flexible strands in the connection zone. There is no need for formwork or any job of connecting reinforcement bars like welding or using mechanical splices. It can lead to a fast construction, low-cost precast concrete frame with great promise to be applied extensively.
Experimental program
Reversal cyclic loading test was conducted to assess the seismic behavior of the proposed connections and examine the effect of two important structural details in the suggested system.
Details of specimens
All the specimens were designed according to a strong-column, weak-beam seismic design philosophy. Moreover, they are all designed to have enough shear resistance to prevent shear failure before flexural failure of the beam and the column.
Five beam-to-column connections were prepared to be tested under cyclic loading: a conventional monolithic specimen designated as ML and four precast concrete specimens designated as SP1–SP4. In each specimen, the column had a 550 × 550 mm cross-section and a height of 1900 mm for the restriction of experimental setup. The column longitudinal bars included 12 D25 deformed bars, representing about 1.9% of the gross area. The clear span of the beam was 2000 mm and the cross-section was 300 × 550 mm. The cover thickness of the monolithic and precast components was 25 mm.
Figure 3(a) shows the configurations, dimensions, and reinforcement bar details of the monolithic specimen (ML). The longitudinal reinforcement of the beams consisted of three D22 bars at the top and three D18 bars at the bottom, which went through the whole length of Specimen ML continuously. The spacing of the stirrups, which is composed of D10 two-legged rectangular hoops, was 200 mm basically. For the distance of 1000 mm from the column face, the stirrups were spaced at 100 mm interval to strengthen the beam ends. In terms of the column, the lateral ties were also spaced at 100 mm interval.
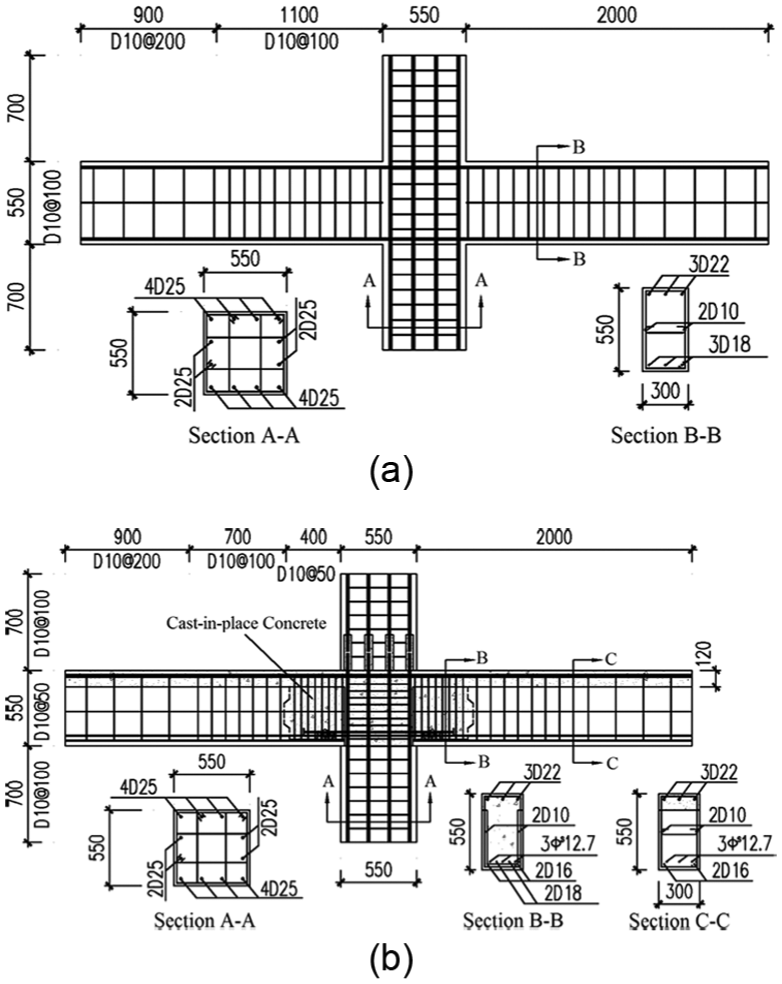
Configurations and reinforcement details of precast and monolithic specimens (dimensions are in millimeter): (a) monolithic specimen ML and (b) precast Specimens SP1 and SP2.
Figure 3(b) illustrates the details of Specimen SP1 which represents the proposed connection. In the reinforcement cages of the beams, the two bottom D16 longitudinal deformed bars were wrapped by adhesive tapes of a length of 100 mm at the distance of 400 mm away from the beam end. That was intended to reduce the bond capacity of the two deformed bars with concrete. Three D12.7 prestressing strands were placed at the bottom of the precast beam as longitudinal reinforcements. They were pretensioned to 60% of breaking force before the cast of concrete for prefabricated beams and relaxed when the concrete achieved 75% of its ultimate compressive strength. After the completion of pretensioning work, the ends of prestressing strands were formed into bulb anchors using a special bulb forming jack. After erection of the precast concrete column and beams, two D18 deformed bars with anchor plates at both ends were added into the joint region before pouring cast-in-place concrete.
Specimens SP2–SP4 were manufactured in a similar way with Specimen SP1 and worked as comparisons to examine the effect of two structural measures. In SP2, the debonded length of the two bottom longitudinal bars was removed. The additional bars in the joint regions were canceled in SP3. In SP4, neither the measure of setting debonded length of the bottom longitudinal bars nor the additional bars were adopted. The types and test parameters of the specimens are summarized in Table 1.
Types and test parameters of the test specimens.
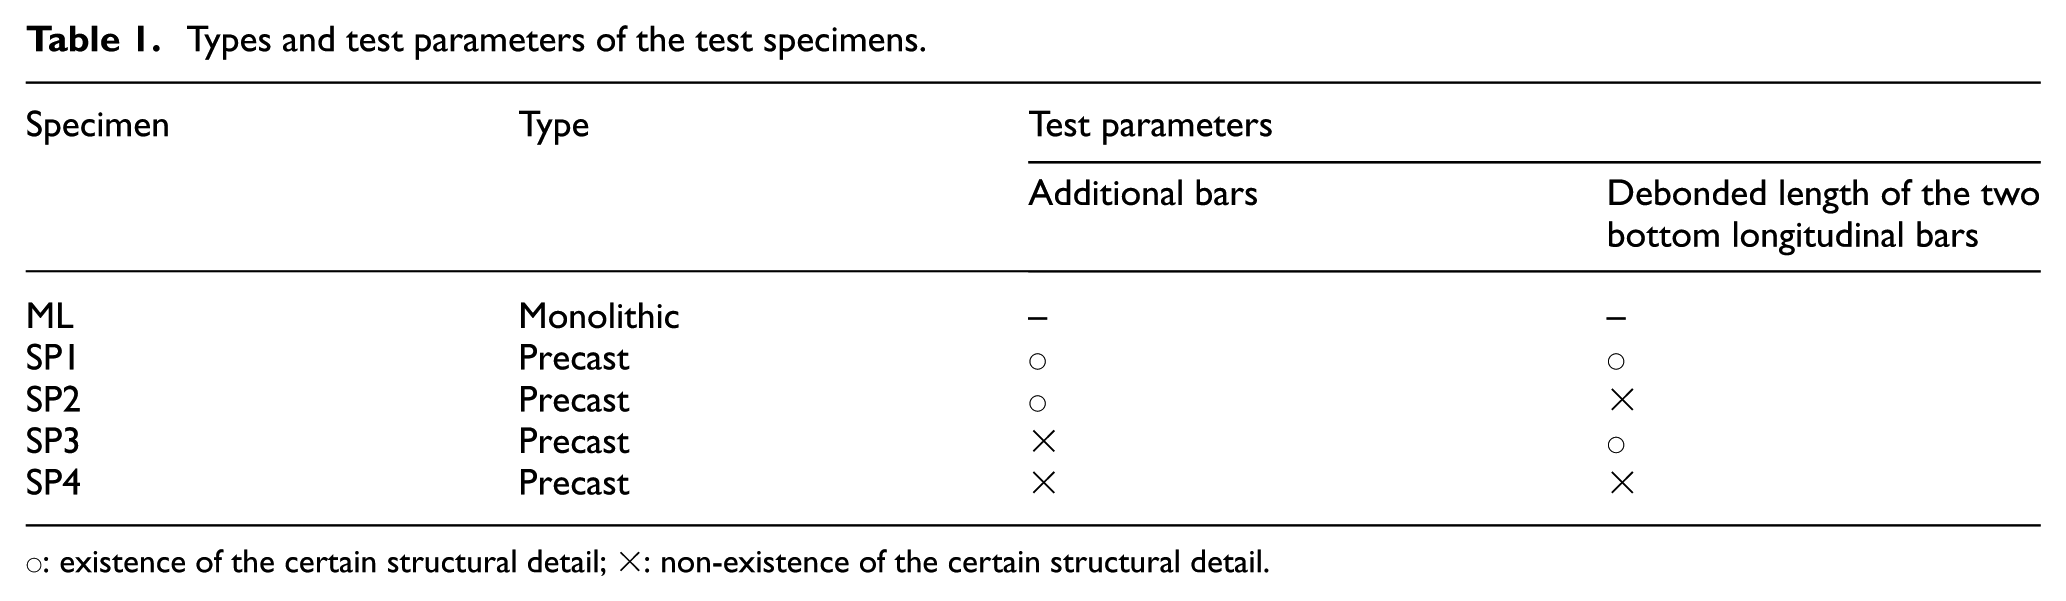
○: existence of the certain structural detail; ×: non-existence of the certain structural detail.
The compressive strength of all the concrete used in these specimens was designed to achieve a cubic compressive strength of about 40 MPa. Control concrete cubes were cast and cured in the same environment as specimens and then tested for 28-day compressive strength. The average cubic compressive strength (fcu) of the concrete for monolithic specimen ML and the precast concrete components was 51.7 MPa and that of cast-in-place concrete was 42.7 MPa. The cylinder compressive strength of concrete (fc) was evaluated on the basis of the relationship, that is, fc = 0.8 fcu. The yield and ultimate strengths of the reinforcing bars used in the specimens are summarized in Table 2.
Yield and ultimate strength of reinforcing bars.
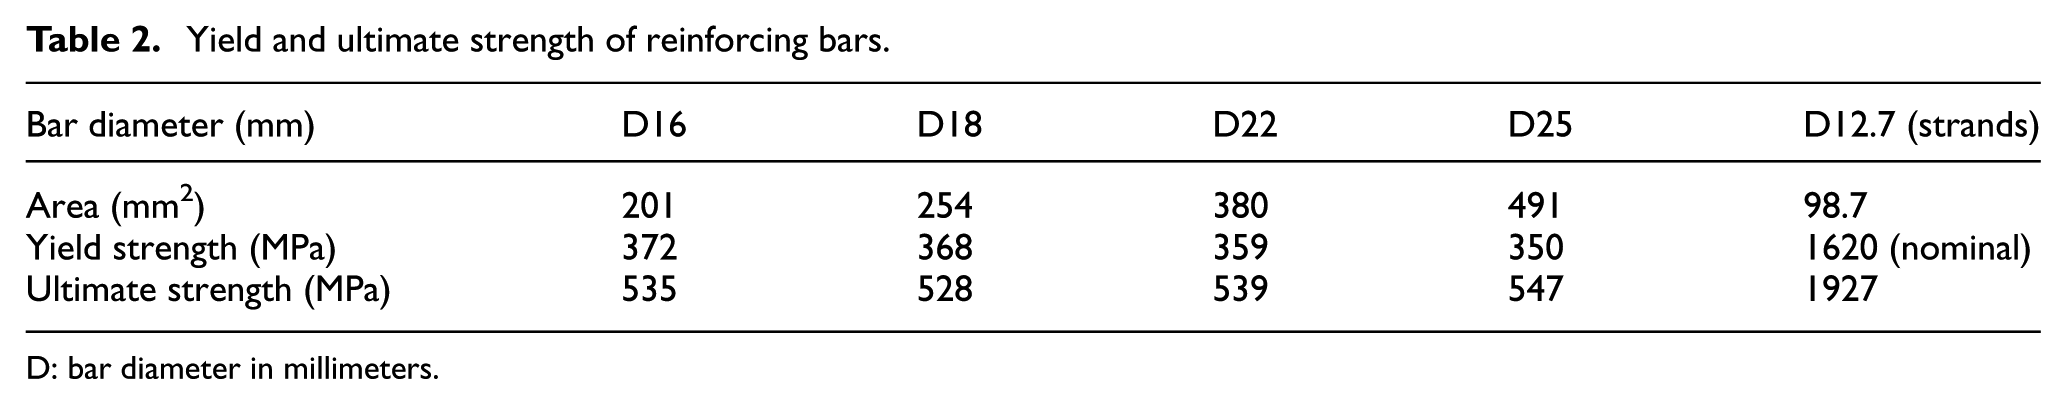
D: bar diameter in millimeters.
Experimental test setup
All the tests were conducted at the Key Laboratory of Concrete and Prestressed Concrete, Ministry of Education of China, in Southeast University. Figure 4 shows the schematic of the experimental test setup. All the specimens were supported in an upright position with the beams in the horizontal position. Both ends of the column were restricted laterally with rollers fixed to the rigid steel frame. One vertical 3200 kN hydraulic jack was placed at the top of the column to simulate the gravity load. Four 600 kN hydraulic jacks of 200 mm displacement range were installed at free beam ends to apply the reverse cyclic loading.
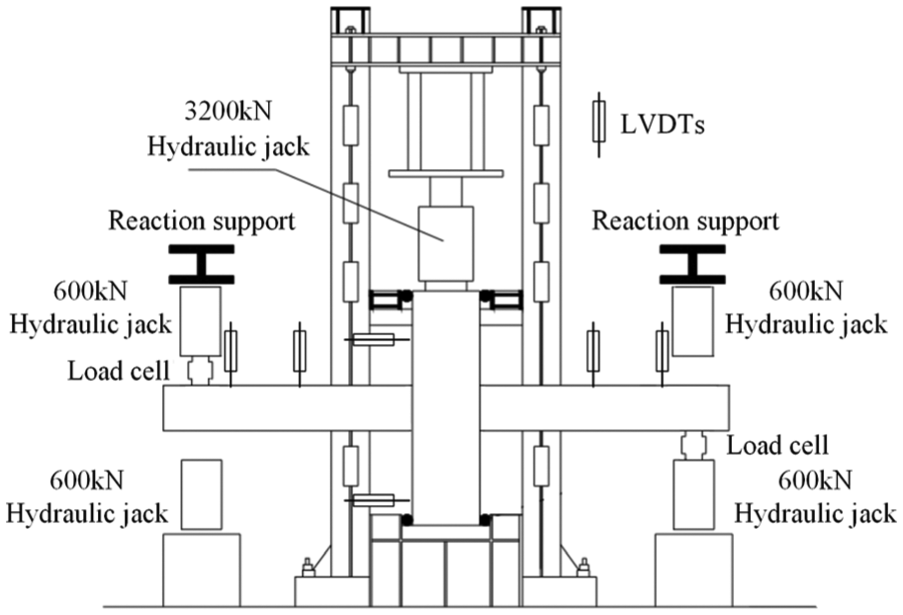
Schematic of experimental test setup.
Two load cells were adopted to monitor the loads applied on beam ends during the test process. Six linear variable differential transformers (LVDTs) were utilized to measure the vertical deflection of the beams and ensure that lateral displacements at the restrictive points of the column approach zero.
Loading sequence
To consider the dead load transferred from upper floors, each specimen was loaded axially on the top of the column to a level equal to 0.1fcAg (where Ag is sectional area of the column) at the beginning of each test (Cheok and Lew, 1993). The axial load was maintained throughout the cyclic test process by the vertical 3200 kN hydraulic jack. The loading history consisted of two phases: a load control phase and a displacement control phase (Figure 5). The load control phase involved the first four cycles. Load in the first cycle was applied up to a fine crack observed. Load in the second and third cycles was applied to 50% and 75% of the theoretical yielding level calculated using equivalent compressive block method, respectively. The fourth cyclic load was controlled to the level at which the slope of load–displacement curve decreased. The displacement corresponding to the fourth controlled load was defined as the yielding displacement. In the displacement control phase, the cycles were applied in terms of ductility factors, µ, which was the ratio of applied displacement to the yielding displacement. Three cycles were applied at each displacement level. In this study, the specimens were considered failed when the applied load reduced to less than 85% of the maximum load.
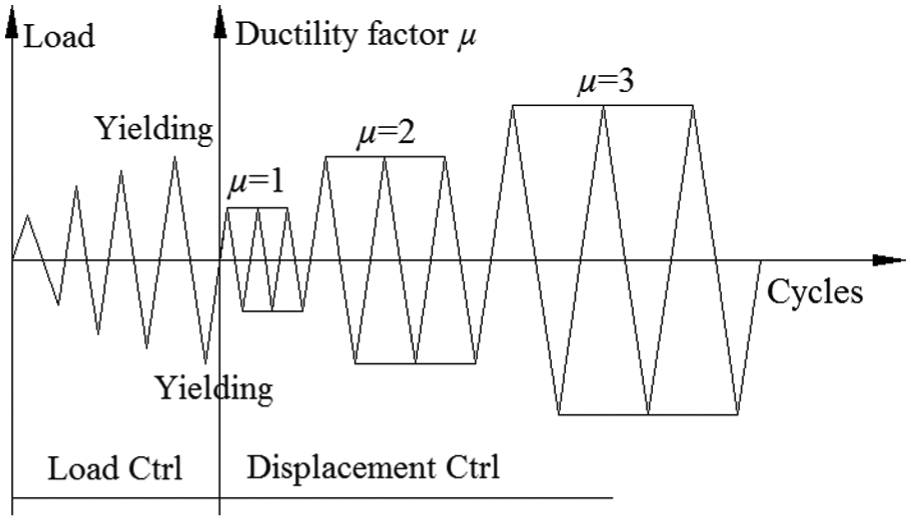
Cyclic loading history.
Discussion and analysis of results
Behavior and failure mode
Figure 6 shows the failure modes of the five specimens observed at the end of the reversal cyclic tests. In the monolithic specimen ML (Figure 6(a)), the first crack was observed in the beam at a distance of 50 mm from the face of the column when the load reached 35 kN in the positive direction (top fibers in compression). At the first cycle of µ = 2, compressive cracks appeared at bottom of the beam end near the joint, indicating that the concrete of this region began to crush. At the first cycle of µ = 3, fine diagonal shear cracks occurred at the beam-to-column joint. Finally, at the second cycle of µ = 5, one bottom reinforcement bar of the beam was tensioned to fracture, and then the test was stopped.
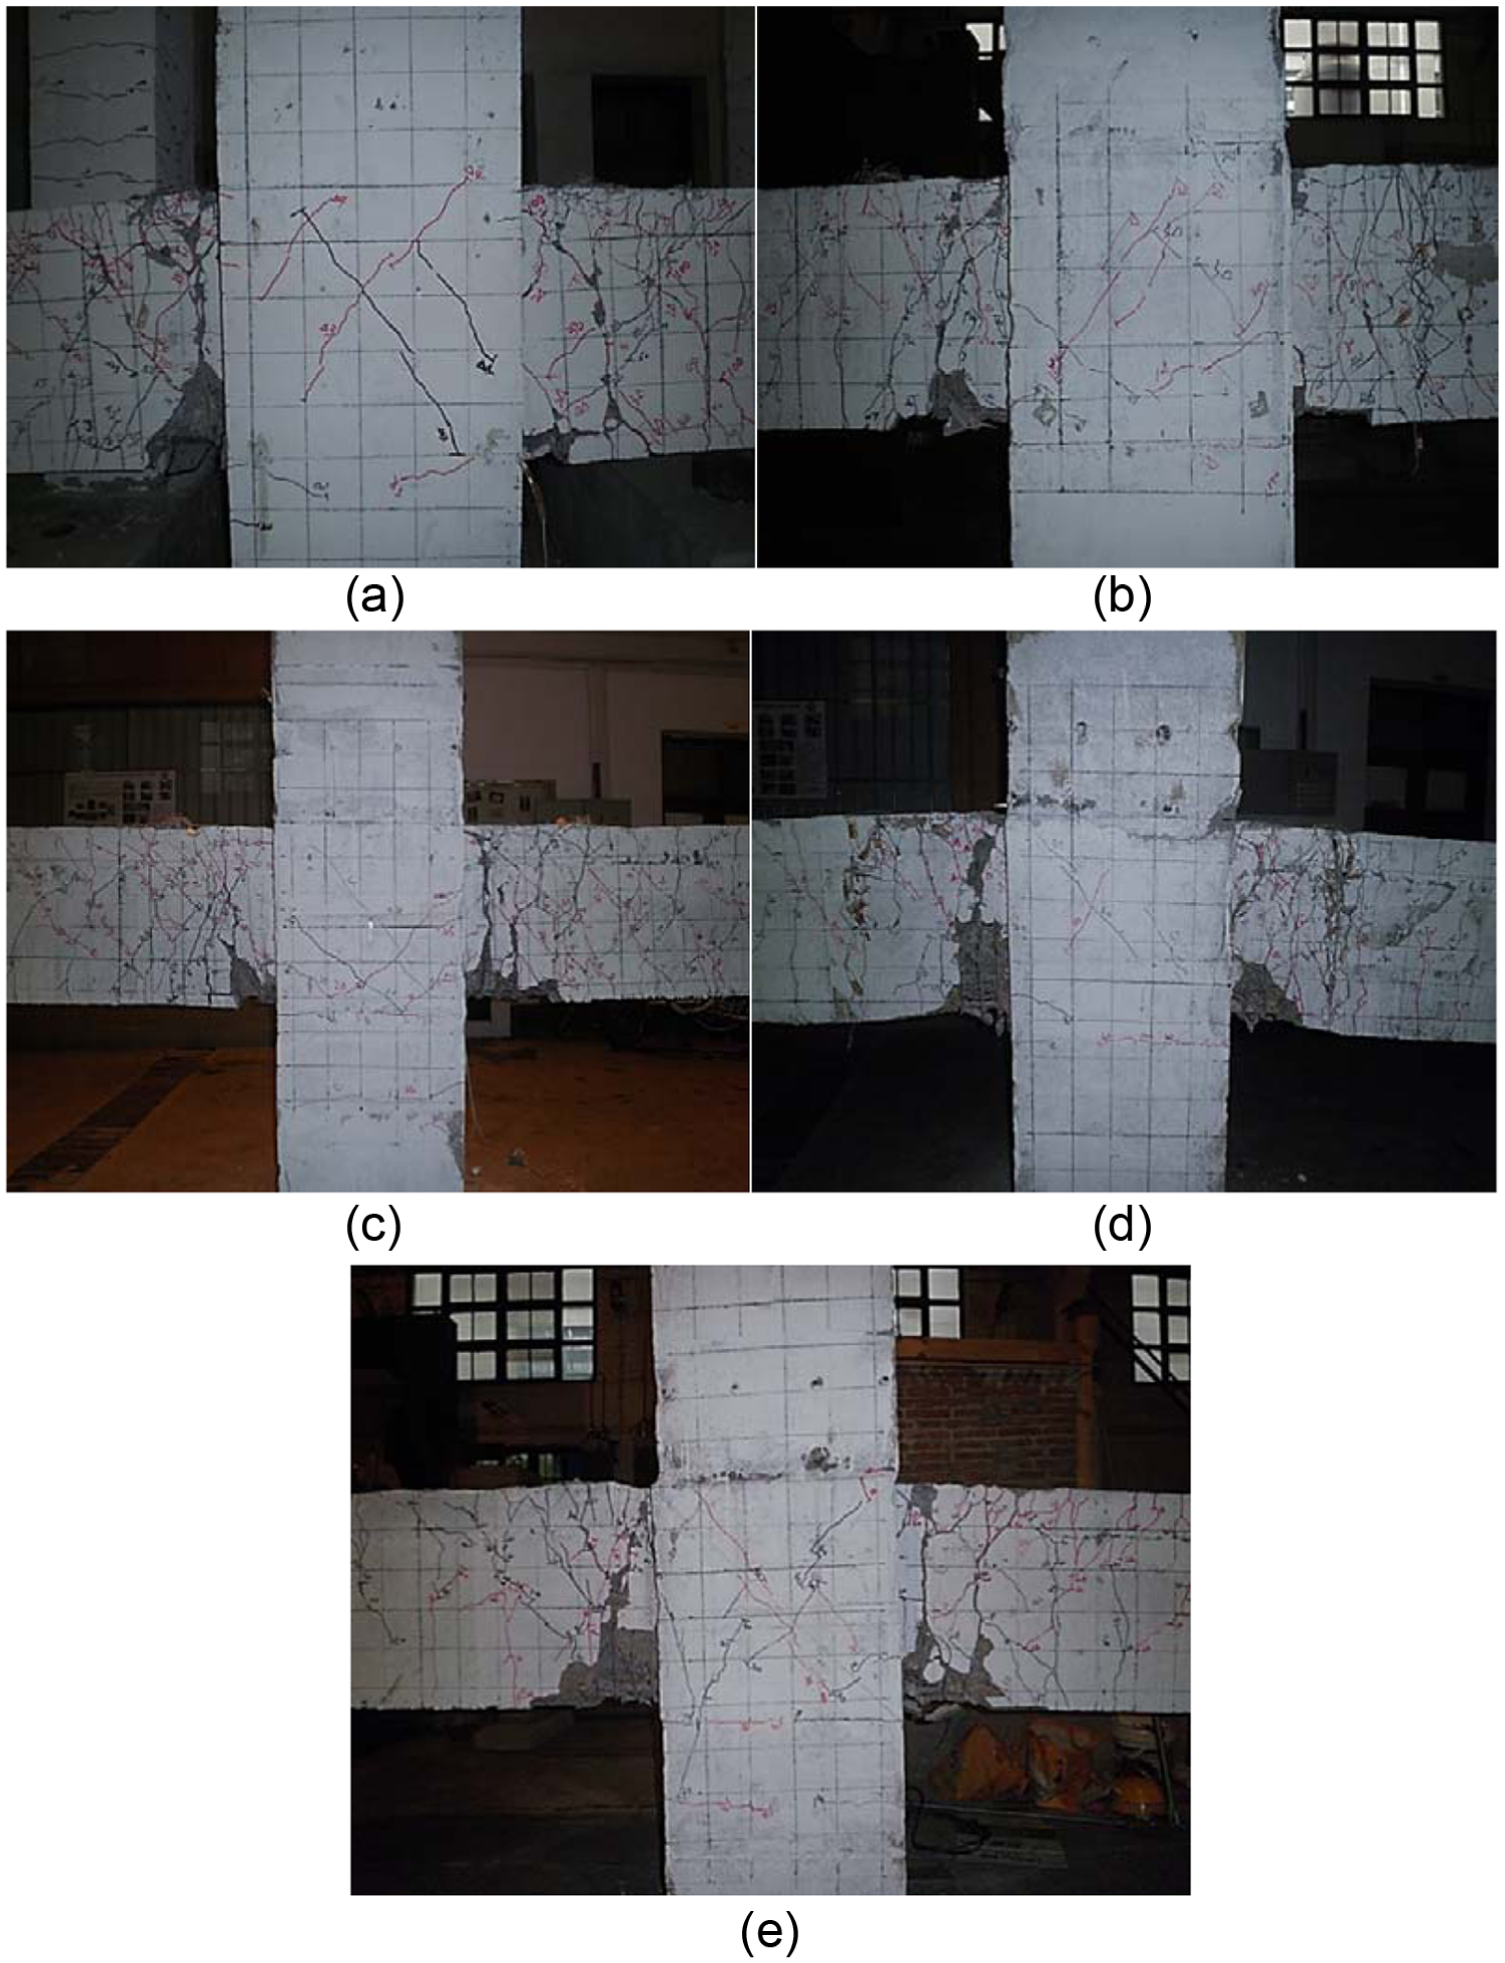
Failure modes of test specimens at end of test: (a) ML, (b) SP1, (c) SP2, (d) SP3, and (e) SP4.
In the precast concrete Specimen SP1, when the applied load reached 24 kN in the positive direction, the first flexural crack occurred in the beam at a distance of about 400 mm from the face of the column, where the cast-in-place and precast concrete interfaced in the U-shaped hollow. At the first cycle of µ = 2, the diagonal shear cracks appeared at the beam-to-column joint. During the second cycle of µ = 4, the bottom cover concrete of U-shaped shell near the face of the column was damaged and spalled, and then the strands could be observed. After that, it was seen that the strands became loosed when they were compressed (loading in negative direction), and became tensioned when the load was applied in the positive direction. Finally, the applied load dropped suddenly during the second cycle of µ = 5 and the test of Specimen SP1 was terminated.
In Specimen SP2, the experimental behavior was quite similar to Specimen SP1. At a load of 26 kN in the positive direction, the first flexural crack appeared like Specimen SP1. And the fine diagonal shear cracks occurred at the beam-to-column joint when the loading began to be controlled by displacement. At the third cycle of µ = 4, the applied load dropped as what had happened in Specimen SP1 in the final cycle. In order to check the structural behavior of the specimen after the sudden load drop, the cycle of µ = 5 was conducted. However, the maximum load at the first cycle of µ = 5 remained much smaller than that in previous cycles, so the cyclic test of SP2 was ended.
In Specimen SP3, the initial flexural crack occurred almost at the same place compared to SP1 at a load of 23 kN in the positive direction. Joint diagonal shear cracks were observed at the first cycle of µ = 3. At the end of µ = 4 cycles, the applied load declined significantly, and as a result, the test of SP3 was stopped.
The experimental phenomenon of Specimen SP4 was almost the same as SP3. The applied load reached 25 kN when the first flexural crack occurred as SP3. The test of SP4 was terminated when applied load decreased considerably at the first cycle of µ = 5.
Generally, failure modes of the five test specimens were similar. Damage was mainly concentrated at the beam ends near the joints with little diagonal shear cracks at the beam-to-column joints because of the strong-column, weak-beam principle. Concrete crushing occurred both at the top and the bottom of beam ends near columns, spalling of concrete at the bottom of beam ends was more severe due to the fact that reinforcements at the bottom of beams were less than the ones at the top.
Compared to the monolithic specimen, the bottom cover concrete of U-shaped shell in precast specimens spalled more severely. The reason might be the poor quality of concrete at U-shaped shell because the cast of concrete at U-shaped shell was more difficulty. The first visible crack of precast specimens, rather than monolithic specimens, appeared near the place where precast and cast-in-place concrete interfaced, which means the interface between precast and cast-in-place concrete was the weakest to resist flexural cracks. The first cracks of SP1 and SP3 occurred at a slightly lower load than those of SP2 and SP4 because a certain length of the two bottom deformed bars was debonded in SP1 and SP3. But the overall failure modes were not influenced by the first cracks of specimens. SP3 and SP4 seemed to fail more severely than SP1 and SP2 since additional bars were removed in SP3 and SP4.
Hysteretic behavior
Figure 7 illustrates the load–displacement relationships of the ML and four precast specimens (SP1–SP4). The displacements of loading point were used as the displacements at column ends approached zero. At the early stage of the tests, the five specimens showed a similar stable load versus displacement hysteretic response, and then pinching was exhibited in the hysteresis loops as the displacement cycles increased. The hysteresis curves were not symmetrical due to the difference between reinforcements at the top and at the bottom of the beams. The maximum load of the first cycle was higher than that of the two following cycles at the same displacement, representing strength degradation.
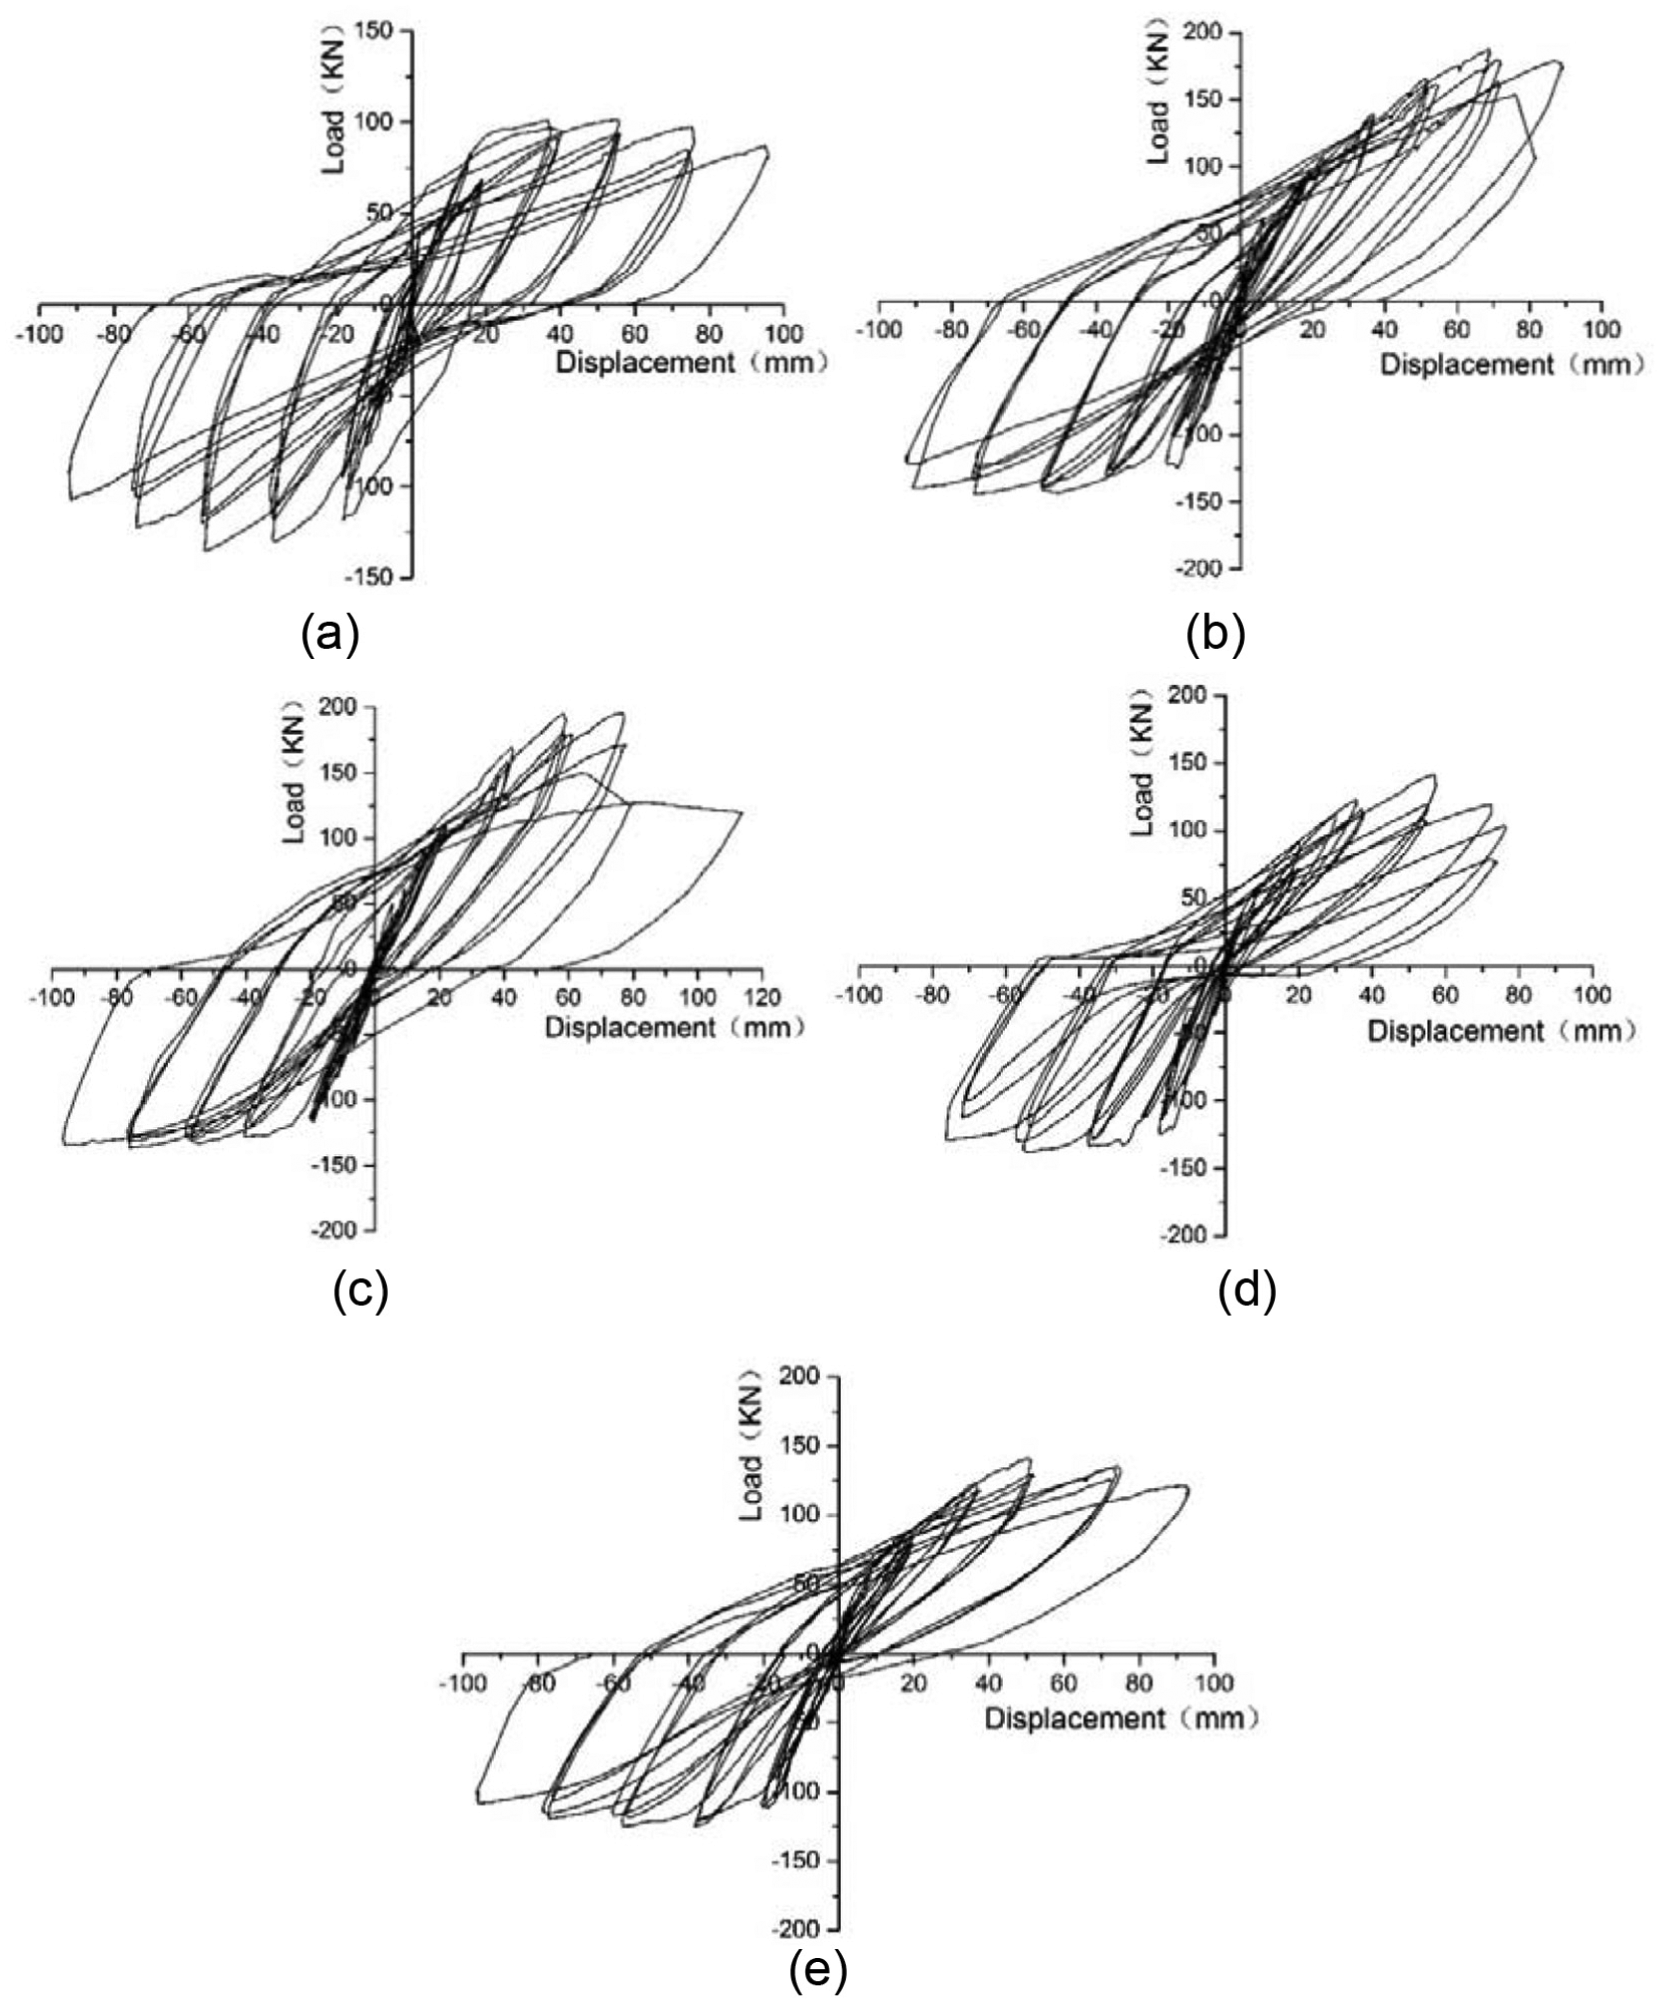
Hysteresis load–displacement relationships of the test specimens: (a) ML, (b) SP1, (c) SP2, (d) SP3, and (e) SP4.
In the monolithic specimen ML (Figure 7(a)), the maximum strength was achieved in the cycle of µ = 3, and the fat hysteresis loops indicated good energy dissipation capacity. However, the slight pinching was presented after cycles of µ = 4, which could be primarily attributed to the diagonal cracking in the joint region and spalling of concrete at plastic hinges in the beams.
As shown in Figure 7(b) to (e), the load–displacement relationships of SP1 and SP3 were similar to SP2 and SP4, respectively, but SP1 and SP2 achieved much higher peak strength than SP3 and SP4. The hysteretic behaviors of the precast concrete specimens in the negative direction (bottom fiber in compression) were similar to that of the monolithic specimen, but relatively thinner hysteresis loops of SP3 and SP4 could be noted.
Furthermore, the load–displacement envelopes are shown in Figure 8. It can be seen that there were no obvious yielding stages of precast concrete specimens in positive direction compared to monolithic ML. That was because yielding strength of strands was relatively high and strands had no obvious yielding stage compared to conventional deformed bars (Fu et al., 2006).
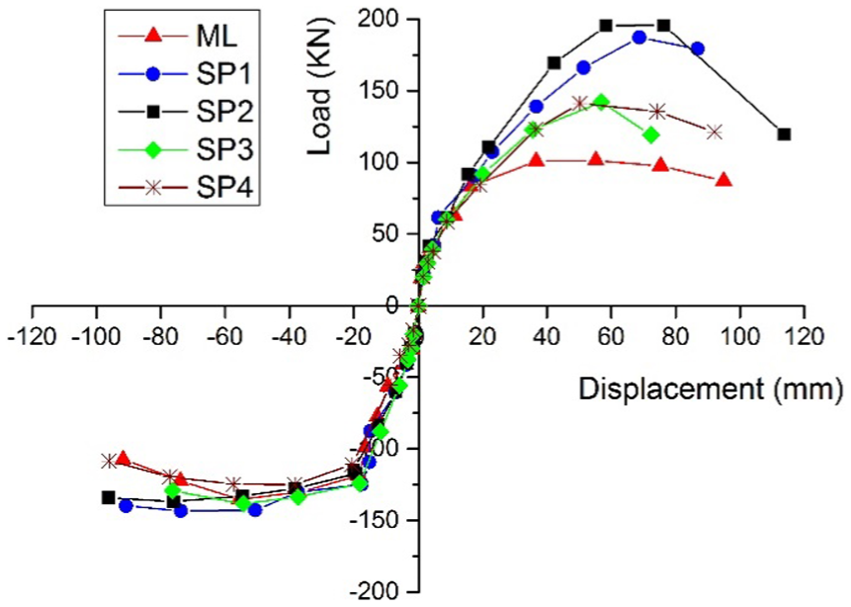
Load–displacement envelops of the test specimens.
Flexural strength
On the basis of the experimental setup shown in Figure 4, bending moments at the connections can be calculated as the applied force multiplies the lever arms. The maximum bending moments (Mmax) are listed in Table 3. The ultimate load-carrying capacity of the monolithic specimen ML in negative direction was found to be higher than that in positive direction for the larger reinforcement areas at the top of beams. However, for the precast concrete specimens, the ultimate load-carrying capacities in positive directions were found to be higher than those of negative directions, due to the high tensile strength of prestressing strands.
Maximum bending moment, ductility factor, drift capacity, American Society of Civil Engineers (ASCE) performance level, and initial stiffness.
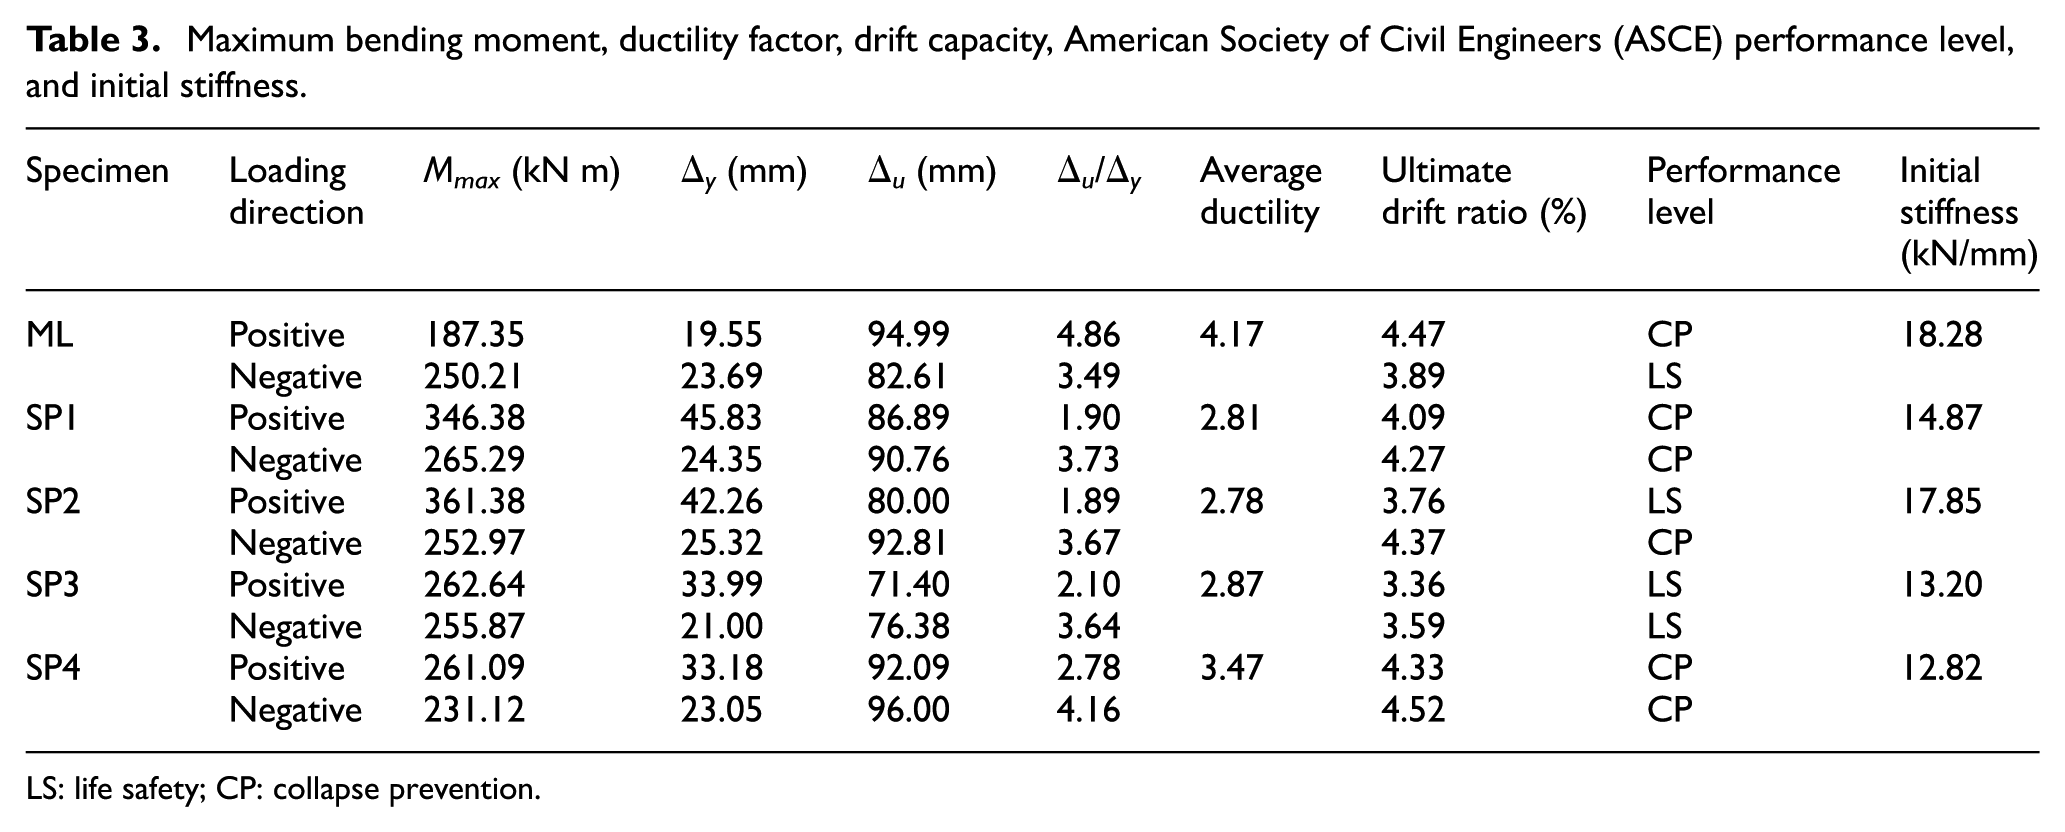
LS: life safety; CP: collapse prevention.
Compared to the monolithic specimen ML, the precast concrete specimens except SP4 exhibited similar or even slightly higher flexural strength in negative direction (top fiber in tension), because the longitudinal reinforcement bars at the top of precast beams were the same with Specimen ML and the confinement of U-shaped section zone in precast beams was enhanced by 50 mm spaced rectangular stirrups. The average ultimate load-carrying capacities of Specimens SP1 and SP2 were 35% higher than those of Specimens SP3 and SP4, demonstrating the effectiveness of additional bars in improving ultimate flexural strength.
Displacement ductility and deformability
The displacement ductility is defined as the capacity of a structure or an element to undergo inelastic deformation without significant loss of strength. It is a critical parameter in seismic behavior to avoid brittle failure. The displacement ductility is expressed as the ratio of ultimate displacement Δ u to initial yielding displacement Δ y . The ultimate displacement Δ u corresponds to 15% decreasing in peak load capacity. The yielding displacement is defined by utilizing the load versus displacement envelop curve according to the criteria for equivalent elastoplastic energy used by Park (Figure 9). The envelop curve is idealized as a bilinear curve with zero post-yield stiffness. The yielding displacement Δ y is determined by satisfying that the area enclosed by the idealized bilinear curve up to peak point is equal to that by the envelop curve. Table 3 shows the yielding and ultimate displacement of the tested specimens, and the displacement ductilities were calculated from them. The average displacement ductilities of Specimens ML, SP1, SP2, SP3, and SP4 were 4.17, 2.81, 2.78, 2.86, and 3.47, respectively, which indicated that the five tested connections behaved in a ductile manner. The displacement ductilities of the four precast concrete specimens in negative direction were slightly greater than that of the monolithic specimen ML. However, for the higher maximum strength of precast specimens in positive direction, the yielding displacement of precast specimens, obtained by the above-mentioned method, was larger than that of Specimen ML to meet equal energy principle. This led to lower displacement ductilities of precast specimens than the monolithic specimen ML in positive direction. The highest yielding displacement of SP1 in positive direction minimized its ductility, which was less than those of SP3 and SP4.

Equal energy principle.
Table 3 also summarizes the ultimate drift ratios which are computed by dividing the ultimate displacement to the distance from the loading point at the beam end to the center of the connection. It is shown that the monolithic connection had a slightly higher drift capacity in positive direction than precast connections; however, the ultimate drift ratios in negative direction of precast connections except SP3 were greater. Based on ASCE 41-06 (2007), RC concrete frames should resist inter-story drift ratios of 2% and 4% to reach life safety (LS) and collapse prevention (CP) performance levels, respectively. It can be seen that all the tested specimens could achieve the LS level in both directions. Moreover, the precast connection with the proposed details (SP1) could satisfy the CP performance level in both directions. Thus, it could be used in high-seismic zones. SP4 achieved the biggest drift ratio mainly because of the better cast of concrete.
Stiffness degradation
The rate of stiffness degradation essentially reflects the cumulative damage of a structure element under seismic load and becomes an important factor to evaluate its overall response. The stiffness degradation is usually assessed by the secant stiffness variation called peak-to-peak stiffness. The peak-to-peak stiffness is defined as the slope of the straight line connecting the maximum load and corresponding displacement points for the positive and negative directions during a loading cycle (Sucuoglu, 1995). The secant stiffness in each cycle was computerized and plotted in Figure 10. As a result of increasing cumulative damage in tested specimens, stiffness decreased continuously when displacement levels increased. The stiffness of all the specimens deteriorated fast before 10 mm displacement level due to concrete cracking. As listed in Table 3, the initial stiffness of precast specimens was lower than that of the monolithic specimen ML because of the predefined gap opening at precast connections. However, precast connections had a higher stiffness at post-yielding stage than monolithic connection due to the contribution of non-yielding strands. Moreover, due to the additional bars, the stiffness of Specimens SP1 and SP2 was slightly greater than that of Specimens SP3 and SP4.

Stiffness degradation of specimens.
In order to compare the stiffness degradation of different specimens, each secant stiffness value was normalized (knorm) by dividing the initial secant stiffness of each specimen to become a non-dimensional parameter. Figure 11 shows the normalized stiffness degradation of the five tested specimens. The stiffness of monolithic specimen ML dropped more severely than that of the four precast concrete specimens for the yielding of conventional bars. Because of the yielding of additional bars, Specimens SP1 and SP2 had faster decreasing stiffness than Specimens SP3 and SP4.

Normalized stiffness degradation of specimens.
Energy dissipation
The energy dissipation capacity of a connection helps to absorb energy input by earthquake excitations and thereby reduce the amount of energy transmitted to other structural elements. It is also an important index indicating how effectively a connection performs under seismic loading. In order to assess the energy dissipation capacity of the specimens, the cumulative dissipated energy and equivalent viscous damping ratio were computed on the basis of hysteretic loops. The energy dissipated during a cycle is represented by the area enclosed by the hysteretic loop in that cycle. The cumulative energy dissipated at a particular cycle is calculated by summing up the energy dissipated per loop to that cycle. The equivalent viscous damping ratio (ζeq) is defined as the ratio of energy dissipated in half cycle to the strain energy of an equivalent linear system divided by the constant 2Π (Chopra, 1995). Figures 12 and 13 show the curves of the cumulative dissipated energy and equivalent viscous damping ratio of the tested specimens versus the number of cycles. It is observed that the monolithic specimen ML dissipated greater energy than the precast specimens in the early and middle stages of the test, but the overall dissipated energy of Specimens SP1 and SP2 exceeded Specimen ML. Specimens SP3 and SP4 exhibited poor energy dissipation compared to other specimens, which could be attributed to the lack of the additional bars. The similar conclusion was made for the equivalent viscous damping ratio. In the early and middle stages, the monolithic specimen ML showed better energy dissipation ability. However, because pinching of hysteresis loops occurred in later stage, the equivalent damping ratio of Specimen ML was lower than Specimens SP1 and SP2. The equivalent viscous ratio of Specimens SP1 and SP2 increased dramatically before they were damaged totally, demonstrating the considerable potential energy dissipation ability. Specimens SP3 and SP4 had similar damping ratios with Specimens SP1 and SP2 during the early and middle stages but lower ones in later stage.
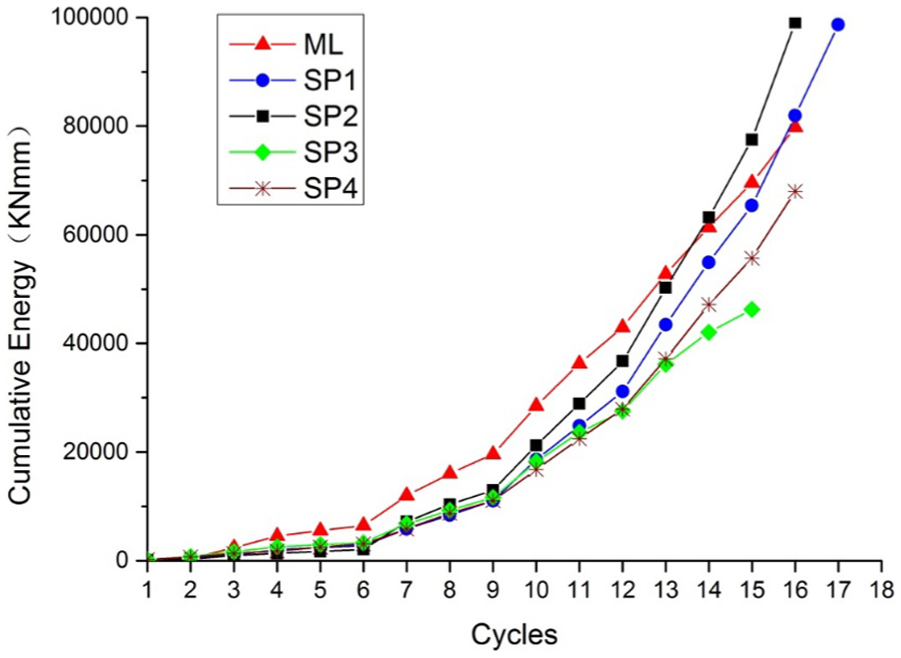
Cumulative energy dissipation curves of specimens.

Equivalent viscous damping ratio curves of specimens.
Discussion on effects of test parameters
In Specimens SP1 and SP2, the additional bars significantly improved the flexural load capacity in the positive direction. Compared to Specimens SP3 and SP4, the ultimate load-carrying capacities of Specimens SP1 and SP2 in the positive direction increased more than 30%. However, the load capacity of precast specimens in the negative direction seemed approximate, which meant that additional bars had little impact on the load capacity in the negative direction. It could be attributed to the fact that reinforcements at the bottom of beams were less than the top, making the concrete in compression the key factor to determine the load capacity in the negative direction. Additional bars also increased the initial stiffness of SP1 and SP2 as listed in Table 3. The initial stiffness of SP3 and SP4 without additional bars dropped considerably compared to monolithic specimen. The initial stiffness of SP2 approached the one of monolithic specimen, which meant adding additional bars could make the initial stiffness of precast specimens comparable to the one of monolithic specimens. In the post-yielding stage, the stiffness of SP1 and SP2 was also greater than that of SP3 and SP4 due to additional bars. In terms of energy dissipation, the additional bars played much important roles, they helped Specimens SP1 and SP2 dissipate 73% more energy than SP3 and SP4 on average. The equivalent viscous damping ratios of precast specimens were approximate in the early and middle stages of the test. But in later stage, damping ratios of Specimens SP1 and SP2 increased much before specimens were damaged totally.
The yielding displacement of SP1 and SP2 obtained from equal energy principle was larger than those of SP3 and SP4 since additional bars improved the load capacity of SP1 and SP2. For that reason, displacement ductilities of SP1 and SP2 were lower than those of SP3 and SP4. As shown in Table 3, the deformation capacity seemed to have little relationship with additional bars.
In Specimens SP1 and SP3, the detail of a certain debonded length of the two bottom bars reduced the first flexural crack loads slightly compared to SP2 and SP4. As illustrated in Figure 13, SP2 and SP4 had a little higher equivalent viscous damping ratios than SP1 and SP3, respectively, in later stage of the test. It seemed that the detail of making a certain length of the two bottom bars debonded from concrete had minimally negative influence on the energy dissipation ability just before precast specimens failed totally. The position of the debonding detail was about 400 mm away from the interface between the column and beam, and the beam end near the column still acted as critical position affecting the connection behavior. Therefore, the detail of a certain debonded length of the two bottom bars had marginal influence on the overall behavior of the connections.
Proposed analytical curve
Idealized load–displacement curve is very important for numerical simulation of a component and a structure. Due to the uniqueness of the proposed connection, the idealized load–displacement curve needs to be provided. Considering the characteristics of load–displacement envelops of the proposed connection, the use of tri-linear curve was suggested (shown in Figure 14). In this way, the connection behavior could be described by several parameters: the yielding load Py, the maximum load Pm (Pyp and Pmp for positive direction, Pyn and Pmn for negative direction), and corresponding displacements (Δ yp and Δ mp for positive direction, Δ yn and Δ mn for negative direction).
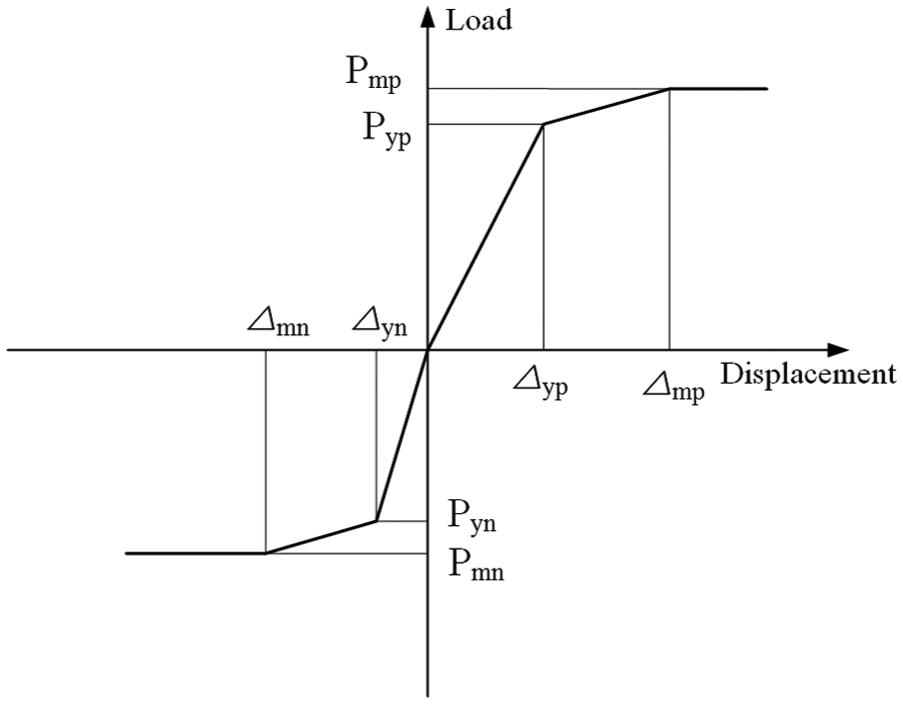
Idealized load–displacement curve.
For the concentration of main damage at beam ends, the yielding load and maximum load could be obtained by sectional analysis of beam ends. Conventional mechanical equilibrium method was utilized according to GB 50010-2010 (2010) with yielding and ultimate strength of reinforcement bars. As illustrated in Figure 15(b), the plane cross-section assumption is adopted and the yielding load capacity (Py) can be calculated by equation (1)
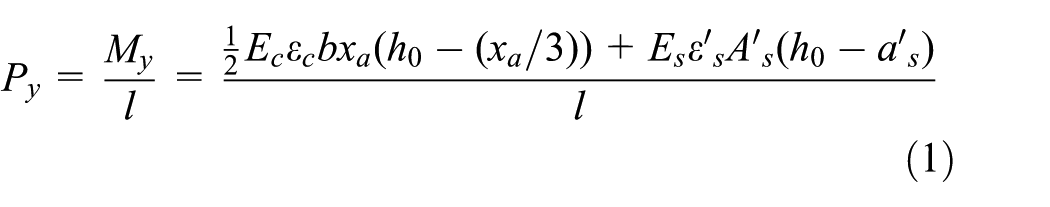
where

Calculation schematic of a beam section: (a) schematic of a beam cross-section, (b) strain profile, and (c) force equilibrium of rectangular stress block method.
Strain profile of plane cross-section is utilized to gain strain of concrete and reinforcement bars in compression based on the yielding strain of reinforcement bars in tension (

where
As shown in Figure 15(c), the maximum load capacity (
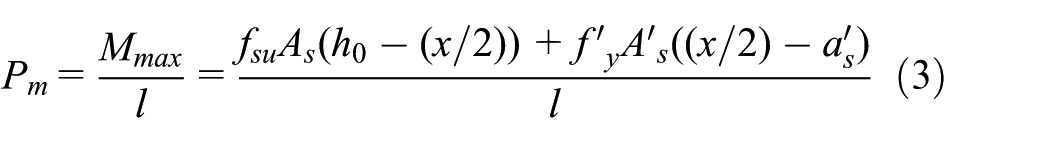
where

where
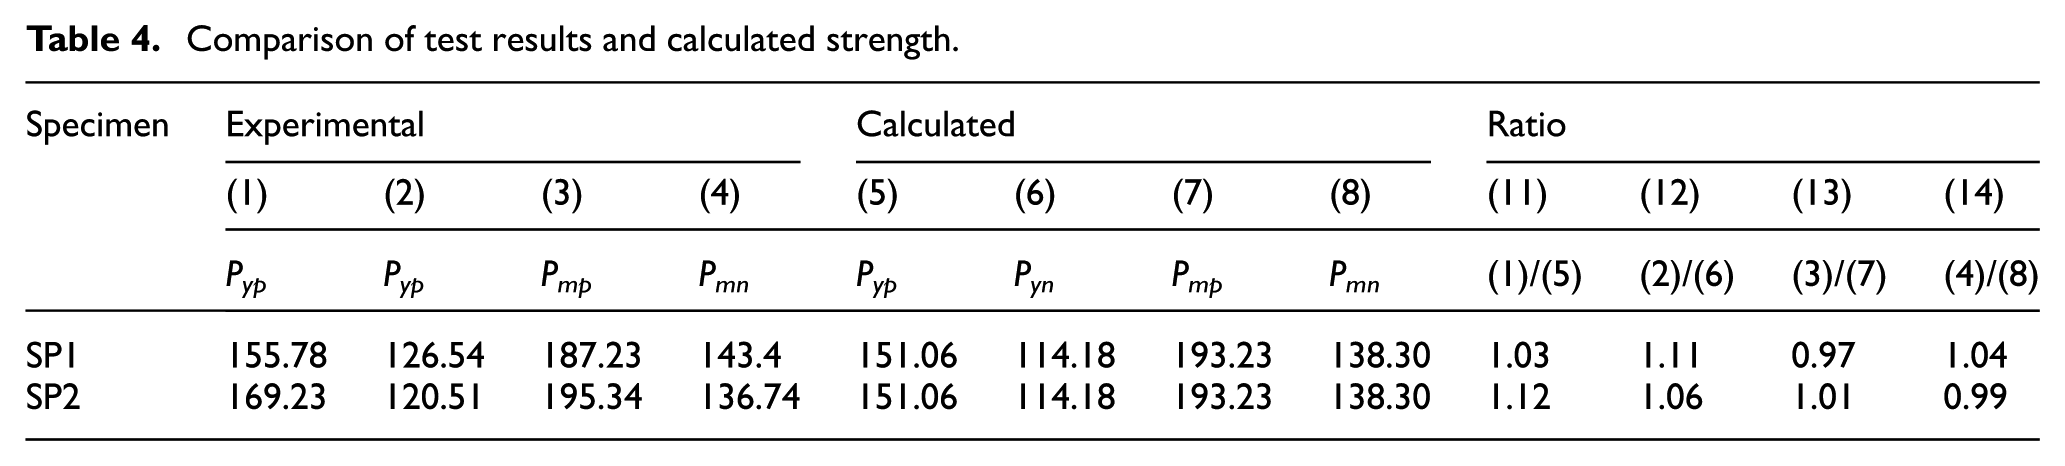
U-shaped shell and strands are not considered when Pmn is calculated based on the fact that the U-shaped shell are almost damaged totally and strands become loosed when the maximum load in the negative direction is reached. As to the maximum load in positive direction (Pmp), the reinforcement couple is assumed to provide the moment capacity since the depth to the neutral axis obtained from equation (4) is impractically small. Table 4 gives the experimental results and calculated strength. The calculated strength was closed to the experimental results. Except Pmp of SP1 and Pmn of SP2, the test result was 1%–11% greater than calculated strength ensuring safety to some extent.
Comparison of test results and calculated strength.
The total beam end relative rotation arises from three deformations: beam–column interface rotation due to the joint opening, beam end rotational deformation within the connection zone, and column rotational deformation within the connection zone (Elliott et al., 2003). Thus, the total displacement (Δ t ) of loading point can be attributed to three aspects. Referring to Figure 16, these are as follows: displacement due to joint opening (Δ o ), beam flexural displacement (Δ b ), and displacement due to column rotational deformation within the connection zone (Δ c ). Δ o and Δ c can be estimated on the basis of equations used by Elliott et al. (2003), expressed as equations (5) and (6)

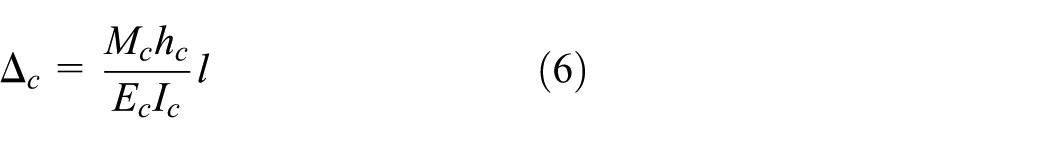
where

Components of loading point displacements: (a) displacement due to joint opening, (b) beam flexural displacement, and (c) displacement due to column rotational deformation within the connection zone.
The ultimate displacement of a flexural member can be calculated by the classical expression (Paulay and Priestley, 1992) as equation (7)

where
In this situation, equation (7) is utilized to estimate the yielding displacement by assuming
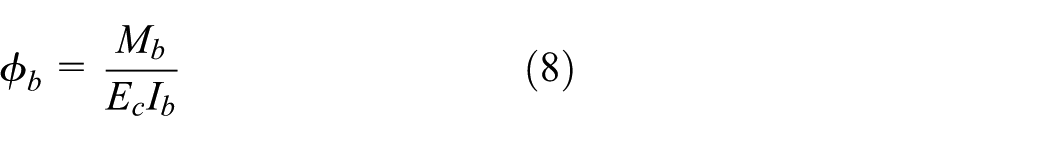
where
The total displacement (Δ t ) is the sum of Δ o , Δ b , and Δ c , which is given as equation (9)

The displacement results gained from above method were as follows: Δ yp = 30.8, Δ mp = 55.8, Δ yn = 11.7, and Δ mn = 15.8 mm. The calculated displacements were not quite accurate compared to experimental results; however, the idealized tri-linear curve based on the calculated load capacity and displacement was acceptable for further analysis, as shown in Figure 17.
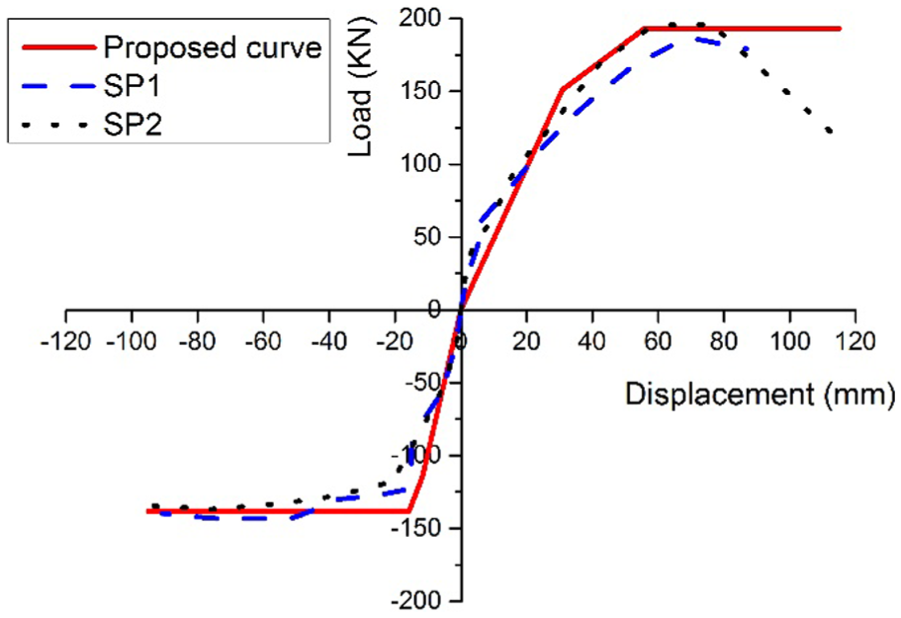
Comparison of experimental envelop and proposed analytical curve.
Conclusion
This research aimed at providing a new beam-to-column connection in precast concrete frames with satisfactory seismic performance, which could be constructed easily and rapidly. Experimental investigation was carried out on one monolithic and four full-scale precast beam-to-column connections under reverse cyclic loading. Based on the results, the conclusions can be drawn as follows:
The precast concrete connections exhibited higher flexural strength in the positive direction and less severe stiffness degradation than the monolithic specimen, due to the high strength and non-yielding of prestressing strands.
Considering the deformability, the proposed precast concrete connection showed satisfactory ability to resist high-seismic loading. However, the yielding displacements of precast specimens were too large, which were calculated by the equivalent elastoplastic energy method. This led to relatively lower displacement ductility expressed as the ratio of ultimate displacement to yielding displacement.
The equivalent viscous damping ratio of precast specimens represented slightly lower than that of the monolithic specimen, but the overall energy dissipated by the proposed precast connection was higher than the monolithic connection.
Specimens SP1 and SP2 showed more satisfactory performance than Specimens SP3 and SP4 in the aspects of flexural strength, deformability, stiffness degradation, and energy dissipation, which means additional bars were effective. However, the detail of making a small debonded length of the two bottom deformed bars near the end of U-shaped hollow in a precast beam made little difference. Thus, this detail can be canceled.
The main damages of precast connections were concentrated in the plastic hinge zone of the beams as the monolithic connection, which was in agreement with the strong-column, weak-beam concept in seismic design.
Above all, the proposed beam-to-column connection in precast frames can provide adequate seismic resistance as well-designed monolithic connections. Thus, this connection can be used in seismic regions.
Footnotes
Appendix 1
Declaration of Conflicting Interests
The author(s) declared no potential conflicts of interest with respect to the research, authorship, and/or publication of this article.
Funding
The author(s) disclosed receipt of the following financial support for the research, authorship, and/or publication of this article: The authors gratefully acknowledge financial support from the National “Twelfth Five-Year” Plan for Science & Technology (No.2011BAJ10B03) and A Project Funded by the Priority Academic Program Development of Jiangsu Higher Education Institutions (PAPD).