



Abstract
This article discusses the influence of bond and friction between the steel tube and concrete on composite response for circular tubed-reinforced-concrete short columns under axial compression. Thirteen large diameter-to-thickness ratio (D/t = 133,160) circular tubed stub columns with different types of the steel tubes (galvanized or not) and five reinforced concrete counterparts were tested. Although circular tubed–reinforced concrete specimens were characterized by the shear failure mode, the ductility performance was much better than the reinforced concrete specimens. A simplified theoretical model and a three-dimensional finite element analysis model were developed to analyze the bond and friction behavior of circular tubed-reinforced-concrete columns. The stress state of the steel tubes is determined by the friction coefficient because slipping occurred between the tube and its in-filled concrete. The formulas considering friction coefficient are also proposed for the prediction of the axial loading resistances of circular tubed concrete stub columns. The predicted results are in good agreement with the experiment results and nonlinear finite element analysis results.
Introduction
The circular tubed column is a special concrete-filled tube (CFT) column, with outer thin-walled steel tube, which does not pass through the beam–column joint to avoid direct axial loading and maximize the confinement of the steel tube. The tube’s longitudinal stress mainly comes from the bond and friction between the concrete and steel tube. In order to sustain tensile forces and flexural moments, reinforcement cage or steel sections embedded in concrete are also needed in tubed columns in practical (Zhou and Liu, 2010). Such structures are called circular tubed-reinforced-concrete (CTRC) columns (Figure 1(a)) or circular tubed-steel-reinforced-concrete (CTSRC) columns (Figure 1(b)).
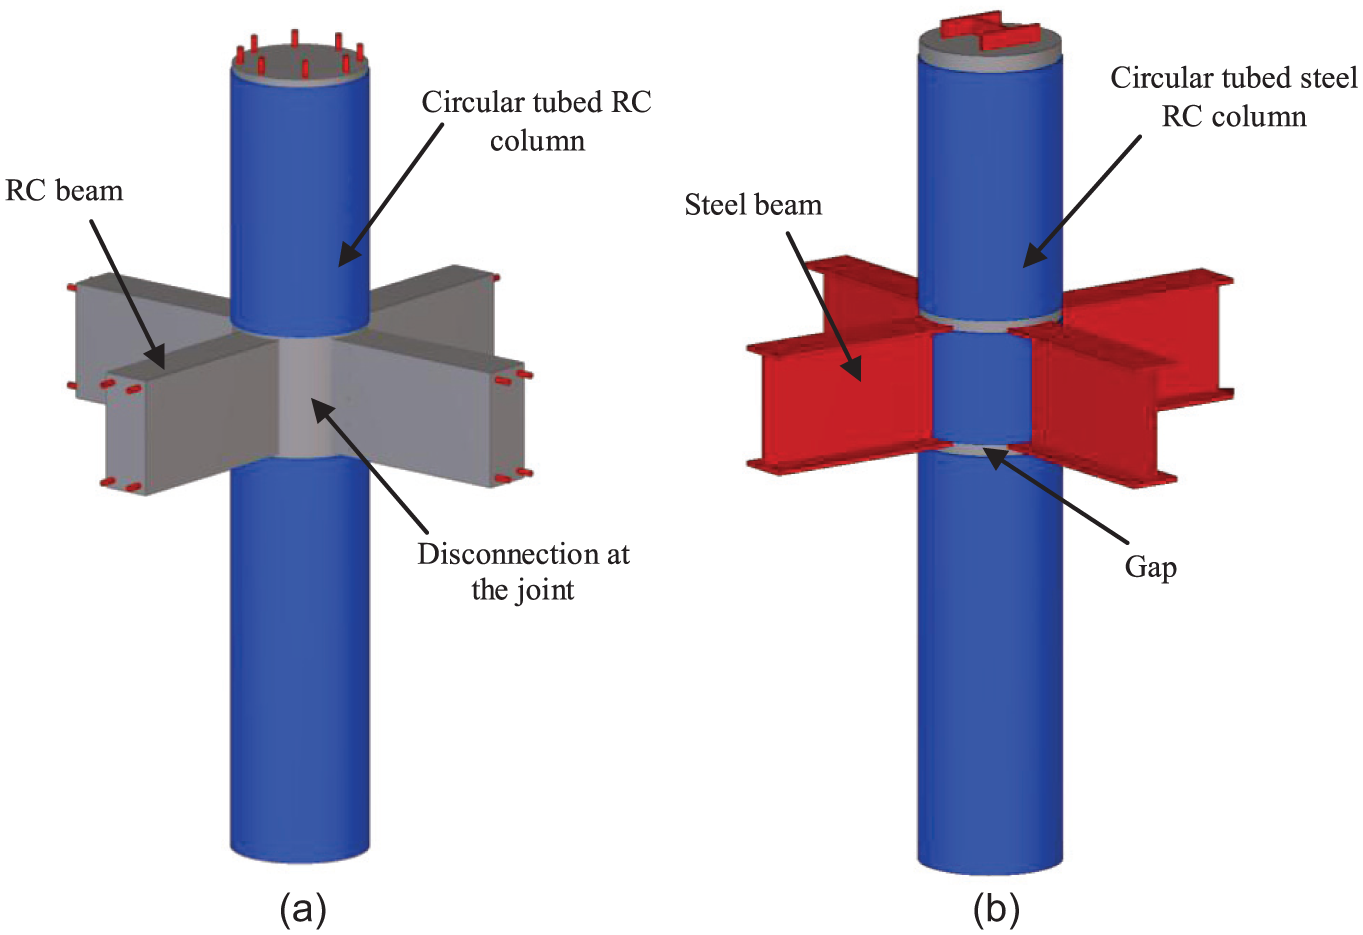
Circular tubed columns: (a) circular tubed RC column and (b) circular tubed steel RC column.
Sakino et al. (1985), Orito et al. (1987), Han et al. (2005), and Fam et al. (2004) investigated the behavior of CFT columns, tubed columns, and tubed columns using oil or other materials to reduce friction coefficient under axial compression. Test results have shown the axial load-carrying capacities of tubed columns with reduced friction were slightly higher than those of tubed columns, and the axial load-carrying capacities of both tubed columns were higher than those of CFT columns. However, tubed columns with reduced friction had the lowest stiffness. The ductility of three types of the composite columns was fairly good. O’Shea and Bridge (2000) proposed the formulas to calculate the stress of the steel tube and the axial bearing strength formula of circular tubed columns by regression from test results. Johansson and Gylltoft (2002) developed a finite element analysis (FEA) model and investigated the effect of friction coefficient on the axial compression behavior of CFT columns.
From the literature review, it can be concluded that the existing researches were mainly conducted on tubed plain concrete columns with small dimension. There is still lack of information on the experimental study of tubed RC columns with large diameter-to-thickness ratio (D/t > 130) and theoretical study on the interaction between the steel tube and its in-filled concrete which is different from CFT columns (Bradford et al., 2002). A mathematical model is also needed to predict the vertical and transverse stress in the steel tube with different friction coefficients. The confinement effect of the tube can be precisely predicted by the model, which is the basis to accurately predict the load-bearing capacities of circular tubed columns.
This article investigates the influence of bond and friction on composite response for CTRC short columns under axial compression. The objectives of the article are as follows:
To provide experimental results for large diameter-to-thickness (D/t) CTRC short columns with different types of the steel tubes (galvanized or not);
To develop an FEA model that can precisely predict the performance of tubed columns, especially for the bond and friction behavior;
To develop a mathematical model for predicting the stress components of the steel tubes at the peak load;
To develop a simplified method with physical significance to predict the axial load-carrying capacity of circular tubed RC columns.
Experimental program
Details of specimens and test setup
Thirteen CTRC short columns and five circular RC short columns were tested in this study. Galvanized steel (GS) and ordinary steel (OS) were used in the CTRC columns to investigate the effects of bond and friction on composite response. The tubes were cold-formed and welded together. The surface roughness of the galvanized tube is smaller than that of the OS tube. Therefore, the friction coefficient and bond strength between the galvanized tube and concrete are smaller.
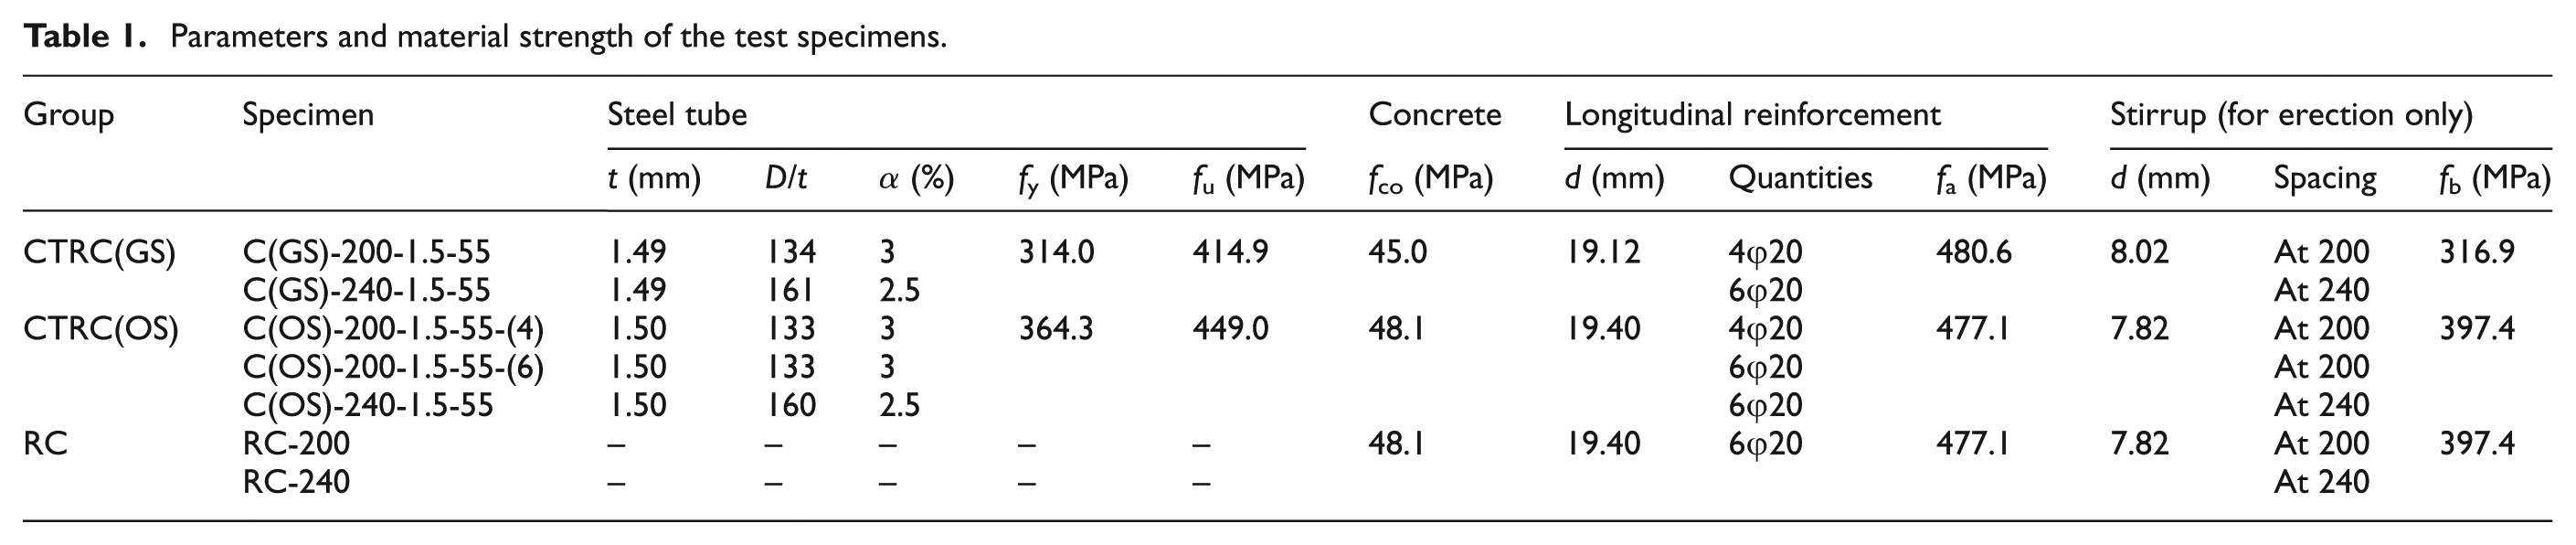
Figure 2 depicts the general layout of test specimens. A length-to-diameter ratio of 3 was selected for the CTRC stub columns in order to ensure a short column behavior. Two 10-mm-thick steel endplates were welded at both ends of the column to ensure uniform loading. Two 10-mm stripes were cut off from the steel tube at 30 mm away from both ends of the specimen to avoid direct loading. Specimen details and their nomenclature are shown in Table 1. In the nomenclature of specimen, for example, C(GS)-200-1.5-55, C(GS) represents circular members with GS tube, 200 represents diameter D of the steel tube, 1.5 presents the thickness t of the steel tube, 55 represents the nominal cubic strength of the concrete, and (4) or (6) represents four or six longitudinal reinforcement disposed at the perimeter of the column. The parameters depicted in the table include the steel ratio α for the steel tube, the yield strength fy and ultimate stress fu of the steel tube, the concrete compressive strength fco which is determined by prisms with dimensions of 150 mm × 150 mm × 300 mm, and the yield strength fa and fb of the longitudinal reinforcement and the stirrups, respectively.
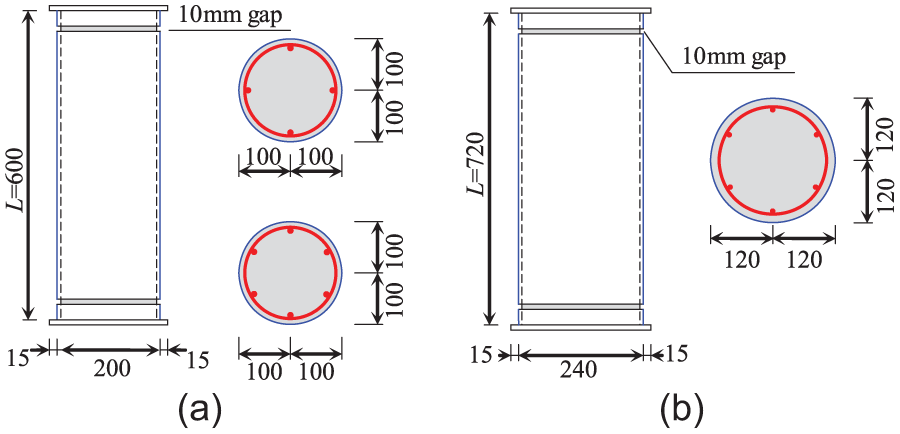
Types of the test specimens: (a) CTRC-200 and(b) CTRC-240.
Parameters and material strength of the test specimens.
The RC columns were constructed and cured under the same condition with CTRC(OS) columns. The RC columns were made by removing the steel tube of specimens C(OS)-200-1.5-55-(6) and C(OS)-240-1.5-55 to investigate the confining effect of large D/t ratio steel tube. The stirrups were used to erect the longitudinal reinforcement. In the following text, for example, C(OS)-200-1 and C(GS)-200-1 are short for C(OS)-200-1.5-55-1 and C(GS)-200-1.5-55-1, respectively, because the nominal tube thickness and cubic concrete strength of the specimens are the same.
All the columns were tested using a 5000-kN hydraulic compression machine (Figure 3). The loading rate was 1–2 kN/s in elastic range. The compressive load was applied slowly and continuously near and after the peak load. Four linear variable displacement transducers (LVDTs) were used between the end-plate to monitor the specimen’s axial deformation and two LVDTs were used to monitor transverse expansive deformation. The vertical and hoop strain gages were placed at the mid-height of the tubes at 90° intervals. Hoop strain gages were disposed at both ends of the steel tube for CTRC(GS) columns.
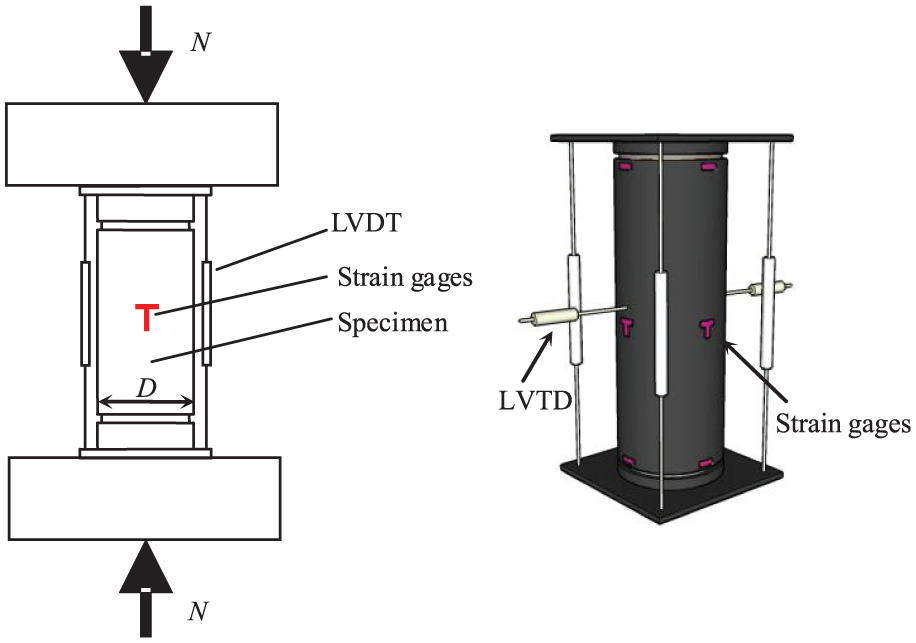
Test setup and instrumentation layout.
Experiment results and analysis
Failure modes and load–deformation responses of CTRC columns
All the specimens in groups CTRC(GS), CTRC(OS), and RC showed similar shear failure mode in concrete (Figure 4). At the peak load stage, the concrete cover of RC columns was spalled off and the axial load decreased quickly. The CTRC specimens did not show obvious phenomenon during the test due to the existence of the steel tube. Global shear failure was observed at the concrete core when the steel tube was removed after the test.

Failure patterns of the columns: (a) RC-200-1, (b) RC-240-1, (c) C(OS)-200, and (d) C(GS)-200.
The measured axial displacement (Figure 5(a)) and lateral displacement (Figure 5(c)) increased quickly when the load reached the bearing capacity of core RC columns. Both columns showed fairly good deformation capability and the load dropped slowly at the post-peak stage. CTRC(GS) columns have higher axial capacities than that of CTRC(OS) columns. The shape of curves is similar for all specimens in group CTRC(OS)-200 with different longitudinal ratio (Figure 5(b)). Thus, the longitudinal reinforcement can increase the axial bearing capacity and slightly affect ductility.

Load–displacement curves for the columns: (a) C-240 load N–axial displacement Δ, (b) C(OS)-200 and RC load N–axial displacement Δ, and (c) C(OS) load N–lateral displacement Δe.
The experiment results show that the steel tube with large diameter-to-thickness ratio (D/t = 133,160) is able to provide effective confinement for the RC short columns. The thin-walled steel tube could avoid the brittle failure of the RC short columns.
Load–strain and load–stress analysis
Strain gages were placed at the outer surface of the steel tube. At one section, there were four strain gages and the average values were chosen (Figure 6). The elastic–plastic analysis method (Zhang et al., 2005) was adopted to analyze the stress state on the steel tube based on measured strains.
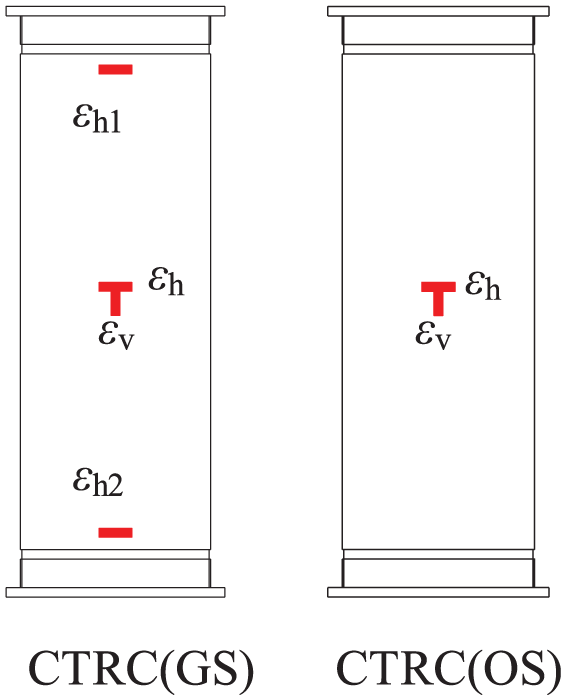
Strain gages’ arrangement on the tube.
Figure 7 depicts the load–strain and load–stress curves for the CTRC columns, in which σv and σh are the longitudinal and hoop stresses of the steel at the mid-height of the tube, respectively, and σz is the equivalent stress. The tension stresses σh1 and σh2 are the hoop stresses at the top end and the bottom end of the tube, respectively.
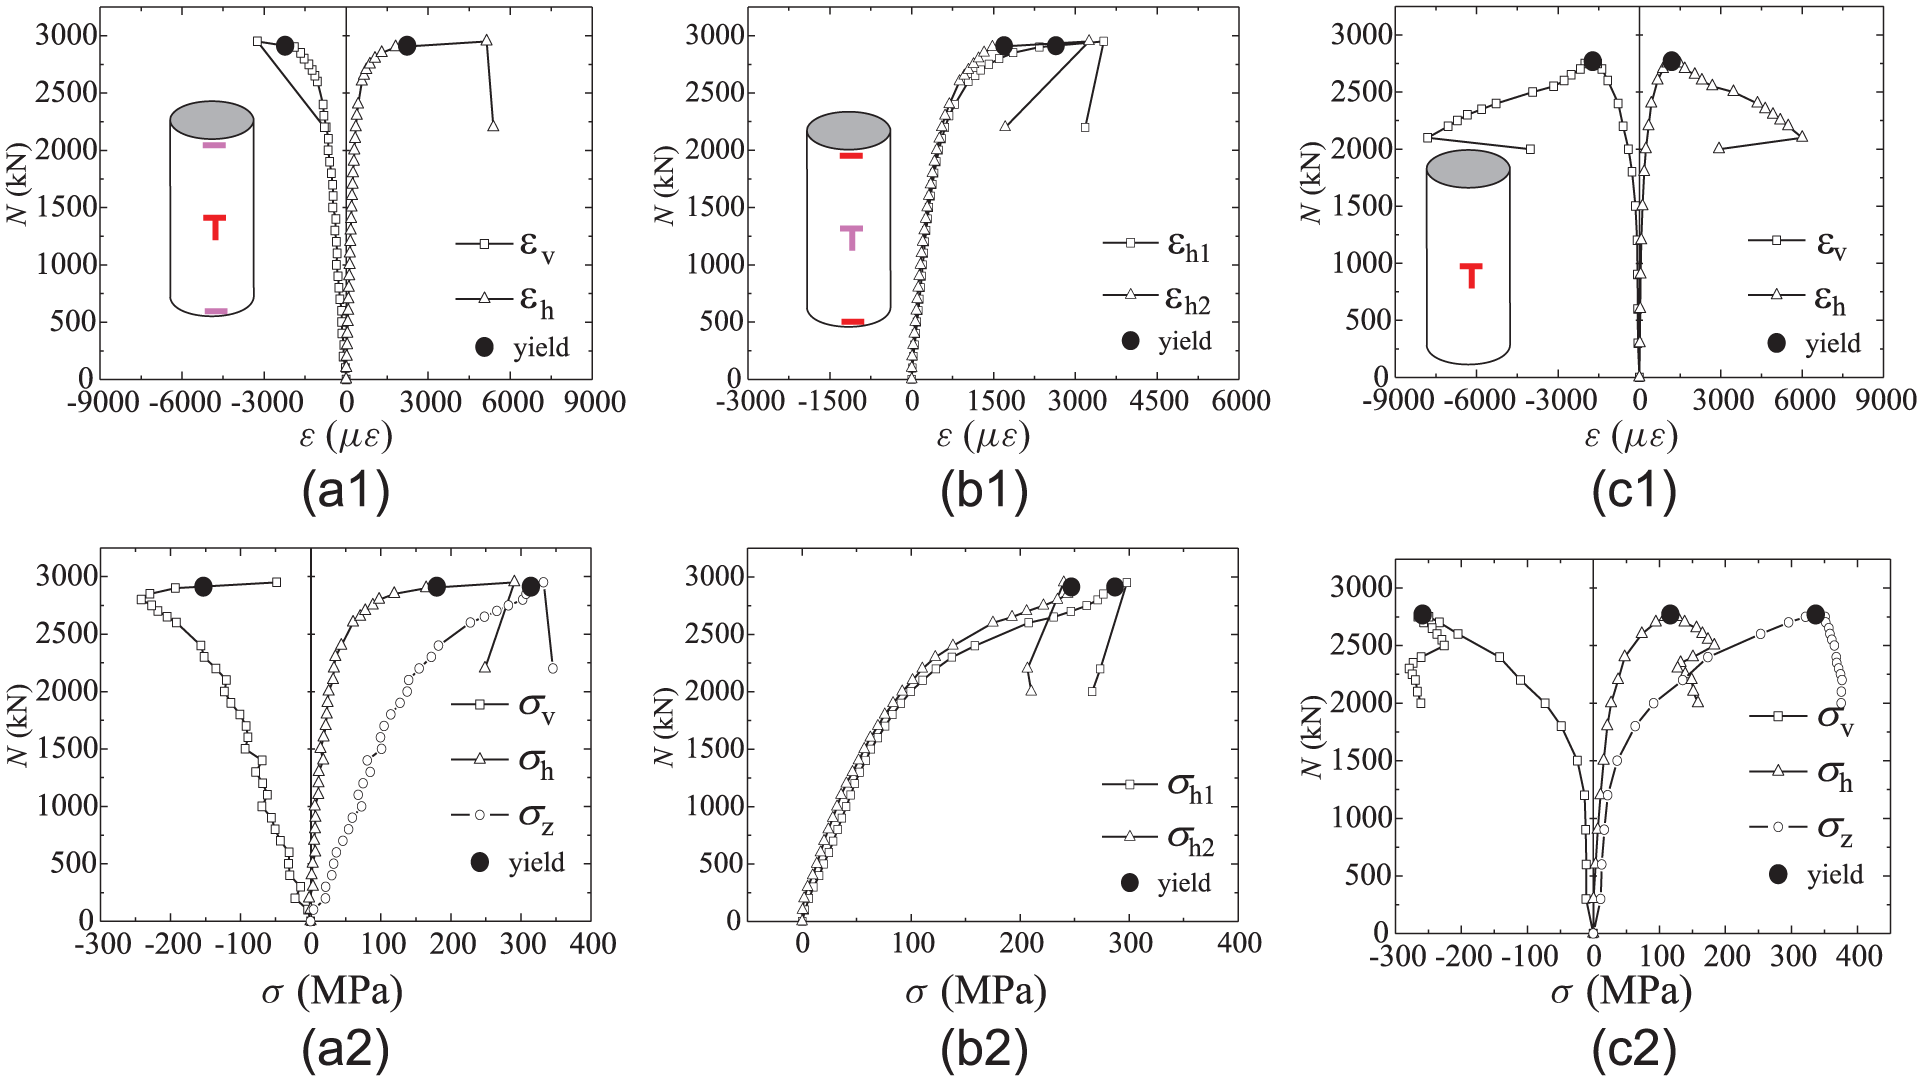
Load–strain (stress) curves for tubes: (a1) C(GS)-200 load–strain at mid-height, (b1) C(GS)-200 load–strain at the end, (c1) C(OS)-200 load–strain at mid-height, (a2) C(GS)-200 load–stress at mid-height, (b2) C(GS)-200 load–stress at the end, and (c2) C(OS)-200 load–stress at mid-height.
Figure 7(a) and (c) shows the strain and stress at mid-height of the tube. At the elastic stage, the vertical and transverse stress and strain increase linearly because of the bond and friction effect between the concrete and steel tube, and the vertical ones increase faster than the transverse ones. When the axial load is close to the capacity of the core RC columns, the vertical and transverse stresses increase quickly and show nonlinearity. The steel tube around mid-height of specimen yields at the peak load. The transverse stress σh increases, while the vertical stress σv decreases to a small value, or even changes into tension state. At the post-peak stage, the steel tube bulged. The strain (stress) at top end and bottom end increases at almost the same speed (Figure 7(b)). Figure 7(b) also shows the point of yielding for the tube at the mid-height.
Transverse deformation coefficient (
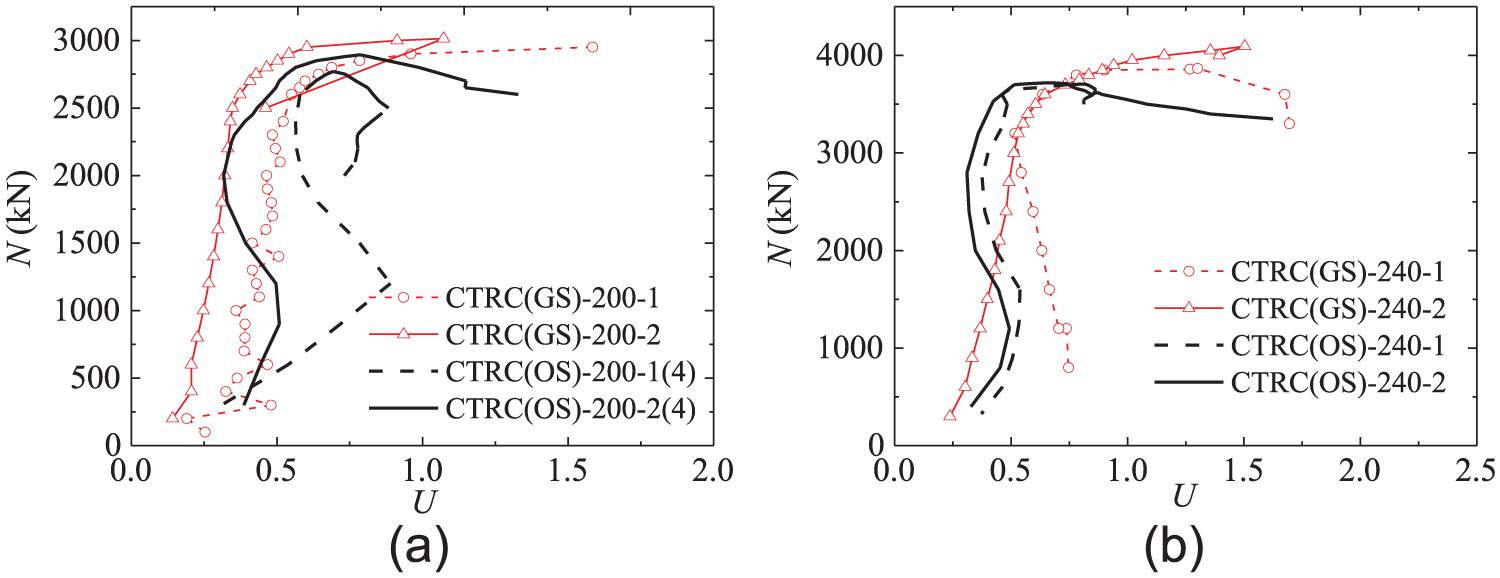
Load–transverse deformation coefficient: (a) C-200 and (b) C-240.
Transverse deformation coefficient at peak load.

Table 3 lists the peak load, peak strain, and stress components of the tubes, in which εu equals axial displacement measured by LVDTs at peak load divided by the length of the columns L, that is, εu = Δ/L. The peak loads for CTRC(GS) columns are higher than those of the CTRC(OS) columns although the strength of the concrete and steel tube is a little lower. The peak strains for columns with a diameter of 200 mm are greater than those of the columns with a diameter of 240 mm because the confinement stress is greater.
Comparison of experiment results at peak load.
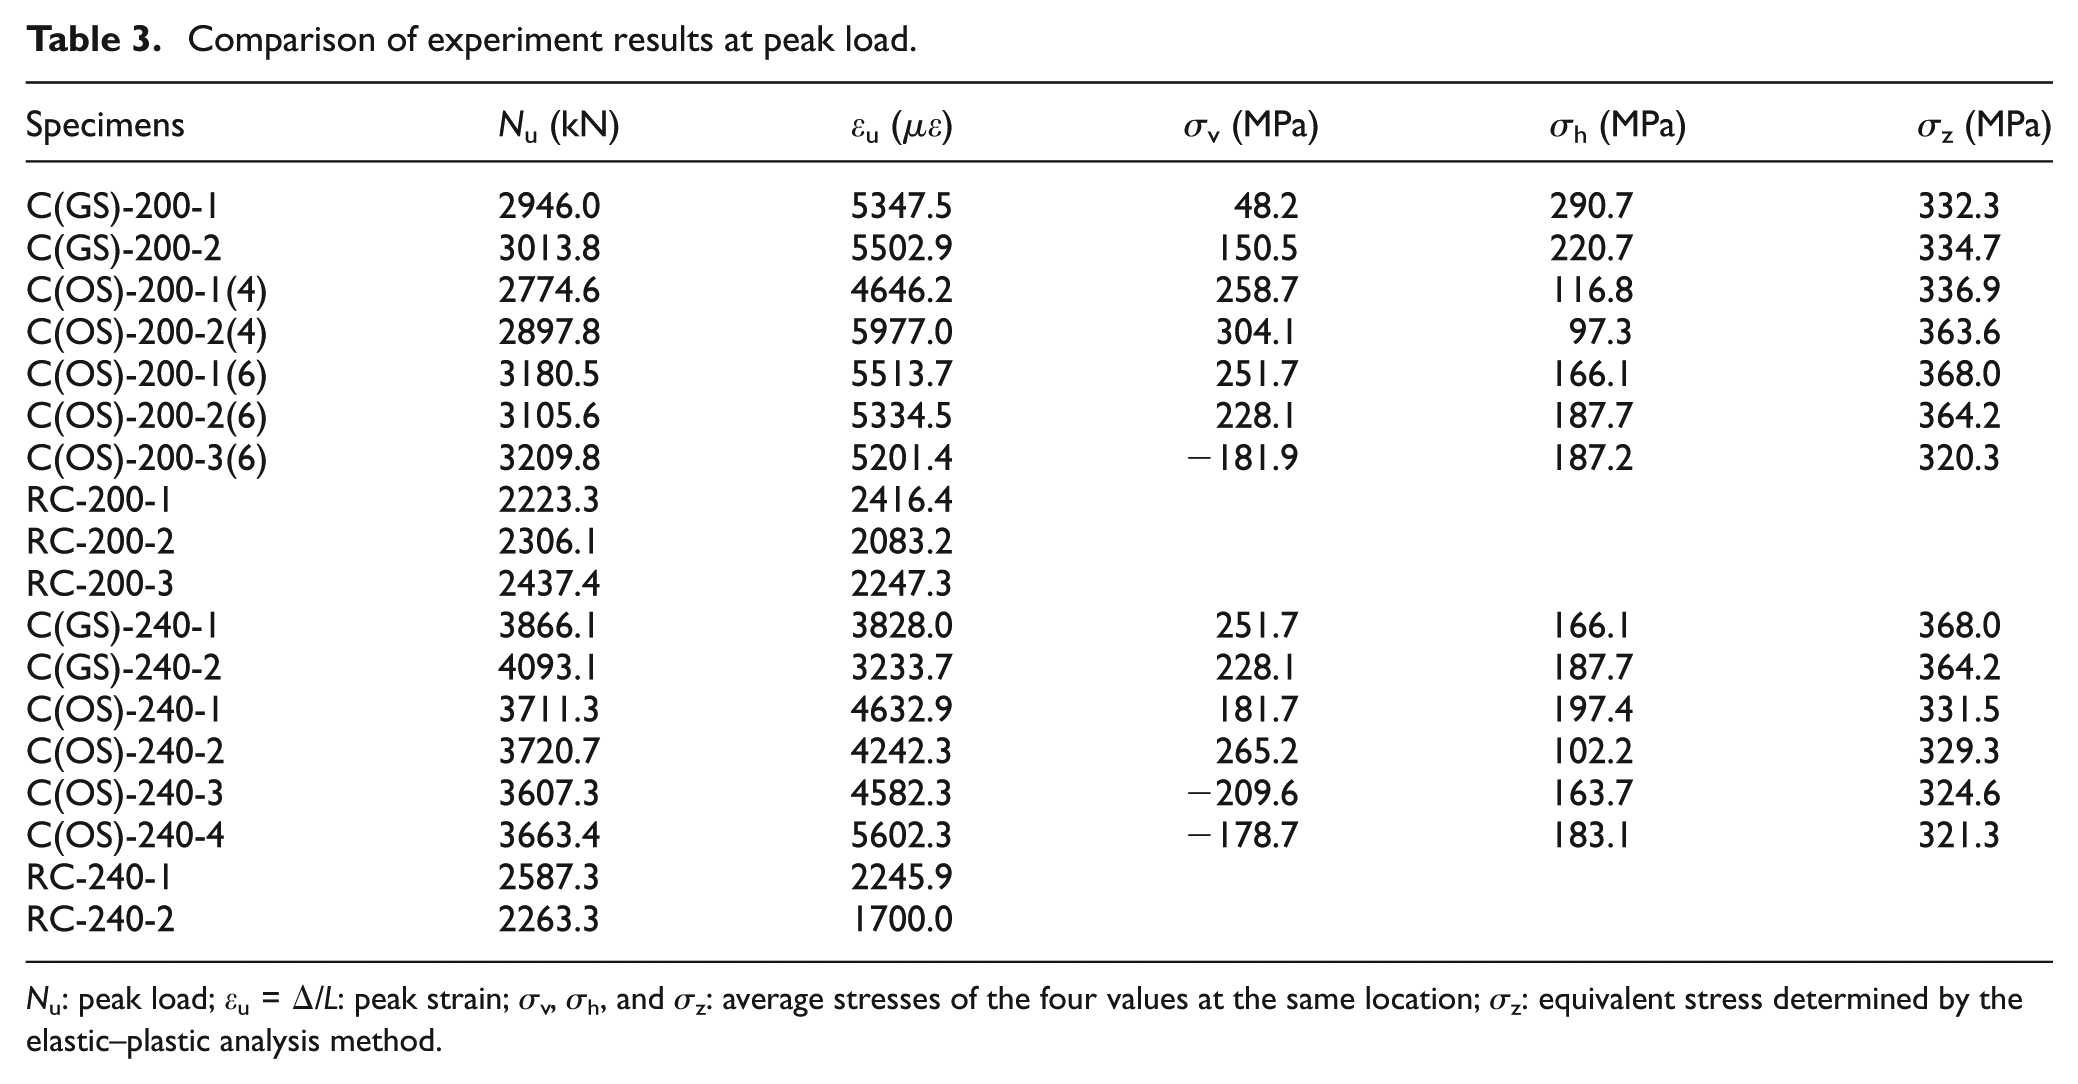
Nu: peak load; εu = Δ/L: peak strain; σv, σh, and σz: average stresses of the four values at the same location; σz: equivalent stress determined by the elastic–plastic analysis method.
At the peak load, the ratios of the equivalent stress to yield stress σz/fy for the galvanized tube are between 1.05 and 1.19, while they are 0.92–1.00 for the ordinary tubes. It is because that the CTRC(GS) columns with smaller bond and friction showed higher σh/fy than those of CTRC(OS) columns. It can be concluded that the smaller the bond and friction, the greater the hoop stress and confinement effect that can be reached at the peak load.
The stresses in Table 3 are the average values obtained from symmetrical points. In the tests, the steel tube yielded for all CTRC(GS) columns at peak load. In certain cases (e.g. specimen C(OS)-200-1.5-1(4)), the average equivalent stress did not yield. It is likely due to the uncertainties in the experiments. However, most of the points yielded at the peak load. Thus, it is viable to correlate peak load to the yielding of the tube for both the galvanized and ordinary tubes.
FEA
The damaged plasticity model (DPM) for concrete in ABAQUS (ABAQUS, 2008) was used for the analyses of tubed columns subjected to axial compression. A nonlinear FE model considering nonlinear material behavior was developed. The FE model was used to investigate the influence of important parameters that determine the ultimate strength of the columns. The aim of the nonlinear analysis was to develop a consistent approach for the modeling of tubed columns.
There are three key points in FE analysis of tubed columns: (1) a reasonable equivalent stress–strain curve for modeling improved plastic behavior of confined concrete due to the conservative strain estimation of DPM for confined concrete; (2) the parameters for DPM that determine the yielding criteria; and (3) the interaction between the concrete and tube, which determines the stress state for the tube.
The steel tubes were modeled by four-node shell elements with reduced integration (S4R). The concrete core was simulated by eight-node brick elements (C3D8R), which have 3 translational degrees of freedom at each node.
Material properties
The increased strength and ductility improvement reflect the confinement effect for concrete. The increased strength can be achieved by defining the yielding surface. The increased peak strain and the even descending branch of stress–strain curve reflect the ductility improvement. A modified concrete stress–strain curve for tubed column is proposed based on the research of Li et al. (2001) (Figure 9).

Stress–strain curves for the concrete:(a) compression and (b) tension.
Figure 9(a) shows the compression stress–strain curve for concrete

where
The compressive strength of confined concrete can be calculated as follows (Li et al., 2001; Mander et al., 1988)
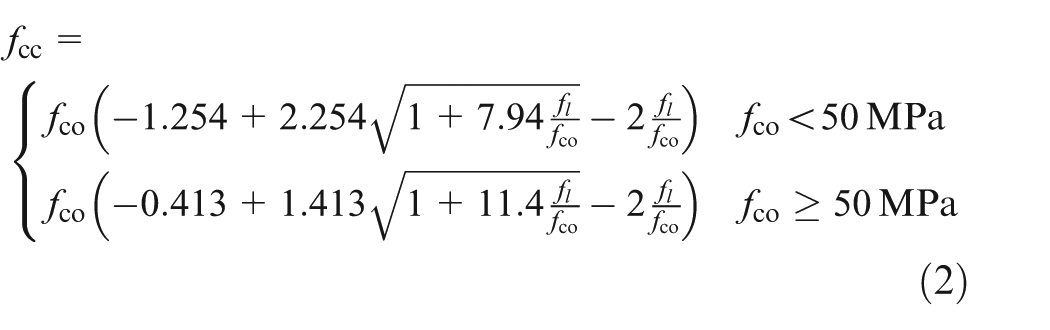
where

For concrete in tension, a simplified stress–strain model was used in the analysis and a brief introduction is shown in Figure 9(b). The notation in the figure is defined as follows: ft and εt are the tensile strength of concrete and the strain at the tensile strength of concrete, respectively. εcu is the ultimate strain of concrete in tension; here, it is taken as 25εt. The empirical expressions for defining ft and εt, which are recommended by Guo and Shi (2003), are shown as follows


A perfect elastic–plastic model consisting of two stages was used to describe the mechanical behavior of steel. The residual stress of the tube was not taken into account in the FE model.
Key parameters for DPM
The dilation angle Ψ defined in ABAQUS is less than or equal to the internal friction angle ϕ which is calculated as follows: Θ = 45° + ϕ/2, where Θ is the shear failure angle. The experiment described in this article and some other articles showed (Liu and Zhou, 2010; Mei et al., 2001) that the shear failure angles of confined concrete were between 62° and 68°, thus ϕ is between 34° and 46° for tube confined concrete. It was found that finite element method (FEM)-predicted results with a dilation angle Θ in the range between 34° and 46° also agreed well with the test results for tubed columns.
Effect of bond and friction
The bond and friction are important factors which influence the composite response and are also the basis for learning the load bearing mechanisms for tubed columns. A surface-based interaction with a contact pressure model in the normal direction and a Coulomb friction model in the tangential direction to the surface between the steel tube and core concrete (Han et al., 2007) was used in the FEA. The interface elements consist of two matching contact faces of the steel tube and concrete elements.
The friction coefficient suggested by Baltay and Gjelsvik (1990), Rabbat and Russell (1985), and Aly et al. (2010) was µ = 0.2–0.65. µ = 0.2 was adopted for the galvanized tube and µ = 0.6 was adopted for the ordinary tube. A small value of friction coefficient indicates a smooth tube surface. An average surface shear limit τcrit = Pµ ≥ τbond was used in the Coulomb friction model, in which τbond = 0.6 MPa; P denotes the normal stress, in which P = fl. The interface element allows the two surfaces to separate under the influence of tensile force. However, both contact elements are not allowed to penetrate into each other.
The FEA results of specimen C(OS)-200-1.5-55-1(6) showed the tube yields at the peak load (Figure 10(a)). The axial load N versus axial displacement Δ and N versus lateral displacement Δe curves also showed that the analytical results agree well with the experimental results (Figure 10(b) and (c)).

FE modal and analysis results for C(OS)-200-1.5-55-(6): (a) FEA model and stress analysis results for C(OS)-200-1.5-55-(6) at peak load, (b) comparison of N–Δ curves between analysis and experiment, and (c) comparison of N–Δe curves between analysis and experiment.
Figure 11 depicts the axial load N versus axial displacement Δ in ABAQUS for specimen C(OS)-200-1.5-55-(6) with different shear limit, in which µ = 0.6, and the shear limit τcrit is defined as 0.4, 0.9, and 1.42 MPa and no shear limit, respectively. It should be noted that τcrit = Pµ = 1.42 MPa is in accordance with the tube yielding. The different shear limit values do not affect the elastic branch because no slippage occurred at this stage. The specimen with no shear limit shows the smallest bearing capacity. The bearing capacities and the shapes of curves are almost the same for the specimens with τcrit = 0.9 and 1.42 MPa. It is because the specimens with τcrit = 0.9 and 1.42 MPa reached the shear limit around peak load and the tube slipped. The shear stress between the tube and concrete showed a slight difference at the peak load, and the stress state of the tube was also slightly different. Thus, τcrit = 0.9 and 1.42 MPa have little effect on the axial loading behavior. The specimen with τcrit = 0.4 MPa reached shear limit before the peak load and the hoop stress was the largest; therefore, the specimen with τcrit = 0.4 MPa has the largest bearing capacity.
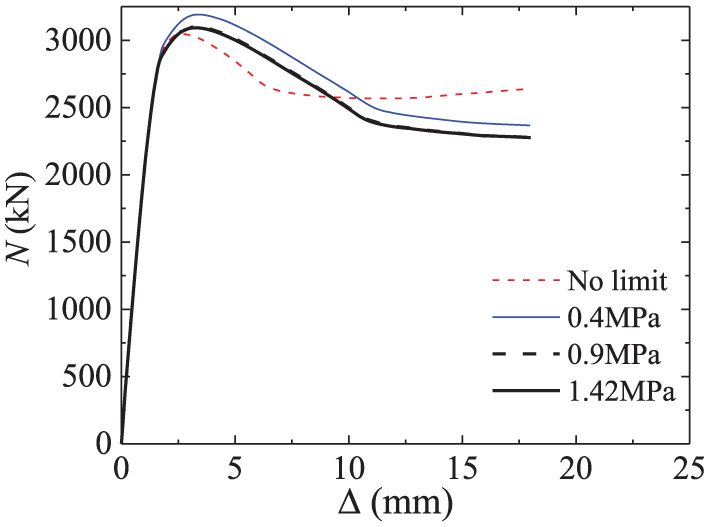
Effect of shear limit τcrit.
Figure 12 shows the difference between applied axial load versus measured the steel tube’s strain εv and global strain calculated from vertical displacement ε, that is, ε = Δ/l. εv was obtained from the vertical strain gage at the mid-height of the tube. The difference which was calculated by ε − εv shows that slipping occurred between the tube and concrete and the bond was broken.
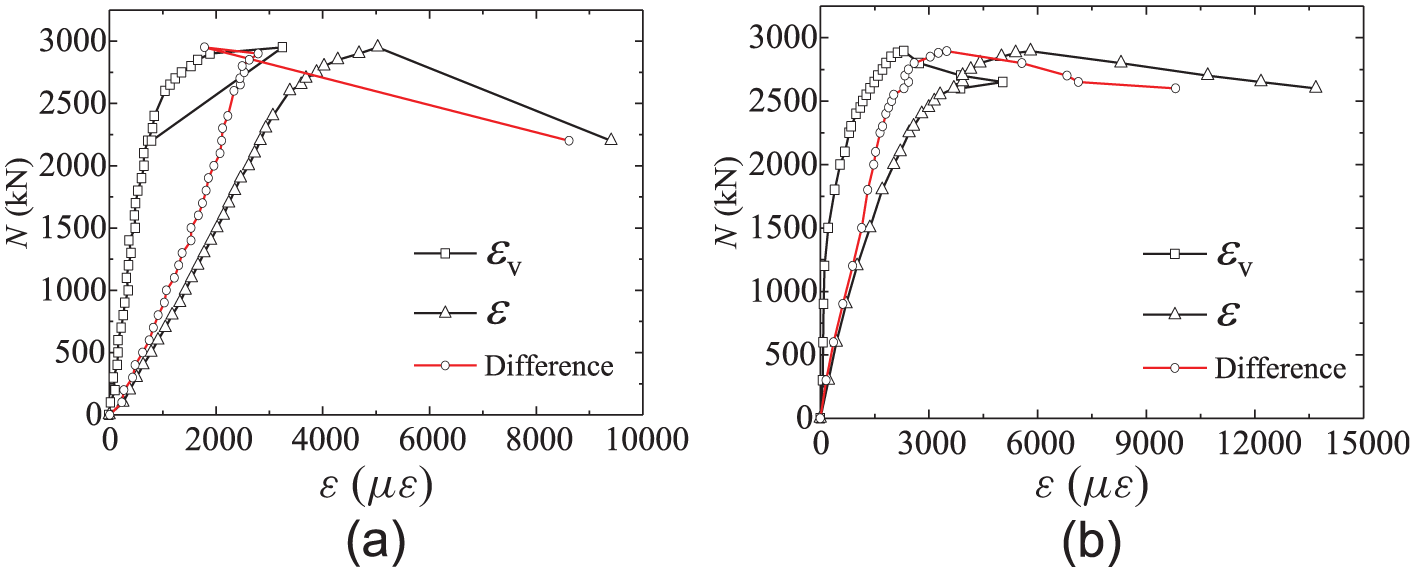
Difference between load–steel tube’s strain and global strain: (a) C(GS)-200-1.5-55-1 and (b) C(OS)-200-1.5-55-2(4).
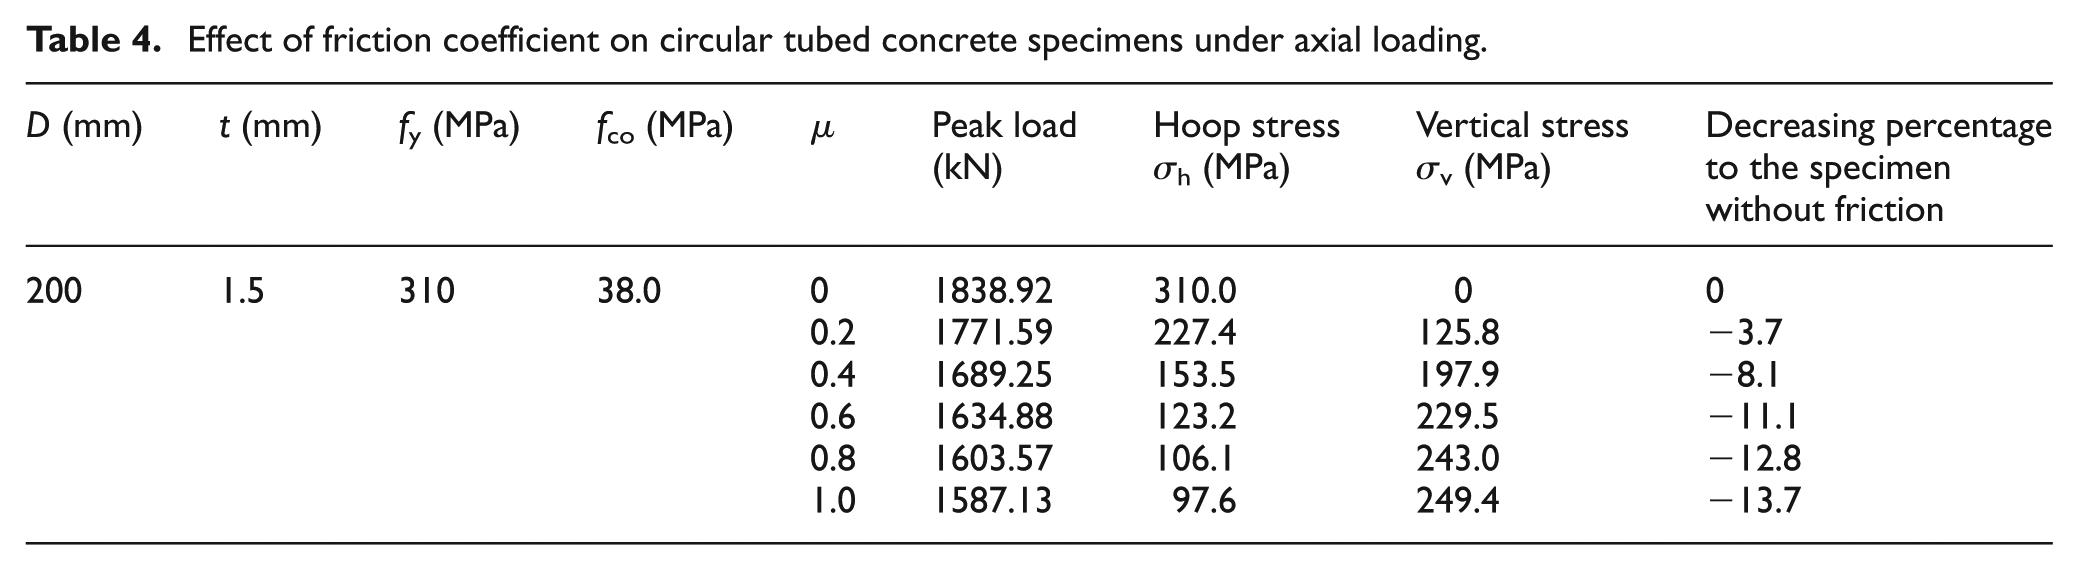
Circular tubed columns were designed to study the effect of friction coefficient in ABAQUS. All parameters maintained constant except that the friction coefficient µ changed from 0 to 1.0 (Table 4). The vertical stress increases, while the bearing capacities and the hoop stress decrease with increasing friction coefficient. The tube yields at the peak load. The stress state of the tube and the bearing capacities of the columns are affected by the friction coefficient when it is less than 0.6, and they are affected little when the friction coefficient is greater than 0.6. The vertical stress to yielding stress σv/fy approaches to a constant value (0.61) when the friction coefficient is more than 0.6.
Effect of friction coefficient on circular tubed concrete specimens under axial loading.
Theoretical model
Assumption
The theoretical model adopts the following assumptions:
The steel tube section yields along a certain distance. Perfect elastic–plastic behavior is assumed for steel.
The vertical and hoop stresses are constant along the thickness direction.
The stress state is determined by friction because the bond is overcome by the slippage before the peak load.
The theoretical formula and solutions
Figure 13 shows description of the theoretical models for tubed columns. σv and σh are the vertical and hoop stresses at distance x to the end. The tube element is enlarged in Figure 13(b). Using the vertical force equivalent for the tube element, the following equation can be obtained


Analytic models: (a) yielding section for tube and (b) element of tube.
In practice, the

where µ is the friction coefficient.
By substituting equation (6b) into equation (6a), the following equation can be obtained

Following von Mises yielding criteria,

Supposing

Differentiating both sides of equation (9)

Solve equation (10) using the parametric equation method. Supposing

Finally, the solution can be expressed as follows

The solution for the parametric equations (equation (12)) presents the vertical stress distribution along the length of the tube. A simple cubic polynomial (equation (13)) is adopted by curve fitting. The square correlation coefficient between the cubic polynomial and parametric equation (12) is 0.999 when a reasonable distance for transiting friction force is adopted (Figure 14). σv/fy is determined by the friction coefficient µ, the diameter D of the tube, and the distance x for transiting friction force

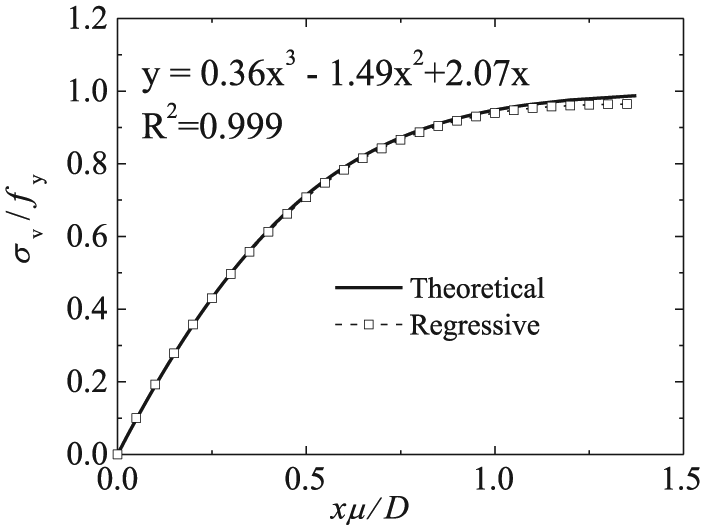
Comparisons between theoretical analysis and fitting method.
Axial load-carrying capacities of tubed RC stub columns
Effect of longitudinal reinforcement
In the experiment, the reinforced cage was erected by the hoops. Both experimental and analytical results indicated that the longitudinal reinforcement yields before buckling. Therefore, the circular thin-walled tube is able to provide enough confinement to concrete core and longitudinal reinforcement. The experimental results also showed that longitudinal reinforcement can increase the axial bearing capacity for tubed columns.
Effect of diameter-to-thickness ratio and concrete compressive strength
Circular tubed RC columns were designed to study the effect of diameter-to-thickness ratio (D/t) and concrete compressive strength in ABAQUS. In the analyses, D = 600 mm, L = 1800 mm, fb = fy = 300 MPa, µ = 0.6, τcrit = 0.6 MPa, D/t = 80–200, and fco = 30–80 MPa. The analytical results are shown in Figure 15. The axial load-carrying capacities increase with increasing concrete compressive strength and decrease with increasing diameter-to-thickness ratio. The analytical results also can be used to validate the flowing axial bearing capacity formulas.
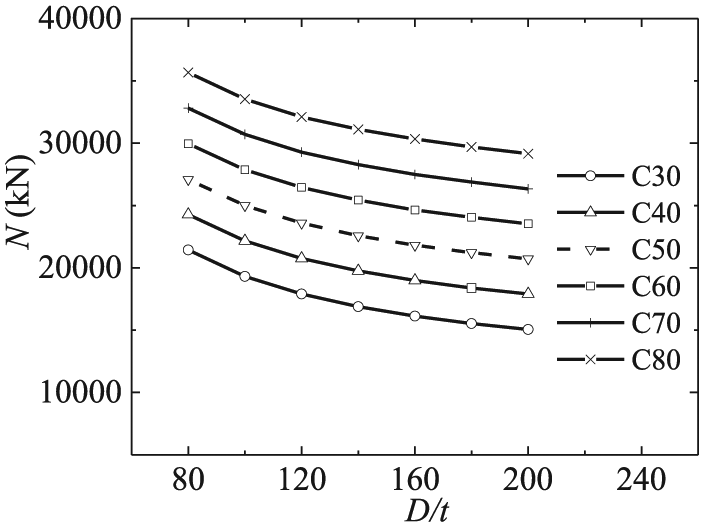
Influences of parameters D/t ratio and fco on axial load-carrying capacities.
Axial bearing capacity formulas
For an existing axial loading column, σv can be obtained from equation (13), and σh can be obtained by substituting σv into equation (8). Figure 16 depicts the comparisons of the steel tube’s vertical stress between FEA and theoretical model results, assuming x = 1.2D. Figure 16(a) depicts the vertical stress distribution obtained by FEA results and theoretical model. The vertical stress distribution shows good agreement between FEA results and theoretical results for the specimens with µ = 0.2. This is because the shear force on the contacting surface for specimens with µ = 0.2 was small, and no separation occurred. However, the shear force on the contacting surface for specimens with µ = 0.6 was large and induced large vertical stress in the tube. The tube would separate from the concrete when the vertical stress was large enough, and such case could not be taken into consideration in the theoretical model. Therefore, the values obtained from theoretical model are larger than those from FEA for the specimens with µ = 0.6.
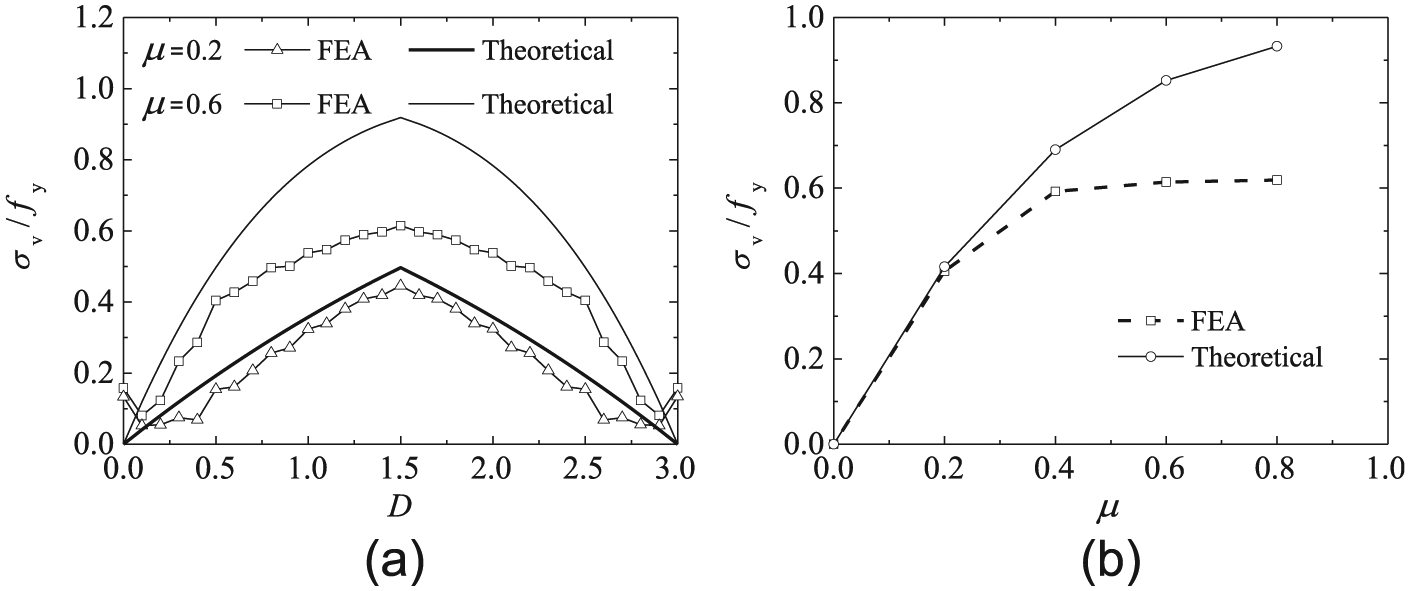
Comparisons of steel tube’s vertical stress by FEM analysis and theoretical modal (x = 1.2D): (a) C-200 vertical stress distribution obtained by FEM analysis and theoretical modal along height and (b) σv/fy at the peak load for the tube obtained by FEM analysis and theoretical modal with different friction coefficients.
Figure 16(b) depicts the ratio of σv/fy at the peak load for the tube obtained by FEA and theoretical model with friction coefficient µ = 0.2, 0.4, 0.6, and 0.8, where σv is the vertical stress and fy is the yielding stress. σv/fy increase with friction coefficient. The vertical stress is almost constant (0.61) when the friction coefficient is larger than 0.6.
A total of 29 tubed columns were available from Liu et al. (2009) and Liu and Zhou (2010) and this article. The average value of σv/fy at the peak load was 0.54, and the average value of σh/fy at the peak load was 0.60 (Figure 17). In reality, parameters such as the properties of the tube and concrete which can influence the friction coefficient are complicated. By consideration of various results including experimental, theoretical model, and FEA, the values for σv/fy and σh/fy can be taken as follows


Statistical experimental stress results at peak load: (a) σv/fy versus D/t and (b) σh/fy versus D/t.
It should be noted that equation (14) satisfies the von Mises yielding criteria.
The axial load-carrying capacities can be predicted as

where Ac and As are the cross-sectional area of the concrete and steel tube, respectively; fb is the yield strength of longitudinal reinforcement; and fcc is the compressive strength of confined concrete that can be calculated by formula (2). The lateral confining pressure acting on the concrete core fl is given by equation (16) because

A total of 110 experimental axial strength values for tubed columns were collected from the literatures (Fam et al., 2004; Han et al., 2005; Johansson and Gylltoft; Liu et al., 2009; Liu and Zhou, 2010; Mei et al., 2001; Orito et al., 1987; O’shea and Bridge, 2000; Sakino et al., 1985; Yamamoto et al., 2000). The test parameters for the experiment results include diameter-to-tube thickness ratio D/t (13.6–586.1), concrete strength (8.5–132 MPa), and longitudinal reinforce ratio (0%–6%). The results predicted by equation (15) agree well with the experiment results (Figure 18). The average ratio of the predicted axial strength to experimental axial strength is 0.929, and the root-mean-square deviation is 0.073.

Comparisons between equation (15) and the test (FEA) results.
In practical engineering, a simply and easily remembered formula gains popularity. The well-adopted formula for compressive strength of confined concrete given by Richart et al. (1928) is expressed in the following form

Substituting equation (17) into equation (15),
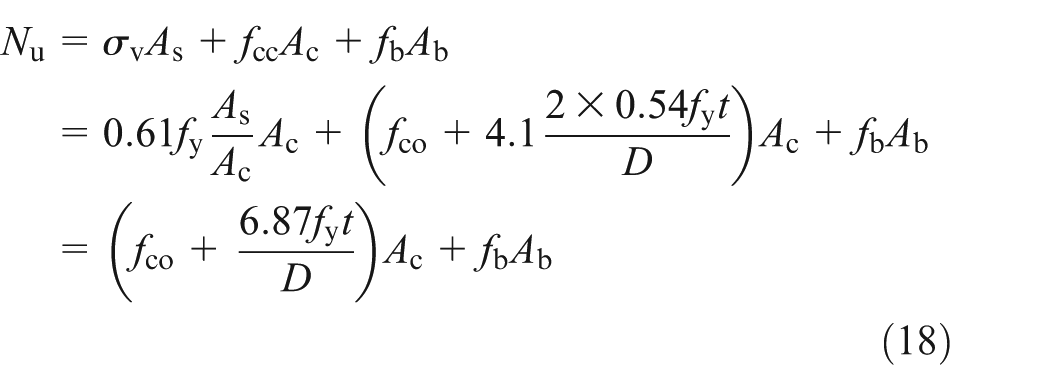
The prediction based on equation (18) shows good agreement with the experiment results (Figure 19). The average ratio of the predicted results to the experiment results is 0.912, and the root-mean-square deviation is 0.079.

Comparisons between equation (18) and the test (FEA) results.
Summary and conclusion
This article provides experimental, theoretical, and nonlinear FE analyses on the structural behavior of CTRC columns under axial compression. The following conclusions can be drawn from the study:
The failure of CTRC columns was controlled by shear. The strength and ductility of RC columns are significantly improved by the tubes with large diameter-to-thickness ratio (D/t = 133–160). Both the GS and OS tubes were considered to be yield when approaching the peak load.
The stress state of the steel tubes is determined by friction coefficient because slippage occurred at peak load. A smaller friction coefficient corresponds to a smaller vertical stress, but a larger horizontal stress and a more significant confinement effect. The vertical stress gets close to a constant value when the friction coefficient is more than 0.6.
A simplified theoretical mechanical model and a nonlinear FE model were established using ABAQUS and the predicted results were in good agreement with the test results.
Equations to estimate the horizontal and vertical stress in the steel tube were proposed, based on which formulas with physical significance that took account of the effect of friction for predicting the axial bearing strength were established.
Footnotes
Declaration of Conflicting Interests
The author(s) declared no potential conflicts of interest with respect to the research, authorship, and/or publication of this article.
Funding
The author(s) disclosed receipt of the following financial support for the research, authorship, and/or publication of this article: This research is financially supported by the National Natural Science Foundation of China (No. 51308051 and No. 51178210) and the Fundamental Research Funds for the Central Universities (No. 106112014CDJZR200004).