




Abstract
This study aims to assess seismic vulnerability of a typical pile-supported wharf considering ageing effects due to chloride-induced corrosion of the reinforced concrete piles. In order to improve the seismic performance of corroded wharves, carbon fibre–reinforced polymers is used as a retrofit technique. Three-dimensional model of the wharf is constructed using SAP2000, and pushover analysis is conducted to deduce the capacity curve of the wharf and establish quantitative criteria for bound of damage states. Then, using eight ground motion records, nonlinear static analysis called capacity spectrum method is used to evaluate the response of initial (t = 0 years), corroded (t = 25, 50, 75 years) and carbon fibre–reinforced polymer-retrofitted-corroded (t = 50, 50, 75 years) pile-supported wharf structures. In order to assess the seismic vulnerability of wharves quantitatively, fragility curves are developed using two different engineering demand parameters, including displacement ductility factor (µd) and state of plastic hinges. These fragility curves demonstrate the evolving damage potential under different levels of intensities taking into account time-dependent corrosion-induced deterioration. In addition, these curves reveal the effectiveness of carbon fibre–reinforced polymer method on the fragility reduction. Results indicate an increment in seismic vulnerability throughout the lifetime of the structure due to corrosion denoting the considerable impact of deterioration due to ageing effects on structural response. Moreover, using carbon fibre–reinforced polymer jacketing as a retrofit and repair method for corrosion-induced damaged structures can remarkably enhance their seismic performance.
Keywords
Introduction
Seaport transportation system is an essential component of the modern civil infrastructures and considered as a critical foundation for country’s economic development. According to global statistics, high volume of trades take place through sea and maritime transportation. Given the importance of ports on national and local economies, improving safety indexes and creation of safe harbours is vital.
Marine environment is one of the most aggressive conditions that threaten the durability of concrete structures and unfortunately impose hundreds of million dollars in repair every year. Durability of reinforced concrete (RC) structures located in marine environments depends on several factors. However, abundant investigations demonstrate that corrosion of embedded steel bars within concrete structures mainly due to the chloride attack is the major cause of concrete deterioration in marine environments. As corrosion propagates, damage due to expansion of corrosion product will be characterized by cracking, spalling and delimitation of concrete cover (Poulsen and Mejlbro, 2010).
Pile-supported wharves are commonly RC structures exposed to marine environment. These vital structures sustain severe state and operational deterioration due to aggressive environmental condition. The failure of pile-supported wharf structures during seismic event not only disturbs the maritime transportation network but also seriously affects the post-earthquake emergency response leading to intense economic losses. During past decades, a large number of pile-supported wharves damaged extensively because of poor seismic design (Werner, 1998). This implies the urgent need to upgrade the existing seismic design philosophy and importance of accurate seismic assessment of these vulnerable structures.
Seismic performance of pile-supported wharves has been assessed in a great deal of research; Takahashi (2003) investigated the seismic performance of pile-supported wharf considering the pile–soil interactions. Shafieezadeh et al. (2009) assessed seismic response of typical pile-supported container wharf using three-dimensional (3D) nonlinear analytical model.
Despite the significant body of research on the evaluation of seismic performance of pile-supported wharves, very limited research studies have been conducted on the seismic vulnerability assessment of pile-supported wharves.
The seismic vulnerability assessment of structures usually has been performed by seismic fragility analysis. This emerging powerful analysis input is the ground motion intensity measure (IM) and the output is the conditional probability of reaching or exceeding a predefined level of damage. Fragility analysis was used in a numerous type of structures, such as buildings (Erberik, 2008; Farsangi et al., 2014; Kappos and Panagopoulos, 2010), bridges (Choe et al., 2009; Ghosh and Padgett, 2010; Sung and Su, 2009; Zhong et al., 2009) and so on. However, less effort is made in the case of pile-supported wharves; some of them are mentioned below.
Shafieezadeh (2011) studied the seismic vulnerability of pile-supported wharf and container crane taking into account soil–structure interaction (SSI) in a liquefied susceptible embankment. Yang et al. (2012) performed seismic fragility analysis for vertical pile-supported wharves based on nonlinear time-history analyses of two-dimensional numerical model. Heidary-Torkamani et al. (2013b) proposed a feasible procedure for seismic vulnerability assessment of a typical pile-supported wharf using FLAC2D model and incremental dynamic analyses.
The effect of corrosion on the seismic vulnerability of structures has been investigated in some structures such as bridges and buildings. About bridge structures, Ghosh and Padgett (2010) investigated the impact of ageing and deterioration on seismic vulnerability of bridges through time-dependent seismic fragility analysis. Choe et al. (2009) estimated seismic fragility of RC bridges with a probabilistic model for time-dependent chloride-induced corrosion. Zhong et al. (2009) proposed a method to estimate the seismic fragility of corroding RC bridges considering probabilistic models for chloride-induced corrosion and time-dependent corrosion rate. Biondini et al. (2013) predicted the lifetime seismic performance of concrete bridges exposed to corrosion by means of probabilistic time-variant nonlinear static analyses of the structural system.
In the case of building structures, Pitilakis et al. (2013) evaluated the seismic vulnerability of RC buildings considering the SSI and ageing effects due to rebar corrosion by two-dimensional nonlinear dynamic analyses. Inci et al. (2012) investigated the effects of reinforcement corrosion on the seismic performance of RC frame buildings by pushover and nonlinear time-history analyses. Yalciner et al. (2012) predicted time-dependent seismic performance of a single-degree-of-freedom frame subject to corrosion using nonlinear incremental dynamic analysis (IDA).
In general, for concrete structures, damage scenarios are more critical for pile-supported wharves than buildings and bridges, since the structure is directly exposed to the severe aggressive marine environment. However, up to now, no investigation has been offered for evaluating the impact of corrosion on the seismic vulnerability of pile-supported wharves.
In this respect, this study investigates the seismic vulnerability of a corroded pile-supported wharf using fragility curves. The considered corrosion includes corrosion of the steel reinforcement in RC piles due to chloride attack. Piles are one of the most corrosion-vulnerable elements in wharves whose failure can have calamitous consequences. In fact, corrosion has two major effects on the piles. First, this corrosion leads to decrease effective cross-sectional area of longitudinal bars and subsequently reduction in strength of wharf piles and causes a more vulnerable structure. Second, for the regions where specified amounts of confinement are required for appropriate performance of concrete members such as the regions where plastic hinges are expected to form under seismic excitations, corrosion of transverse reinforcement can become a serious problem. Actually, lifetime reduction in both strength and displacement ductility because of corrosion leads to decline in the dissipative capacity of these critical zones and thus increases the vulnerability of the structure.
With the deterioration and seismic vulnerability of pile-supported wharf structures, repair and retrofit are important issues to enhance their performance. Repair and retrofit of deteriorated concrete structures are necessary not only to their operation for predestined service life but also to insure the safety and serviceability of the associated components (Maslehuddin et al., 2005). The repair methods can be generally characterized as protective coating, electro-chemical methods and using the same materials (wood, concrete and steel) used in original construction. In addition, there are a great variety of seismic retrofitting techniques ranging from increasing the capacity of the structures to reducing demands.
Advanced composite material in the form of externally bonded fibre-reinforced polymer (FRP) is a kind of retrofit and repair technique that has recently attracted attentions. Several factors including lightweight, high-strength, high-elastic moduli, no need to shut down structure during installation and resistance to chemicals participate in the increase in the use of FRP in retrofitting and repairing of RC structures. The application of FRP for piles serves two purposes:
As a corrosion repair method. Since fibres can be oriented in any direction, they can provide strength in required direction and this makes FRP an appropriate candidate for repair of corroded RC piles. Besides, there are some benefits in repairing these piles using FRP. First, FRP wraps act as a diffusion barrier to further ingress of chloride, water and oxygen into the concrete and thus reduce the corrosion activity and steel rebar corrosion (Debaiky et al., 2002). Second, confining pressure of FRP wrapping restrains the dispersion of corrosion products generated and thus suppresses the corrosion reaction (Hearn and Aiello, 1998; Lee et al., 2000).
As a retrofit measure. For many cases in which inadequate lateral reinforcement has been observed, the use of FRP jacketing causes considerable enhancement in confining action and consequently significant improvement in strength and ductility of the section. Therefore, FRP jacketing can restore lost flexural capacity due to steel corrosion.
According to the fibre used, FRP may be categorized as carbon fibre–reinforced polymer (CFRP), glass fibre–reinforced polymer (GFRP), and aramid fibre–reinforced polymer (AFRP). CFRP composite material possesses several advantages over GFRP and AFRP such as less susceptibility to absorbed moisture, effectiveness in shear and flexural retrofit, ease to handle and apply, and higher modulus of elasticity. The other advantage of CFRP is lower corrosion rate in wrapped piles than GFRP (Suh et al., 2005).
Considering the above, in this study, CFRP jacketing is selected as the retrofit and repair measure. Performance of CFRP in corrosion protection or mitigation has been investigated experimentally in a large number of previous studies. Some of the benefits of CFRP which is investigated in the literature review are mentioned below:
CFRP wrap of corroded beams decreased corrosion expansion by 65%–70% and actual steel loss was reduced by 33%–35% (Badawi and Soudki, 2005).
CFRP wrap increased the service life of reinforced cylinders by 1.4–3.4 times comparing to unwrapped ones (Wootton et al., 2003).
The corrosion rate was significantly decreased by 50% after CFRP repair due to deficiency of oxygen and moisture (Lee et al., 2000).
The performance of CFRP jacketing, as a retrofit method, is also studied in numerous investigations. Xiao and Wu (2000) investigated the effect of CFRP in the performance of 27 concrete cylinders. They founded that the carbon fibre composite jacketing can significantly increase the compressive strength and ductility of concrete. Elgawady et al. (2009) performed experimental investigation on bridge column wrapped with CFRP. The results showed that CFRP jacket improved displacement ductility, energy dissipation and equivalent viscous damping. Haroun and Elsanadedy (2005) retrofitted RC bridge column with inadequate lap-splice length using FRP composite. The results showed improvement in column’s seismic performance. They found that composite jackets did not change the lateral stiffness of columns and subsequently dynamic properties of the bridge will not be altered.
In this study, the impact of lifetime exposure to chlorides from marine environment on the seismic performance of typical pile-supported wharves is investigated using fragility curves and then impact of CFRP jacketing on the seismic vulnerability is assessed. In this respect, 3D numerical models involving initial (t = 0 years), corroded (t = 25, 50, 75 years) and CFRP-retrofitted-corroded (t = 25, 50, 75 years) RC pile-supported wharves are developed using finite element software. Pushover analysis is performed to obtain the capacity curve of the models and establish quantitative criteria for bound of damage states. In order to evaluate the response of models, a nonlinear static analysis called capacity spectrum method (CSM) proposed by ATC-40 (1996) is done. Then, based on response values and damage criteria, seismic fragility analysis is executed to investigate the vulnerability of corroded and retrofitted structures. The impact of ageing and the efficiency of the retrofit measure on the wharf vulnerability can be evaluated through comparing their fragility curves.
Description of selected pile-supported wharf
A pile-supported wharf consists of a deck supported by a number of vertical or batter pile beneath it. In this study, the selected model is a vertical pile-supported wharf from Iran southern ports. The wharf deck is made of RC with thickness of 0.5 m supported by pre-stressed vertical piles. The piles have circular sections with a diameter of 0.5 m and their embedded length is variable, increasing from landside to seaside. Transverse section and schematic view of the wharf are shown in Figure 1.
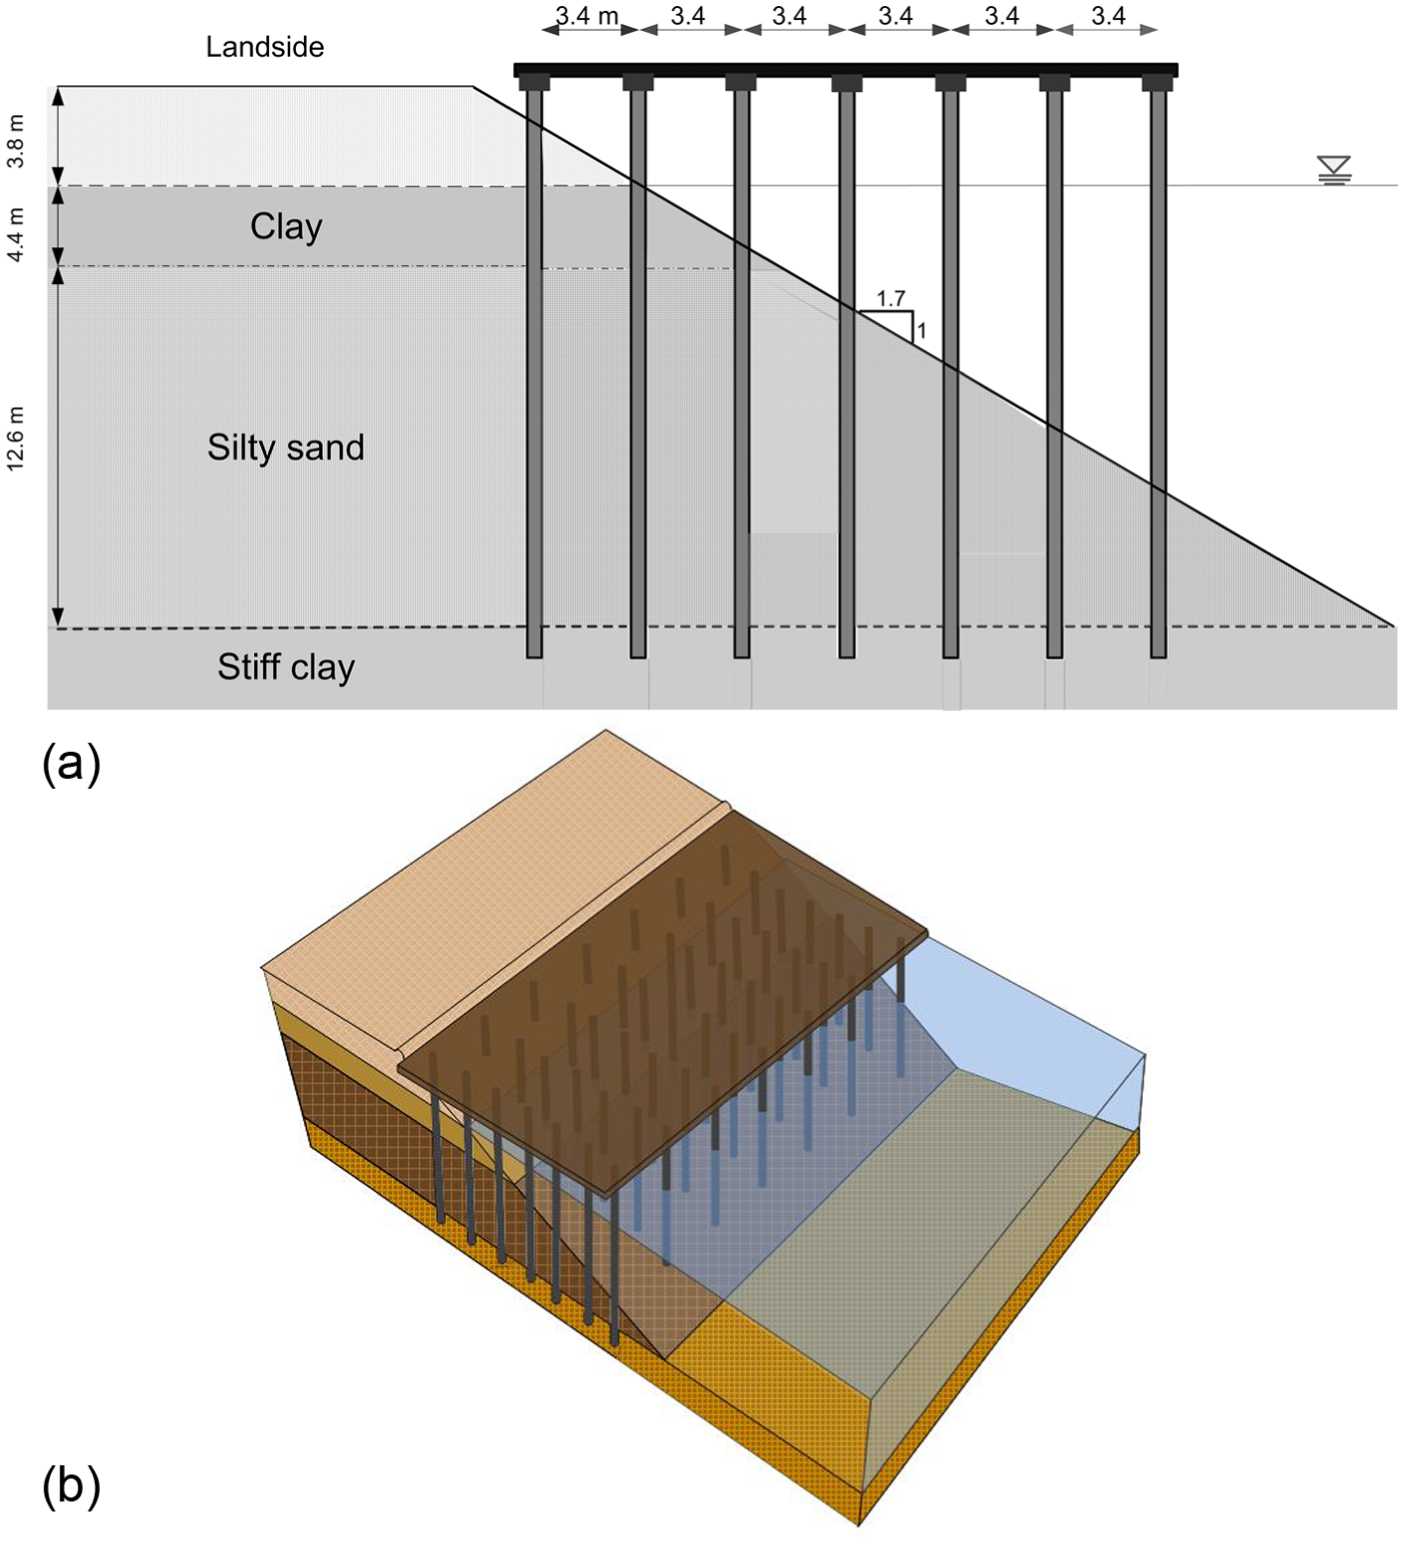
Schematic diagram of the selected pile-supported wharf: (a) cross section and (b) schematic view of the wharf.
Finite element modelling of the wharf
In this study, 3D numerical model is made to evaluate the seismic response of the desirable pile-supported wharf using the SAP2000 software (Computers Structures Inc., 2004). In the following, the numerical modelling detail of models in SAP2000 is described.
The deck of the wharf is made of RC with 35 MPa strength and it is modelled by shell elements. All the piles have circular section with 0.5 m diameter and are modelled by frame elements which are rigidly connected to the wharf.
In order to simulate the nonlinear behaviour of the piles, plastic hinge model is used. Since the locations of plastic zones are unclear before the analysis, the distributed plastic hinge model (Chiou et al., 2009) is used in this study. As shown in Figure 2, this model distributes a series of plastic hinges along the potential plastic zones and thus can effectively trace the propagation of plasticity in the pile during loading application. The properties of plastic hinges are based on the pile moment curvature analysis.
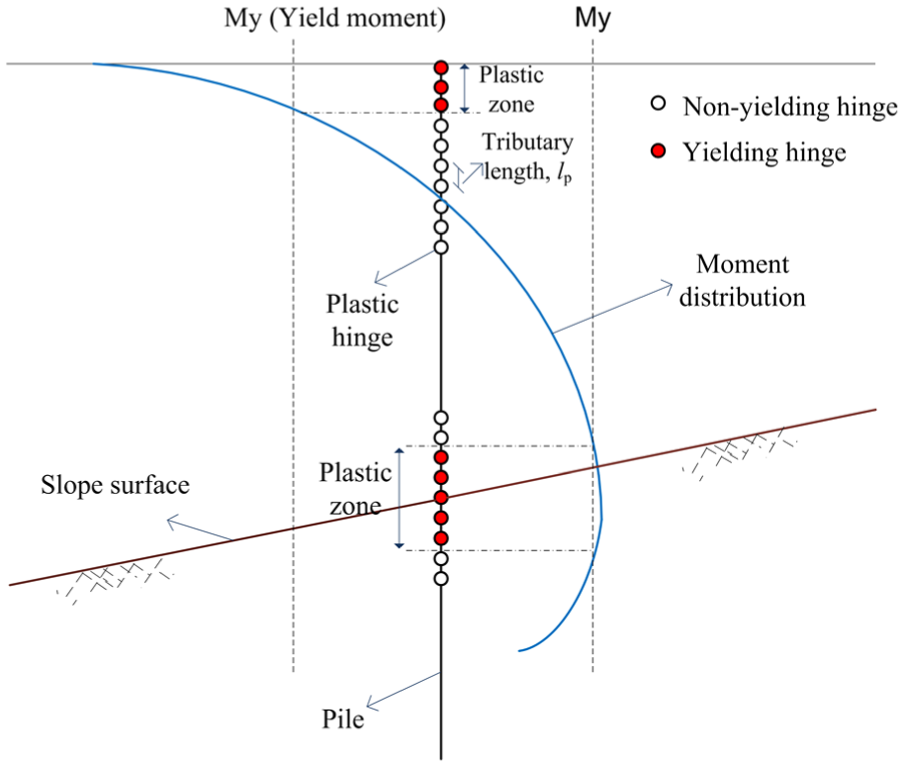
Distributed plastic hinge model (Chiou et al., 2009).
SSI inherently influences the seismic response of the wharf. Hence, pile–soil interaction is modelled by Winkler beam model. The soil is modelled by p-y and t-z spring elements with nonlinear load–displacement relationships. p-y and t-z springs are used to model normal and shear behaviour, respectively. Based on the soil properties of each layer (Table 1), p-y and t-z curves are derived from the American Petroleum Institute (API, 1987) method. These springs should be at sufficiently close spacing so that the pile deformation relative to the soil would be more precise. Therefore, they are assigned at every 1.0–1.5 m in depth from the soil surface.
Geotechnical properties of different soil layers considered in this study.

Figure 3 shows the 3D numerical model of the selected pile-supported wharf in the program SAP2000. In this study, several models involve initial (t = 0 years), corroded (t = 25, 50, 75 years) and CFRP-retrofitted-corroded (t = 25, 50, 75 years) are constructed.
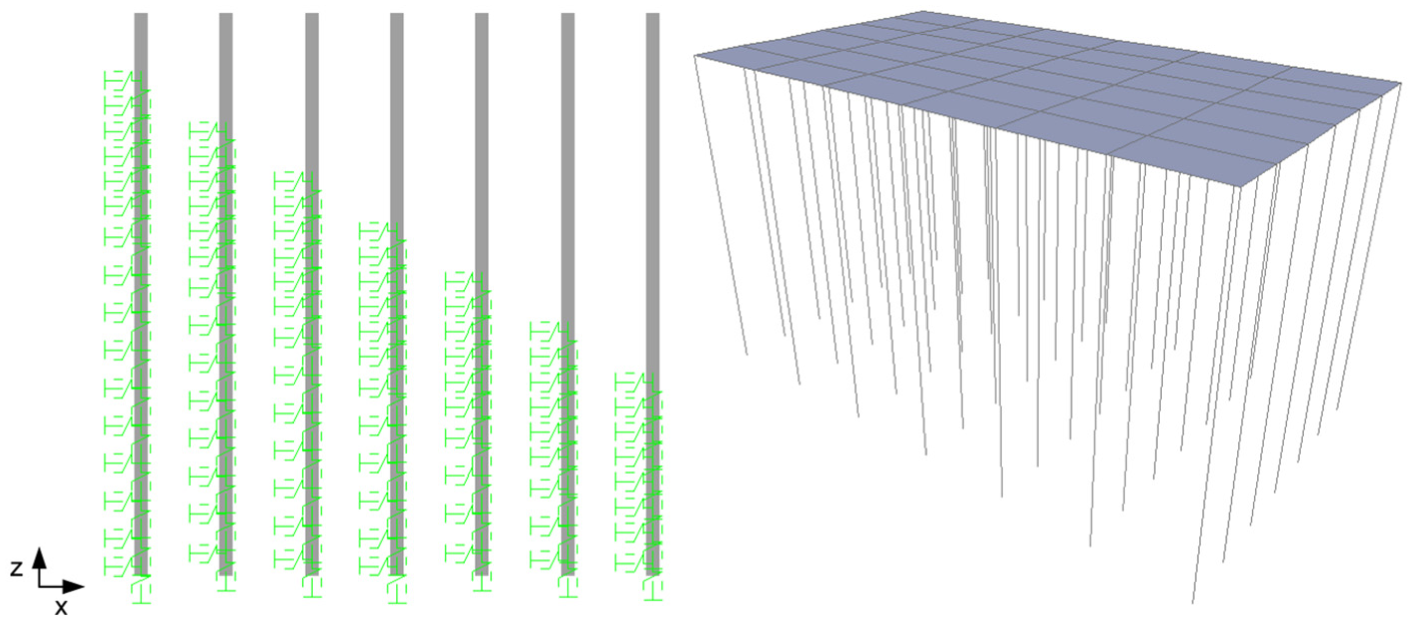
Numerical model of the wharf.
For the corroded models, the loss of steel area due to corrosion of RC piles is modelled as reduction in reinforcement bar cross-sectional area as compared to the prime piles in the finite element models. This corrosion degrades the pile capacity and plastic hinges properties. In the retrofitted models, the impact of FRP is considered as enhancement of concrete stress–strain model and thus improvement in the pile capacity and plastic hinges properties.
Wharf deterioration model
Along the structure’s service life, the element’s strength may degrade. This time-variant characteristic depends on several factors such as corrosion, erosion, other forms of chemical deterioration and fatigue (Melchers and Frangopol, 2008). Corrosion is degradation of materials’ properties due to interactions with their environments that effectively increase their vulnerability.
Reinforcement corrosion due to chloride attack is the major reason of RC structures deterioration in marine environments. This kind of corrosion leads to decrease in diameter of the corroded reinforcement bars and subsequently reduction in strength of members and adverse effects on seismic performance of structures. If the chloride penetrates into the bulk of concrete, the alkali protective layer of reinforcement degrades and corrosion of the embedded steel bars initiates. With corrosion propagation, the corrosion products can expand more than six times of virgin reinforcement bar, which leads to cracking and spalling of concrete cover (Poulsen and Mejlbro, 2010). Among a number of chloride transport mechanisms in concrete, diffusion is the major mechanism in the absence of applied electrical field and stable moisture condition of concrete core. The ingress of chloride ions into RC structures represented by Fick’s second law of diffusion is as follows (Crank, 1975)

where C(x, t) is the chloride ion concentration, x is depth of concrete from the surface, t is time of exposure in years and D is diffusion coefficient.
For a semi-finite one-dimensional diffusion, the solution of above equation is (Crank, 1975)

where CS is the surface chloride concentration and erf is Gaussian error function.
The corrosion initiation time and mechanism of chloride penetration vary due to a large degree by the exposure conditions of RC structure in marine environment. In this respect, five exposure conditions can be specified according to the position of structural components in relation to seawater level, involving atmospheric, splash, tidal, submerged and soil zones (Figure 4).
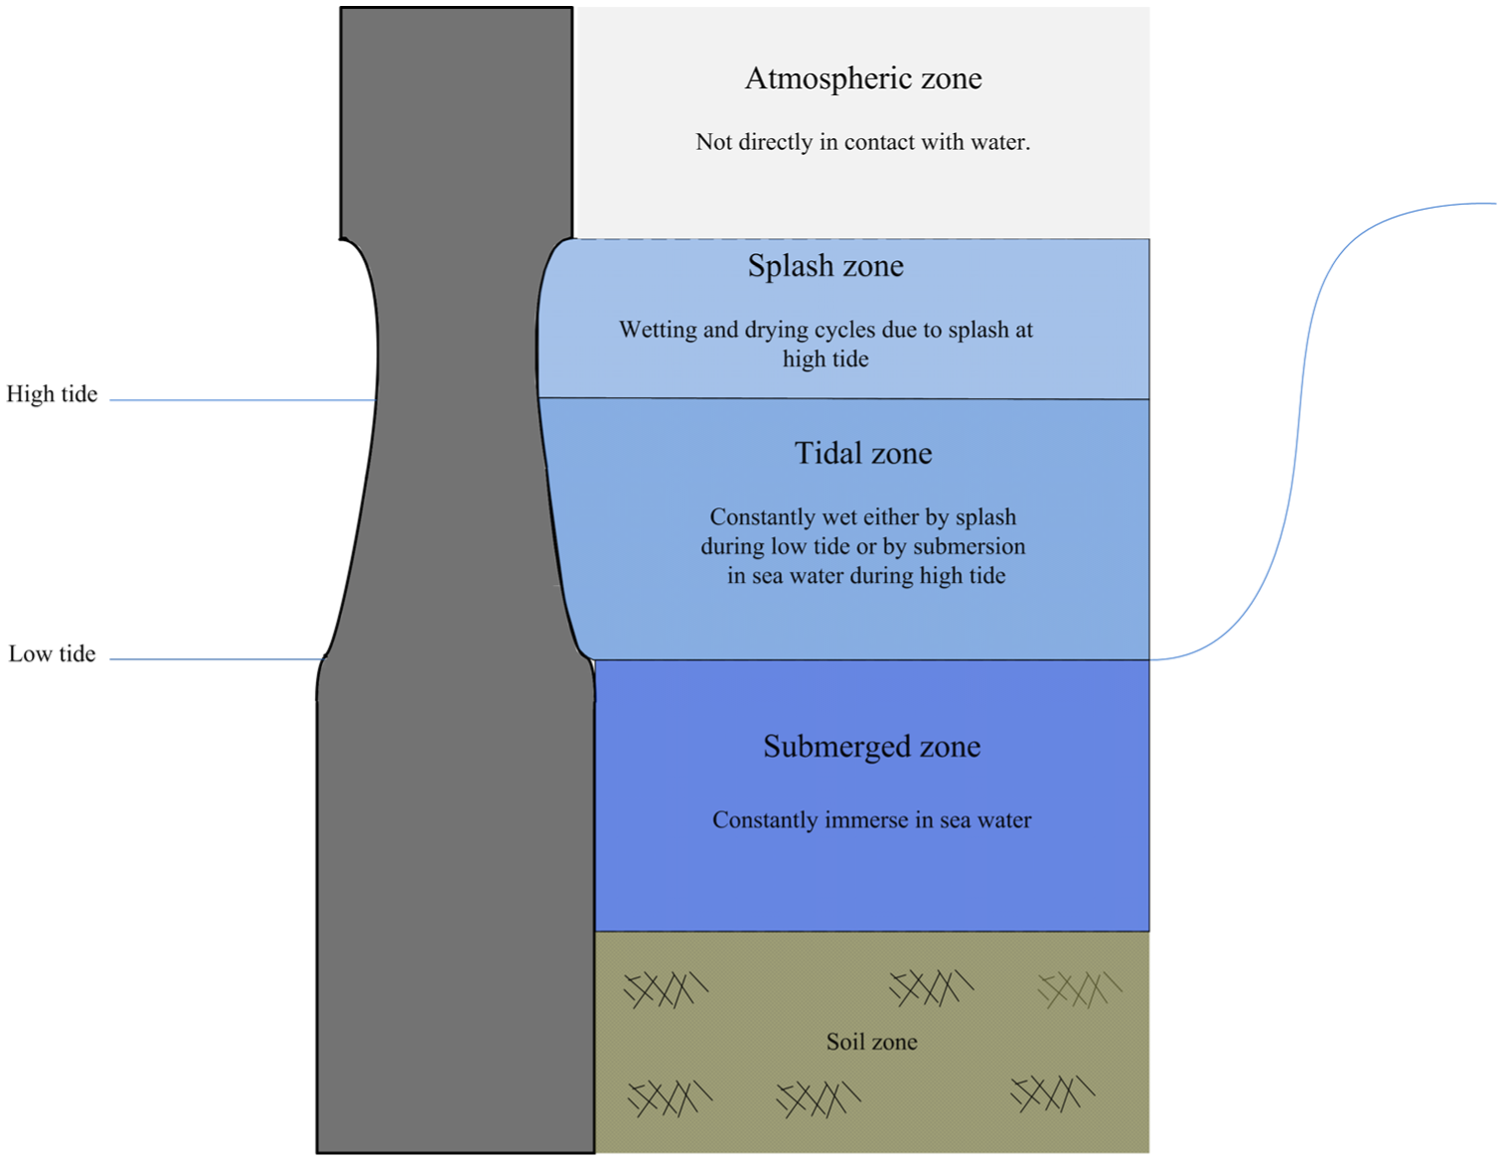
Schematically different exposure conditions.
Assuming the constant chloride ion concentration near concrete surface, the corrosion initiation time can be mathematically represented as (Thoft-Christensen et al., 1996)

where Ccr is the critical chloride content which depends on cover exposure condition, composition of concrete and so on. In this study, due to lack of enough experimental data, the value of Ccr referred to the weight of concrete is 0.05% which is the average value in the literature and this simplification is accepted as a conservative limiting assumption.
With continuation chloride penetration, when the alkali protective layer of reinforcement fades away, corrosion starts and the time-variant loss of reinforcement diameter is as follows (Enright and Frangopol, 1998)
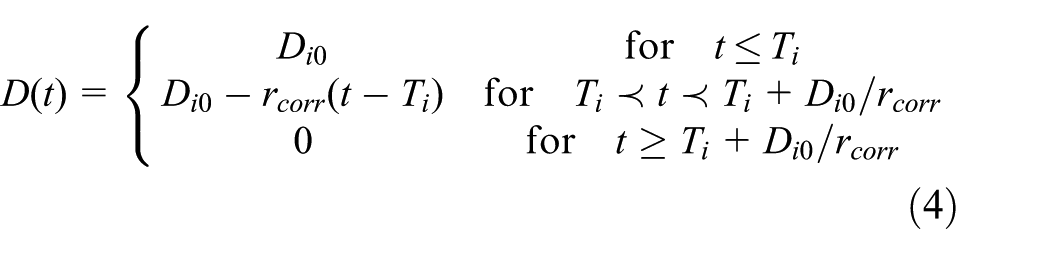
where Di0 is initial diameter of steel reinforcement bars, t is elapsed time (years) and rcorr is rate of corrosion which is time-dependent parameter depends on environmental condition (Vu and Stewart, 2000). If the diameters and corrosion initiation time of all reinforcement bars are similar, the time-dependent area of steel can be represented as

where n is number of bars.
In fact, the corrosive speed of reinforcement is different during various deteriorated stages. Since there is not enough information for time-dependent corrosion rate (specially for Persian Gulf region), the rate of corrosion in this study assumed to be constant on average along the service life of the pile-supported wharf structure. It should be noted that this is common and accepted assumption which was used in the previous studies (Akgül and Frangopol, 2004; Frangopol et al., 1997; Ghosh and Padgett, 2010; Liu, 2005; Val et al., 2000). The values of this parameter are obtained from the Iranian Guidelines for Design of Ports and Marine Structures (2013).
For this study, a pile-supported wharf, located on the Persian Gulf region, is selected. Severe climatic condition, high amounts of chloride ions than other marine environments have made Persian Gulf one of the most aggressive environments for durability of RC structures. In the last couple of decades, many RC structures deteriorate, mainly due to the chloride-induced corrosion of reinforcement. Shekarchi and Moradi (2007) investigated the durability of concrete structures in Persian Gulf by means of DuraPGulf software. Ghods et al. (2005) experimentally investigated the effect of various exposure conditions on the diffusion of chloride ions into concrete in Persian Gulf region. Safehian and Ramezanianpour (2013) evaluated the basic parameters in long-term chloride penetration in Persian Gulf region.
In this study, corrosion of steel reinforcements in RC piles due to chloride attack is considered. This corrosion leads to decrease in diameter of the corroded reinforcement bars and consequently decrement in strength capacity of wharf piles.
Table 2 shows the values of surface chloride concentration CS and diffusion coefficient Dc for atmospheric, tidal and splash zones after 3 months of exposure in seawater at Persian Gulf. These values are based on the previous study which is done for the region of the selected wharf (Ghods et al., 2005). In addition, the considered rate of corrosion (rcorr) is illustrated in Table 2.
Values of CS, Dc and rcorr used in this study (Ghods et al., 2005; Iranian Guidelines for Design of Ports and Marine Structures, 2013).

It should be noted, in this study, corrosion scenarios are developed for all the mentioned zones in Table 2.
In order to obtain the corrosion initiation time for atmospheric, tidal and splash zone, DuraPGulf software available from the Building Material Institute of Tehran University (Shekarchi et al., 2008) has been used.
Figure 5 illustrates the resulting time-variant area of the pile reinforcement for the tidal and splash zones. This figure shows the cross-sectional area reduction in reinforcement during lifetime. According to this figure, after 50 years of exposure to chlorides, the cross-sectional areas of reinforcement for the tidal and splash zones are equal to 54% and 41% of the prime ones, respectively. This result illustrates the importance of the considering the severity of the environmental exposure on the piles behaviour.
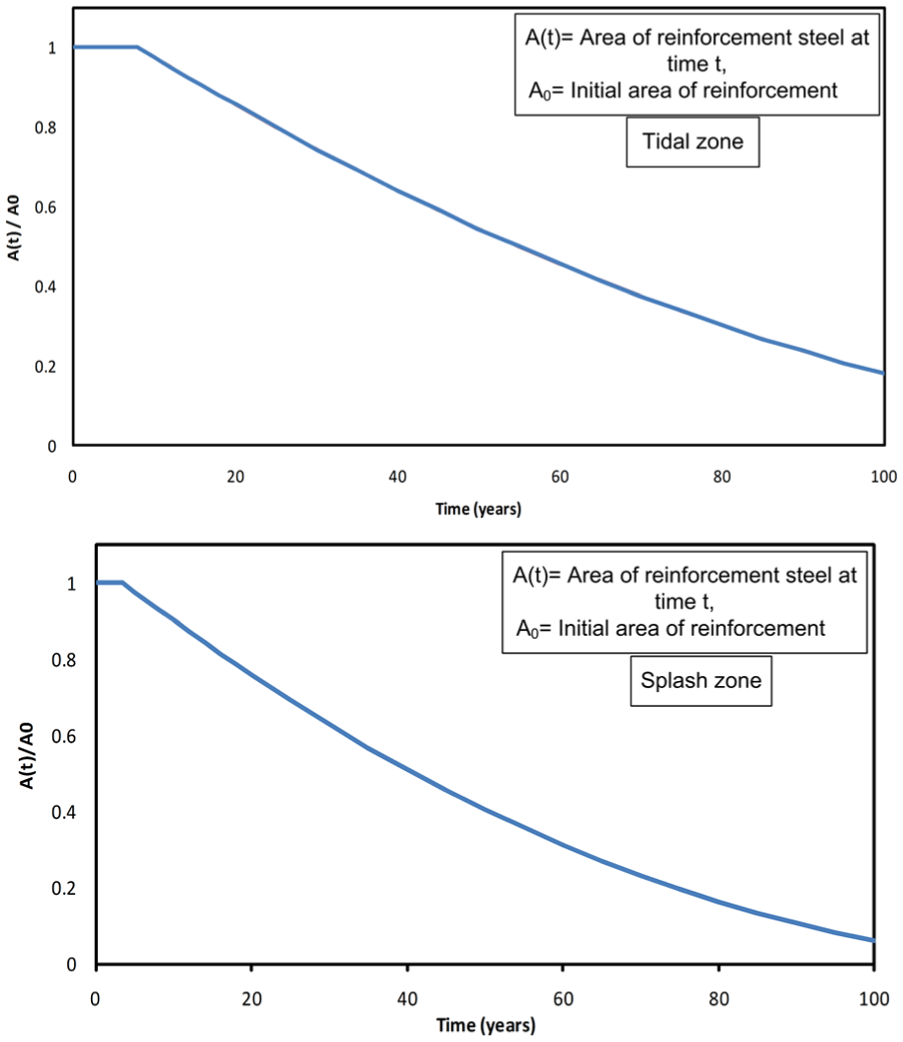
Time-variant area of the pile reinforcement for the tidal and splash zones.
Retrofit and repair method
One of the major causes for the structural deficiencies is insufficient lateral reinforcement which has been observed in many cases. To deal with the problem, existing retrofitting technique target is increasing the confinement operation in either the potential plastic hinge regions or over the entire member. FRP jacketing is one of the measures which increases confining action and leads to enhancement in the compressive strength and effective ultimate compressive strain and reduction in (Figure 6) and thus restores the strength capacity of corroded section. Furthermore, confining pressure of FRP wrapping reduces the corrosion activity and steel rebar corrosion.
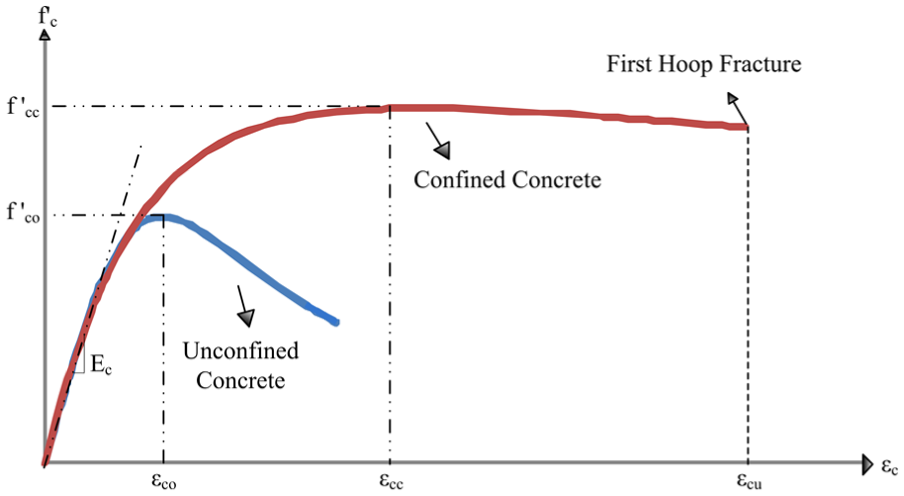
Effect of confining action on stress–strain model of concrete.
Over the last two decades, a great number of experimental and analytical investigations have been performed to model the compressive behaviour of FRP-confined concrete. In this study, the stress–strain model of FRP-confined concrete proposed by Spoelstra and Monti (1999) is used. For confined concrete which is only confined by transverse reinforcement, stress–strain model proposed by Priestley (1996) is considered.
About the applicability of CFRP in unfavourable conditions like underwater conditions, it should be acknowledged that although dry conditions are favourable, but availability of resins that can cure in water has made it possible to use FRPs even for underwater repair of corrosion damaged piles. Although underwater FRP repair technology is very new and is under developed, there are researches in the literature that acknowledge the feasibility of conducting underwater FRP repairs as well as its well-performing protection action (Kim et al., 2009; Mullins et al., 2005; Seica and Packer, 2007; Sen and Mullins, 2007; Winters et al., 2008).
Impact of corrosion and CFRP on the seismic response of RC piles
Strength and ductility of structural member are time-variant properties which influence the seismic response of wharf structures. Generally, decrease in steel reinforcement amount due to corrosion leads to strictly reduction in moment capacity of piles, while the ultimate curvature increases. This phenomenon is shown in Figure 7, which displays that ultimate curvature of corroded pile (t = 50 years) is higher than the prime pile (t = 0 years). In addition, a 45% decrease in the ultimate moments of corroded (t = 50) pile is illustrated as compared to that of prime (t = 0 years) pile; therefore, due to decrease in the moment and curvature capacity of the pile, plastic hinge formation takes place for lower levels of displacement because of steel reinforcement area reduction in corroded member.

Moment–curvature analysis for initial (t = 0 years), corroded (t = 50 years) and retrofitted section.
Increasing the confining action due to wrapping of piles with CFRP causes significant enhancement in the compressive strength and effective ultimate compressive strain and consequently ductility capacity enhancement of the concrete section. Following Figure 7, CFRP retrofitted of corrosion (t = 50 years) section gives a much better performance than corroded (t = 50 years) section by 1.66 times based on ultimate moment and 1.42 times at the ultimate curvature.
Types of analysis
Two kinds of analyses are applied for fragility analysis of the pile-supported wharf, including a static pushover analysis and an analysis method for seismic response estimation.
Pushover analysis
Pushover analysis is performed in order to evaluate the capacity curve of models and establish quantitative criteria for bound of damage states using its results. In this analysis, the yield sequence of the structure and transition from elastic behaviour to the state of failure can also be observed.
In order to deduce the capacity curve, the modal analysis is conducted first to obtain the first mode of the wharf. Afterwards, in order to model the inertial loads on the piles and the deck, the horizontal loads are imposed in proportion to the first mode shape of the selected wharf as follows (Applied Technology Council (ATC), 1996; Chiou et al., 2011)
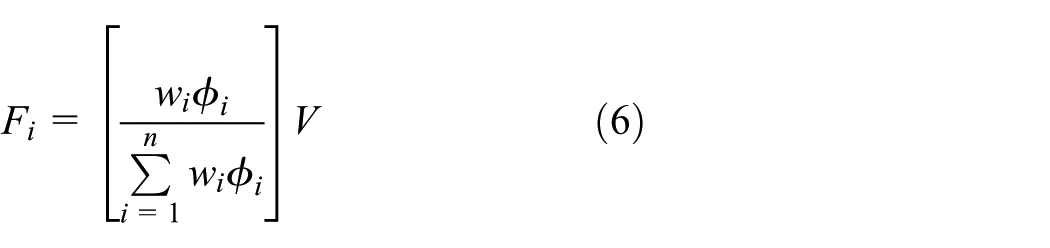
where Fi is the lateral force on node i, n is the node number, wi is dead weight of node i, ϕi is the amplitude at node i for the first mode and V is total lateral force.
Centre of the deck is selected as the monitored point. Increasing the horizontal loads stepwise, the corresponding deck displacements are found in each step and consequently the capacity curve in terms of the total lateral force versus deck displacement is obtained.
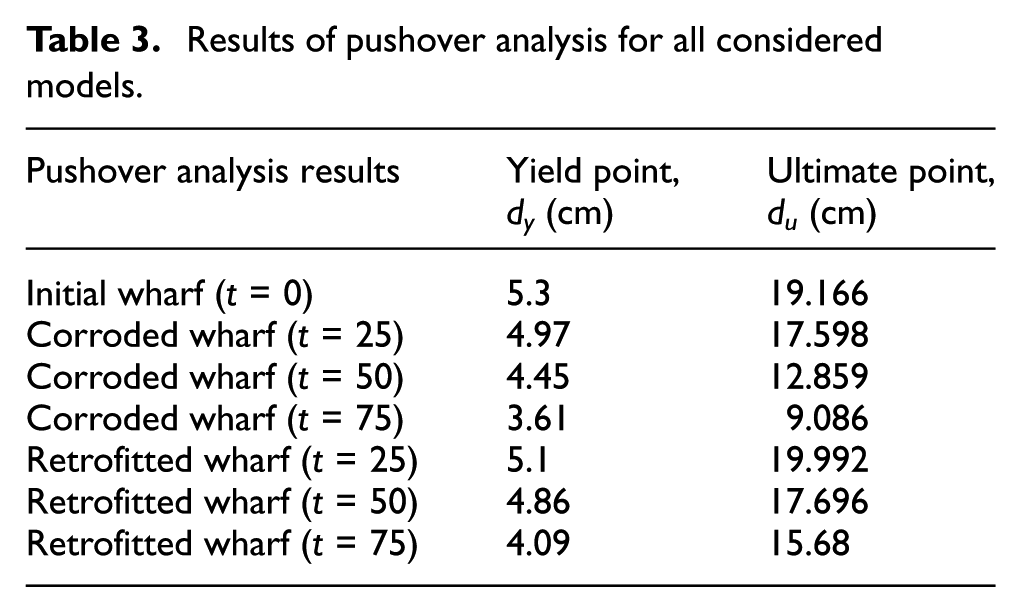
On the capacity curve, two points can be identified: dy and du. The yield displacement (dy) is the displacement in which the wharf structure yields. It is defined as the intersection of the elastic and post-yield branches of the bilinear approximation of capacity curve which is based on the equal energy approach. Ultimate lateral displacement (du) refers to the displacement that double plastic hinges are formed in the first pile. Table 3 shows the yield and ultimate points of all models.
Results of pushover analysis for all considered models.
Analysis method for seismic response estimation
There are different methods to calculate the seismic response of a structure, including static or dynamic methods. The CSM proposed by ATC-40 (1996) is adopted here to evaluate the seismic response of structure. This method is a nonlinear static procedure which previously has been used for fragility analysis of pile-supported wharves (Chiou et al., 2011; Wang et al., 2011). In this method, the performance point referred to the maximum seismic response of the structure to the earthquake event. This point is determined by means of capacity curve and elastic response spectrum curve. Therefore, the elastic response spectra, which is a representation of Sa versus T, and the capacity curve, which is in the term of base shear-roof displacement, should be converted to the same coordinate system. This same coordinate system is called acceleration displacement response spectrum (ADRS) format which is in the form of spectral acceleration (Sa) versus spectral displacement (Sd). Therefore, elastic response spectrum and capacity curve change to demand spectrum curve and capacity spectrum curve, respectively.
In order to account nonlinear inelastic behaviour of the structural system, a modifying factor, which is less than one, is used to reduce the demand spectrum curve. This modifying factor is the function of effective viscous damping which includes the both viscose and hysteretic damping. The intersection of the reduced demand spectrum and capacity spectrum curve gives the performance point of structure under the earthquake event. Since the effective damping is depended on the structure displacement and the location of performance point is not specified formerly, iteration process with trials and errors is needed to ascertain the performance point. Figure 8 schematically shows the performance point of a structure.

Graphical illustration of the capacity spectrum method (CSM).
Seismic input motions
The seismic response of a structure highly depends on the ground motion records used as seismic excitation. Therefore, appropriate selection of representative time-history records is one of the important steps for vulnerability assessment of a structural system. These are better to represent the characteristics of the possible seismic hazards related to the considering site and their associated uncertainties. Therefore, it is preferred to apply real accelerograms from nearby seismic stations. Furthermore, selected earthquake records should have site conditions same as or consistent with the site conditions of the structure.
For more reliable performance assessment of the structures, a sufficient number of earthquake records (minimum = 7; ATC, 1996; Bommer et al., 2003) must be applied to the structure.
Under the above considerations, in this study, eight sets of earthquake records which represent a broad range of possible earthquakes scenarios in terms of peak ground acceleration (PGA) are selected. The earthquake records are selected from past earthquakes that occurred in Iran. Characteristics of all ground motions including occurrence time, magnitude, distance and PGA are provided in Table 4.
Details of the ground motion records.
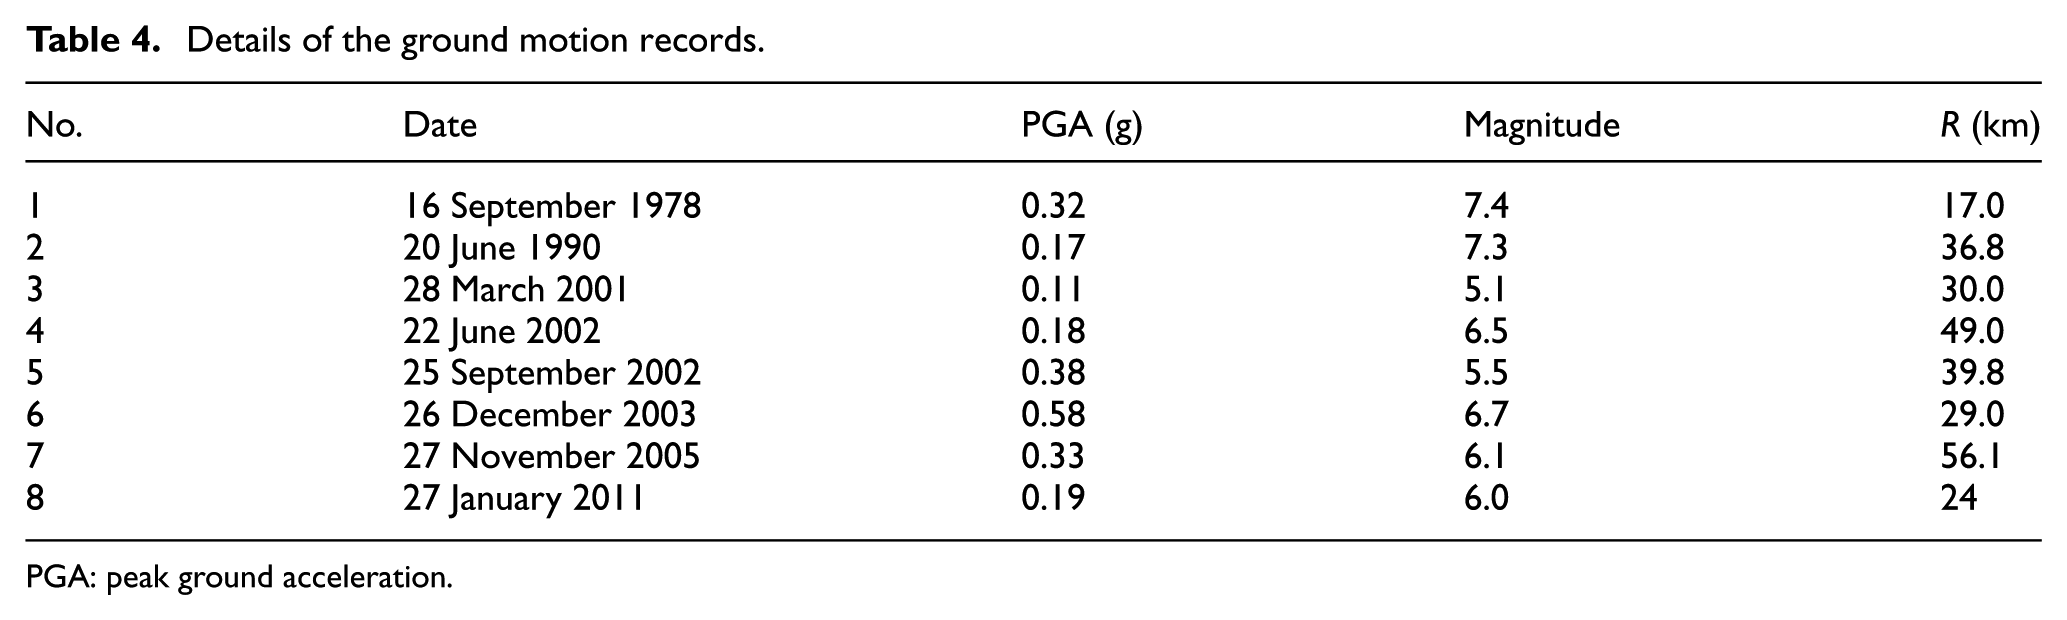
PGA: peak ground acceleration.
To generate the input acceleration–time histories for application in structural model, all time-history records, listed in Table 4, were deconvoluted to the base of the model using SHAKE91 deconvolution analysis (http://nisee.berkeley.edu/elibrary/Software/SHAKE91ZIP).
In this study, PGA is selected as IM which was used previously for fragility analysis of bridges (Ghosh and Padgett, 2010; Pang et al., 2014; Sung and Su, 2009) and pile-supported wharves (Chiou et al., 2011; Na et al., 2009; Wang et al., 2011).
In order to apply CSM, each record is scaled to 10 PGA levels ranging from 0.1 to 1.0 g. For each scaled record, CSM is performed to obtain the performance points. Collecting all the performance points for all the records leads to N × M response matrix in which N is number of records and M is number of scaled levels. This response matrix is basis of the fragility curves derivation.
Fragility analysis
Methodology
In general, seismic fragility curves illustrate the conditional probability of exceeding structural damage upon ground motion intensity. This emerging powerful analysis can provide understanding on seismic vulnerability of structures.
Analytical and empirical are two kinds of fragility curves based on the generation method (Shinozuka et al., 2000). Empirical fragility curves are produced using experimental results or damage data attained from field observations. Analytical fragility curves are based on the seismic response resulted from numerical simulations of the structure under a suite of earthquake records. In this study, seismic vulnerability assessment has been performed by analytical fragility curves which are based on the methodology proposed by Shinozuka et al. (2000), where the fragility function is represented as a lognormal cumulative distribution function as

where Fi(D) is the conditional probability that the wharf has an exceeding structural damage from a predefined damage state i as a function of demand parameter, ‘D’; Φ(·) is the standard normal cumulative distribution function; and α and β are the median value and the lognormal standard deviation, respectively.
Damage states
One of the momentous steps for construction of fragility curves is proper quantitative definition of damage states. Two EDPs including displacement ductility factor (µd) and SPH are used in this study. In this respect, displacement ductility factor (µd) is chosen as a first EDP, following qualitative criteria presented at International Navigation Association (PIANC, 2001) which are based on the peak responses of the piles. As mentioned, quantitative values for bound of damage state are required. For this purpose, bounds of damage states proposed by Heidary-Torkamani et al. (2013a), which are based on the sequence of the plasticity development in the pushover procedure, are used in this study. Based on the proposed bounds of damage states, serviceable damage state is violated at µd = 1 corresponding to the yield point of wharf (dy) derived from pushover analysis. Near collapse damage state refers to ultimate point (du) obtained from pushover analysis. So, the bound of this damage state is defined as a ratio between ultimate displacement and yield displacement (i.e. µd = du/dy = µd,u). For repairable damage state, the average value of µd for serviceability and near collapse damage states is applied (i.e. µd = (1 + µd,u)/2). In summary, the bounds of µd corresponding to the damage states are represented in Table 5.
Bounds of damage states for displacement ductility factor (PIANC, 2001).

PIANC: International Navigation Association.
In each step of pushover analysis, SAP2000 program which has special option illustrates plastic hinges condition in their force–deformation curve. Therefore, second EDP is defined based on SPH in their force–deformation curve (Figure 9). In this respect, the values of displacement for the pushover curve, associated with points B, C, D and E are defined as bounds of slight, moderate, extensive and complete damage state, respectively (Wang et al., 2011). For example, slight damage state is referred to the displacement in the pushover curve at which a first hinge reaches point B in its force–deformation curve.

Force–deformation curve of a plastic hinge.
Fragility analysis
Based on the bounds of damage state and seismic response values resulted from CSM (i.e. response matrix), the seismic fragility of the damage state Di is the conditional probability of structural damage that exceeds the damage state Di at a certain PGA level as follows
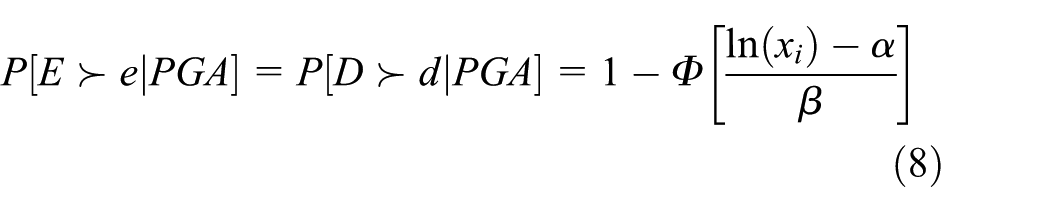


where Φ(·) is the standard normal cumulative distribution function, xi is the upper bound of each predefined damage states and α and β are two parameters of the lognormal distribution dependent on the PGA level. µ and σ are, respectively, the mean and standard deviation of seismic response values in each PGA level.
Figures 10 and 11 show the derived fragility curves of the initial (t = 0) and corroded (t = 25, 50, 75 years) pile-supported wharves for the EDP = µd and EDP = SPH, respectively, which illustrate the effect of reinforcement corrosion on seismic vulnerability of the structure. After that, the effect of CFRP jacketing on the fragility curves of t = 25 years, t = 50 and 75 years is illustrated in Figures 12 to 14, respectively.

Fragility curves for the initial (t = 0 years) and corroded (t = 25, 50, 75 years) scenario (EDP = µd).
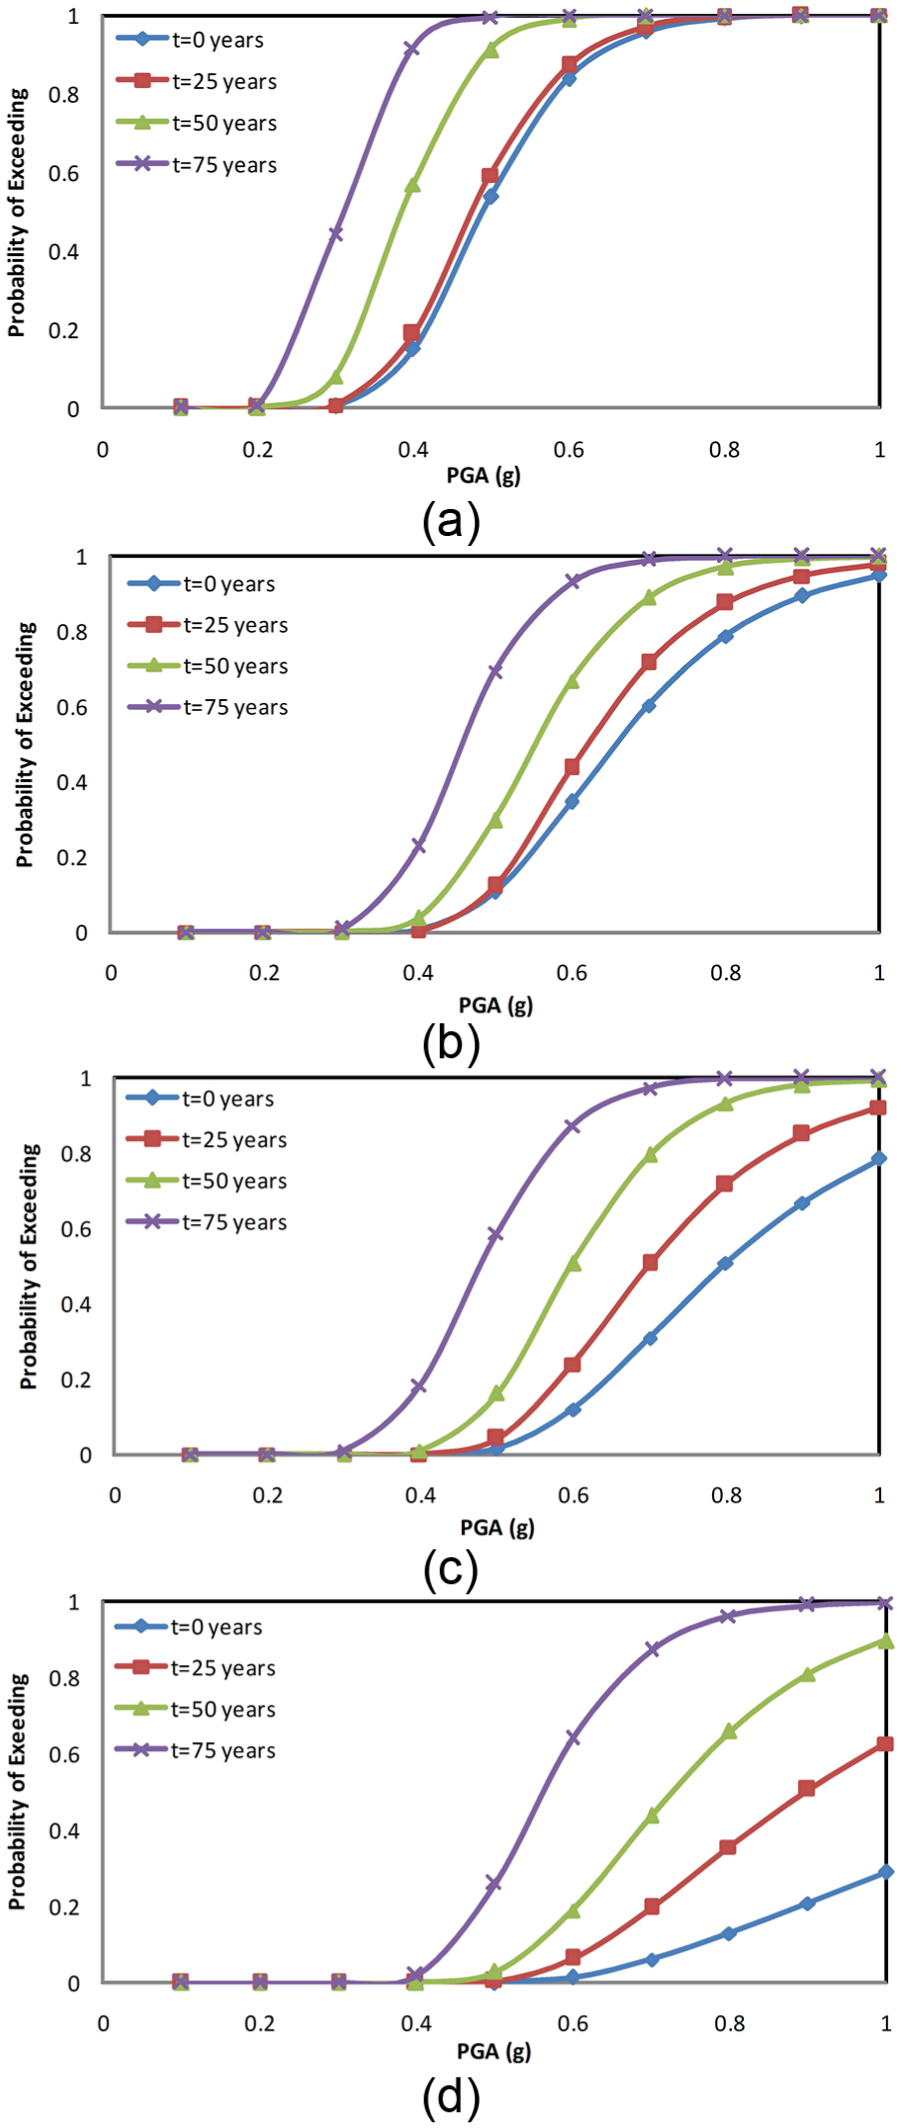
Fragility curves for the initial (t = 0 years) and corroded (t = 25, 50, 75 years) scenario (EDP = SPH): (a) slight damage state, (b) moderate damage state, (c) extensive damage state and (d) complete damage state.
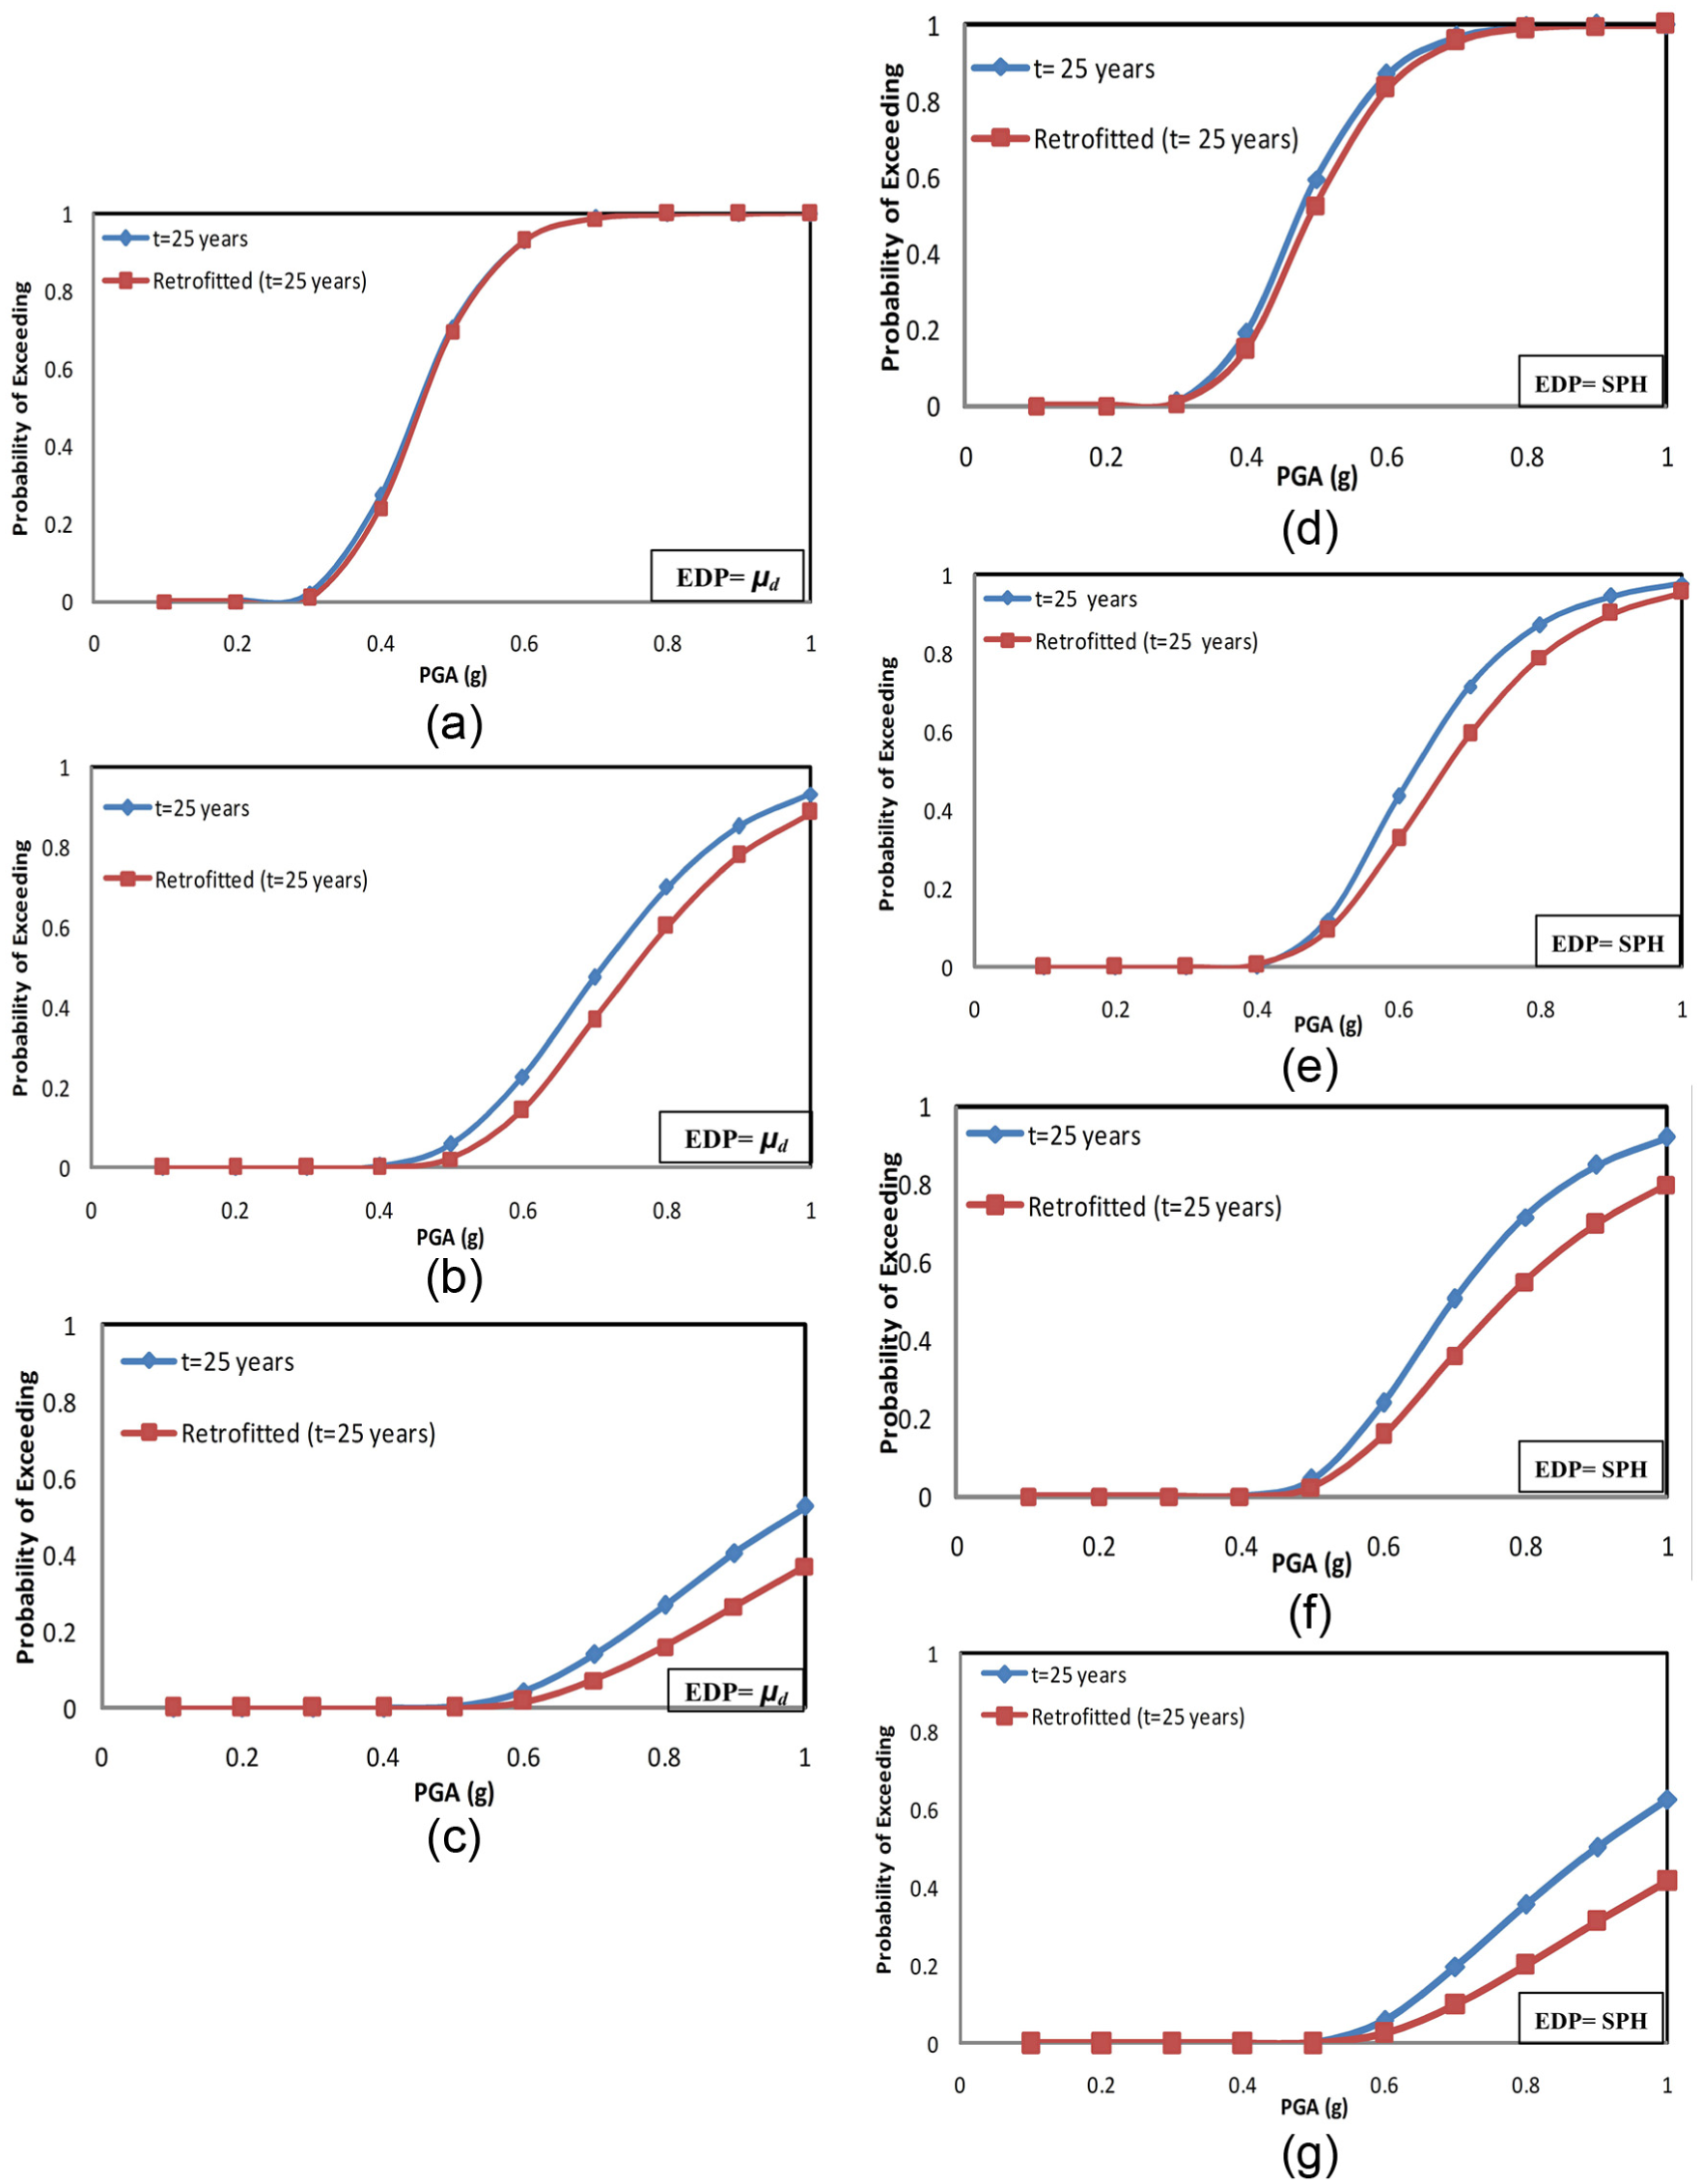
Fragility curves of corroded (t = 25 years) for different damage states: (a) serviceable damage state, (b) repairable damage state, (c) near collapse damage state, (d) slight damage state, (e) moderate damage state, (f) extensive damage state and (g) complete damage state.

Fragility curves of corroded (t = 50 years) for different damage states: (a) serviceable damage state, (b) repairable damage state, (c) near collapse damage state, (d) slight damage state, (e) moderate damage state, (f) extensive damage state and (g) complete damage state.
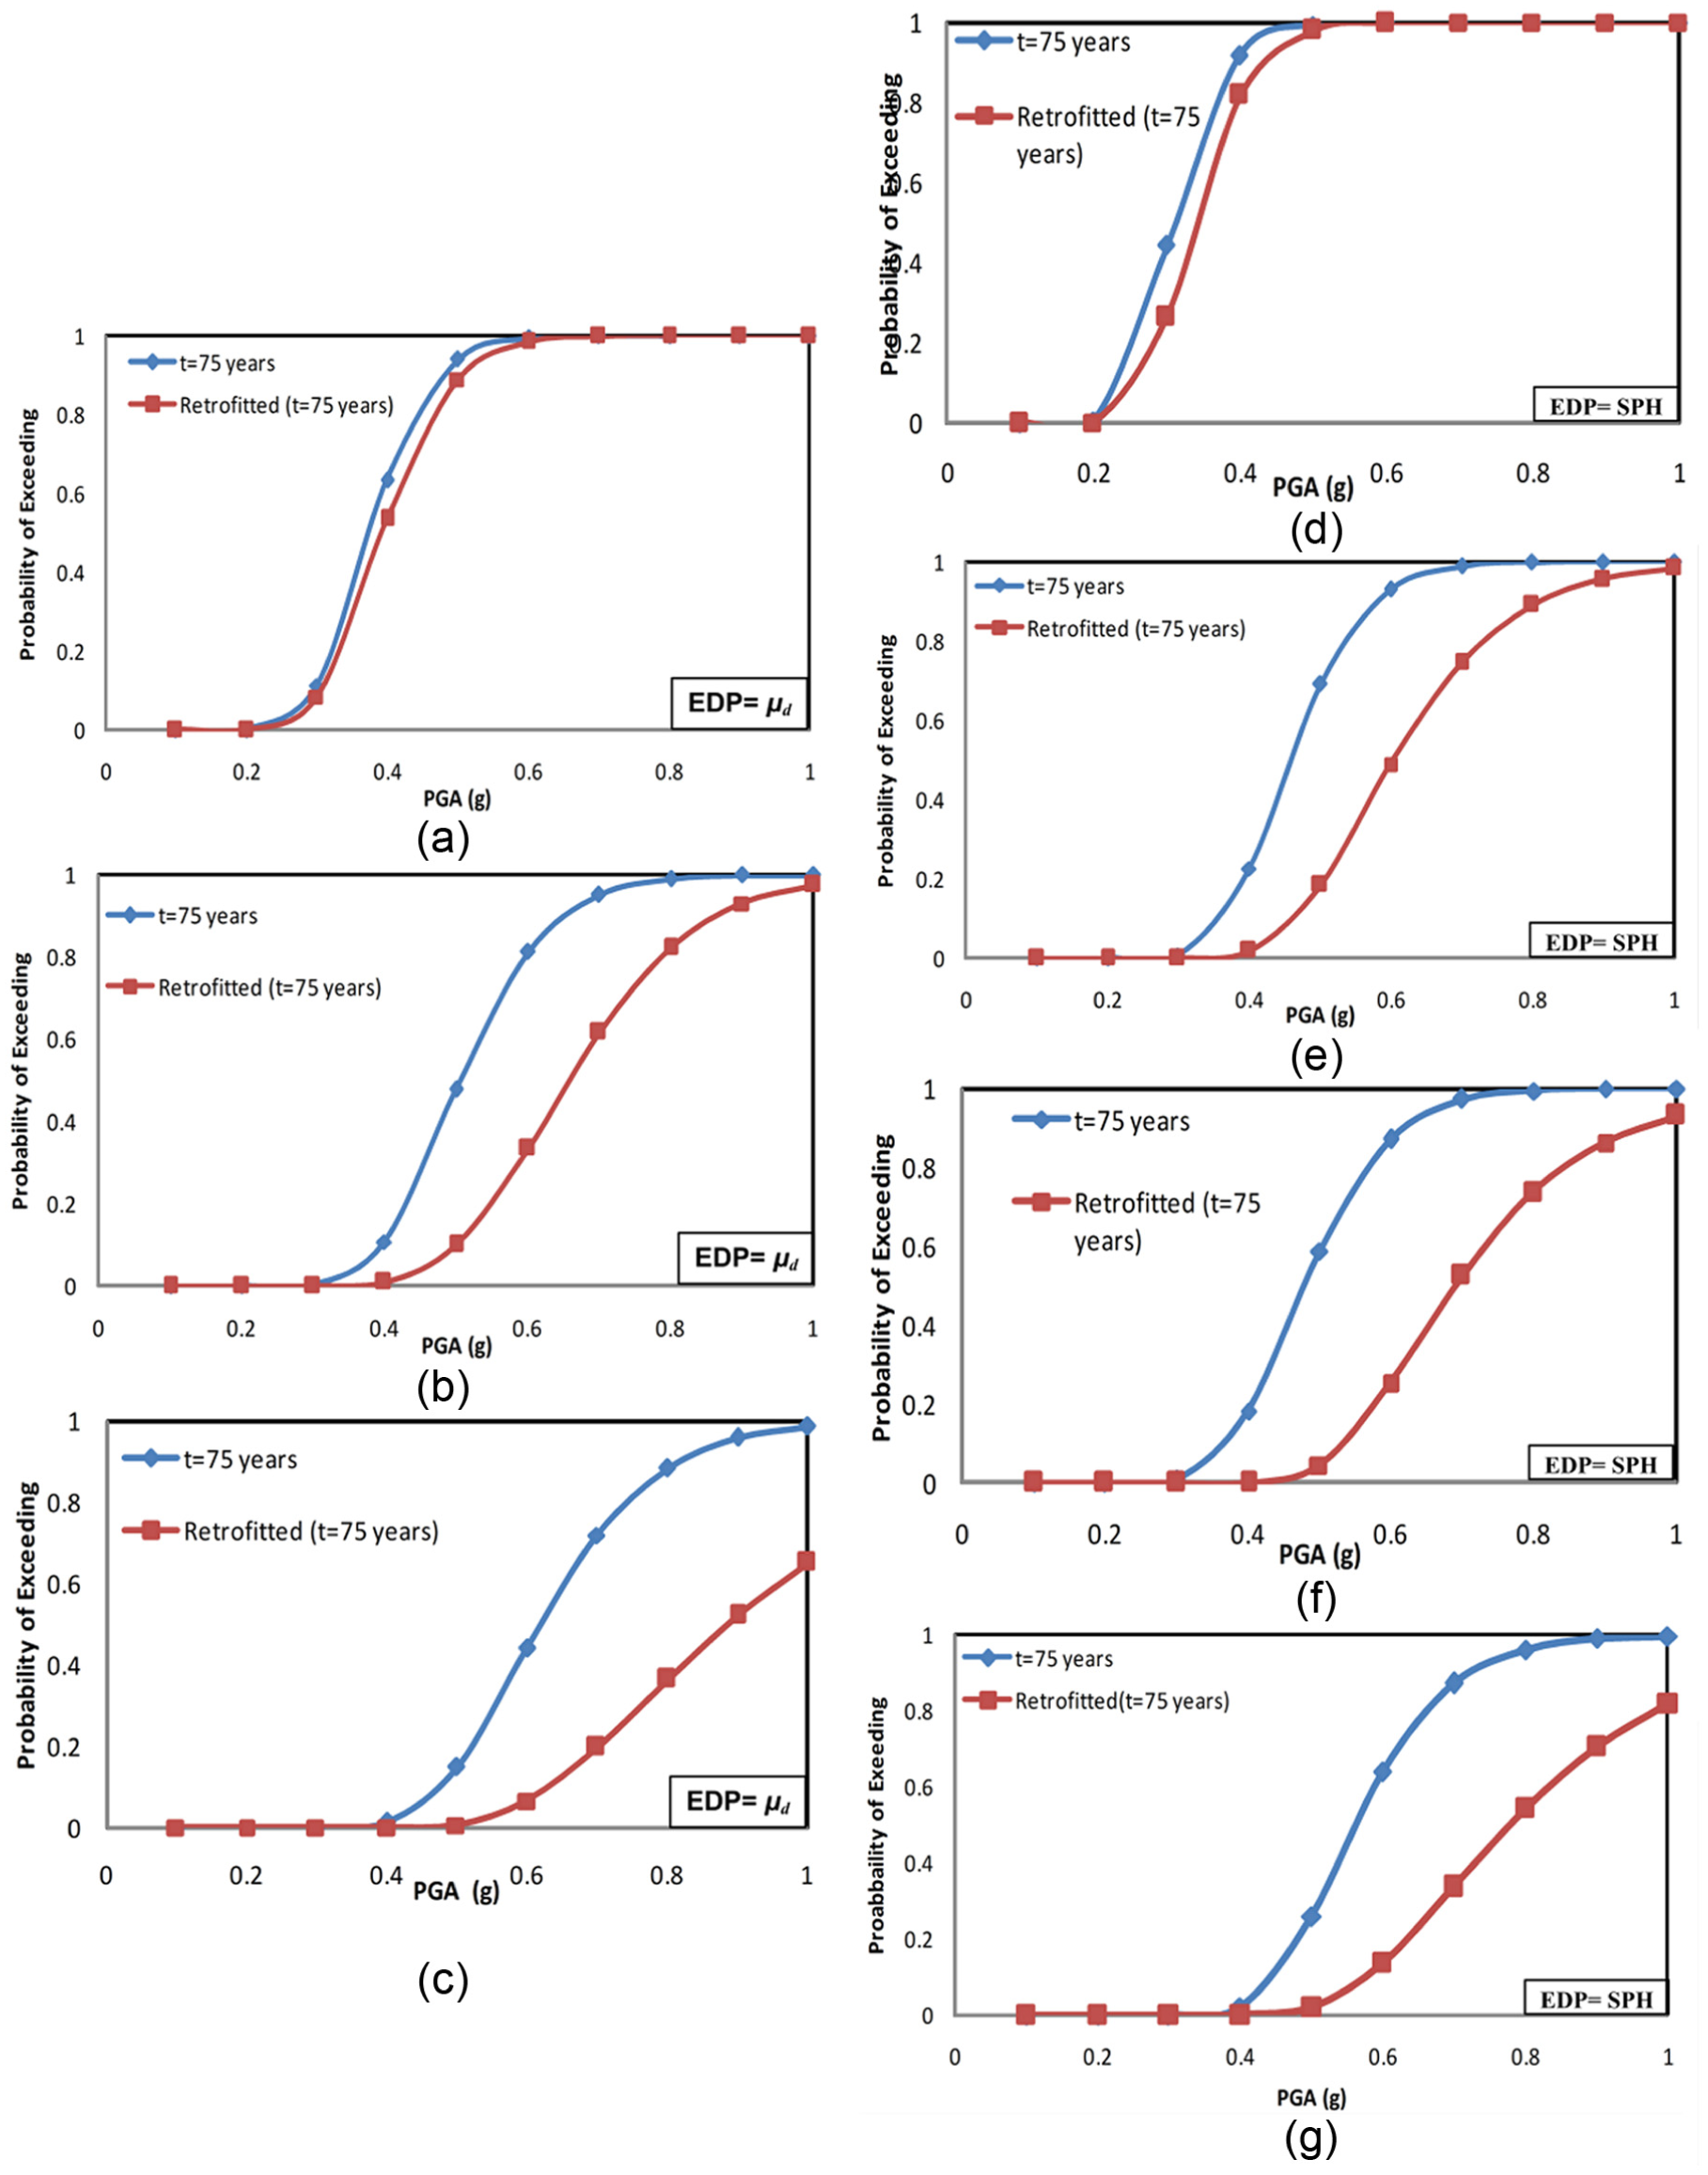
Fragility curves of corroded (t = 75 years) for different damage states: (a) serviceable damage state, (b) repairable damage state, (c) near collapse damage state, (d) slight damage state, (e) moderate damage state, (f) extensive damage state and (g) complete damage state.
Impact of corrosion-induced deterioration on seismic fragility curves
The results of Figures 10 and 11 indicate increase in seismic fragility along the service life of the deteriorated wharf structure due to reinforcement corrosion. For example, in Figure 10, for a ground motion having PGA = 0.6 g, there is 21% chance of achieving repairable damage state for initial (t = 0 years) wharf, but after 50 years of exposure to chloride, the chance of repairable damage state for the same level of intensity is 51%. Additionally, fragility increment is much more considerable for more severe damage states.
Impact of CFRP jacketing on seismic fragility curves
The results show reduction in exceeding probability of different levels of damage states in all earthquake intensities after strengthening the piles with CFRP. For instance, in Figure 14, for an earthquake with PGA = 0.6 g, the exceeding probability of extensive damage state is reduced from 87% for the corroded (t = 75 years) case to 25% after retrofitting with CFRP. The less effect of CFRP on preliminary levels of damage states is compatible with this fact that the CFRP has no major impact on the yield behaviour of the wharf. On the other hand, it has noticeable efficacy on the pile curvature ductility and consequently enhance ductility capacity of plastic hinges. Therefore, the effect of CFRP is more evident for more severe damage states.
Comments and conclusion
This study proposed a framework for seismic vulnerability assessment of corroded pile-supported wharves taking into account the effect of chloride-induced corrosion of steel reinforcement bars. The degradation mechanism considered involves the corrosion of RC piles due to chloride attack which leads to reinforcement area loss and consequently excess seismic vulnerable structure.
In order to repair and retrofit of corroded section and enhance the seismic vulnerability of the wharf structure, CFRP jacketing is used.
The impact of deterioration and retrofit technique on the vulnerability is investigated by fragility curves which illustrate the probability of exceeding predefined levels of damage for a wide range of ground motion intensities. The methodology for fragility analysis includes the use of 3D finite element models of a typical pile-supported wharf which is located in Iran southern ports. These models involve initial un-corroded (t = 0 years), corroded (t = 25, 50, 75 years) and CFRP-retrofitted-corroded (t = 25, 50, 75 years) RC pile-supported wharves. Pushover analysis is carried out to obtain the yield point, ultimate point and SPH in their force–deformation curves which have a great influence on the quantitative values of each damage states.
A set of eight ground motion records are applied to the models, and seismic response quantities are assessed using a nonlinear static procedure called CSM. Fragility curves are derived for two different EDPs, including displacement ductility factor (µd) and SPH as seismic performance indicators, in terms of PGA as IM.
The conclusion of this article is based on the some assumptions such as particular set of earthquake records, geometric and structural characteristics of the considered wharf and numerical modelling assumptions. Therefore, the obtained quantitative results are only applicable to the pile-supported wharf structures with the same topology as the prototype pile-supported wharf. However, the proposed procedure has a general validity which can be easily used for other kinds of pile-supported wharves.
The obtained results are as follows:
Chloride corrosion causes reduction in bending capacity of piles over time, while ultimate curvature capacity increases due to decrease in steel reinforcement amount in the section (Figure 7).
Fragility curves for each damage state reveal a significant increment in the seismic vulnerability of the pile-supported wharf over time due to corrosion. For example, in Figure 10, for PGA = 0.6 g, exceeding probability of repairable damage state increases about 2.5 times after 50 years of exposure to chlorides.
The effect of corrosion is more significant for more severe damage states. For instance, after 50 years of exposure and an earthquake with PGA = 0.8 g, the increase in fragility for slight, moderate, extensive and complete damage states are, respectively, 1.03, 1.2, 1.9 and 4.9 times of the initial (t = 0 years) wharf (Figure 11).
CFRP jacketing increases pile confinement and can enhance compressive strength and effective ultimate compressive strain of the section (Figure 7). Therefore, the ductility capacity of plastic hinges improves and different states of plastic hinges (i.e. points B, C, D, E and F in Figure 9) occur for higher levels of displacement. As a result, bounds of each damage state improve so that less fragile pile-supported wharf is obtained.
The results demonstrate that CFRP jacketing is an effective technique to decrease the seismic vulnerability of corroded wharves at different damage states. For example, in Figure 14, for an earthquake with PGA = 0.6 g, the exceeding probability of extensive damage state is reduced from 87% for the corroded (t = 75 years) case to 25% after retrofitting with CFRP. Additionally, the effect of CFRP is more evident for more severe damage states.
The effectiveness of the retrofit measure in enhancing seismic fragility depends on type of damage state and pile-supported wharves.
Fragility analysis is a powerful decision-making tool to investigate the vulnerability of the structures and selection of the optimal retrofit measure. Additionally, fragility curves of corroded wharves show their seismic vulnerability under combined corrosion-induced deterioration and seismic loading. Seismic risk evaluation and economic loss estimation of corroded damaged pile-supported wharves can also be conducted with the aid of fragility curves.
The findings of this study emphasize that the structural performance depends not only on the seismic intensities but also on the environmental hazards. Therefore, it is important to consider the severity of the environmental exposure on the seismic vulnerability assessment of pile-supported wharves or doing protective measures like coating, electro-chemical methods and so on.
In order to increment the reliability of the results, future works are needed considering time-dependent fragility curves taking into account probabilistic modelling of corrosion initiation time and corrosion rate in marine environment. Furthermore, it is recommended to investigate the effect of corrosion rate as a environmental time-dependent parameter on the seismic response of structures.
Footnotes
Declaration of conflicting interests
The author(s) declared no potential conflicts of interest with respect to the research, authorship and/or publication of this article.
Funding
The author(s) received no financial support for the research, authorship and/or publication of this article.