
Abstract
This article presents a parametric study on the lateral-torsional coupling behaviour of the simplified bidirectional asymmetric multi-storey dual lateral load-resisting model. The implementation process for establishing the simplification model is shown in an illustrative example on a three-storey reinforced concrete building system. Combined with the force–displacement relationships of the lateral load-resisting members and the inter-story restoring force models, the dynamic stiffness matrix and the equations of motion under different loading conditions can also be determined. On this basis, parametric analyses for the systems are carried out through the whole loading process from the elastic stage to the inelastic stage. Effects of uncoupled torsion to lateral frequency ratios (Ω) and the stiffness eccentricities on the frequencies are investigated. The analysis shows that the asymmetrical system with a smaller Ω value has a smaller torsional stiffness and a stronger lateral-torsional coupling effect. The effects of the eccentricities in both directions on the frequencies are remarkably different. Smaller Ω values and greater eccentricities lead to greater reductions in the effects of Ω and eccentricities on the frequencies in the inelastic stage.
Keywords
Introduction
Due to the rapid urbanization of China and numerous other countries as well as the scarcity of land in the large cities of these countries, more and more irregular buildings are being proposed by architects in order to make full use of the available land areas. The seismic responses of these buildings are typically of torsionally coupled features. In turn, the lateral-torsional coupling behaviour can create serious pounding problems between buildings in addition to excessive structural and non-structural damages or even structural collapse. In recent decades, the lateral-torsional coupling behaviours of irregular buildings have been studied by numerous researchers. The system parameters of a single-storey, one-way asymmetrical building in an elastic earthquake response can be analytically determined. These parameters include the uncoupled torsion to lateral frequency ratio, the stiffness eccentricity of the floor and the natural period. However, different studies by researchers have not always got generally applicable conclusions about the influence parameters in an inelastic earthquake response. Tso and Bozorgnia (1986) stated that the frequency ratio and stiffness eccentricity were the main parameters in the elastic earthquake response; however, they concluded that these factors did not contribute significantly to the lateral-torsional coupling behaviours of asymmetrical buildings in inelastic analysis. Goel and Chopra (1991) concluded that the uncoupled lateral vibration period, uncoupled torsion to lateral frequency ratio, stiffness eccentricity, relative values of the strength and stiffness eccentricities and yield factor were the main system parameters in the inelastic response of asymmetric structures. Furthermore, some key issues concerning the seismic torsional response of an idealized single-storey torsionally unbalanced structural model were also addressed by Chandler and Duan (1997) and Duan and Chandler (1997). In their study, an optimized procedure for designing torsionally unbalanced structures subjected to earthquake motion was proposed. Jangid and Datta (1995) noted that the frequency ratio and the stiffness eccentricity of the superstructure as well as the frequency ratio and the stiffness eccentricity of the isolator all considerably influenced the response of an asymmetric one-storey base-isolated building.
The lateral-torsional coupling behaviours of asymmetrical multi-storey buildings are more complex than the responses of single-storey, one-way asymmetrical buildings subjected to earthquake motion. The majority of previous studies have been devoted to regularly asymmetrical multi-storey buildings. Only a few researches have focused on the effects of lateral-torsional behaviour on the inelastic responses of these irregular buildings. Kilar and Fajfar (1997) proposed simple procedures for the non-linear static analysis to discuss torsion’s influence on asymmetric structural behaviours. Humar and Kumar (1998a, 1998b) carried out analytical studies on the elastic and inelastic responses of single- and multi-storey building models, thus highlighting the importance of the uncoupled torsion to lateral frequency ratio on governing the torsional response. They also noted that if the ratio was greater than 1, the structure exhibited simpler seismic behaviour, and such structure was defined as torsionally stiff. Therefore, for practical reasons, it would be good practice in design to achieve a value greater than 1. Alternatively, the strength eccentricity was also introduced as a parameter that influenced the inelastic behaviours of asymmetric multi-storey buildings by Ferhi and Truman (1996). Furthermore, Bugeja et al. (1999) presented a study that explored the effects of stiffness and strength eccentricities on the inelastic earthquake response of asymmetric structures. In Rizwan and Singh’s (2012) analysis of the non-linear dynamic time history, both the mass asymmetric systems and the mass symmetric systems were considered. In addition, the mass symmetric systems included different cases of strength and stiffness eccentricities. Furthermore, Matsagar and Jangid (2005) investigated the effects of torsional coupling due to isolator parameters on the seismic response of base-isolated buildings. Li et al. (2007) proposed a simplified calculation approach of the torsionally coupled seismic response for base-isolated eccentric structures. Mazza (2014) developed a computer code for the non-linear static analysis of spatial framed structures with an asymmetric plan based on arc-length methods. Manoukas et al. (2012) stated that the seismic response of an asymmetric building under biaxial excitation could be related to the response of a series of ‘modal’ equivalent single-degree-of-freedom systems under uniaxial excitation. Gong and Hao (2005) and Hao and Gong (2005) carried out a parametric study on the seismic-induced lateral-torsional-pounding responses of both an asymmetric and a symmetric one-storey structure subjected to bidirectional ground motion. In their study, both uniform ground input and spatially varying ground motion input were studied. Furthermore, the effects of soil–structure interaction on the lateral-torsional behaviours of asymmetric buildings have also been investigated by some researchers. For instance, Wu et al. (2001) developed an efficient methodology that applied modal analysis to assess the combined soil–structure interaction and torsional coupling effects on asymmetric buildings in the frequency domain. Li and Jiang (2013) presented an analytical model based on a branch mode decoupling method to carry out a parametric analysis of the soil–eccentric structure interaction system by assuming that the superstructure maintained classic normal modes.
In addition, most existing references on the inelastic seismic response of asymmetric buildings have been conducted on simplified, highly idealized, one-storey and shear-beam models designed for lateral load resistance (Tso and Sadek, 1985). Employing such a model, the conclusions obtained by Mittal and Jain (1995) were not entirely consistent with those given by Chandler and Duan (1991). Chandler and Duan (1990), however, stated that the contradictory conclusions arose from the use of different analytical models. Stathopoulos and Anagnostopoulos (2005) found that the so-called flexible side frames exhibited higher ductility demands than the stiff side frames, which contrasts with the observations predicted by the simplified one storey, typical shear-beam models. The arrangement form of the simplified models includes systems established by parallel lateral load-resisting members with a single eccentricity or is constituted by orthogonal resisting shear type members. Halabian and Birzhandi (2014) also studied the seismic response of the plan asymmetric multi-storey reinforced concrete moment-resisting frames stiffened with ductile reinforced concrete structure walls. Furthermore, Goel and Chopra (1990) compared the analyses of models with 2, 3, 4 and 16 members oriented along the direction of ground motion. They determined that the models that contained only two such members parallel to the direction of ground motion provided a satisfactory estimate on the response of a system with that of a larger number of resisting members. Tso and Wong (1995) evaluated the inelastic seismic displacements at the flexibility of torsionally unbalanced structural systems. They observed that the normalized edge displacements primarily depended on the torsional stiffness and the eccentricity of the system. Anagnostopoulos et al. (2010) used the plastic hinge models and carried out pushover analyses to determine the force–deformation curves, which were approximated using bilinear idealization model for each of the plan frames in both asymmetric and symmetric multi-storey buildings. They studied the ductility demands of multi-storey buildings.
It is important to note that these past works provide a few insights into the structural dynamic characteristics of bidirectional asymmetrical multi-storey buildings throughout the whole process from the elastic stage to the inelastic stage. Parametric studies on the effects of the uncoupled torsion to lateral frequency ratios and the stiffness eccentricities on the frequencies in the inelastic stage are far from perfect, and further studies are required. Therefore, based on previous studies, a simplified bidirectional asymmetric multi-storey dual lateral load-resisting model is suggested in this study. This simplified model is suitable for inelastic analysis. Parametric analyses on this model are carried out through the whole loading process from the elastic stage to the inelastic stage. The effects of uncoupled torsion to lateral frequency ratios and the stiffness eccentricities on the normalized frequencies are analysed and discussed.
Structural model and equations of motion
Analytical model
Plan of a three-storey reinforced concrete building shown in Figure 1 is considered in this study. The building consists of four or six plane frames along the x and y directions, and the influences of infill walls are not considered. Two categories of columns are adopted in this building. The columns named as KZ1 in Figure 1 have a section dimension of 0.5 × 0.55 m, and there are six in total. The other columns have a section dimension of 0.4 × 0.45 m, and there are 18 in total. The building has a storey height of 3.9 m. In addition, due to the asymmetric distribution of the columns, the distribution of stiffness is asymmetrical both about the x-axis and the y-axis; thus, the system has bidirectional stiffness eccentricities. Furthermore, the mass eccentricity in this study is vitally small and thus ignored in the analysis hereafter. Moreover, there is no variation in each column along the vertical direction. That is, the structure investigated herein is a regularly asymmetric building.
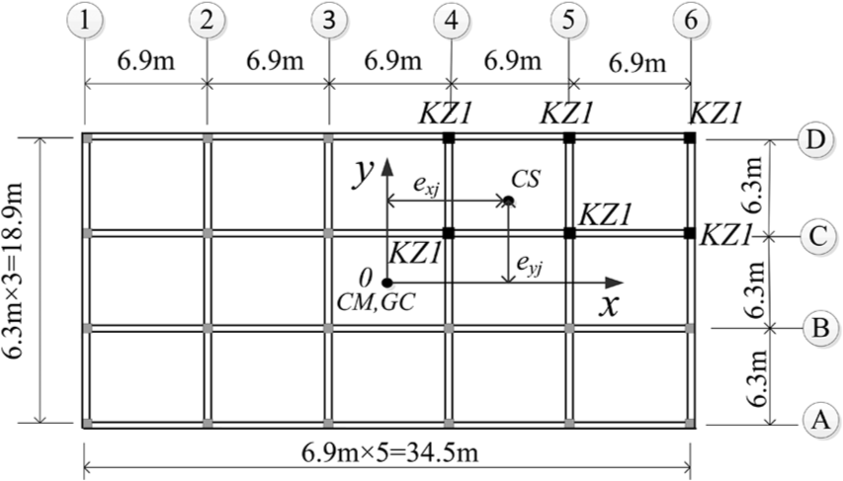
Plan view of the investigated building.
As already indicated, the number of lateral load-resisting members oriented along the load direction has little remarkable effect on the overall response of the system. Therefore, the corresponding simplified model supported by dual lateral load-resisting members is adopted in this study (shown in Figure 2). The simplification model is a shear-torsional type series rigid plate layer model. In the analysis process, the main assumptions are made as follows: (a) The stiffness of each floor in the plane is infinite. The masses of the lateral load-resisting members are concentrated in the floor. (b) The simplified system for floor j consists of a uniform rigid slab of mass mj, and the radius of gyration rj taken about the centre of mass (CM). (c) The radius of gyration of each floor is identical, that is, r1 = r2 = r3 = r. (d) The slab for each floor is supported by four massless, axially inextensible load-resisting members: frame A, frame B, frame C and frame D. Frames A and B are formed by merging the frames in the x direction to the two sides, whereas frames C and D are formed by merging the frames in the y direction to the two sides. (e) All the members are assumed to be massless and axially inextensible, and the torsional inertia of each individual member is assumed to be negligible and thus ignored in the analysis. Frames A and B are located at equal distance b from, but on opposite sides of, the x-axis, thereby providing the total translational stiffness of floor j in the x direction. Frames C and D are located at equal distance a from, but on opposite sides of, the y-axis, thereby providing the total translational stiffness of floor j in the y direction. The CM of the slab of each floor is taken to be coincident with the geometric centre (GC), whereas the system is unsymmetrical both about the x-axis and the y-axis. The 3 degrees of freedom of the system at floor j are the x-translation and y-translation with respect to the two principal horizontal axes and the rotation of the deck about the vertical axis.

Plan view of the corresponding simplified model.
The calculation of the simplification model for floor j can also be expressed by adopting a simultaneous equation group in equations (1) to (5)

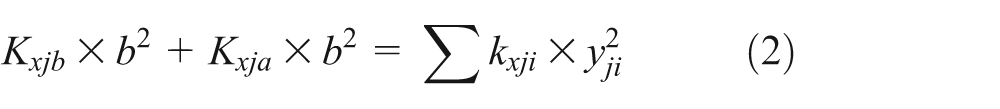
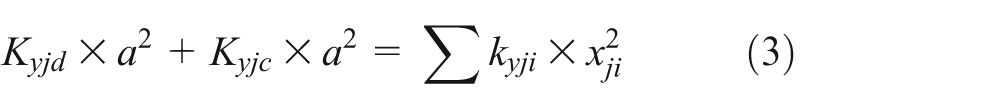
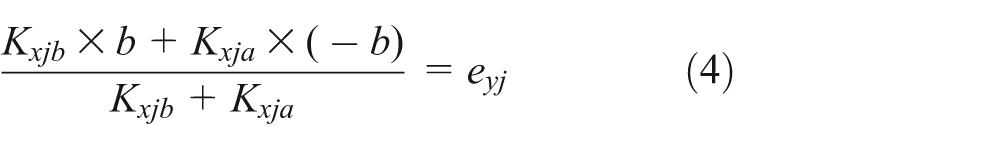

Through the six equations in equations (1) to (5), Kxjb, Kxja, Kyjd, Kyjc, a and b can be calculated in equations (6) to (10)
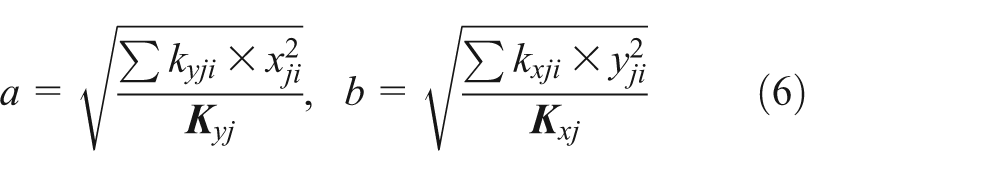
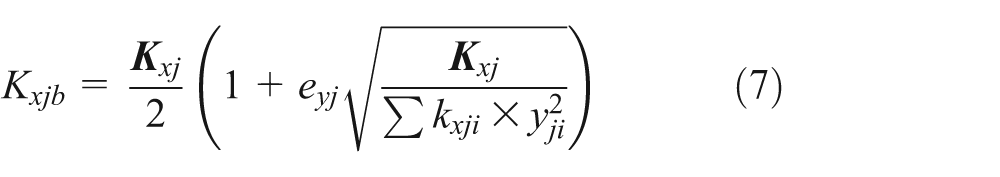
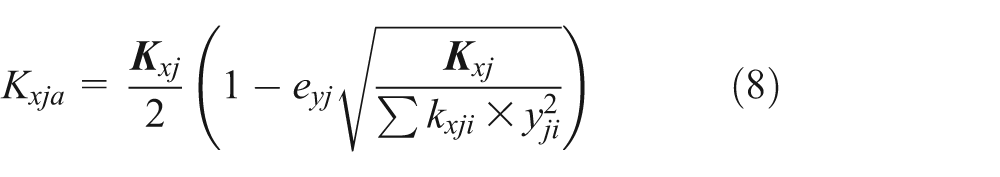
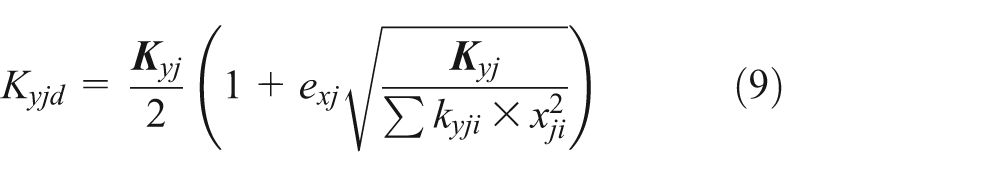

where kxji and kyji designate the stiffness of the ith column of floor j in the x and y directions, respectively; xji and yji are the x and y coordinates of the ith column of floor j;

Floor-rigid model with eccentricity of the system.

Eccentric parameters of floor j.
Equations of motion
The direct stiffness method (Chopra, 2007) is utilized to assemble the structure stiffness matrix of the system in Figure 3. The equations of motion for the undamped system investigated herein with 9 degrees of freedom can be written in the usual matrix form
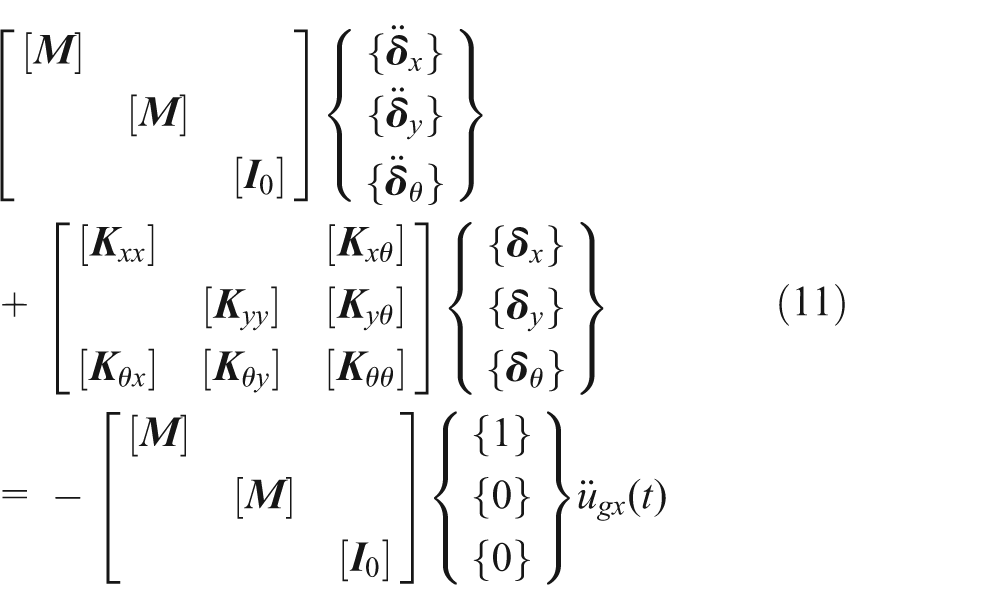
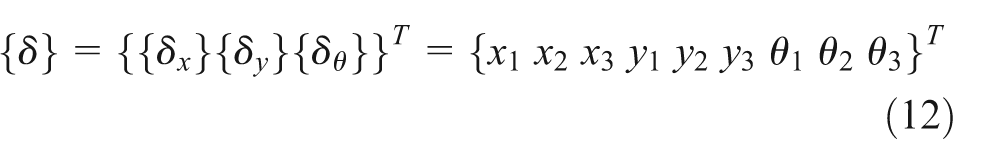

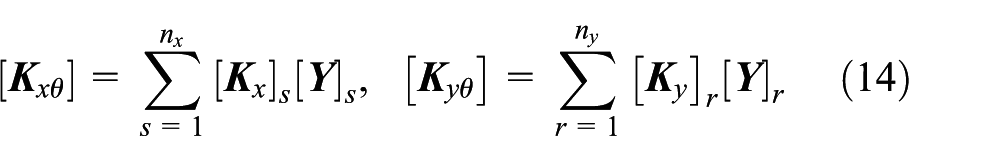
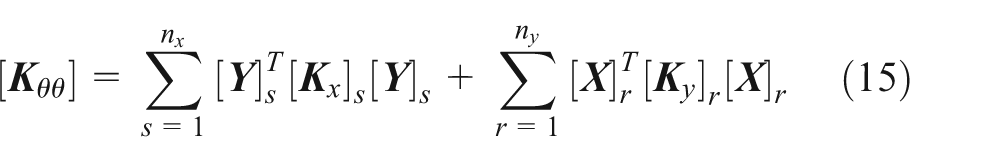
where [
Analysis methods
Analysis by load incremental method
In this study, the equivalent symmetric system is established by suitably modifying the distribution of the lateral load-resisting members to make the locus of elastic CRs (as defined before) coincide with the locus of CMs. The load incremental method is utilized to solve the non-linear problem and to carry out the parametric analysis. The restoring force model used in this article is based on the member. The force–displacement relationship for each lateral load-resisting member (both in the x and y directions) is described by the bilinear hysteretic model shown in Figure 5, in which K1 is the elastic lateral stiffness, and K2 represents the lateral stiffness after yielding taken as 10% of K1 (Zhang, 2003). The tensile steels yield when the displacement of the lateral load-resisting member reaches its yield displacement. For the pure shear type layer model, it can be assumed that the inflection point is located at the middle part of the member. Vy and Δy denote the yield shear and the corresponding yield displacement, respectively. Their calculation formulae are written as equations (17) and (18) (He and Ou, 2007)

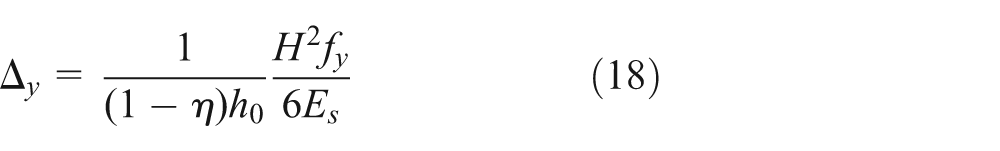
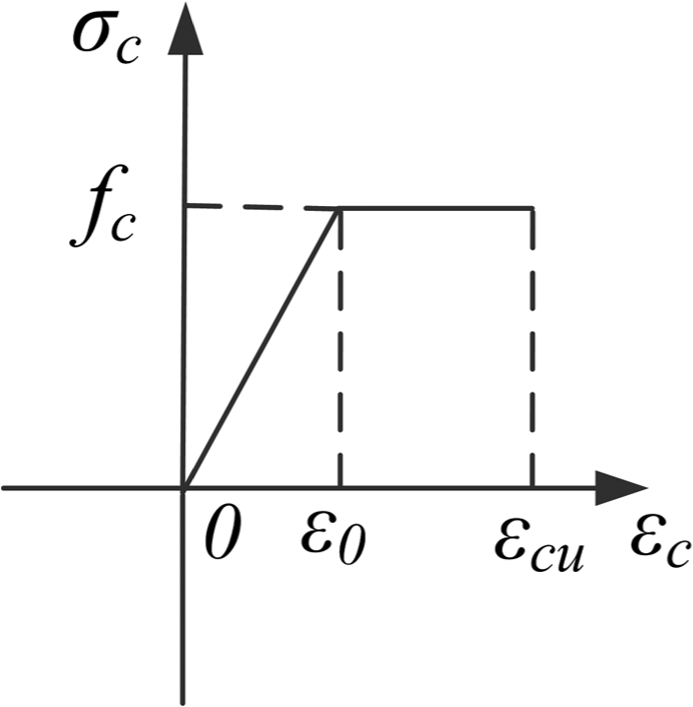
where H and Hn are the height and clear height of the column, respectively; h0 represents the valid height of the column section; fy denotes the design value of the tensile strength of tensile steel; Es is the elastic modulus of the tensile steel; My and η are the yield moment of the member section and the height coefficient of concrete compressive region, respectively. My and η can be calculated by simplified formulae that are derived from the material’s stress–strain curves. The following assumptions are made when calculating My and η: (a) The section agrees with the plane section assumption. (b) There is no relative slip between the concrete and steels. (c) The influence of concrete in the tensile area on the stiffness of a member is ignored. (d) The signs of section tensile stress and section tensile strain are positive, and the signs of section compressive stress and section compressive strain are negative. (e) The stress–strain curves of steel and concrete are illustrated in Figures 6 and 7, where σy and εy are the yield stress and yield strain of the steel, respectively. Furthermore, fc represents the design value of the axial compressive strength of concrete, ε0 denotes the compressive strain of concrete when its compressive stress reaches fc and εcu is the ultimate compressive strain of concrete. (f) It is assumed that the plastic development of the concrete in the compressive zone is not significant when the cross-section yields, so the concrete in the compressive zone is assumed to be in the linear elastic stage when calculating My and η (Gao, 1988). The geometric non-linearity is ignored in the analysis.
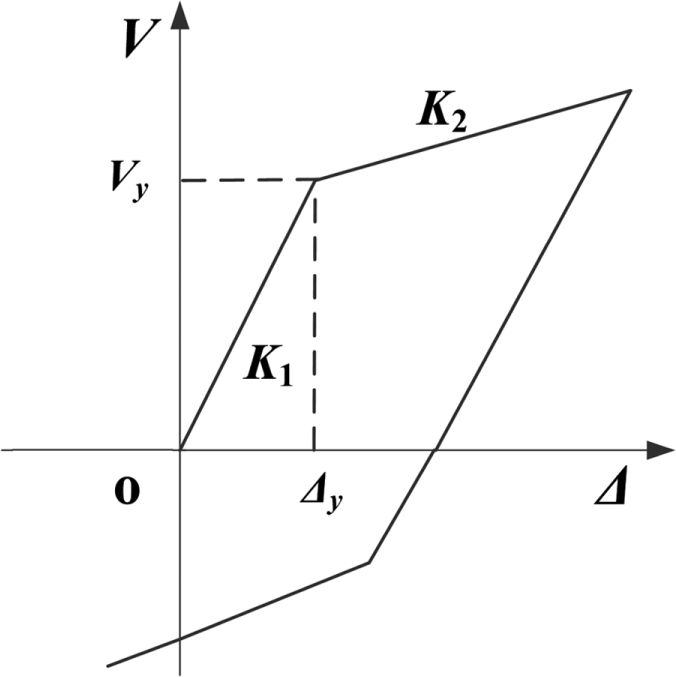
Bilinear restoring force model for each member.
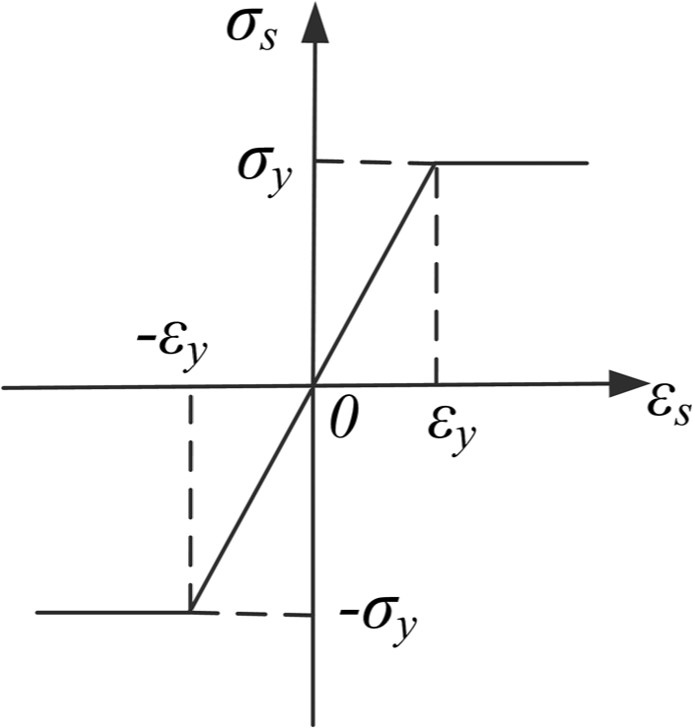
Stress–strain relationship of steel.
Stress–strain relationship of concrete.
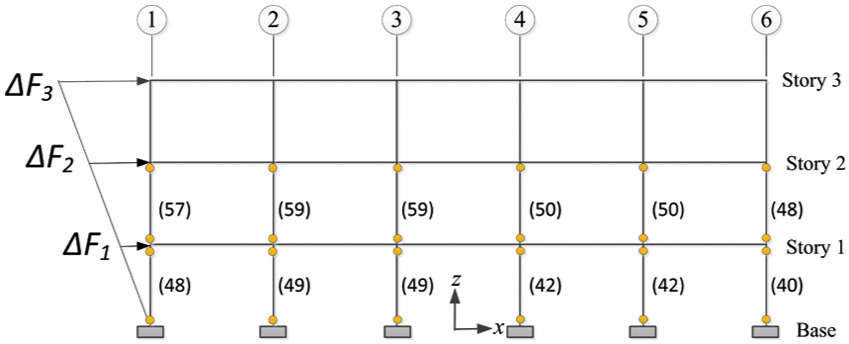
The analysis processes are realized by developed programs written in MATLAB’s M programming language. Some sample coding and the main calculation flow chart are shown in Figures 8 and 9, respectively. Based on these, the static and inverted triangular loads are applied at the CMs of the analytical models along the x direction in a step-by-step manner. The lateral load distribution is presented in Figure 10, and the calculation equation is written as equation (19)
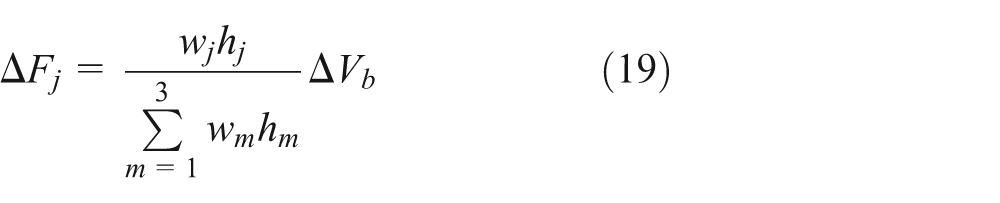
where ΔFj designates the increment of the lateral load of floor j; wj is the representative value of the gravity load of floor j; hj is the height of floor j and ΔVb represents the increment of the base shear. The stiffness of each lateral load-resisting member is modified according to its displacement and restoring force model at each step in order to form a new stiffness matrix for the next step analysis. Therefore, the non-synchronization of the displacements of the members, which is induced by the torsion of the floor, can be considered in detail during analysis. When the inter-story displacement angle θp of any layer becomes 1/50 (as stipulated by the Chinese Code for Seismic Design of Buildings (GB50011-2010, 2010)), loading is stopped. Figure 10 shows the yield distribution of the members of the frame on the C-axis in Figure 1 when loading is stopped with a total load step number of 66. Members with two yellow ends represent that these members have yielded, and the number in the bracket is the load step number that was applied on the system when the member yielded.
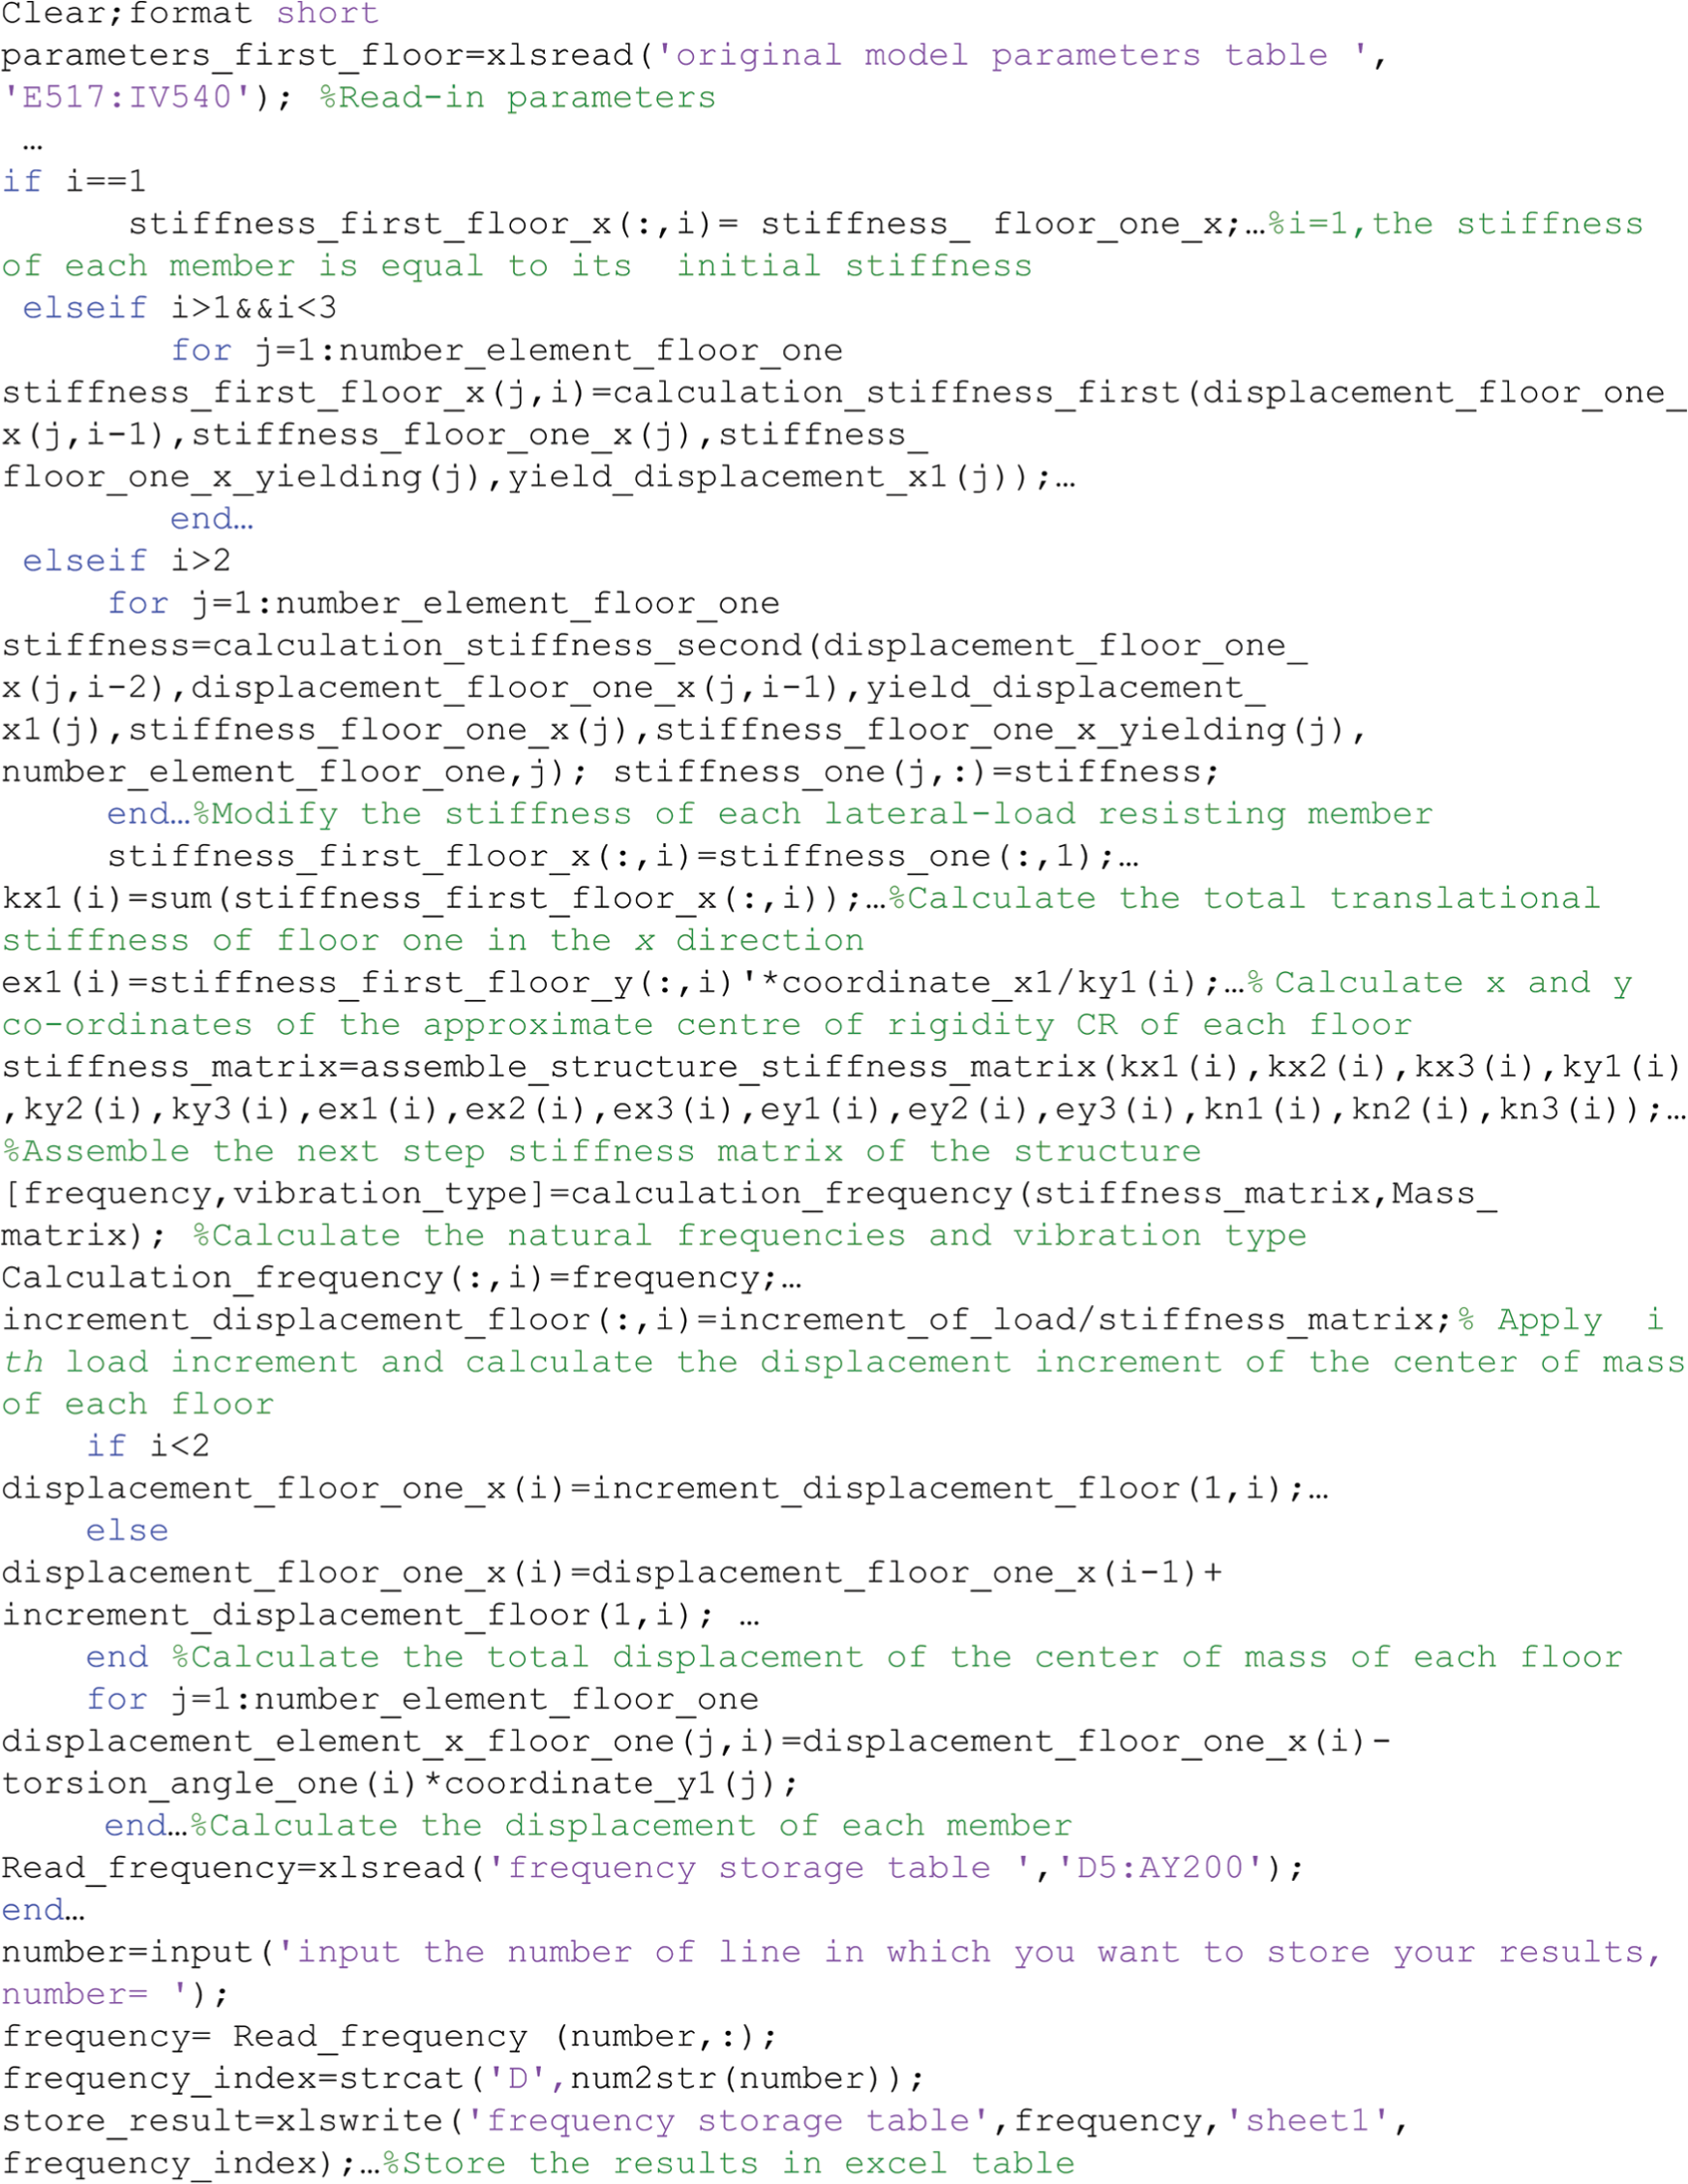
Sample coding.
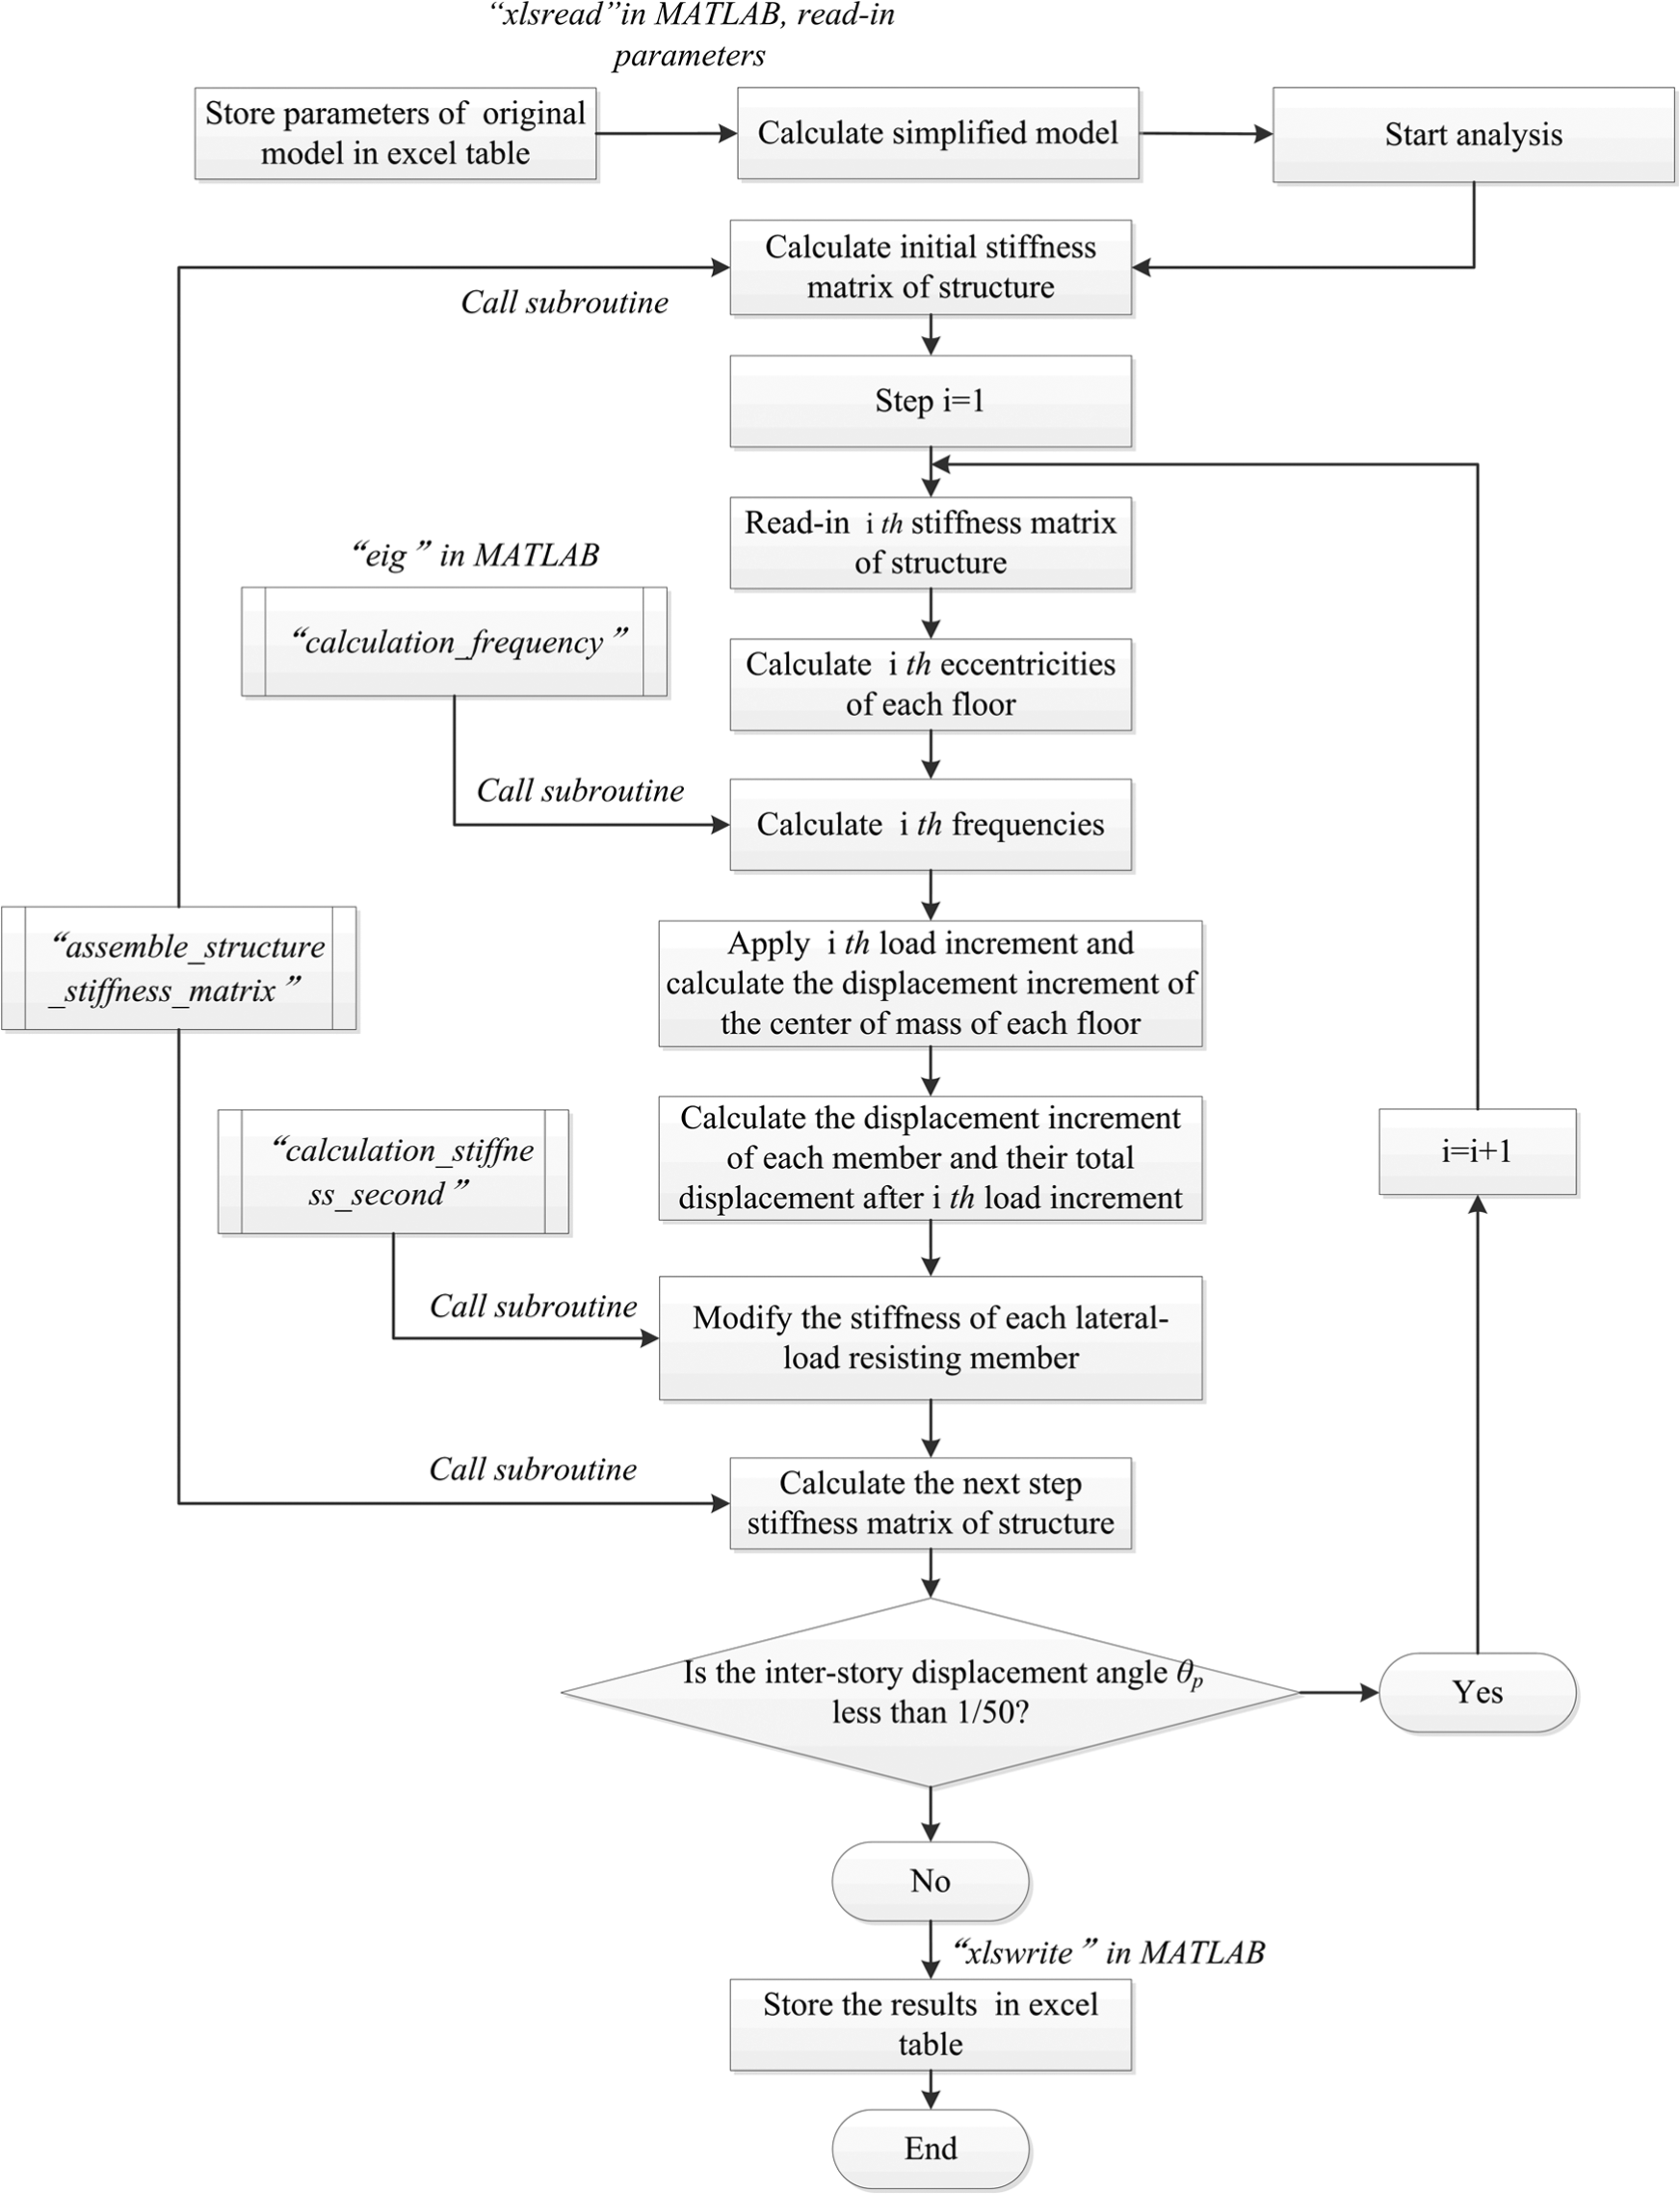
Main calculation flow chart.
Lateral load distribution and yield distribution schematic diagram of the members of the frame on C-axis.
The equivalent stiffness method is utilized to determine the inter-story restoring force model of the system. The relationship of the inter-story shear Vj and inter-story displacement uj for floor j has trilinear characteristics because of torsion’s influence on the yielding orders of the lateral load-resisting members. Therefore, the obtained curves are approximated using trilinear idealization models in terms of the equivalent energy principle (Sun et al., 2013) (shown in Figure 11). Kj1, Kj2 and Kj3 represent the storey stiffness for the three stages of floor j in the x direction, respectively. Kj1 designates the elastic storey stiffness that is taken to be the sum of the stiffness of each lateral load-resisting member in the x direction of floor j. Kj2 represents the storey stiffness during the yielding process of the lateral load-resisting members, which is equal to the slope of the line connecting D1 and D2. Point D2 is defined by the condition that all the lateral load-resisting members in the x direction of floor j have just yielded. Point D1 is determined according to the principle of area A being equal to area B. Kj3 denotes the storey stiffness after the yielding of all the lateral load-resisting members in the x direction of floor j. Additionally, the storey stiffness for the three stages of floor j in the y direction can be achieved by a similar method. For the sake of obtaining the inter-story restoring force model, additional load steps may be applied to the analytical models during analysis. However, in the parametric analysis hereafter, the inter-story displacement angle θp of any layer coming to 1/50 is still regarded as the limit value to carry out the whole parametric analysis procedure.

Schematic diagram of equivalent three-linear restoring force model.
Definition of analysis stages
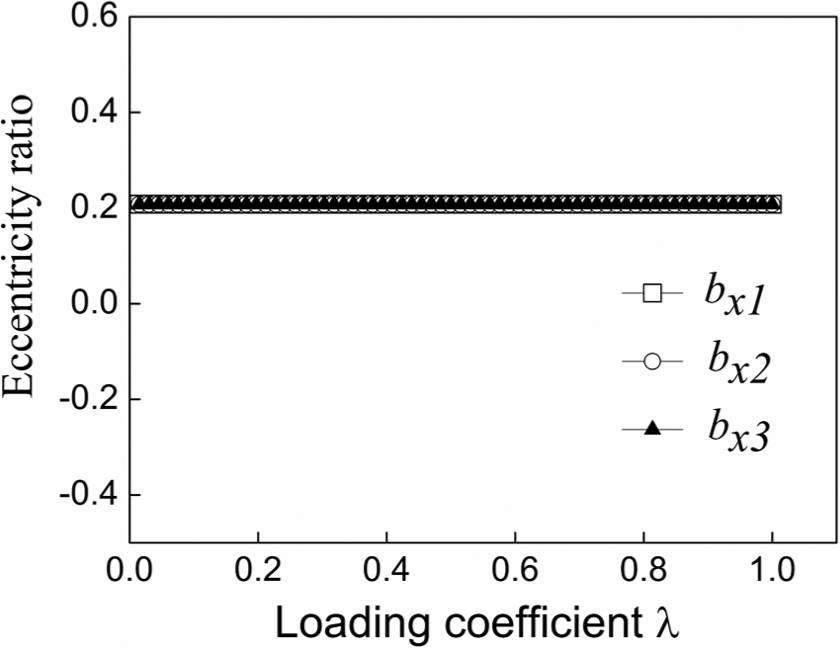
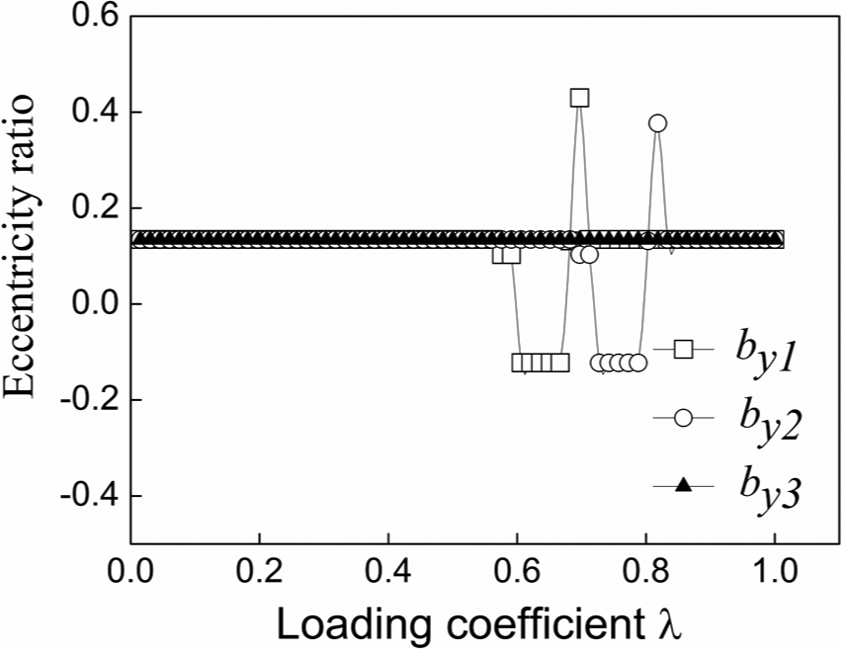
The variation curves of normalized stiffness eccentricities of floor j (j = 1, 2, 3) in the x and y directions with the loading coefficient λ are presented in Figures 12 and 13, respectively. The loading coefficient λ is defined as the ratio of the load already applied on the system after each step to the final total load applied on the system, which has a maximum of 1. The initial normalized stiffness eccentricities of the system are by1 = by2 = by3 = 0.1344 and bx1 = bx2 = bx3 = 0.2082. Under the load in the x direction, all the lateral load-resisting members in the y direction of the system studied in this article are still in the elastic stage when the loads are limited by θp. Therefore, the variation curves of bx1, bx2 and bx3 with λ all stay straight (Figure 12). The displacements of the lateral load-resisting members parallel to the load direction in the first floor are all beyond their yield displacements during the loading process, so some abrupt points appear in the curve of by1 with λ, and then, the curve tends to be stable after the members yield. The lateral load-resisting members oriented along the load direction in the second floor yield in some last load steps, so the abrupt points appear near the end of the curve of by2 with λ. In addition, all the lateral load-resisting members parallel to the load direction in the third floor are still in the elastic stage because their displacements are all less than their yield displacements. Therefore, by3 remains invariant.
Variation of normalized stiffness eccentricities in the x direction.
Variation of normalized stiffness eccentricities in the y direction.
Based on the above analysis, several typical stages are chosen according to the yielding orders of the lateral load-resisting members along the load direction to carry out the parametric analysis:
All the lateral load-resisting members parallel to the load direction are in the elastic stage. That is, the storey stiffness in the x direction are K11, K21 and K31, respectively. This stage is defined as the first stage of the system.
The storey stiffness in the x direction of floor one enters into K12, whereas it is K21 and K31 for floor two and floor three, respectively. This stage is defined as the second stage of the system.
The storey stiffness in the x direction of floor one and floor two enter into K13 and K22, respectively. And it is still K31 for floor three. This stage is defined as the third stage of the system.
Here, the following parametric analyses only consider the elastic stage of the lateral load-resisting members perpendicular to the load direction. Thus, the storey stiffness of floor j in the y direction is equal to the sum of the stiffness of each lateral load-resisting member in the y direction of floor j. According to the storey stiffness of the three floors at each stage, combined with the other parameters for each stage, the dynamic stiffness matrix and the equations of motion of each stage can be determined. Therefore, the parametric analysis for each stage can be carried out.
Suitability of simplified model for inelastic parametric analysis
It can be seen from equations (1) to (10) that
Modal analysis
Modal analyses are carried out in order to understand the dynamic characteristics of systems. The main vibration mode of the lateral-torsional coupling mode can be determined by calculating the mode direction factor. The mode is called the translational vibration mode when the torsional factor is less than 0.5; however, it is the torsional vibration mode when the factor is greater than 0.5. The calculation formulas of the translational factor in the x direction DXi, the translational factor in the y direction DYi and the torsional factor Dθi for the ith vibration mode of the system can be written as equations (20) to (22)
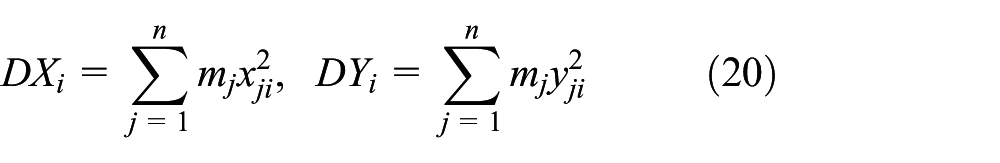
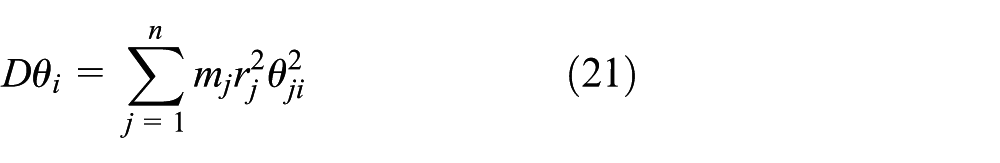

where xji, yji and θji are the displacement components for the ith vibration mode of the jth particle for the spatial structure in a regularization mode vector space; mj is the mass of the jth particle and rj is the radius of gyration of the jth particle. The mode direction factors of the first three order modes of the asymmetrical multi-storey buildings researched herein are listed in Table 1.
Mode direction factors of the first three order modes.

From Table 1, the first-order mode of the system studied in this article is the translational vibration mode in the x direction, coupled with the translation in the y direction and torsion. The second-order mode is the translational vibration mode in the y direction, coupled with the translation in the x direction and torsion. The third-order mode is the torsional vibration mode, coupled with the translation in both the x and y directions. To study the variation of the dynamic characteristics of the bidirectional asymmetrical multi-storey buildings through the whole loading process from the elastic stage to the inelastic stage, the uncoupled torsion to lateral frequency ratio Ω = ωθ/ωx and the normalized stiffness eccentricities are introduced as the two main parameters in this study. The effects of uncoupled torsion to lateral frequency ratios and the normalized stiffness eccentricities on the normalized frequencies ω1/ωx, ω2/ωy, ω3/ωx and ω3/ωθ are mainly evaluated. Furthermore, ω1, ω2 and ω3 are the first three natural frequencies of the asymmetrical structure, and ωx, ωy and ωθ are the first translational frequency in the x direction, the first translational frequency in the y direction and the first torsional frequency of the equivalent symmetric system, respectively.
Parametric analysis and discussions
Parametric analyses with a set of uncoupled torsion to lateral frequency ratios and normalized stiffness eccentricities are carried out based on the analysis methods proposed in the previous chapters. The uncoupled torsion to lateral frequency ratio Ω varies between 1.0 and 1.8, and the normalized stiffness eccentricities vary between 0.1 and 0.4 (Li and Yin, 1988).
It is defined that the initial normalized stiffness eccentricities by1 = by2 = by3 = by and bx1 = bx2 = bx3 = bx. by are formed by the non-uniform distribution of the lateral load-resisting members parallel to the load direction. bx are formed by the non-uniform distribution of the lateral load-resisting members perpendicular to the load direction. The lines G1, G2, G3 and G4 represent that ω1/ωx, ω2/ωy, ω3/ωx and ω3/ωθ are equal to 1, respectively. Level 1, level 2, level 3 and level 4 are defined just like G1, G2, G3 and G4, respectively.
Effects of by on the normalized frequencies
The effects of a set of uncoupled torsion to lateral frequency ratios and normalized stiffness eccentricities by on the normalized frequencies ω1/ωx, ω2/ωy, ω3/ωx and ω3/ωθ are presented in this subsection. The normalized stiffness eccentricity bx is kept constant at 0.2.
For a system with fixed Ω and bx, different normalized stiffness eccentricities by can be generated by adjusting the distribution of the lateral load-resisting members in the x direction. At the same time, the distribution of the lateral load-resisting members in the y direction, the total lateral stiffness and the total torsional stiffness are all kept constant. That is to say, a set of by can be generated by adjusting Kxjb and Kxja. Meanwhile, Kyjd, Kyjc, a, b and the sum of Kxjb and Kxja are kept invariant.
The effects of by and Ω on ω1/ωx in the different stages are presented in Figure 14. The results reveal that increasing by with any Ω value causes ω1/ωx to deviate from G1, especially for a structure with a small Ω value. Figure 14 also shows that increasing Ω with any by causes ω1/ωx to approach G1, which is more pronounced for a structure with a larger by. For a certain system, ω1/ωx more closely approaches G1 from the first stage to the second stage and then to the third stage when a large number of the lateral load-resisting members parallel to the load direction have yielded. The phenomenon revealed in Figure 14 also demonstrates that decreasing by and increasing Ω lead to weak lateral-torsional coupling effect in the first-order mode. The first natural frequency in the x direction of the asymmetrical structure ω1 approaches ωx of the equivalent symmetric system. In other words, the translational deformation component in the structure response gradually increases as the coupled torsional deformation component decreases. Moreover, the yielding of the lateral load-resisting members leads to a great reduction in both the overall lateral stiffness along the load direction and the overall torsional stiffness of the system in the third stage. Therefore, the lateral-torsional coupling effect in the first-order mode becomes weak, causing ω1 to approach ωx. A greater by value and a smaller Ω value lead to a greater reduction in the effects of by and Ω on ω1/ωx.
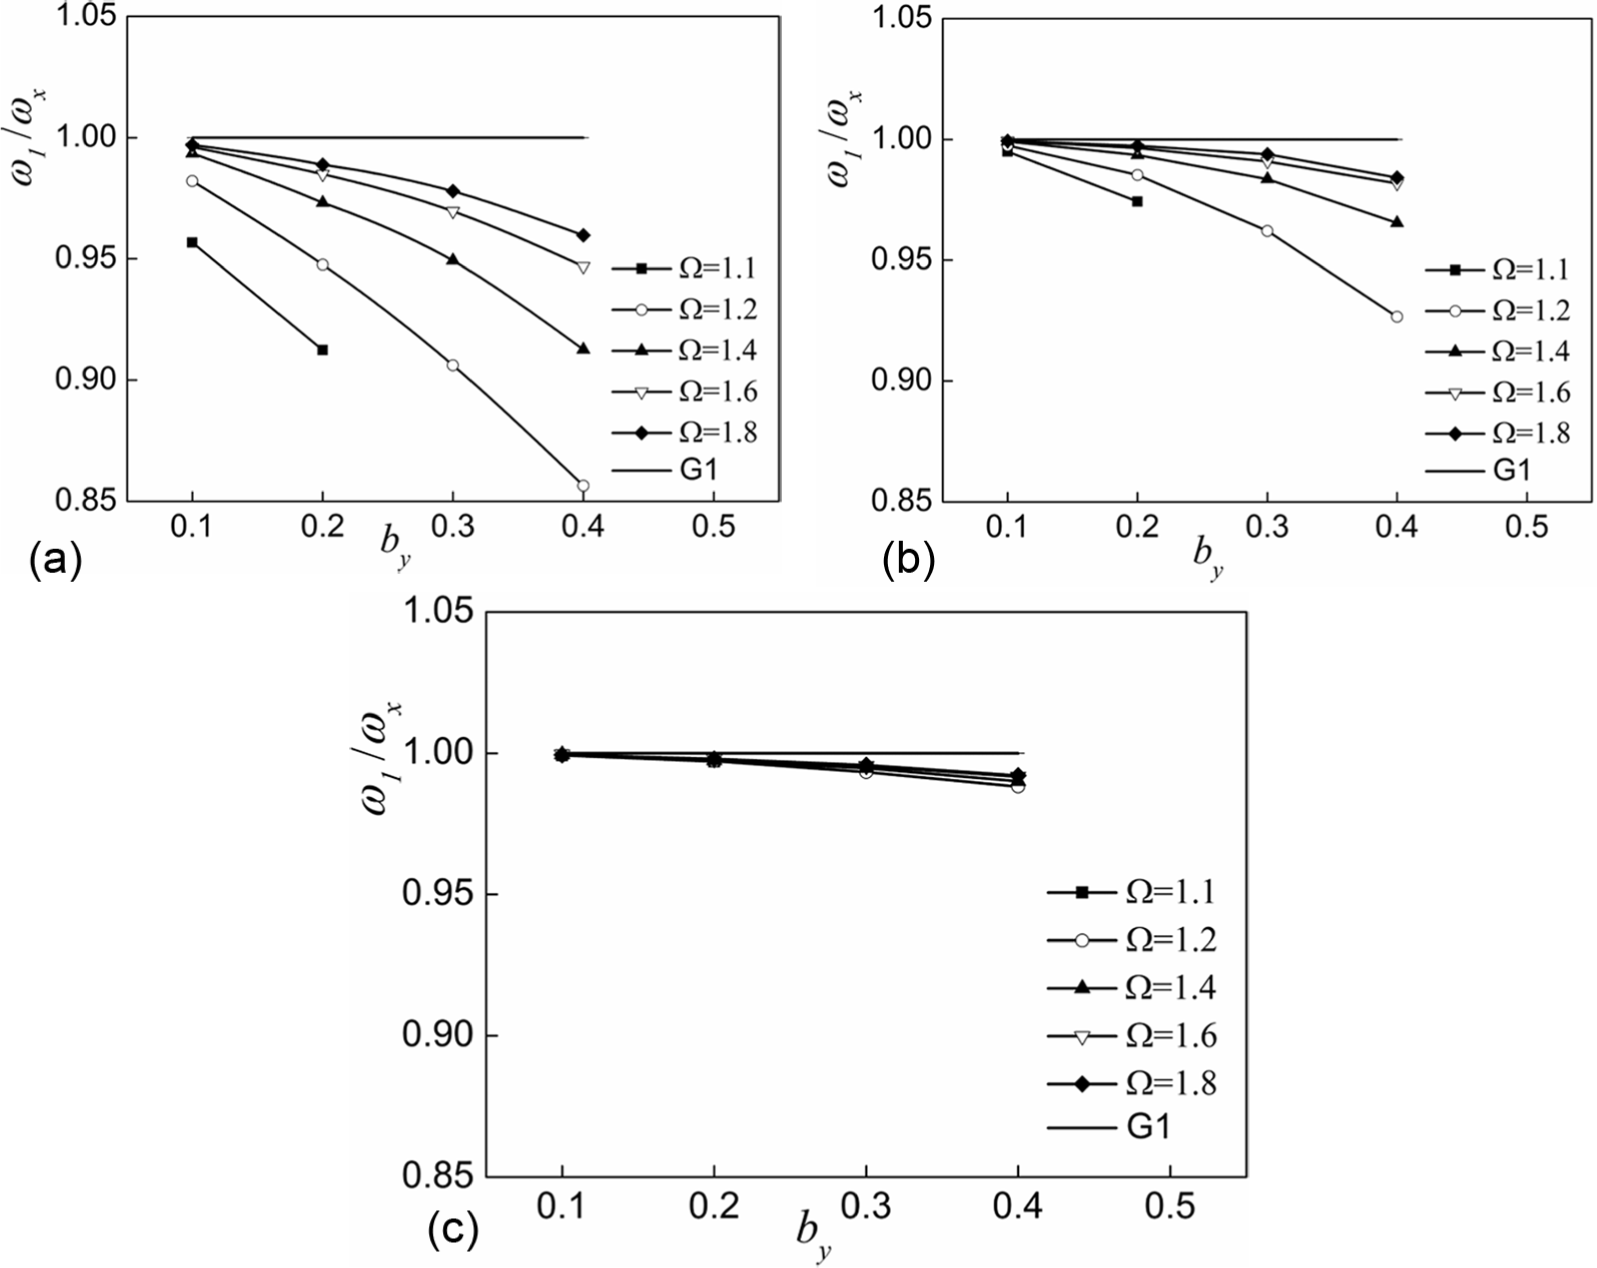
Effects of by and Ω on ω1/ωx in the different stages: (a) the first stage, (b) the second stage and (c) the third stage.
The effects of by and Ω on ω2/ωy in the different stages are evaluated in Figure 15. The results reveal that when Ω is kept constant, ω2/ωy approaches G2 in the first and second stages and gradually deviates from G2 in the third stage with increasing by. When by is constant, ω2/ωy approaches G2 with increasing Ω. For a certain system, ω2/ωy becomes farther from G2 from the first stage to the second stage and then to the third stage. The results indicate that the reduction in the overall lateral stiffness in the x direction of the system leads to an enhancement of the lateral-torsional coupling effect in the second-order mode. A greater by value and a smaller Ω value increase the lateral-torsional coupling effect, and the second natural frequency ω2 is farther from ωy.
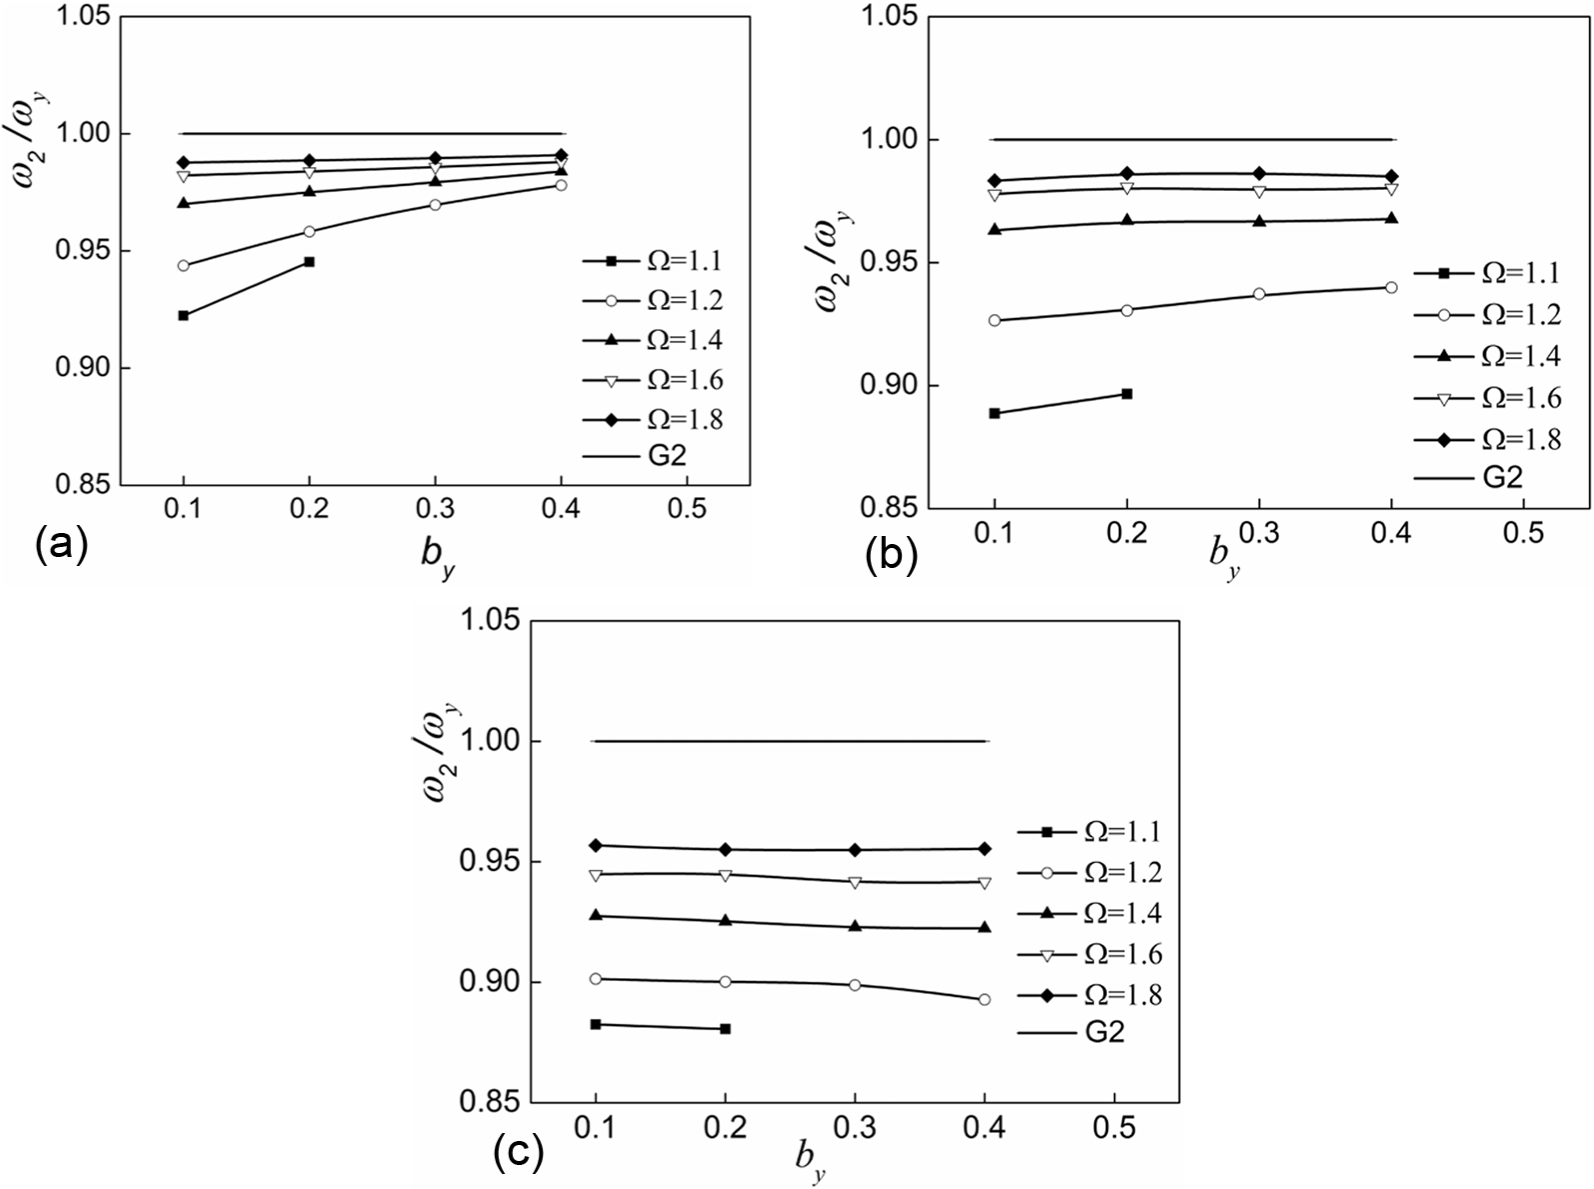
Effects of by and Ω on ω2/ωy in the different stages: (a) the first stage, (b) the second stage and (c) the third stage.
Figure 16 presents the effects of by and Ω on ω3/ωx in the different stages. According to the findings in Figure 16, an increased by with any Ω causes ω3/ωx to deviate from G3 in the first stage, whereas it causes ω3/ωx to approach G3 in the second and third stages, and the gaps of ω3/ωx among different by values decrease. Figure 16 also demonstrates that decreasing Ω with any by causes ω3/ωx to approach G3, and the gaps of ω3/ωx among different Ω values also decrease. For a certain system, ω3/ωx deviates from G3 from the first stage to the second stage and then to the third stage. The results suggest that the increase in by and Ω causes ω3 to deviate from ωx in the first stage. Nevertheless, ω3 approaches ωx with increasing by in the second and third stages. Figure 16 also demonstrates that the reduction in the overall lateral stiffness of the system in the x direction causes ω3 to diverge greatly from ωx, and the effect grows more pronounced with large by and small Ω values.
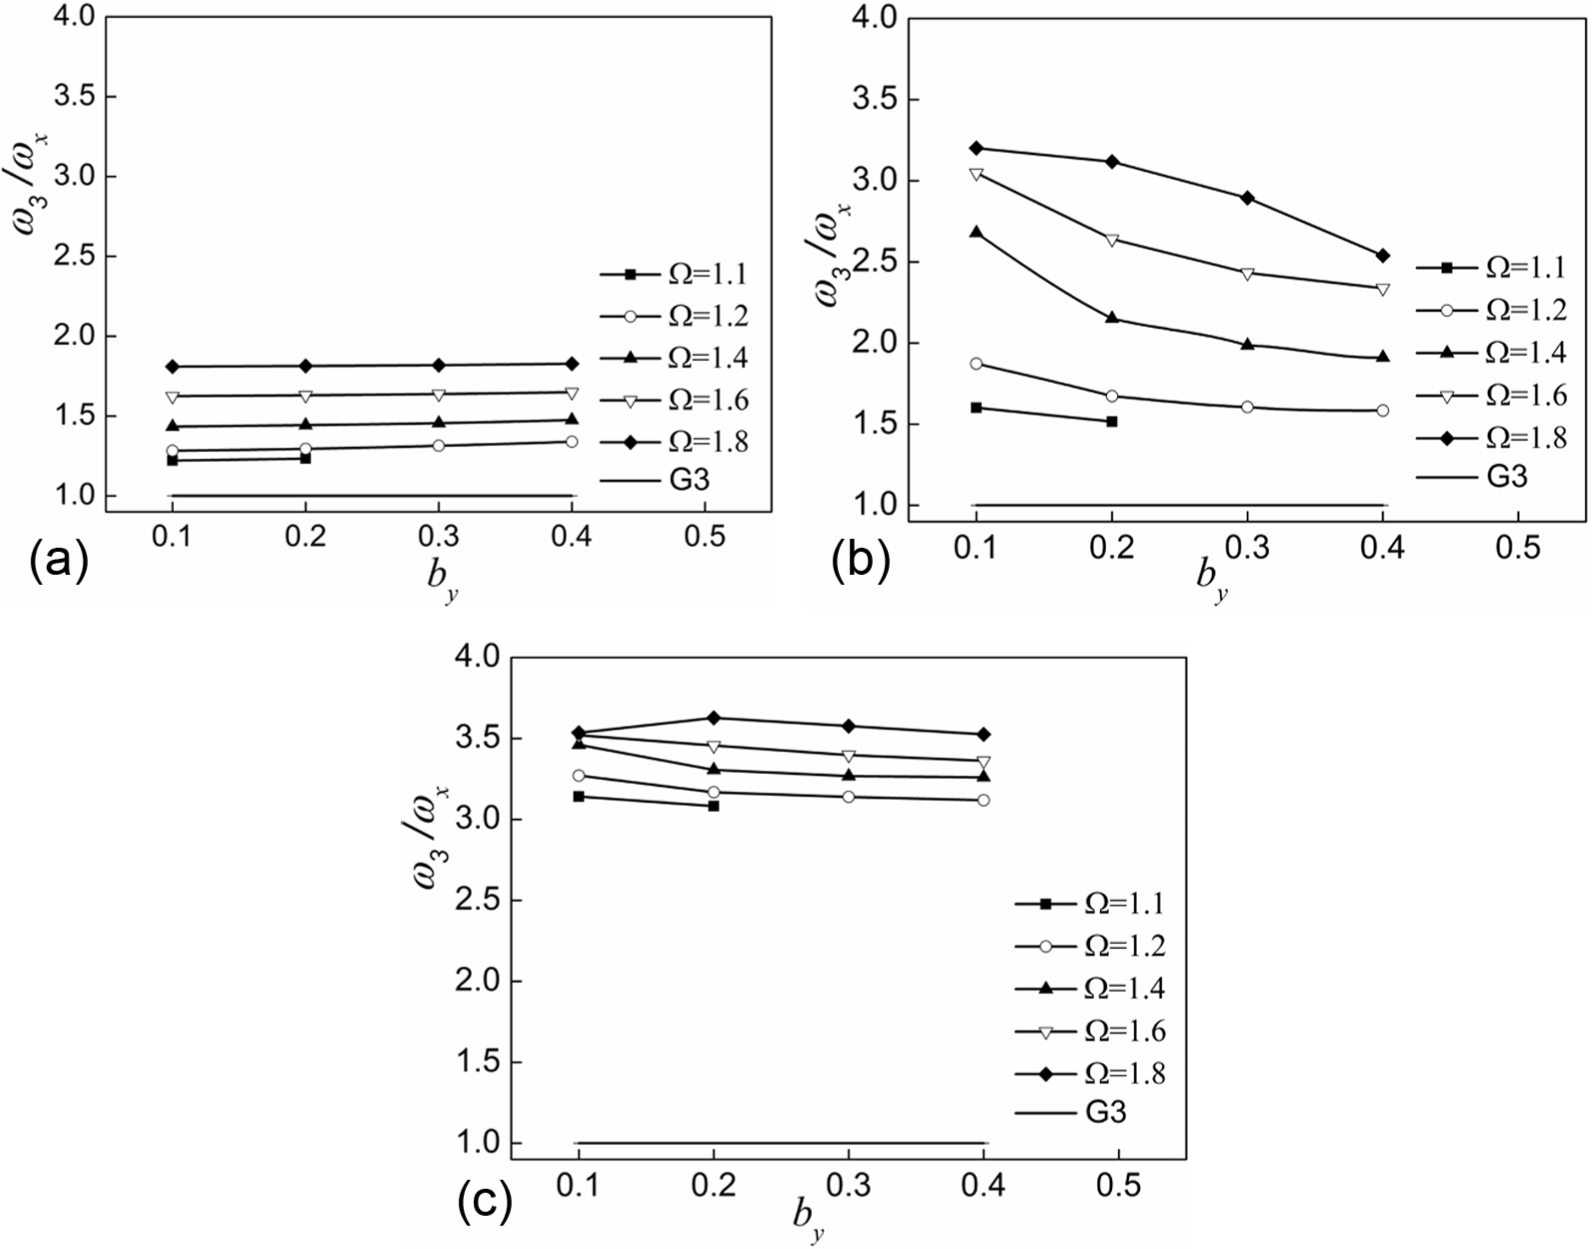
Effects of by and Ω on ω3/ωx in the different stages: (a) the first stage, (b) the second stage and (c) the third stage.
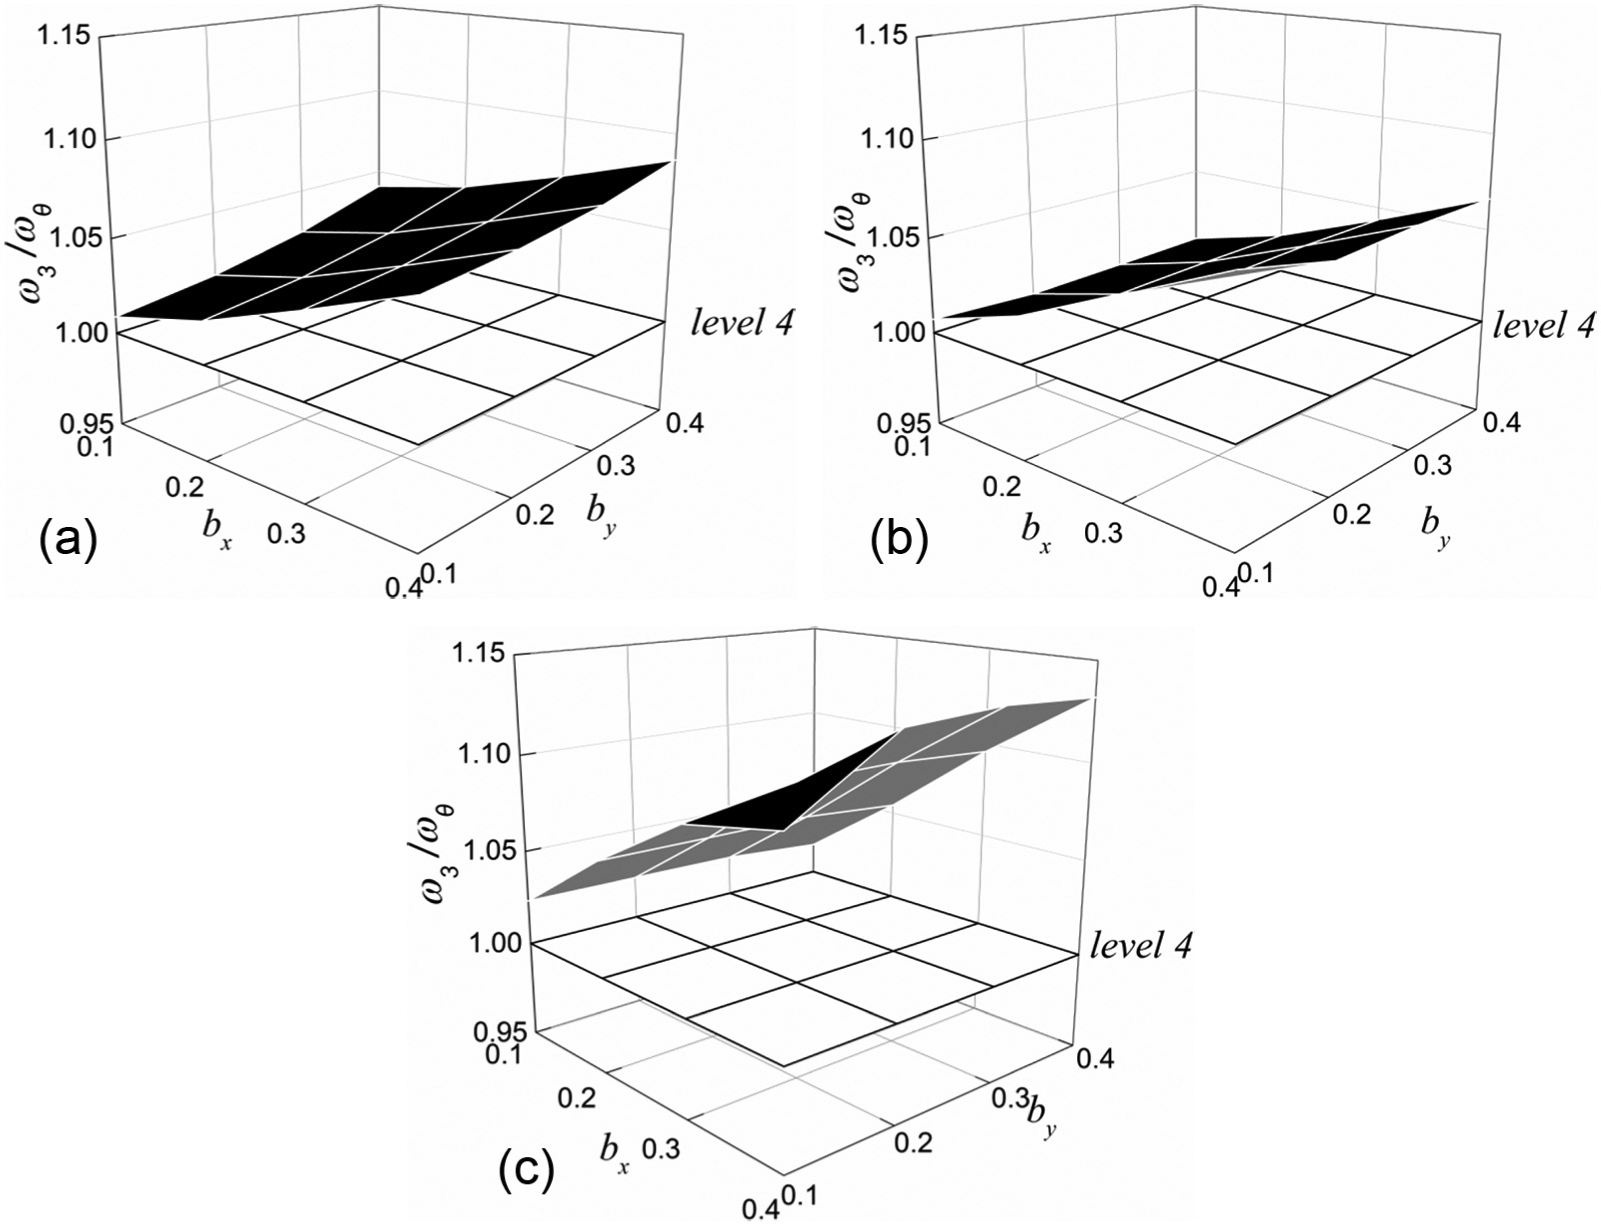
The effects of by and Ω on ω3/ωθ in the different stages are shown in Figure 17. From Figure 17, it can be seen that increasing by causes ω3/ωθ to deviate from G4 in the first stage; however, it causes ω3/ωθ to deviate from G4 of a system with a small Ω value (Ω = 1.1, 1.2) and causes ω3/ωθ to approach G4 of a system with a large Ω value (Ω = 1.6, 1.8) in the second stage. Nevertheless, ω3/ωθ deviates from G4 with an increased by of a structure with a large Ω value (Ω = 1.6, 1.8), and it approaches G4 of a structure with a small Ω value (Ω = 1.1, 1.2, 1.4) in the third stage. Figure 17 also demonstrates that increasing Ω with any by causes ω3/ωθ to approach G4. Moreover, for a certain system, ω3/ωθ deviates slightly from G4 from the first stage to the second stage and then to the third stage. The analysis reveals that increasing by and decreasing Ω cause ω3 to deviate from ωθ in the first stage. In addition, increasing by causes ω3 to approach ωθ of a system with a small Ω value; however, it causes ω3 to deviate from ωθ of a system with a large Ω value with the reduction in the overall lateral stiffness along the load direction of the system.
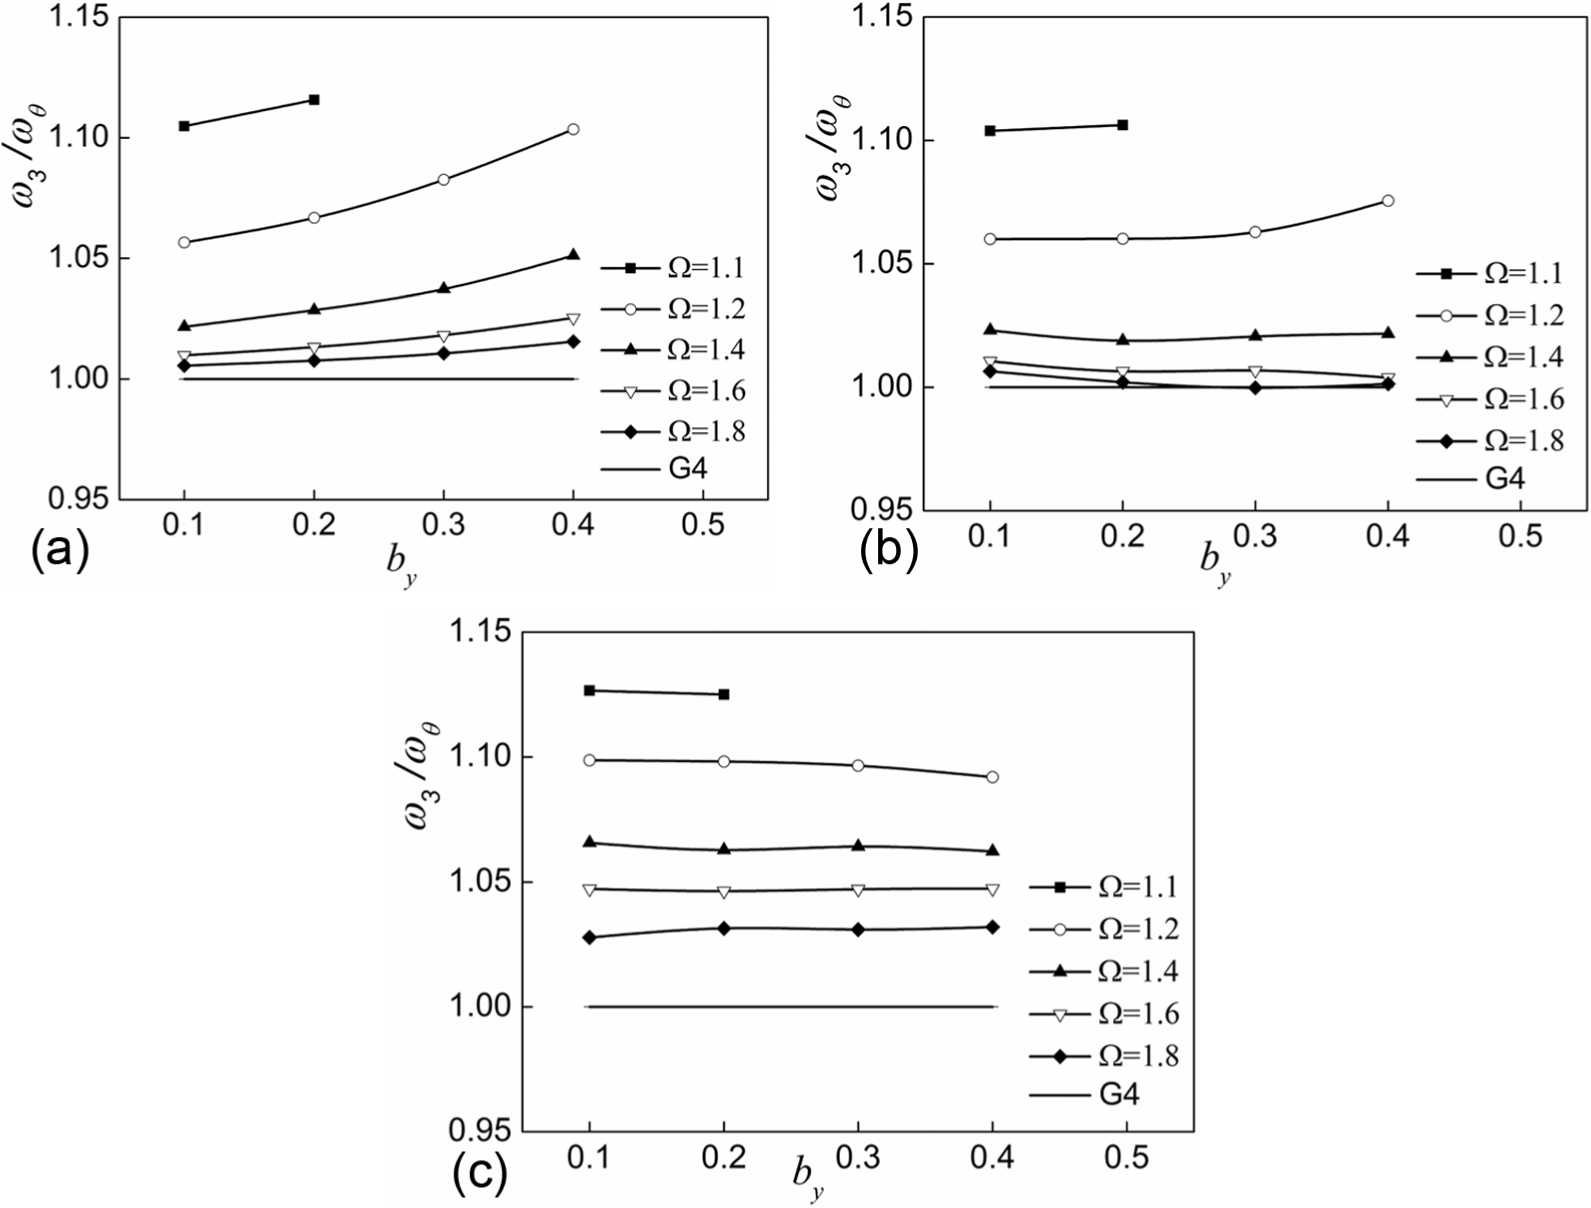
Effects of by and Ω on ω3/ωθ in the different stages: (a) the first stage, (b) the second stage and (c) the third stage.
Joint effects of bx and by on the normalized frequencies
The joint effects of a set of by and bx values on ω1/ωx, ω2/ωy, ω3/ωx and ω3/ωθ are presented in this subsection. Ω is kept constant at 1.4. For a certain system, different normalized stiffness eccentricities bx can be achieved by suitably modifying the distribution of the lateral load-resisting members in the y direction when the distribution of the lateral load-resisting members in the x direction, the total lateral stiffness and the total torsional stiffness are all kept constant. In other words, a set of bx values can be generated by changing Kyjd and Kyjc. Meanwhile, Kxjb, Kxja, a, b and the sum of Kyjd and Kyjc are kept invariant.
The joint effects of by and bx on ω1/ωx in the different stages are presented in Figure 18. The results reveal that increasing by and bx cause ω1/ωx to deviate from level 1. Therefore, the deviation distance achieves the maximum value when both by and bx are equal to 0.4 in this article. For a certain system, ω1/ωx becomes closer to level 1 from the first stage to the second stage and then to the third stage. This means that decreasing by and bx weaken the lateral-torsional coupling effect in the first-order mode. Therefore, the first natural frequency in the x direction of the asymmetrical structure ω1 approaches ωx of the equivalent symmetric system. That is, the translational deformation component in the structure response gradually increases as the coupled torsional deformation component decreases. In addition, the reduction in the overall lateral stiffness along the load direction weakens the lateral-torsional coupling effect in the first-order mode, causing ω1 to approach ωx. Greater by and bx values lead to a greater reduction in the effects of by and bx on ω1/ωx.
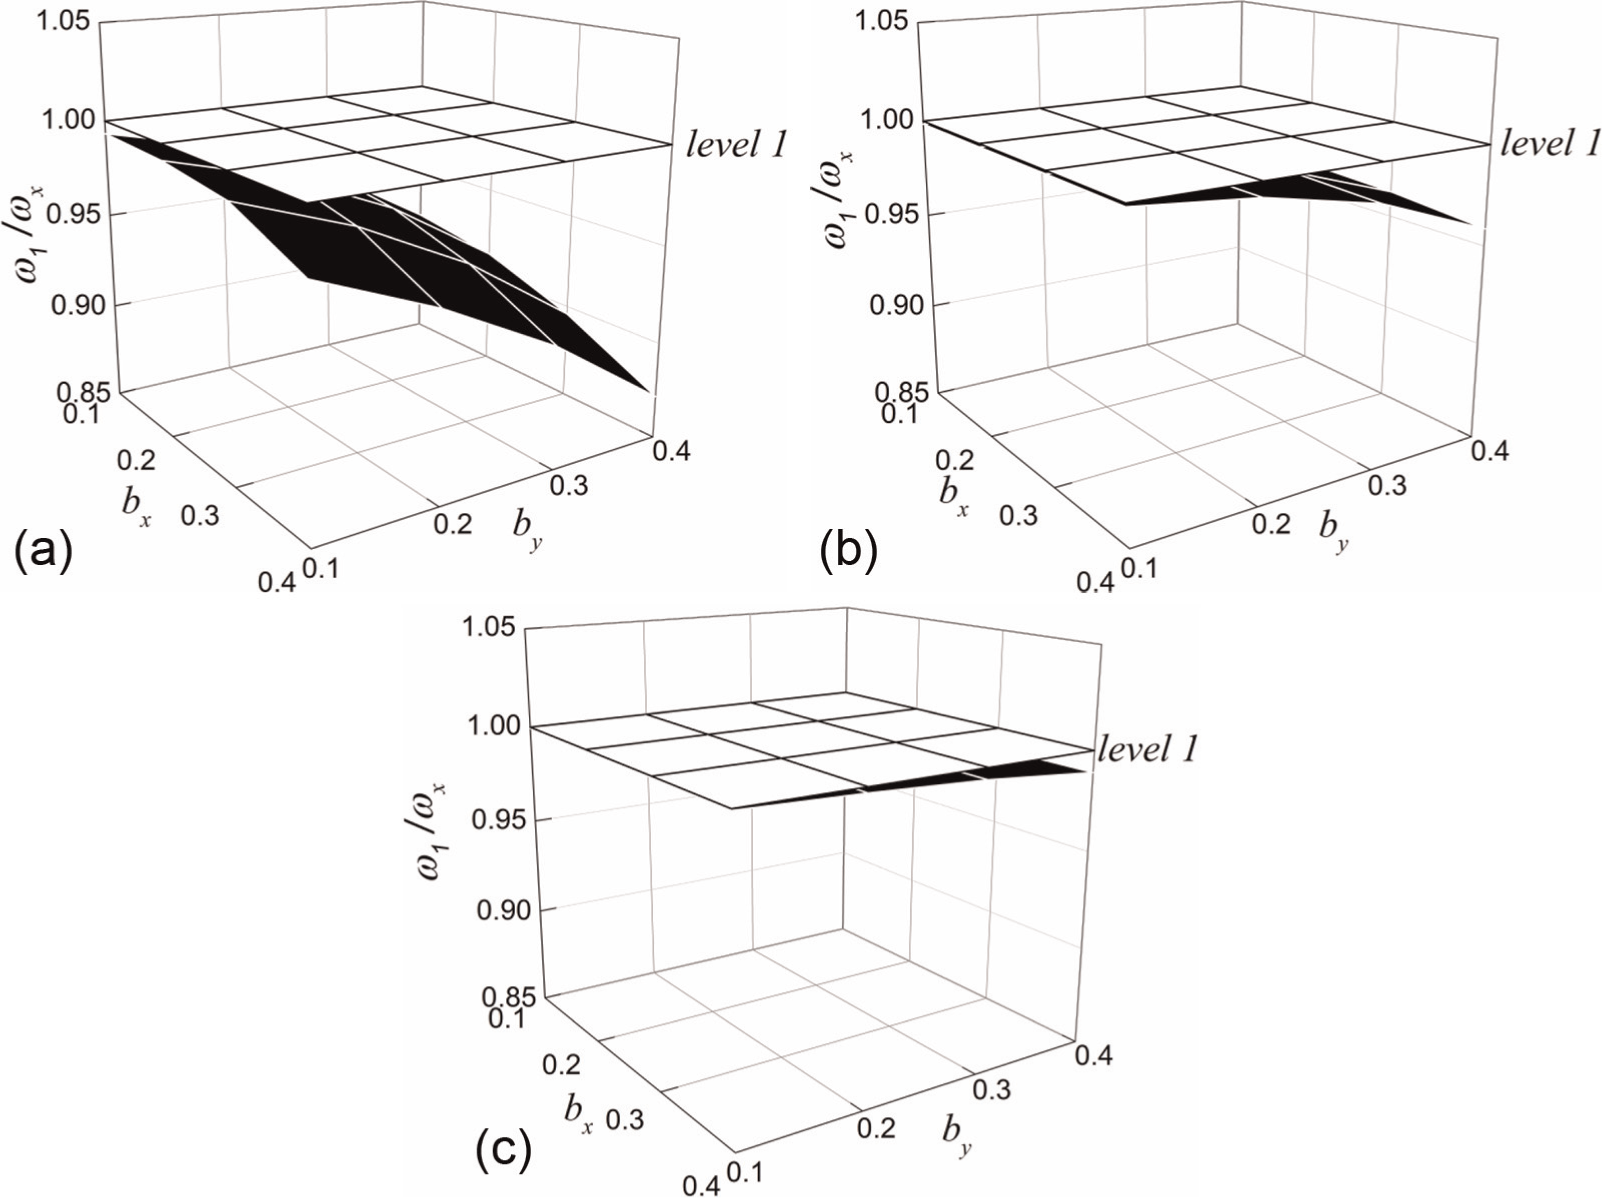
Effects of by and bx on ω1/ωx in the different stages: (a) the first stage, (b) the second stage and (c) the third stage.
The joint influences of by and bx on ω2/ωy in the different stages are given in Figure 19. It is evident from Figure 19 that increasing bx causes ω2/ωy to deviate from level 2. The effects of by with any bx on ω2/ωy are similar to the results studied in Figure 15. For a certain system, from the first stage to the second stage and then to the third stage, ω2/ωy greatly deviates from level 2. This shows that the reduction in the overall lateral stiffness in the x direction of the system enhances the lateral-torsional coupling effect in the second-order mode. Greater by and bx values strengthen the lateral-torsional coupling effect and cause ω2 to be farther from ωy.
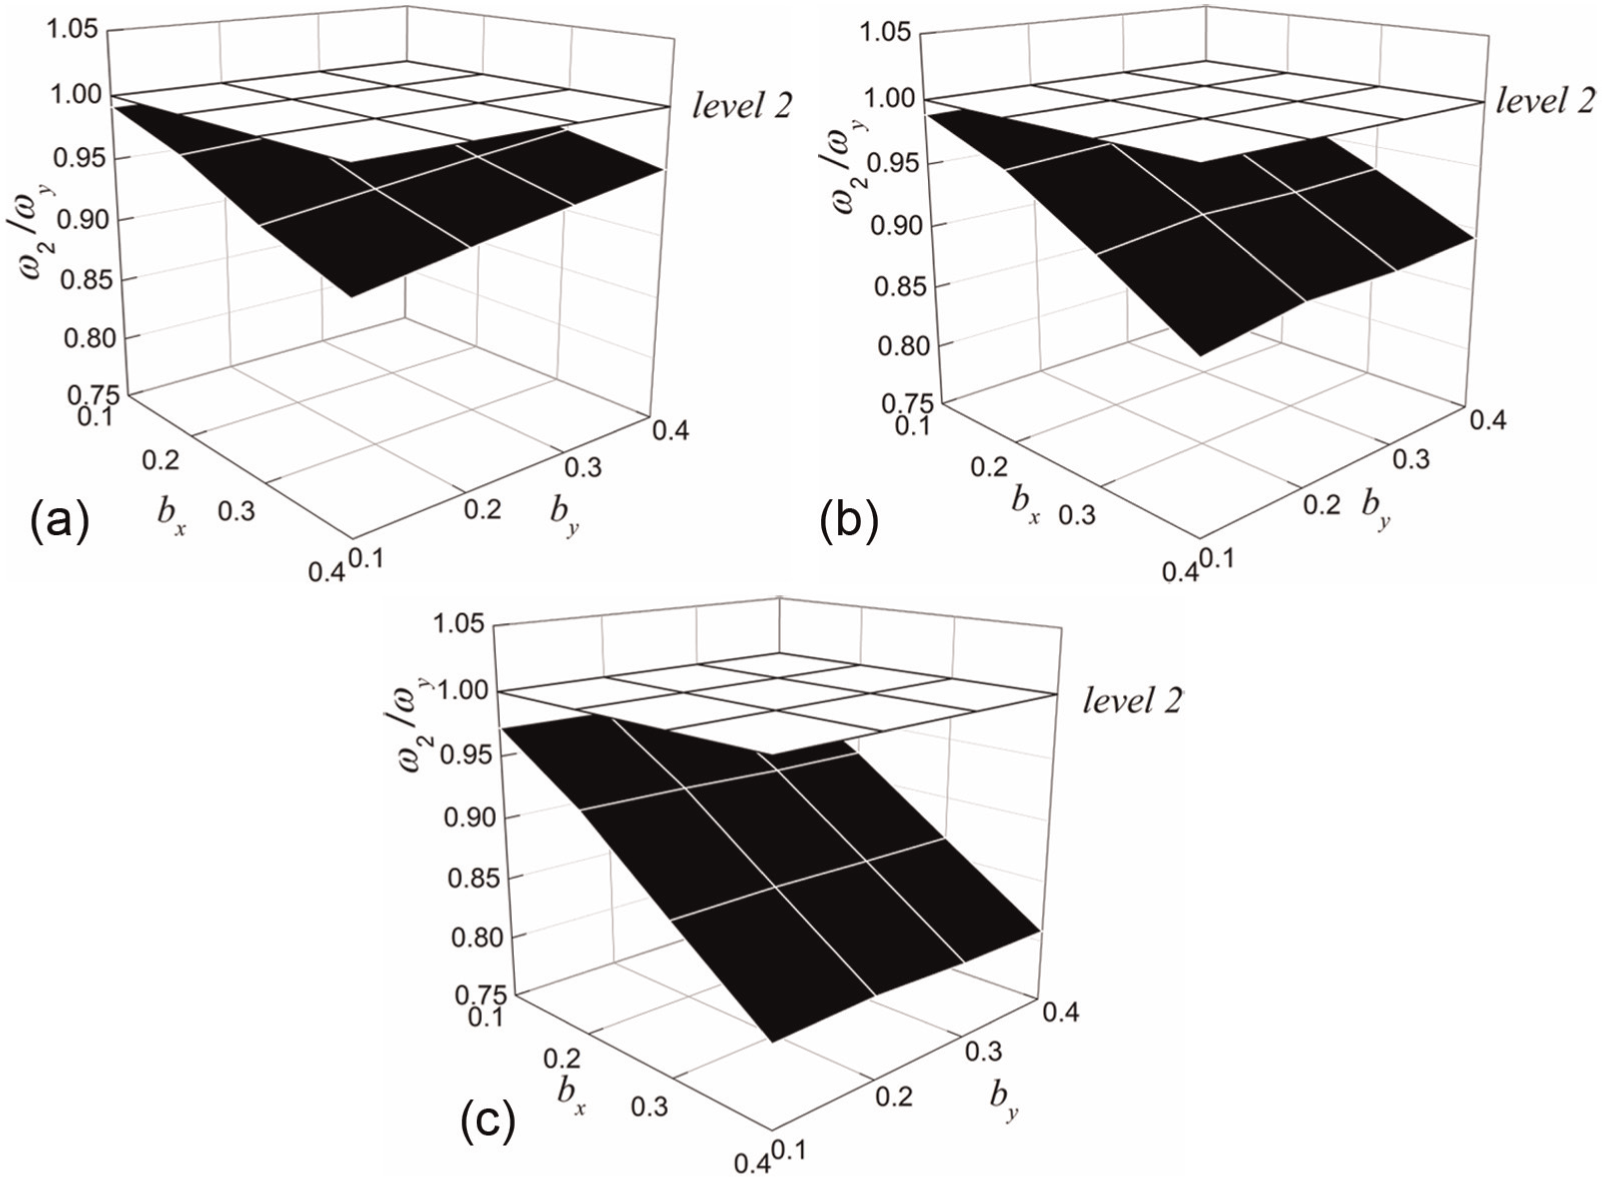
Effects of by and bx on ω2/ωy in the different stages: (a) the first stage, (b) the second stage and (c) the third stage.
Figure 20 presents the joint effects of by and bx on ω3/ωx in the different stages. According to the findings given in Figure 20, increasing bx causes ω3/ωx to deviate from level 3. The effects of by with any bx on ω3/ωx are similar to the results studied in Figure 16. For a certain system, from the first stage to the second stage and then to the third stage, ω3/ωx diverges greatly from level 3. This means that increasing bx causes ω3 to deviate from ωx. The yielding of the lateral load-resisting members in the x direction causes ω3 to deviate from ωx, and the effect grows more pronounced with greater by and bx values.
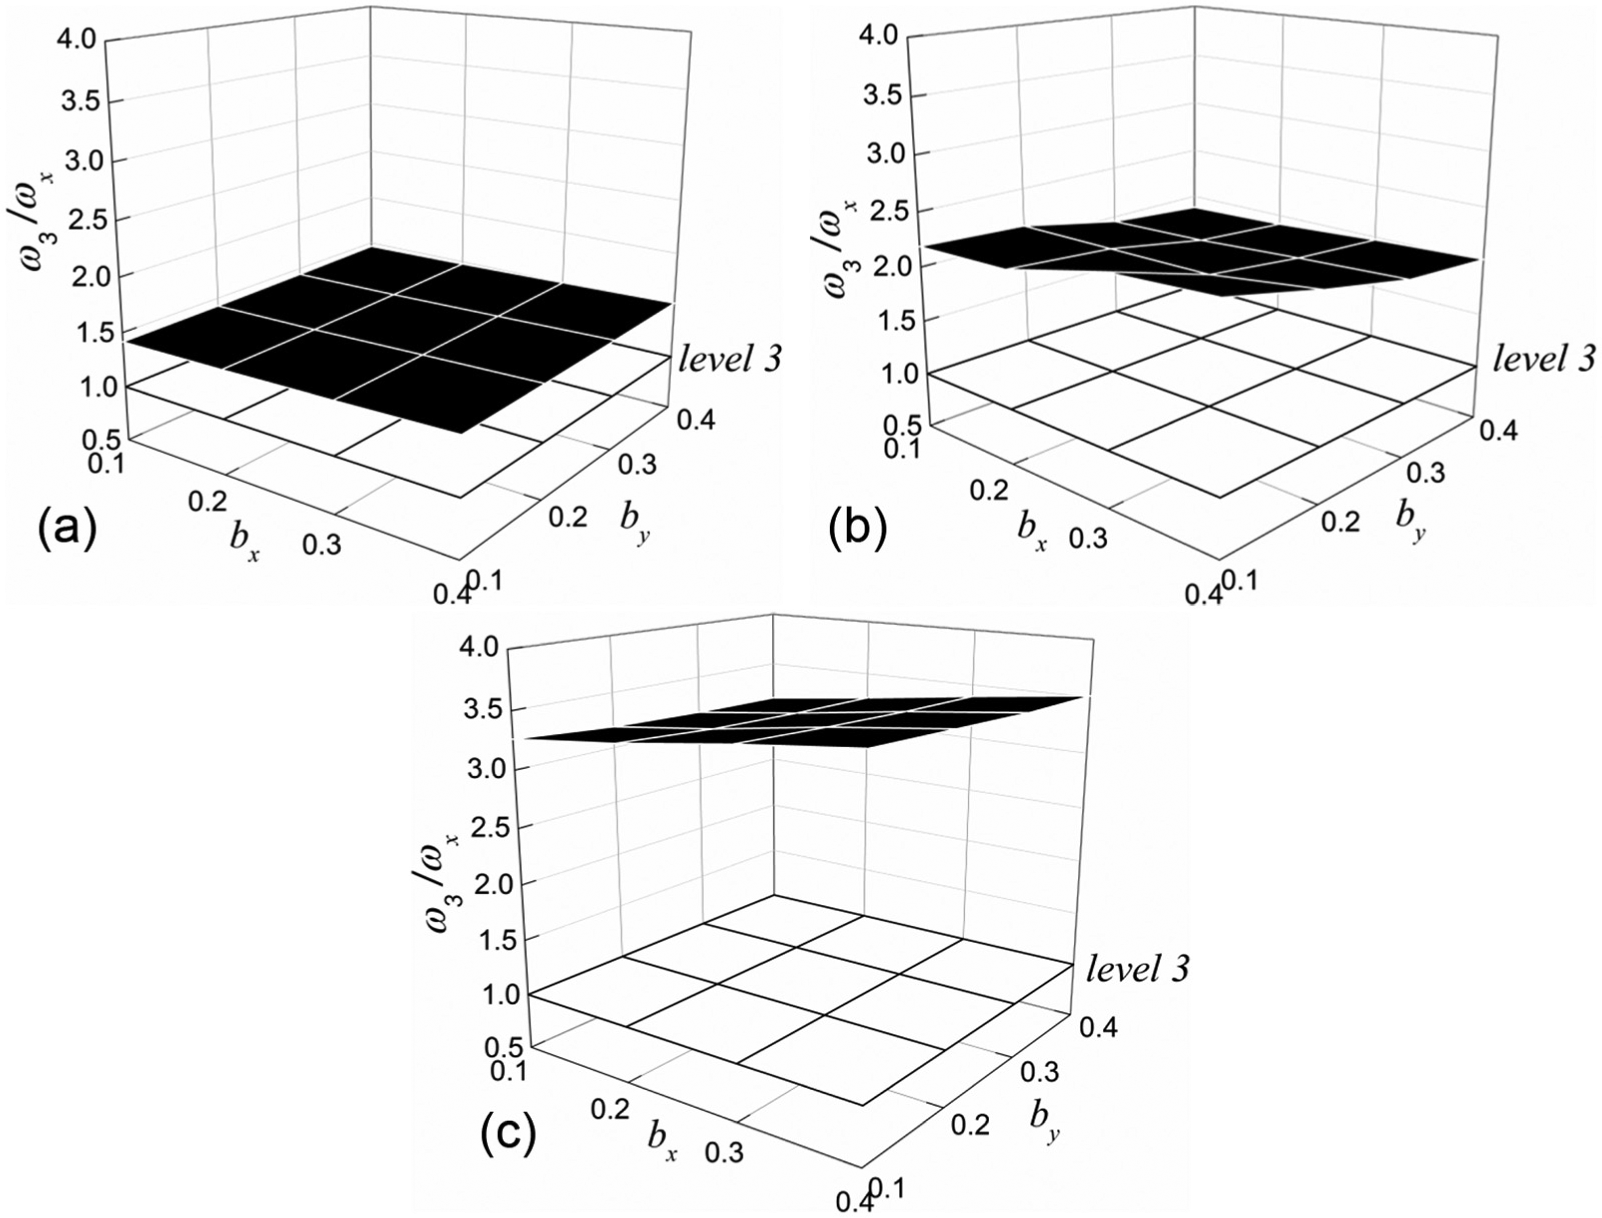
Effects of by and bx on ω3/ωx in the different stages: (a) the first stage, (b) the second stage and (c) the third stage.
The joint effects of by and bx on ω3/ωθ in the different stages are expressed in Figure 21. It can be noted from Figure 21 that increasing bx causes ω3/ωθ to deviate from level 4. The effects of by on ω3/ωθ in the different stages are similar to the results studied in Figure 17 when bx is less than or equal to 0.2 and Ω is kept constant at 1.4. Increasing by initially causes ω3/ωθ to deviate from level 4, and then, it approaches level 4 in the third stage when bx is above 0.2. That is, increasing bx causes ω3 to deviate from ωθ. Increasing by causes ω3 to deviate from ωθ in the first stage and then approach ωθ in the second stage. However, increasing by causes ω3 to approach ωθ of a structure with a small bx value. Additionally, it causes ω3 to first deviate from ωθ and then approach ωθ of a structure with a large bx value in the third stage. Moreover, for a certain system, ω3 deviates slightly from ωθ from the first stage to the second stage and then to the third stage.
Effects of by and bx on ω3/ωθ in the different stages: (a) the first stage, (b) the second stage and (c) the third stage.
In addition, it can be noted that the variation trend of ω1/ωx with increasing by of any bx value is similar when Ω is kept constant, likewise for ω2/ωy and ω3/ωx. However, the variation trend of ω3/ωθ with increasing by is related to the values of Ω and bx.
Discussion
Uncoupled torsion to lateral frequency ratio
It can be seen from our analyses that the asymmetrical system with a larger Ω value has a larger torsional stiffness and a larger ratio of torsional stiffness to lateral stiffness; thus, the lateral-torsional coupling effect and the torsional effect will be weak. Therefore, it will be good practice in design to achieve a large Ω value, thereby avoiding torsion failure.
The influences of Ω on the system in the inelastic stage are obviously different from those in the elastic stage. To explain these, Figures 14 and 15 can be referenced. Figures 14(a) and 15(a) indicate that as Ω increases from 1.1 to 1.8 with bx = 0.2 and by = 0.1, ω1/ωx and ω2/ωy increase from 0.9567 to 0.9970 and from 0.9224 to 0.9877, respectively. Nevertheless, ω1/ωx and ω2/ωy, respectively, increase from 0.9993 to 0.9995 (Figure 14(c)) and from 0.8825 to 0.9568 (Figure 15(c)) as Ω increases when the structure is excited into the third stage. Namely, the influence of increasing Ω is not pronounced on ω1/ωx, but it is notable on ω2/ωy in the inelastic stage. This is because that the yielding of the members leads to a great reduction in the overall lateral stiffness along the load direction and the overall torsional stiffness in the third stage, but the lateral load-resisting members in the y direction are still in the elastic stage. Accordingly, the effect of an increased Ω value on ω1/ωx becomes weak, and the influence of an increased Ω value on ω2/ωy remains strong.
Normalized stiffness eccentricities
The analyses indicate that the increase in by and bx enhances the lateral-torsional coupling effect in the first-order mode. However, the influence degrees of by and bx are considerably different. To explain this, Figure 18(a) can be studied. For a system with Ω = 1.4 and bx = 0.2, ω1/ωx decreases from 0.9918 to 0.9126 as by increases from 0.1 to 0.4, and the percentage is −7.98%. However, for a system with Ω = 1.4 and by = 0.2, ω1/ωx decreases from 0.9791 to 0.9438 as bx increases from 0.1 to 0.4, and the percentage is −3.60%. The two percentages in the third stage are −0.92% and −0.05% (Figure 18(c)), respectively. The results indicate that by has a greater effect on ω1/ωx than bx. This is attributed to the fact that a more uneven arrangement of the members along the load direction leads to a greater torsion effect on the system.
For a system with Ω = 1.4 and bx = 0.2, ω2/ωy increases from 0.9705 to 0.9839 as by increases from 0.1 to 0.4, and the percentage is 1.38%. However, for a system with Ω = 1.4 and by = 0.2, ω2/ωy decreases from 0.9924 to 0.9282 as bx increases from 0.1 to 0.4, and the percentage is −6.47% (Figure 19(a)). The two percentages in the third stage are −0.42% and −16.22% (Figure 19(c)), respectively. The results indicate that bx has a more obvious impact on ω2/ωy than by in the third stage. This is because that the yielding of the members greatly reduces the overall lateral stiffness in the x direction and the overall torsional stiffness. However, the members in the y direction are still in the elastic stage. Accordingly, the effect of an increased bx value on ω2/ωy remains strong, and the impact of increasing by on ω2/ωy becomes weak.
Applicability
The analyses are carried out on bidirectional asymmetric three-storey dual lateral load-resisting models. The simplification model is a shear-torsional type series rigid plate layer model. The lateral load distribution along the height of the structure adopts an inverted triangular form, and the effects of the different lateral load distributions on the results are not considered. The restoring force model of each member is described by the bilinear hysteretic model without considering the influence of concrete crack. For the pure shear type layer model, it is assumed that the inflection point is located at the middle part of the member. These assumptions bring some limitation to this analysis. The analysis results may be not valid for other types of structures that do not meet these conditions. Although the results are obtained from bidirectional asymmetric three-storey buildings, they can also aid researchers in better understanding the lateral-torsional coupling behaviours of bidirectional asymmetrical multi-storey buildings in the inelastic stage. The results may also provide some directions for optimizing the designs of relevant structures. Moreover, the proposed method in this article can provide some suggestions for studying other forms of asymmetric multi-storey buildings.
The model used in this article is simplified from the bare frame, and the influences of infill walls are not considered. When adding infill walls in the simplification model, taking into consideration that infill walls can significantly increase the initial lateral stiffness of the frame, the natural periods calculated in the elastic stage can take 70% of the periods calculated from the simplification model of the bare frame (JGJ3-2010, 2011). In inelastic analysis, it can be suggested that the effects of the infill wall are not considered due to the fact that the floor shear stiffness of the infill wall can be reduced under a small external force (Miao, 2006). For a shear wall structure, it should be easier to establish a corresponding simplification model for the simplification method. The dual lateral load-resisting model can be formed by four merged shear walls through merging the shear walls of the same direction to the two sides.
Conclusion
The aim of this article is to introduce a new method to illustrate the lateral-torsional coupling behaviours of bidirectional asymmetrical multi-storey buildings through the whole process from the elastic stage to the inelastic stage under the exterior loads. The effects of uncoupled torsion to lateral frequency ratios and the stiffness eccentricities on the normalized frequencies through the whole load process are analysed and discussed. It can be clearly seen that the lateral-torsional coupling behaviours in the inelastic stage are obviously different from that in the elastic stage. The main results are as follows:
When bx and Ω are kept constant, increasing by leads to strong lateral-torsional coupling effect in the first-order mode and weak lateral-torsional coupling effect in the second-order mode in the first stage. Thus, ω1 deviates from ωx, and ω2 approaches ωy. With the yielding of the lateral load-resisting members, an increased by continues to causes ω1 and ω2 to deviate from ωx and ωy, respectively. Moreover, increasing by causes ω3 to deviate from ωθ in the first stage, but it causes ω3 to approach ωθ of a system with small bx and Ω values in the second and third stages. Furthermore, increasing by also causes ω3 to first deviate from ωθ and then approach ωθ of a system with a large bx value. It also causes ω3 to deviate from ωθ of a system with a large Ω value.
A smaller Ω implies that the asymmetrical system has a smaller torsional stiffness and a stronger lateral-torsional coupling effect when bx and by are kept invariant. That is, decreasing Ω causes ω1, ω2 and ω3 to depart from ωx, ωy and ωθ, respectively.
When by and Ω are kept constant, increasing bx strengthens the lateral-torsional coupling effects of the regular asymmetrical multi-storey building. In other words, increasing bx causes ω1, ω2 and ω3 to deviate from ωx, ωy and ωθ, respectively. Simultaneously, ω3 also deviates from ωx.
Under the load in the x direction for a certain system, the gradual yielding of the lateral load-resisting members leads to a great reduction in the overall lateral stiffness along the load direction. The lateral-torsional coupling effect in the first-order mode becomes weak, causing ω1 to approach ωx and causing ω2 and ω3 to deviate from ωy and ωθ, respectively. In addition, ω3 also deviates from ωx.
Footnotes
Declaration of Conflicting Interests
The author(s) declared no potential conflicts of interest with respect to the research, authorship and/or publication of this article.
Funding
The author(s) disclosed receipt of the following financial support for the research, authorship and/or publication of this article: This work was financially supported by the National Science Foundation Project (Research Project Nos 51278335 and 51478312) and National Youth Science Foundation Project (Research Project No. 51208356), China.