
Abstract
A steel frame partially infilled with precast reinforced concrete wall (RPWF) is proposed as a new lateral resisting system for building structures. In this system, to achieve partially infilled construction, the precast reinforced concrete wall (RPW) is connected with the steel frame beam only through high-strength bolts. To investigate the seismic behaviour of steel frames strengthened by RPW, three test specimens (one-bay, one-storey and one-third scale) were constructed and tested under constant axial loading and reversed cyclic loading. The length-to-height ratio of the infilled wall was the parameter of the test study. The test results showed that partially infilled steel frames exhibited higher initial stiffness and higher loading capacity than the bare steel frame. The ductility and energy dissipation capacity of the RPWF were increased, whereas the length-to-height ratio of the RPW was decreased. Finally, theoretical and pushover analyses were developed to predict the ultimate loading capacity of the tested specimens, and the accuracy was validated by the test results.
Keywords
Introduction
Bare steel frames (BFs) and shear wall infill steel frames are two types of lateral load-resisting systems commonly used in building structures. BFs have several disadvantages under severe earthquakes, such as weaker lateral stiffness, large deformation and insufficient rotation capacity of the beam–column connections. Therefore, shear walls have become an attractive option for lateral load-resisting systems in high-rise buildings (Astaneh, 2001, 2002), and the steel frame with reinforced concrete (RC) infill wall system is one such example (Peng and Gu, 2013). In this system, steel columns and beams serve as boundary members to resist gravity loads and most overturning moments, whereas the RC infill walls carry the majority of the shear forces (Tong et al., 2005).
A wide range of research has been conducted to investigate the seismic performance of the steel frame with RC infill wall system. Experimental investigations on the lateral stiffness, strength and failure mode of steel frame with RC infill wall systems have been conducted (Holmes, 1961; Stafford, 1966). Liauw and Kwan (1985) performed a series of cyclic tests on steel frame with RC infill walls, and the results showed that the strength, stiffness and energy dissipation were determined by the placement of the shear connectors. A one-third scale, one-bay, two-storey, partially restrained steel frame with reinforced concrete infill wall (PSRCW) was developed by Tong et al. (2005), and cyclic behaviour analyses were conducted (Sun et al., 2011).
In recent decades, a large number of commercial stores with open lobbies have been constructed in modern residential apartments as their first storey. Because fewer RC infill walls are placed in the first storey compared with the higher storeys, these buildings often have a soft first storey. Therefore, deep beam (DB) was proposed (Kahn and Hanson, 1979) as a lateral resisting member, and their performance was investigated both theoretically and numerically (Horii et al., 1998; Kabele et al., 1999). High-strength bolts were proposed (Kanda et al., 1998) to connect the RC DBs with the frames. Precast members used in this lateral resisting system are convenient for fabrication and erection. Engineered cementitious composite (ECC) materials were used in RC DBs to repair or retrofit building structures, and seismic tests were performed (Kesner, 2003; Kesner and Bilington, 2005). ECC materials provided an inherent ability to dissipate energy under cyclic loads. Yanagisawa (2008) proposed that separating the RC infill wall from the RC moment frame by slits (gap width was 1.8% of the wall height) and different widths of these slits were used to adjust the inter-storey drift of the upper storeys. One-sixth scale tests of these infill walls were performed, and the test results showed that the slits could maintain similar behaviour to the bare frame up to 1.8% drift ratio. For the steel structures, experimental investigation of a four-fifth scale steel frame with slit-separated RC infill walls was conducted (Ju et al., 2012), and the seismic performance was compared to the RC wall infill steel frame.
The RC wall infill steel frame system is proposed as a lateral resisting system, and the system has several advantages in comparison with the traditional RC shear wall and slit-separated infill wall for the following reasons:
The length of the RC wall can be changed in a certain range to modulate the initial stiffness and lateral loading capacity of the framed structures.
The deformation of the RC wall is combined with shearing and bending deformation, which is efficient for the plastic development of materials.
The RPWF system has greater advantages in construction than the traditional RC infill wall systems because the precast RC wall can be easily and cost-effectively assembled in the constructing process.
This system can provide architectural spaces to install doors and windows, and it is convenient for assembling or removing. Thus, the RC wall can be used in building repair and retrofitting after earthquakes.
Experimental research was performed on two RC wall infill steel frames (RPWFs) and a BF with the same size. The results are presented in the following sections.
Experimental program
Specimen design
Three specimens were manufactured and tested in the experimental program, including two RPWF specimens coded as ‘RPWF-A’ and ‘RPWF-B’ (with different length-to-height ratios of RC wall: RPWF-A is 0.5 and RPWF-B is 1.33) and one BF with the same size. All specimens were one-bay and one-storey, as shown in Figure 1. Due to the loading capacity of the test machine, the specimen sizes were designed as approximately one-third scale of the prototype structure. All RPW specimens had a height of 900 mm and a thickness of 60 mm. Both the horizontal and vertical reinforcing steel bars of the RPW specimens consisted of two layers of 8 mm in diameter spaced at 75 mm. The geometrical dimension details of the test models are illustrated in Figure 2, and the dimension details of the RPW specimens are shown in Figure 3.
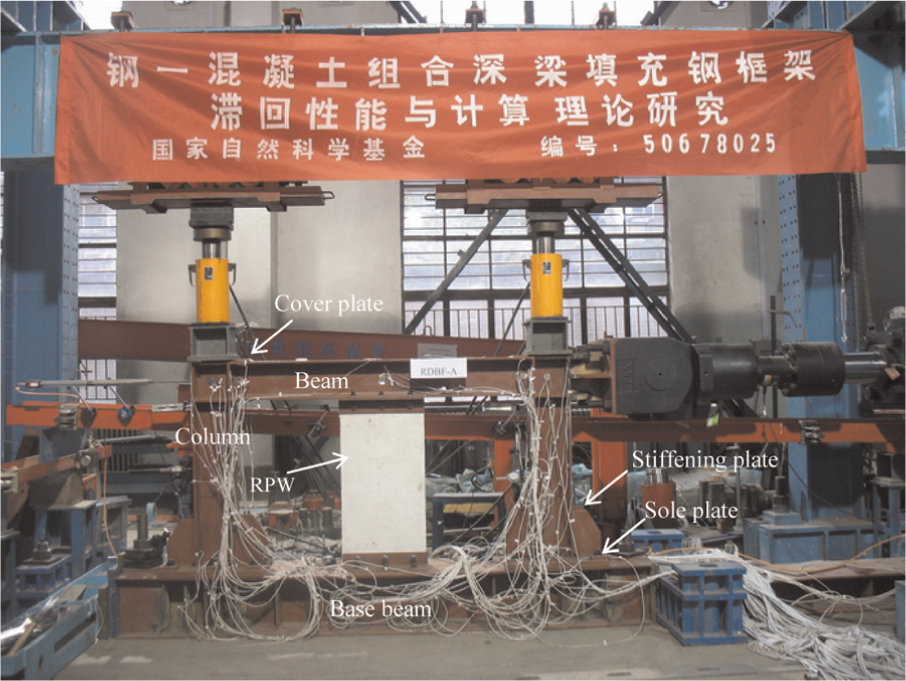
Test set-up.
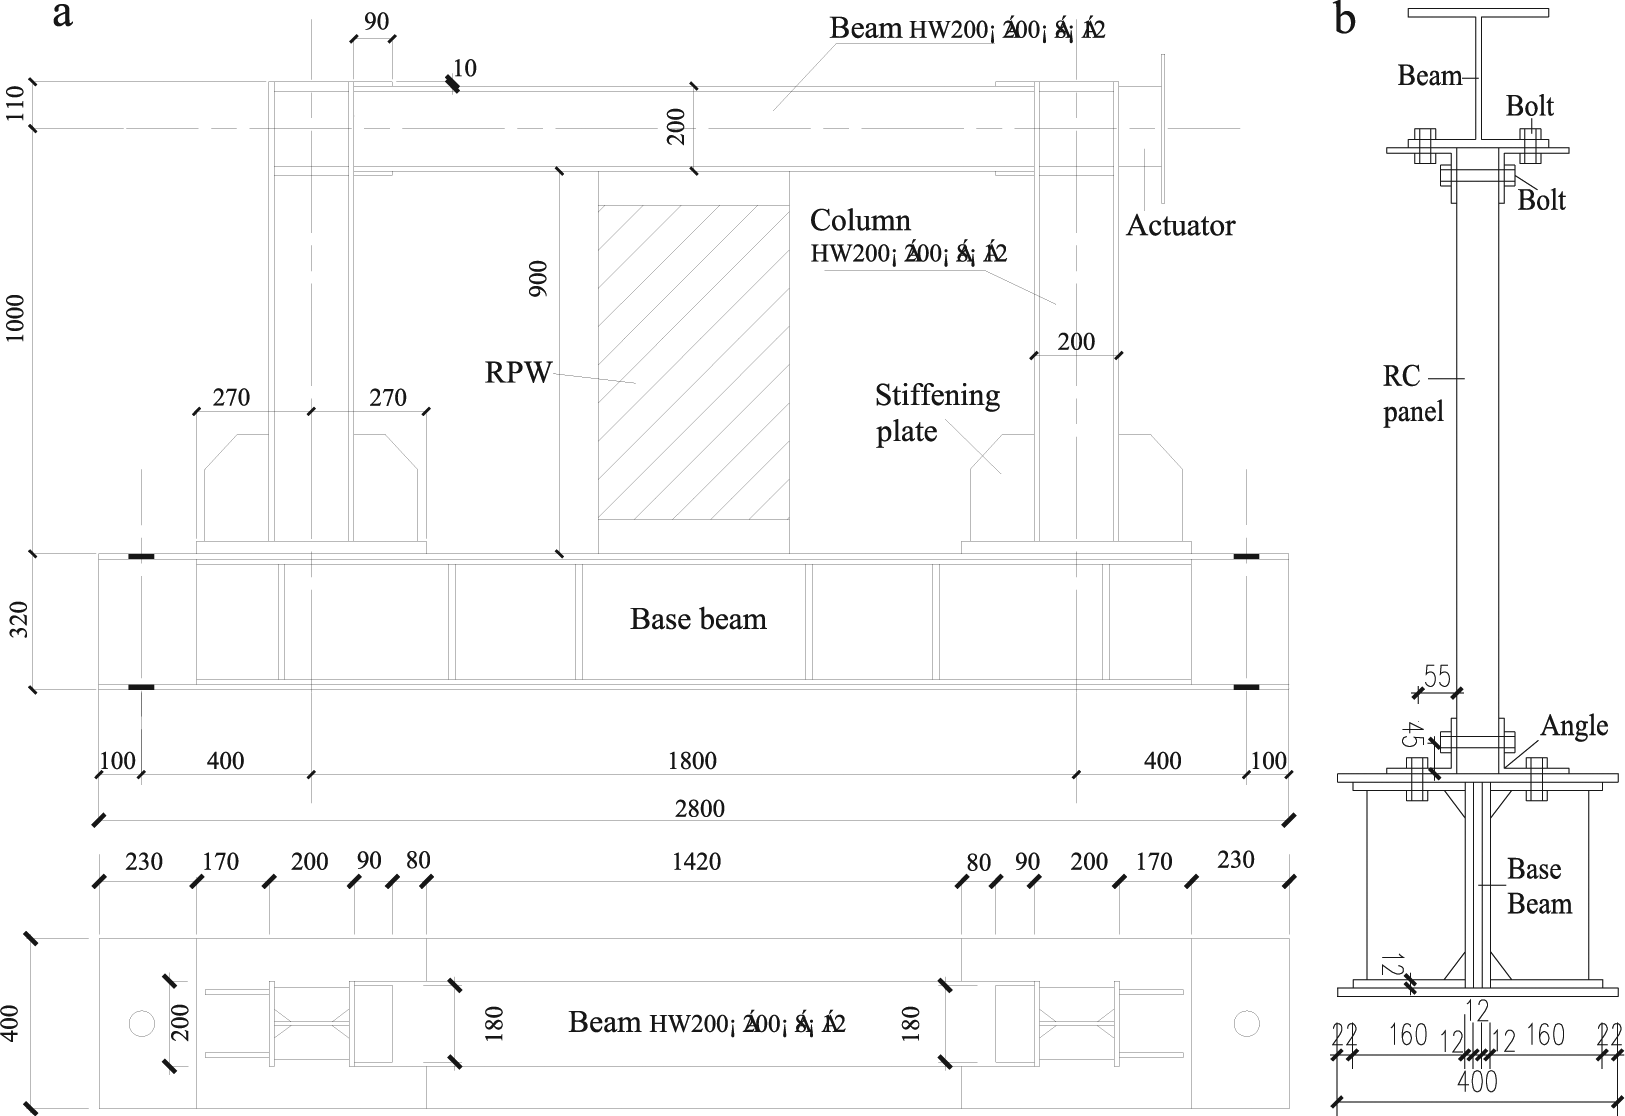
Geometric dimensions of the test models: (a) front view and (b) side view.
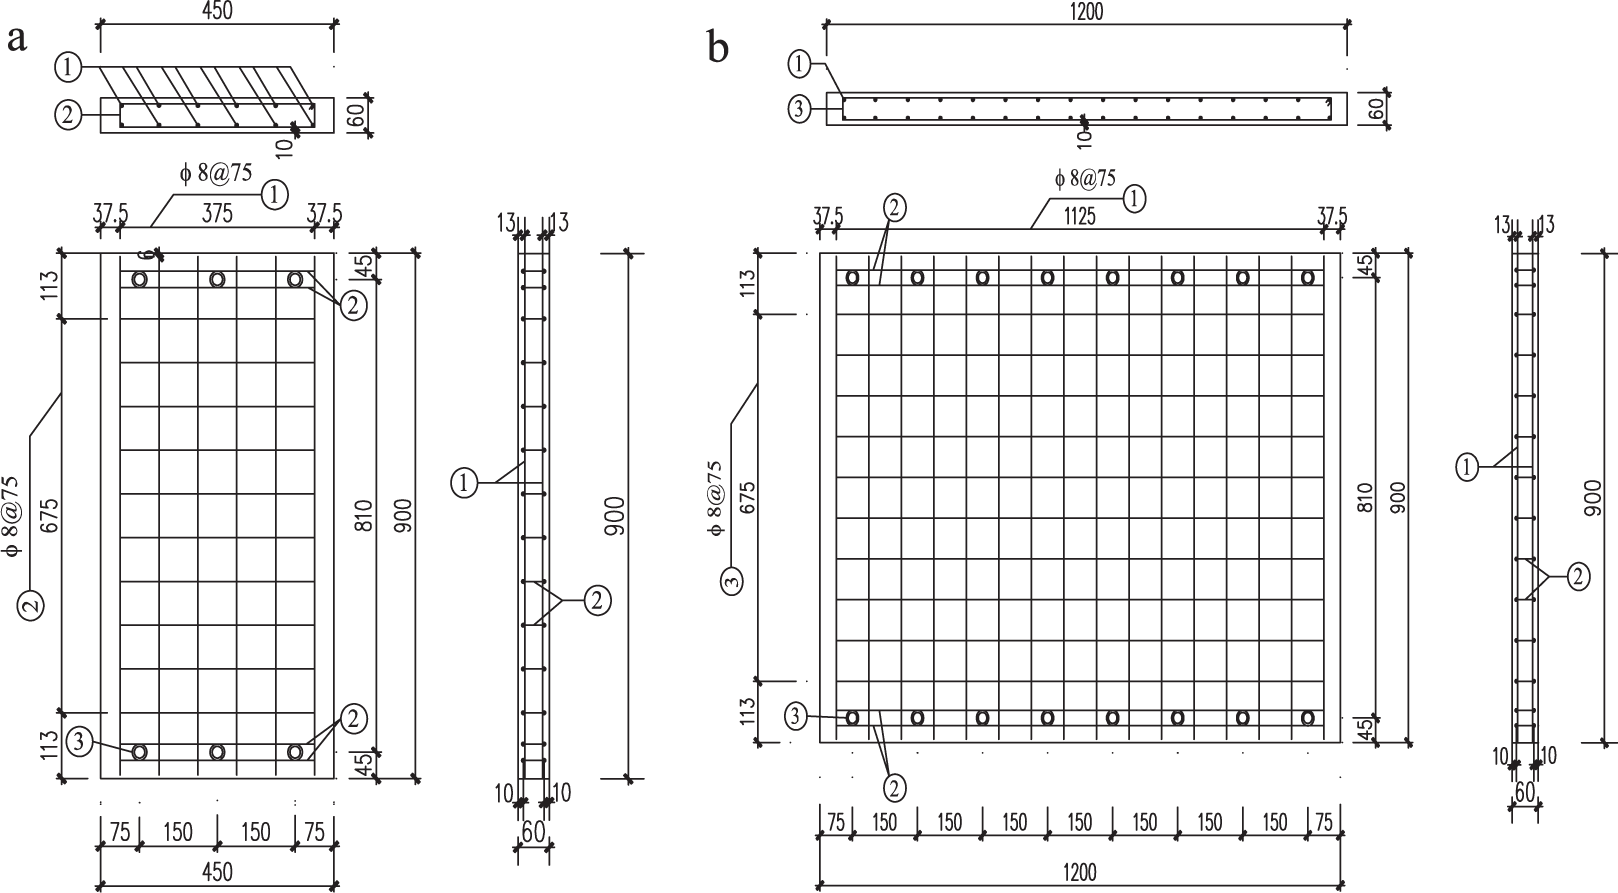
Details of the RC wall panel: (a) RPW-A and (b) RPW-B (mm).
Test set-up and specimen fabrication
The test set-up, including the reaction frame, loading device, actuator and specimens, is illustrated in Figure 4. All specimens were tested under both constant axial load and cyclically increasing lateral load. To secure the specimens connect to the strong floor during the test, a large rigid base beam was constructed and was bolted to the strong floor by anchorage bolts. A 300-kN jack was used to provide axial load on each column, which was connected to the rigid top-beam, as shown in Figure 1. Two rolling supports were used to allow the specimen to move freely in-plane and ensured that the axial load was always concentric. An actuator was installed to provide lateral load. The fabrication processes of the specimens started with the manufacturing of the steel frame. Then, the beam and column members were joined together directly by a groove weld, and the steel columns were connected with sole plates by fillet welds. All welded seams were 5 mm in thickness. Holes were created in the bolt locations on the steel beams, angles and RC wall left side in advance. Then, high-strength bolts were used to connect the RC wall panel and angles with the frame beam. Finally, anchorage bolts were used to connect the steel frame and the base beam, and bearing pads were established to avoid local stress concentration of the steel plate at the loading point.

Schematic of the test set-up.
Material properties
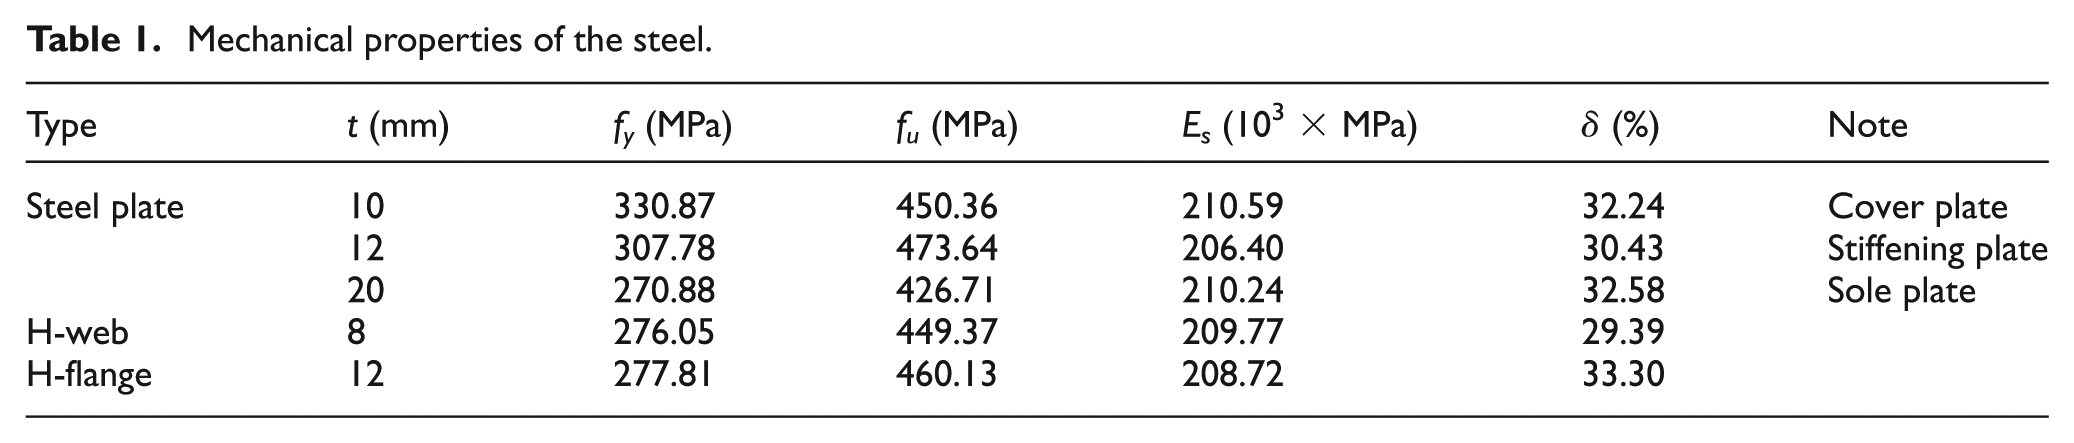
Coupon tests were conducted on the steel materials used in the test program (Q235B) to determine the monotonic uniaxial material behaviour in accordance with the Chinese standard GB/T 2975 (1998). The material properties of the steel members were taken as the averages from all coupon tests, and the test results are given in Table 1, where t is the steel plate thickness; fy, fu, Es and δ are the steel yield stress, ultimate strength, elastic modulus and elongation ratio, respectively. High-strength bolts were designated as M20(8.8), which indicates that the yield stress of the bolts was 800 N/mm2, and the yield ratio was 0.8. Furthermore, the pre-tensile force applied to each bolt was 125 kN.
Mechanical properties of the steel.
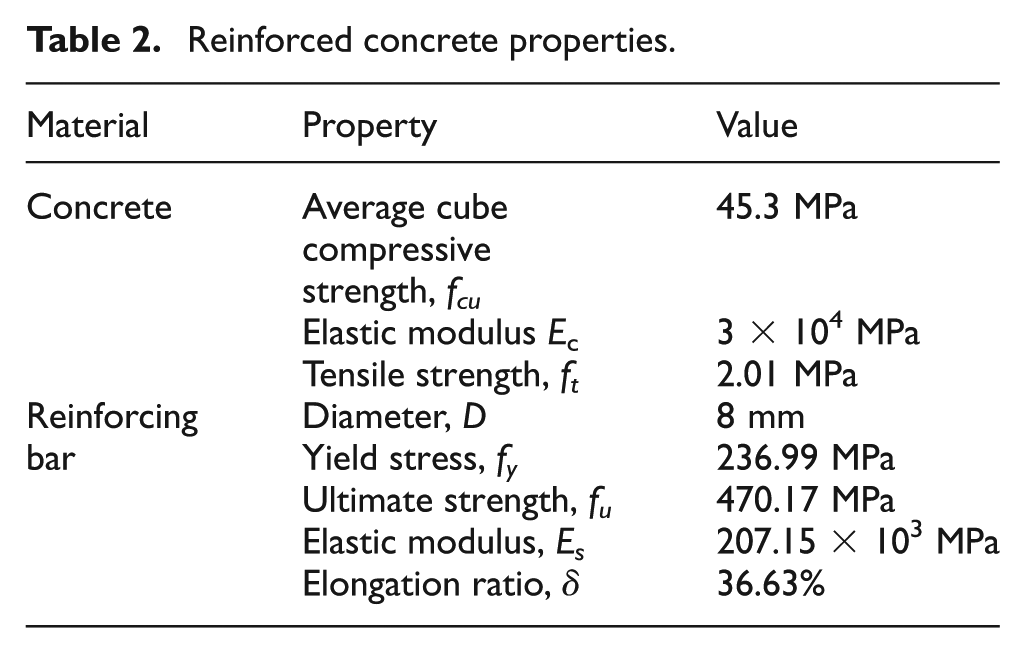
The concrete quality was C30, and the grade of the reinforcement steel bars was HPB235. Three groups of standard 28-day concrete cubes (150 mm × 150 mm × 150 mm) were produced in accordance with the Chinese standard GB50081(2002). Tensile tests were performed to establish the monotonic stress–strain relationship of the reinforcements. The material properties of the concrete and the reinforcement bars used in the tests are presented in Table 2.
Reinforced concrete properties.
Measurements and loading patterns
To measure the specimens’ global and local responses, several linear variable displacement transducers (LVDTs) were placed at the centre-line height of the frame beams and base beams on the direction of the actuator, and additional LVDTs were placed at the bottom and the top of the RPWs. A series of uniaxial strain gauges were placed on the I-shaped steel members and reinforced steel bars. Furthermore, several rosette strain gauges were placed on the beam–column joints to measure the principal stresses at these locations.
To simulate a severe earthquake condition, a cyclic load was applied to the specimens according to the Chinese standard JGJ 101 (1996). Before reaching the yield displacement, the lateral load was increased in multiples of 1 mm. Once the yielding load was reached, multiples of 2 mm (2, 4, 6,…) were applied to the BF specimen, whereas multiples of 3 mm (3, 6, 9,…) were applied to the RPWF specimens, and the latter cycles were repeated three times for each displacement cycle. The yielding load for the loading patterns was determined by two methods: (1) when a certain point of steel yielded and (2) when an obvious turning point occurred in the P–Δ curve. The loading patterns of three specimens are depicted in Figure 5.
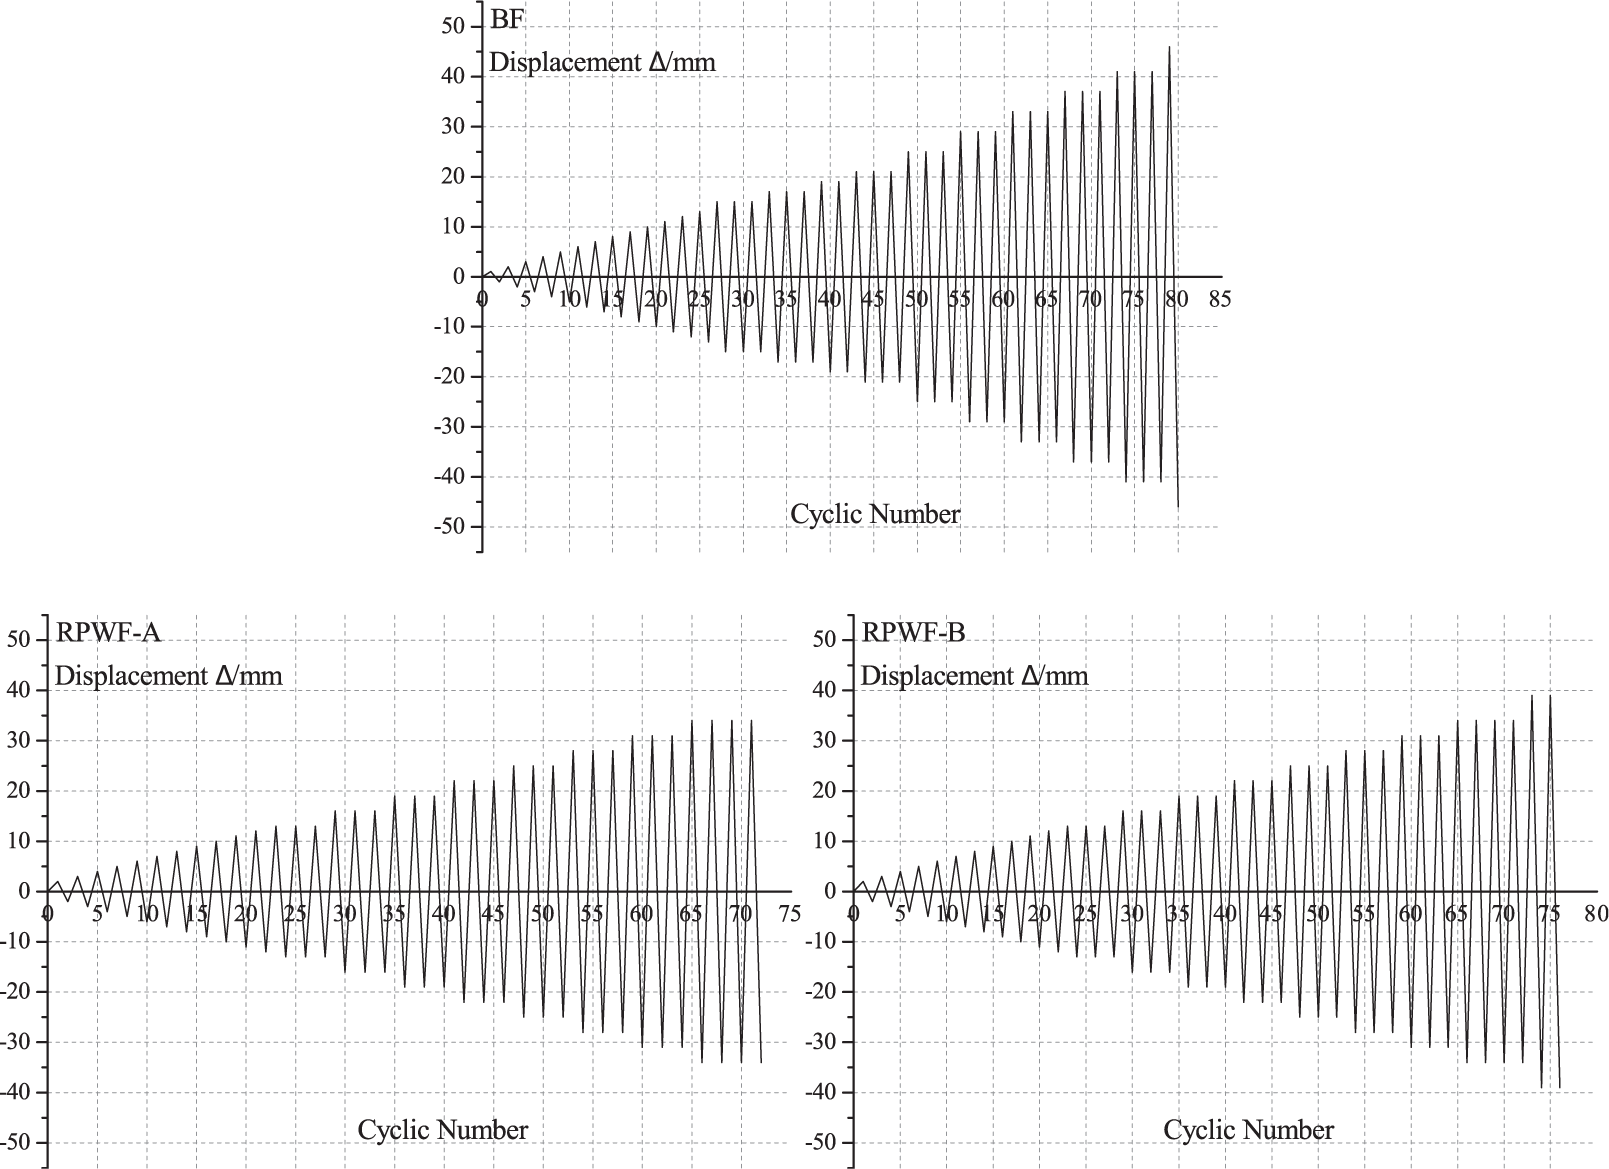
Loading patterns of the test specimens.
Test results and analysis
Failure modes
RPWF-A
The failure mode of RPW-A was combined bending damage and shearing destruction. When the storey displacement reached 4 mm, the first inclined crack was detected at the end of the wall, and the maximum total shear force was 221.32 kN in this cycle. The majority of new cracks appeared at the upper right and lower left of the wall when the storey displacement reached 6 mm. The total force at this time was 309.68 kN and the maximum width of the crack was approximately 0.2 mm. Some of the cracks extended upwards or downwards into the RC wall, and a principal crack formed oriented at approximately 45° to a horizontal line. During the 13-mm cycle, a few more cracks at the middle region formed, and other cracks progressed as shown in Figure 6(a). The maximum total shear force at the cycle of 13 mm was 563.40 kN, and the value of the energy dissipation coefficient was approximately 0.53. When the storey displacement reached 16 mm, minor spalling of the concrete occurred at the corner on the upper left side of the wall, as shown in Figure 6(b), and buckling occurred at the flange of the steel frame column. The total shear force was 604.86 kN at the cycle of 16 mm, and the energy dissipation coefficient was approximately 0.66. During the 19-mm cycle, concrete was crushed at the bottom left corner region of the wall, as shown in Figure 6(c), and the stirrup was exposed. The maximum total shear force was 641.85 kN in the 19-mm cycle, and the value of energy dissipation coefficient was approximately 0.76. The main cracks formed when the displacement reached 34 mm, as shown in Figure 6(d). The RC wall was damaged, and most of the shear force was carried by the steel frame. The total shear force was 743.07 kN in the 19-mm cycle, and the energy dissipation coefficient was approximately 1.24. The RPWF-A achieved its maximum load-carrying capacity when the storey displacement reached 43.98 mm, the weld of cover plate on the beam–column joint was cracked and the gusset plate of the joint was torn, as shown in Figure 6(e).
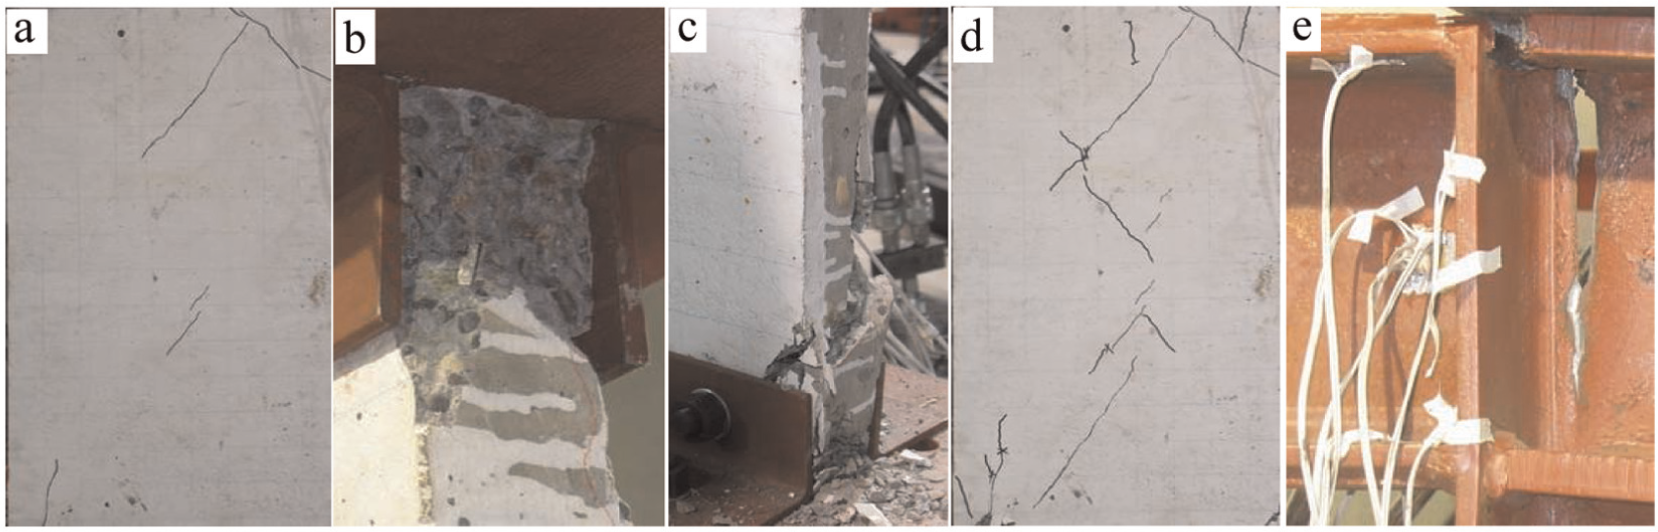
Typical phenomena of RPWF-A: (a) Δ = 13 mm, (b) Δ = 16 mm, (c) Δ = 19 mm, (d) Δ = 34 mm and (e) Δ = Δmax.
RPWF-B
Compared with specimen RPW-A, the failure mode of RPW-B was dominated by shearing failure. The first crack of RPW-B appeared at the lower left corner of the wall when the storey displacement was 4 mm, as shown in Figure 7(a), and the total shear force was 302.69 kN. When the displacement reached 6 mm, the first diagonal crack was detected between the third and the forth bolts at the bottom region of the wall. The crack formed oriented at approximately 45° to a horizontal line, and the total shear force was 425.80 kN. More cracks formed in the middle region of the wall, and minor spalling of the concrete occurred on the upper right corner of the wall, as shown in Figure 7(b), when the displacement reached 13 mm. The maximum total shear force was 629.64 kN, and the energy dissipation coefficient was approximately 0.53, which was equal to the RPWF-A at the same loading cycle. Local buckling of the flange in the steel frame column at the left side occurred when the storey displacement reached 19 mm, as shown in Figure 7(c). The maximum total shear force was 886.14 kN, and the energy dissipation coefficient was approximately 0.73. After the loading cycle of 19 mm, several diagonal cracks formed in the middle region of the wall and the concrete crushed near the region of the main diagonal cracks slightly, as shown in Figure 7(d). The weld of the cover plate on the beam–column joint was cracked when the storey displacement was 34 mm, and spluttering noise occurred. The energy dissipation coefficient was approximately 1.04, and the total shear force was 1024.39 kN. When the storey displacement reached 38.59 mm, the gusset plate was torn and the total shear force was 1023.73 kN.
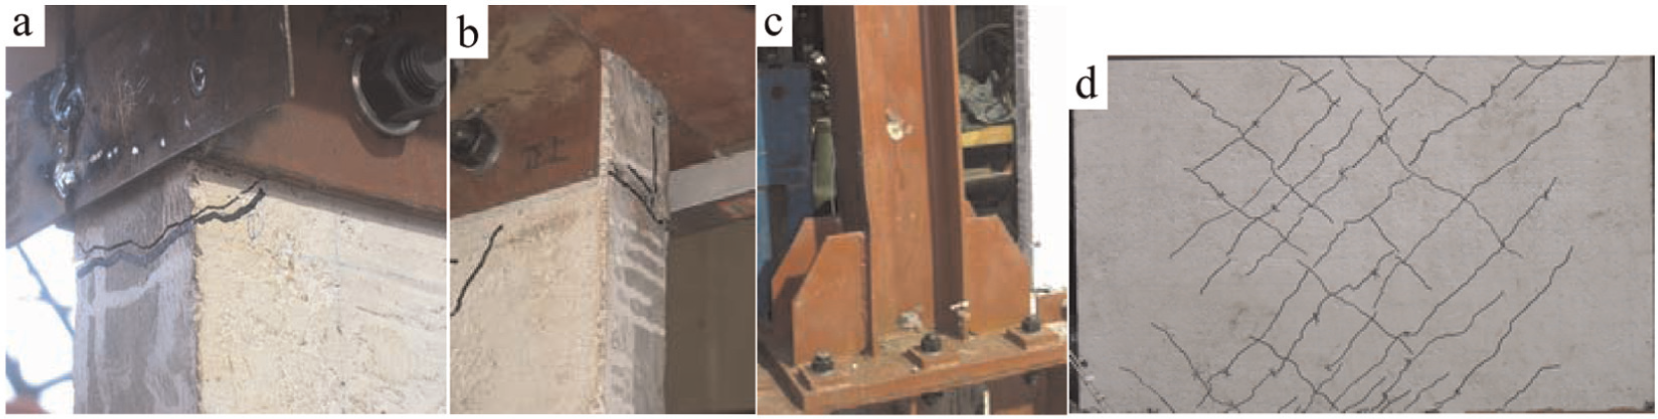
Typical phenomena of RPWF-B: (a) Δ = 4 mm, (b) Δ = 13 mm, (c) Δ = 19 mm and (d) Δ = Δmax.
BF
Fractures of the beam–column connection and local buckling of columns were the main failure modes of the BF. As shown in Figure 8, similar failure modes as the specimens of RPWF-A and RPWF-B were observed. First, concrete cracks occurred in the RPW; then, the RC wall was damaged. Finally, the beam–column connection failed with larger deformation of the steel frame. Thus, the RPW can be used as the first line of defence for earthquake resistance, and the steel frame can be used as the second.
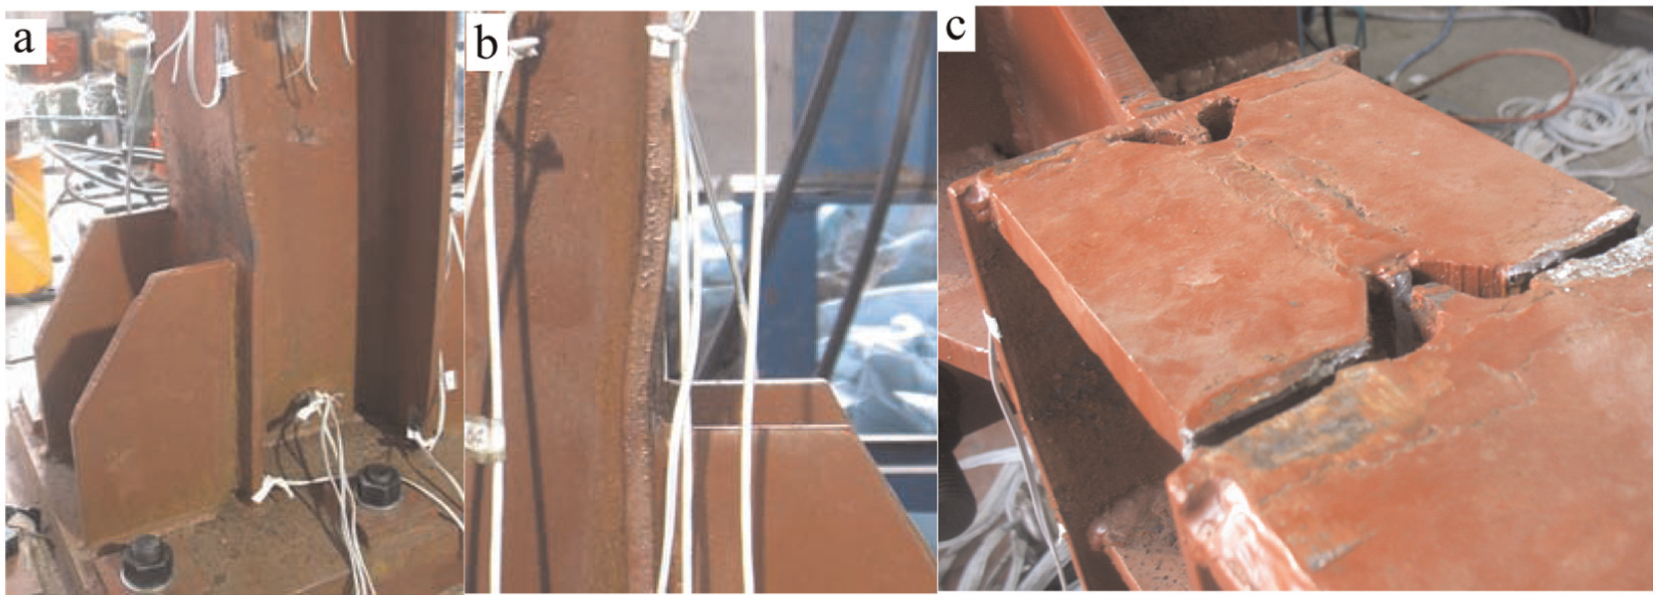
(a, b) Local buckling of columns and (c) the failure of beam–column connection of the steel frame.
Hysteretic behaviour
The recorded lateral loads and lateral displacement behavioural characteristics of the tested specimens are presented in Table 3. The horizontal load (P) versus the lateral displacement (Δ) curves for the specimens are shown in Figure 9. During the initiation of loading, the specimens were generally kept in an approximately elastic range, and the stiffness of the specimens remained almost unchanged. Then, when cracks appeared on the RC panel, the stiffness of the hysteretic curves deteriorated slightly as the lateral load increased stably, and the hysteretic loops of the specimens changed from shuttle shapes to reverse S ones. As the cracks developed and reinforcing steel bars yielded, the hysteretic loops showed a pinching effect. Based on the hysteretic loops, the three specimens have sufficient energy dissipation capacity. However, for the RPWF specimens, the processes of stiffness and strength degradation did not appear because the beam–column connection of the steel frame fractured suddenly, as shown in Figure 9.
Behavioural characteristics of the tested specimens.
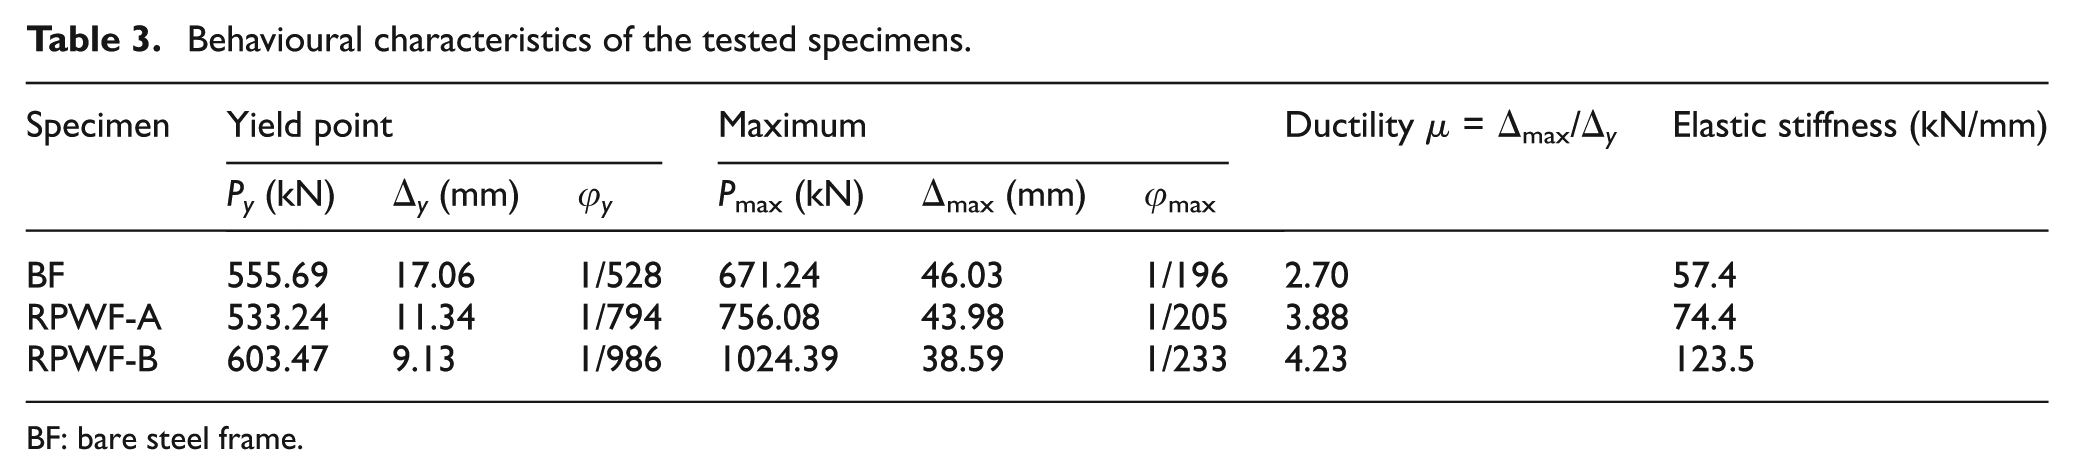
BF: bare steel frame.

Lateral load (P) versus displacement (Δ) (hysteresis loops and skeleton curves).
The larger length-to-height ratio of RPW results in higher loading capacity: the ultimate lateral load of RPWF-A is 113% that of the BF, and the ultimate lateral load of RPWF-B is 153% that of the BF. In addition, the larger length-to-height ratio of RPW results in larger initial lateral stiffness.
Energy dissipation
To evaluate the energy dissipation behaviour of RPWs, the energy dissipation coefficient E in each cycle was calculated from the lateral load (P) versus lateral displacement (Δ) hysteretic curves, and the calculations were expressed as the sum of areas SABC and SCDA divided by the sum of areas SOBE and SODF, as shown in Figure 10. The energy dissipation coefficients E of the test specimens are depicted in Figure 10. The RPWF-A had good energy dissipation performance at the early stage, but the energy dissipation performance of the RPWF-A decreased after the applied displacement reached 39 mm.
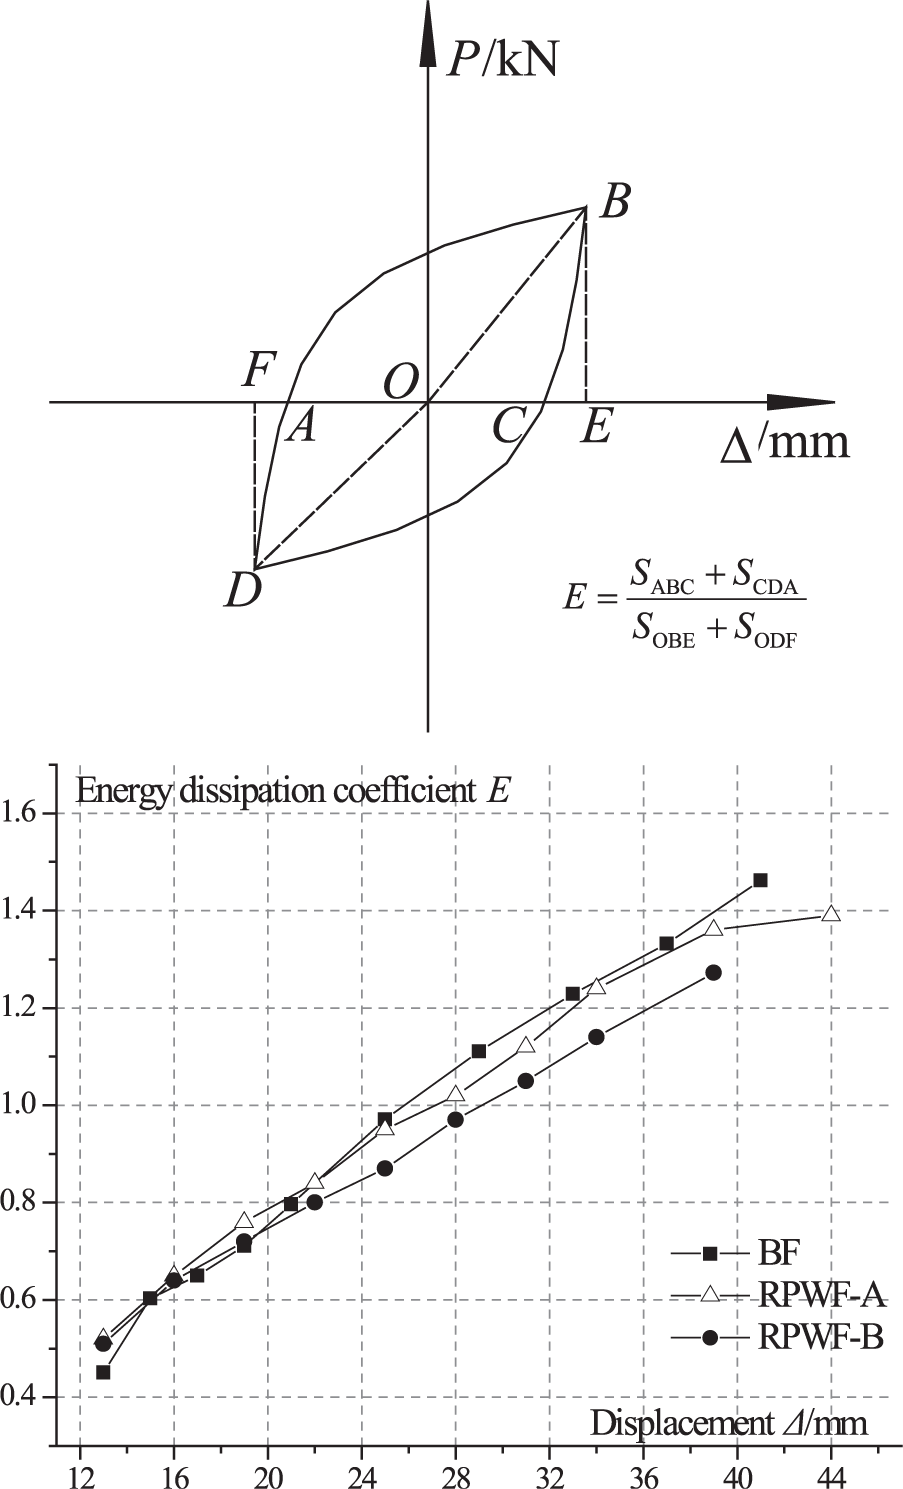
Calculation of the energy dissipation coefficient and E–Δ curves of the specimens.
Ductility
The displacement ductility of a specimen is evaluated by the displacement ductility coefficient µ, which is calculated as µ = Δmax/Δ y , where Δ y is the lateral displacement at yield and Δmax is the lateral displacement when the load value falls to 85% of the maximum lateral load or the specimen has reached the maximum displacement. The lateral displacement at yield Δ y was calculated by the equal-energy method; the definition of the method is shown in Figure 11. The values of the ductility coefficient for all tested specimen are illustrated in Table 3. According to the test results, RPWF specimens had better ductility than the bare frame, and the displacement ductility coefficient of all specimens ranged from 2.7 to 4.23. The ductility coefficient increased with the increase in the length-height ratio of the RC wall.
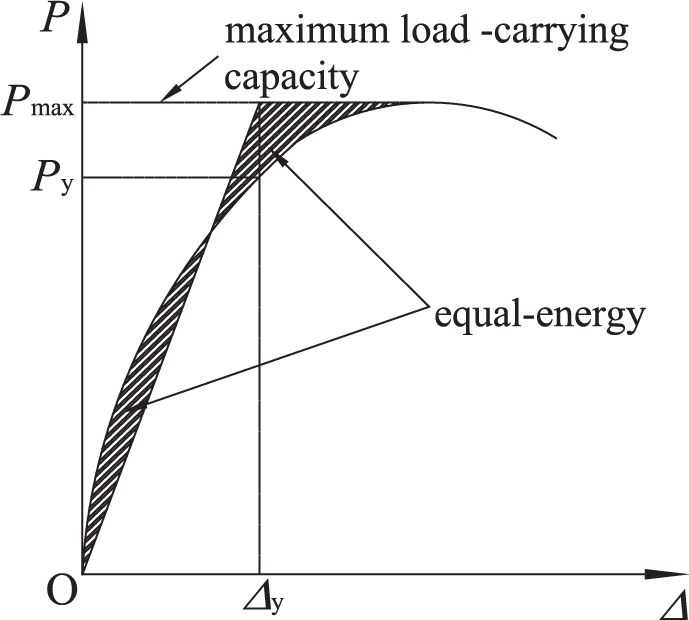
Definition of the yield point for the specimens.
Strength degradation
The strength degradation coefficients λ are presented in Figure 12, where λi is the strength degradation coefficient of the specimens under the ith loading cycle, which is calculated by the relative strength (Pji+1/Pji); Pji+1 is the maximum load of the (i + 1)th loading cycle, and the relative displacement is jΔ y ; Pji is the maximum load of the ith loading cycle, and the relative displacement is jΔ y .
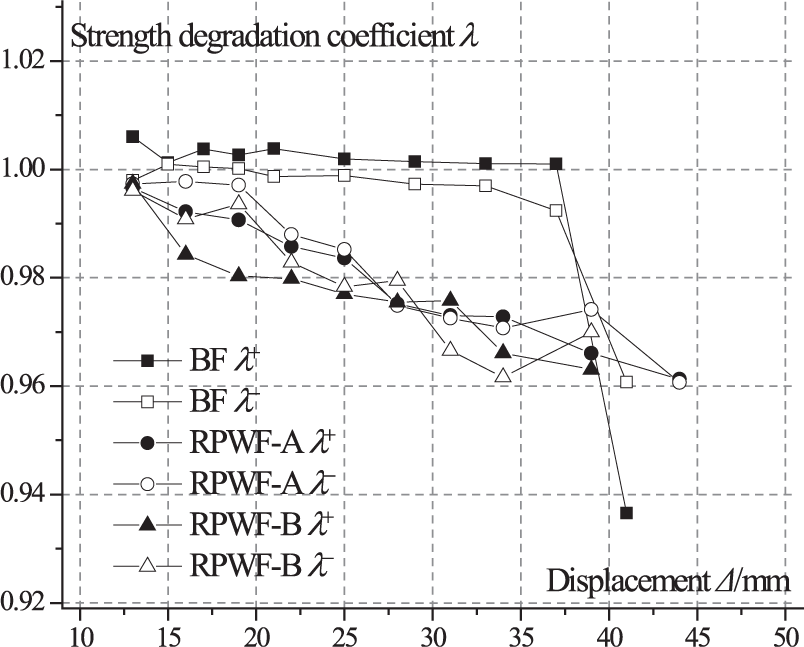
Strength degradation coefficient of the specimens in the forward (λ+) and backward (λ−) directions.
The strength degradation coefficients of the specimens are approximately 1 in the early stages, and the value decreased with the increase in the applied displacement. The specimens have a relatively stable performance in degradation of strength because the strength degradation coefficients of the specimens decrease slowly.
Stiffness degradation
The stiffness degradation coefficients of the specimens are depicted in Figure 13 and can calculated as η = ki/k0, where k0 and ki are the lateral stiffnesses corresponding to the first and the ith loading cycle, respectively. From Figure 13, it can be concluded that the RC wall had little effect on the stiffness degradation during the preliminary loading stage, and the RPWF then had smoother stiffness degradation.
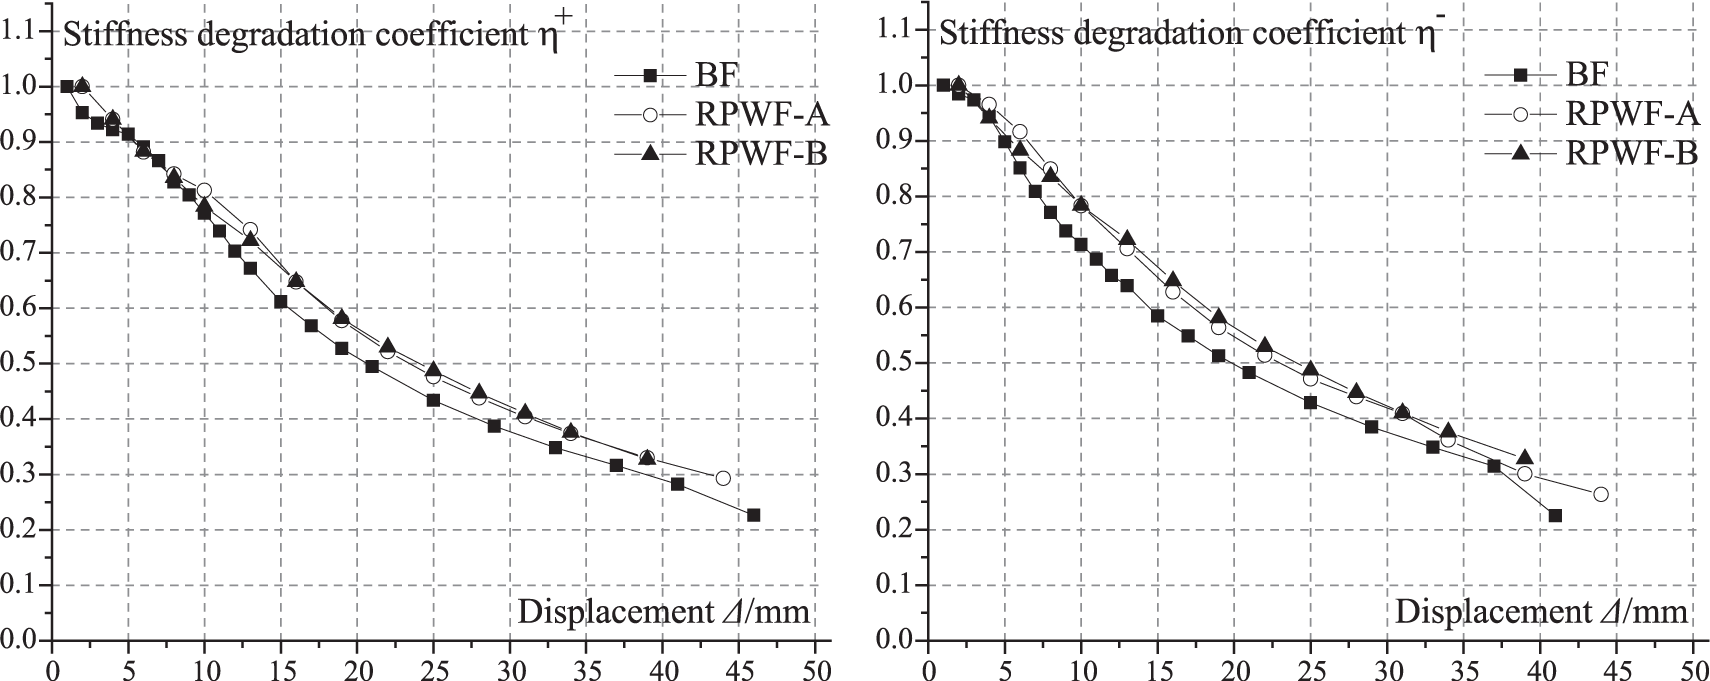
Stiffness degradation coefficients of the specimens in the forward (η+) and backward (η−) directions.
Member design
Ultimate loading capacity
Theoretical and finite element methods (FEMs) were used to predict the ultimate loading capacity of the specimens. According to the failure mode of the specimens (see in section ‘Failure modes’), fractures were observed in the joint plate. Thus, the shearing failure of the joint is the dominate failure mode of the specimens. The shearing force diagram for RPWF is depicted in Figure 14, where H and L are the height and the span of the specimen, respectively.
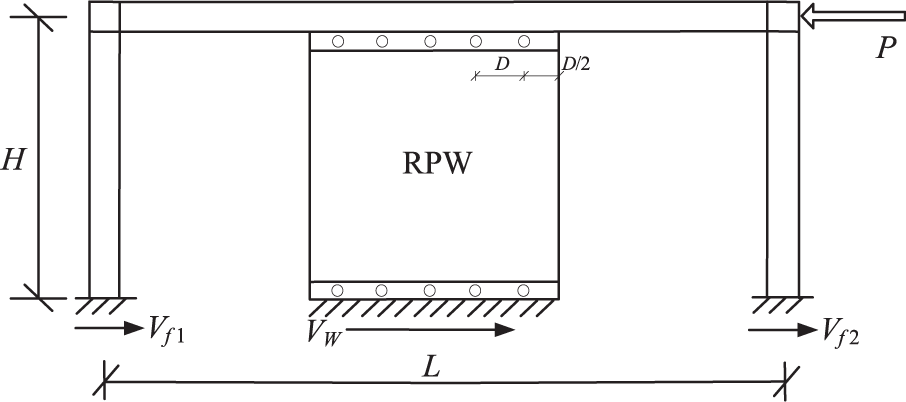
Shearing force diagram for RPWFs.
The overall shearing capacity P is defined as the sum of the shearing capacity of the steel frame Vf and the shearing capacity of the precast RC wall Vw and can be calculated as

For the BF, the ultimate shearing capacity Pu is given by


where fvu denotes the shearing failure stress of steel, and the calculation is
The bend–shear structural behaviour of the RC wall is similar to the mechanical behaviour of the RC DB. The ultimate shear capacity of the precast RC wall can be calculated by GB 50010-2010 (2010). Figure 15 shows the equivalent calculating model; the RPW is assumed as a part of a fixed–fixed beam subjected to a concentrated load.

Equivalent calculation model of RPW.
The ultimate shear capacity of precast RC walls can be calculated as
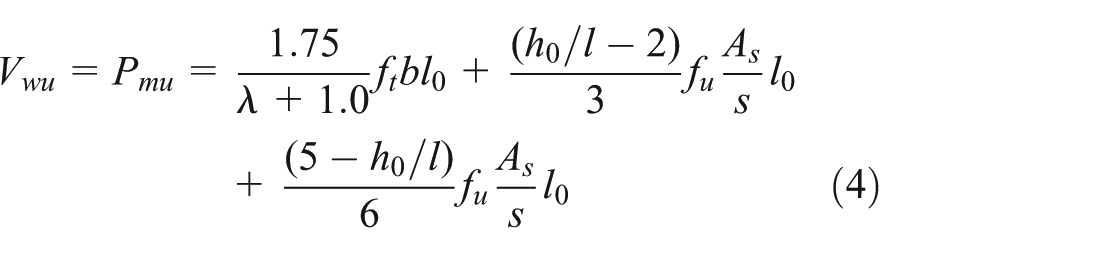
where λ is the shear-span ratio of RPW, λ = 0.25 if h0/l ≤ 2.0 and λ = h/l0 if 2.0 < h0/l < 5.0; h0/l is the height–length ratio of RPW, if h0/l < 2.0, h0/l is defined as 2.0; h is indicated as the centre-to-centre vertical distance between the bolt holes; l is the length of RPW, l0 is defined as l0 = l − αs, which is the effective length of RPW; αs is the cover thickness; ft is the tensile strength of the concrete; fu is the ultimate strength of the reinforced bar; As/s is the stirrup ratio of RPW and h0 is the calculated height of RPW, which is defined as 2h for the RPW.
Table 4 lists the shear strengths of the specimens obtained from the theoretical (Pcal) and experimental methods (Ptest). These results show that the errors between the theoretical and experimental results were not more than 20%. The theoretical results are larger than the test results because the ultimate strength was used as the failure strength of the steel frames and the reinforced bars.
Ultimate loading capacities of the calculation solution and test results.
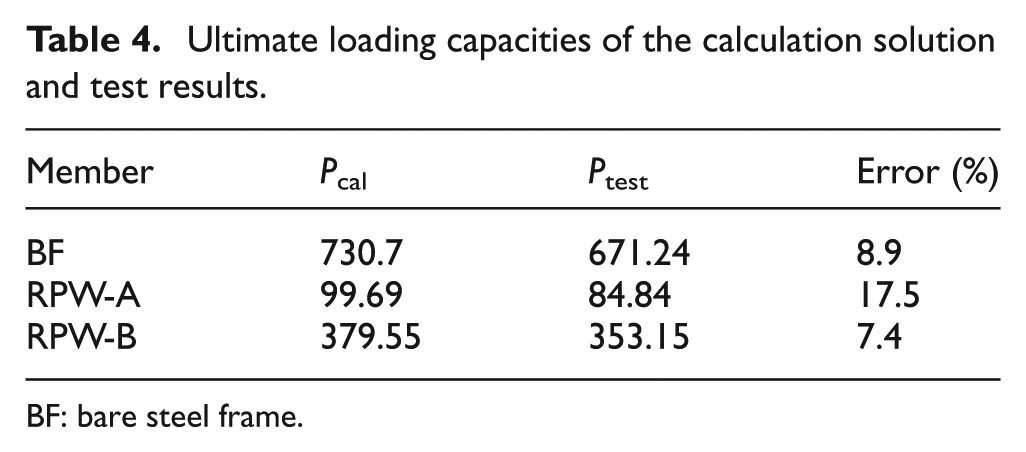
BF: bare steel frame.
Then, the finite element software ABAQUS was used to perform pushover analyses of the RPWFs. The beams and columns are modelled using S4R shell elements, and the concrete panels are modelled using continuum (solid) elements. The analysed pushover curves of the RPWF specimens are compared with the test results in Figure 16. The ultimate loading capacity of the pushover analysis is listed in Table 5 by comparing with the test results.
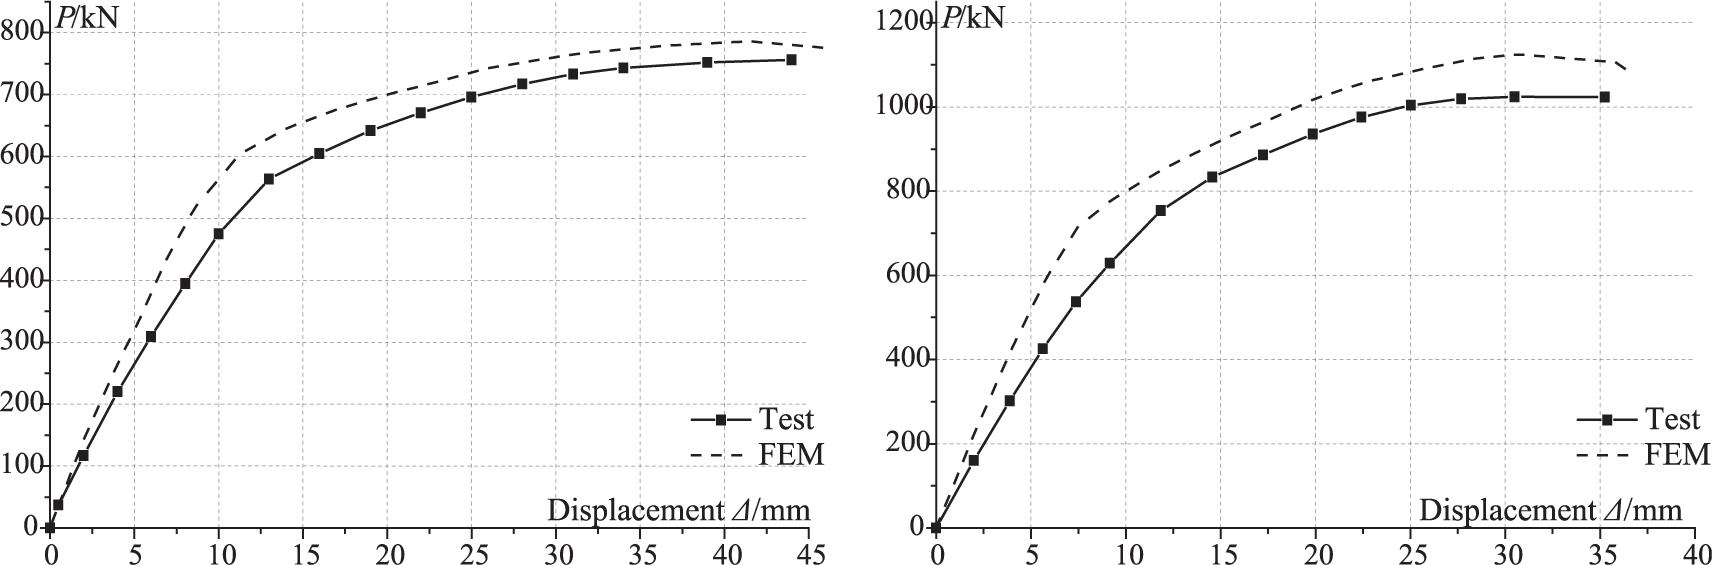
Pushover analyses versus test results.
Ultimate loading capacities of the FEM and test results.
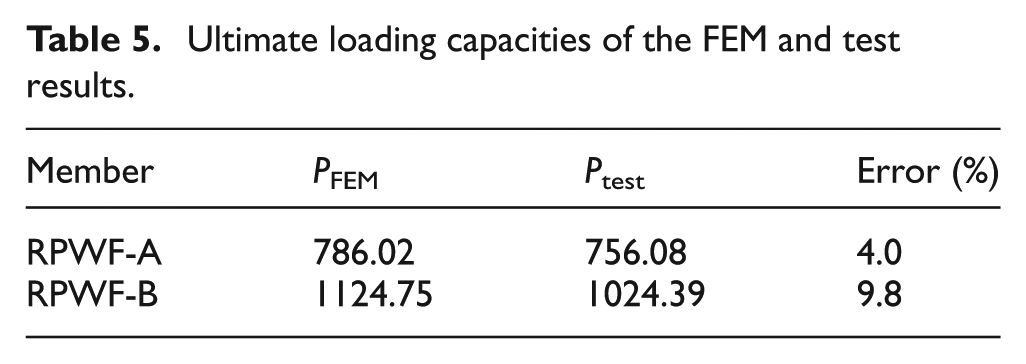
Figure 16 and Table 5 indicate that the numerical method accurately predicted the ultimate strength of the RPWF structures, and the deviations between the FEM and test results were not more than 10%.
Bolt design
The main function of the high-strength bolts is to transfer shearing forces uniformly and to ensure effective connection between the RPW and frame beam. High-strength bolts were designed as M20 (8.8), and the pre-tensile force applied to each bolt was 125 kN. There are two phases for the high-strength bolts in the test specimens: (1) phase I, the shearing force of the bolt is not more than the friction between the RPW and angles and (2) phase II, the shearing force of the bolt exceeds the friction mentioned in phase I.
In phase I, Figure 17 shows the mechanic diagrams for RPWs; the RPWs are carrying the lateral loads and bending moments simultaneously. Thus, the bolts resist not only the shearing force (Ny) generated from lateral loads but also the shearing force (Nw) due to the bending moment of RPW, as shown in Figure 18. It is assumed that the lateral force is distributed to each bolt evenly; thus, the shearing force can be calculated as Ny = Vw/n, where n represents the number of bolts. The centre-to-centre lateral distance between the bolt holes is D = 150 mm for the test specimens, and the edge distance is 75 mm. For the RPW-A, Mw = Vwh/2 = 0.405Vw; thus, it can be calculated that Nm = Mw/4D = 0.675Vw and Ny = Vw/3. Therefore, the maximum resultant shearing force of the bolt is 0.75Vw. For RPW-B, Mw = Vwh/2= 0.405Vw, Nm4 = 7Nm1, Nm3 = 5Nm1 and Nm2 = 3Nm1. Thus, Nm4 = 0.225Vw and Ny = Vw/8. Therefore, the maximum resultant shearing force of a bolt is 0.26Vw.
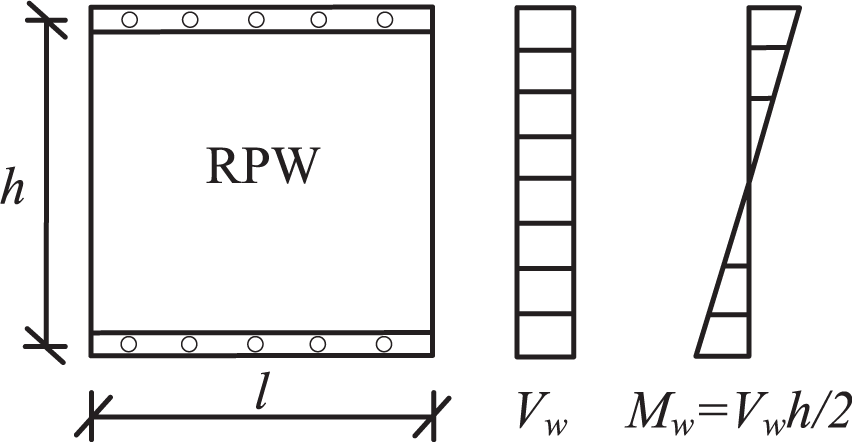
Mechanic diagrams for RPW.
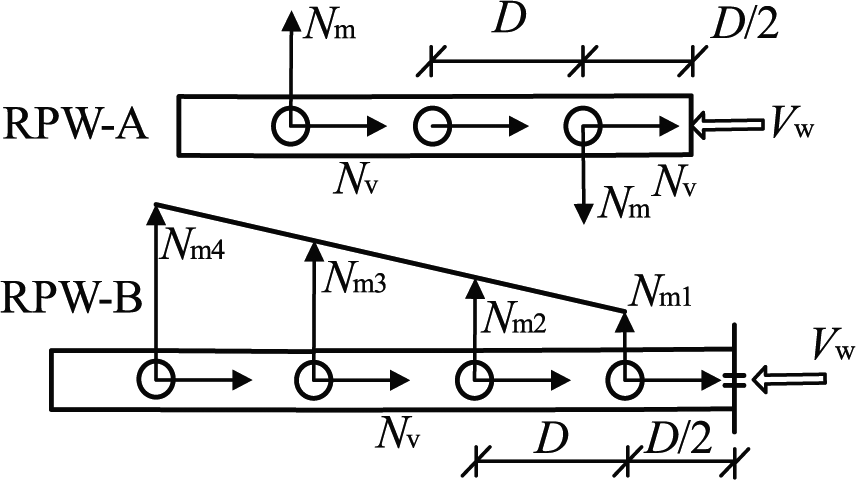
Mechanic diagrams for the bolts.
In phase II, the RPW is carrying the shearing force created by the bending moment; thus, the bolts resist the shearing force of lateral loads only. Therefore, the maximum shearing force of a bolt is 0.33Vw and 0.125Vw for RPW-A and RPW-B, respectively.
Table 4 shows the ultimate loading capacity of the RPWs; the values 84.84 and 353.15 kN correspond to the RPW-A and RPW-B, respectively. Therefore, in phase I, the shearing force is 63.63 and 91.82 kN for the disadvantageous bolt in the RPW-A and RPW-B, respectively; in phase II, the shearing force is 28.00 and 44.14 kN for the disadvantageous bolt in the RPW-A and RPW-B, respectively.
The friction NvuI (phase I) and ultimate shearing strength NvuII (phase II) of the high-strength bolt are calculated by


where nf is the number of friction faces; µ is the anti-sliding coefficient, which is assumed as 0.3 in this article; P is the pre-tensile force; d0 is the effective diameter of the bolt, which is 20 mm and fv is the yield strength of the bolt, which is 320 MPa.
Therefore, NvuI = 67.5 kN and NvuII = 100.5 kN according to equation (5) and equation (6), which represent the ultimate strength of the high-strength bolts in phase I and phase II, respectively. During more frequent low and medium size seismic events, the shearing force of the connected bolts should be less than the value of NvuI. During large earthquakes, the shearing force of the bolts exceeds the ultimate strength of phase I, and the mechanic behaviour of the bolts shifts into phase II. In phase II, the RC wall carries the bending moment caused by the lateral loads, which may result in the failure of the RC wall.
Conclusion
This article presented an experimental investigation on the steel frame partially infilled precast RC wall (RPWF) lateral resisting system. Three specimens were tested, and the detailed test results were illustrated. In addition, theoretical and pushover analyses were performed to predict the ultimate loading capacities of the tested specimens. The following conclusions can be summarised:
The precast RC wall enhanced the initial stiffness and maximum loading capacity of the steel frame. The length-to-height ratio of the RPW had a large effect on the loading capacity, initial stiffness and ductility. Therefore, the initial stiffness and ultimate loading capacity of steel frames could be modulated by changing the length-to-height ratio of RPW.
The theoretical calculations were presented to predict the ultimate loading capacity of the RPWFs. A RPW was assumed as a part of a fixed–fixed beam subjected to a concentrated load. In addition, pushover analyses were performed to simulate the nonlinear behaviour of the RPWF. The calculated and FEM results were verified by the test results.
Failure of the tested RPWFs subjected to lateral loads first occurred at the RC wall, and then the failure of the steel frame occurred at the joints. Therefore, the RC wall can be used as the first line of defence for earthquake resistance, and the steel frame can be used as the second. RPWFs achieved the transition from bare frame to frame-shear wall, which may provide an economical choice for engineering design.
The high-strength bolts experienced two mechanical phases in the tests. During more frequent low and medium size seismic activity, the shearing force of the connected bolts was carried by the friction between the steel plate and the RC wall. During large earthquakes, the shearing force was carried by the bolts, and the bending moment was carried by the RPW.
The RPWF is introduced to realize the modulation of the initial stiffness for the steel frame structures. Due to the low capacity of a steel frame and the high capacity of a shear wall, this resisting system is an optimal design for mid-rise and high-rise building structures. In addition, the precast RC wall can be easily installed into the steel frame through high-strength bolts. The experimental work presented in this article provides a basis for the further studies. The precast partial wall may have theoretical research value and broad application. To acquire more performance information, further studies are proposed to extend the range of test data, including full-scale size tests.
Footnotes
Declaration of Conflicting Interests
The author(s) declared no potential conflicts of interest with respect to the research, authorship and/or publication of this article.
Funding
The author(s) disclosed receipt of the following financial support for the research, authorship, and/or publication of this article: This work was sponsored by the National Natural Science Foundation of China (50678025), the Science and Technology Activities Merit Aid for Foreign Experts of Shanxi Province (SLZ2008008) and a Project Funded by the Priority Academic Program Development of Jiangsu Higher Education Institutions (CE02-2-32), which are gratefully acknowledged.