



Abstract
The blast resistance of point-supported laminated glass curtain wall has been investigated by means of field blast tests and numerical simulation. Nine site blast tests were carried out, considering two types of glass thickness and six TNT charges ranging from 0.4 to 30 kg. The overpressure and displacement time histories were measured and the failure modes were observed. The overpressure obtained from the measurement panel exhibited a typical pattern of near-field blast with a steep increase followed by a rapid decay within a few milliseconds. The displacement response of the laminated glass panels increased with the increase in the TNT charge almost linearly in the smaller tests (scaled distance ranging 4.5–7 m/kg1/3), which was in line with the increase in the blast impulse in these tests. The failure mode of the point-supported laminated glass panels was featured by tearing off of the polyvinyl butyral layer around the support area, while the glass shards still adhered to the polyvinyl butyral interlayer. Nonlinear dynamic finite element simulation agrees reasonably well with the results from the blast tests. Severe stress concentration has been predicted to occur at the rim of the support holes, leading to initiation of failure at these supports, and this also agrees with the failure mode observed from the blast test. Finally, parametric studies are carried out to investigate the influence of TNT charge weight and the geometric parameters of the panel on the blast response of the glass curtain wall.
Keywords
Introduction
Blast response is an important issue in the design of glass curtain wall because the threat of high-speed flying shards from broken glass curtain wall is known to be a main cause of casualties in the event of an explosion (Morison, 1999; Norville and Conrath, 2006). To ensure appropriate design considerations, a thorough understanding of the blast performance of glass curtain wall is necessary.
Laminated glass, which is composed of two or more layers of glass panels with one or more interlayers, is generally considered as safety glass because the interlayer can keep the splinters together after glass failure. Blast resistance of laminated glass has been tested by researchers using solid explosives (Hooper et al., 2011; Kranzer et al., 2005; Morison, 2007), shock tube (Kranzer et al., 2010; Morison, 2007) and blast simulator (Tao 2011). Larcher et al. (2012) summarised the details of some blast tests on glass panels, and this summary is adapted and extended with additional experimental cases in Table 1. It is noted that all these tests were done for framed glazing.
Summary of experiments on glazing panels.
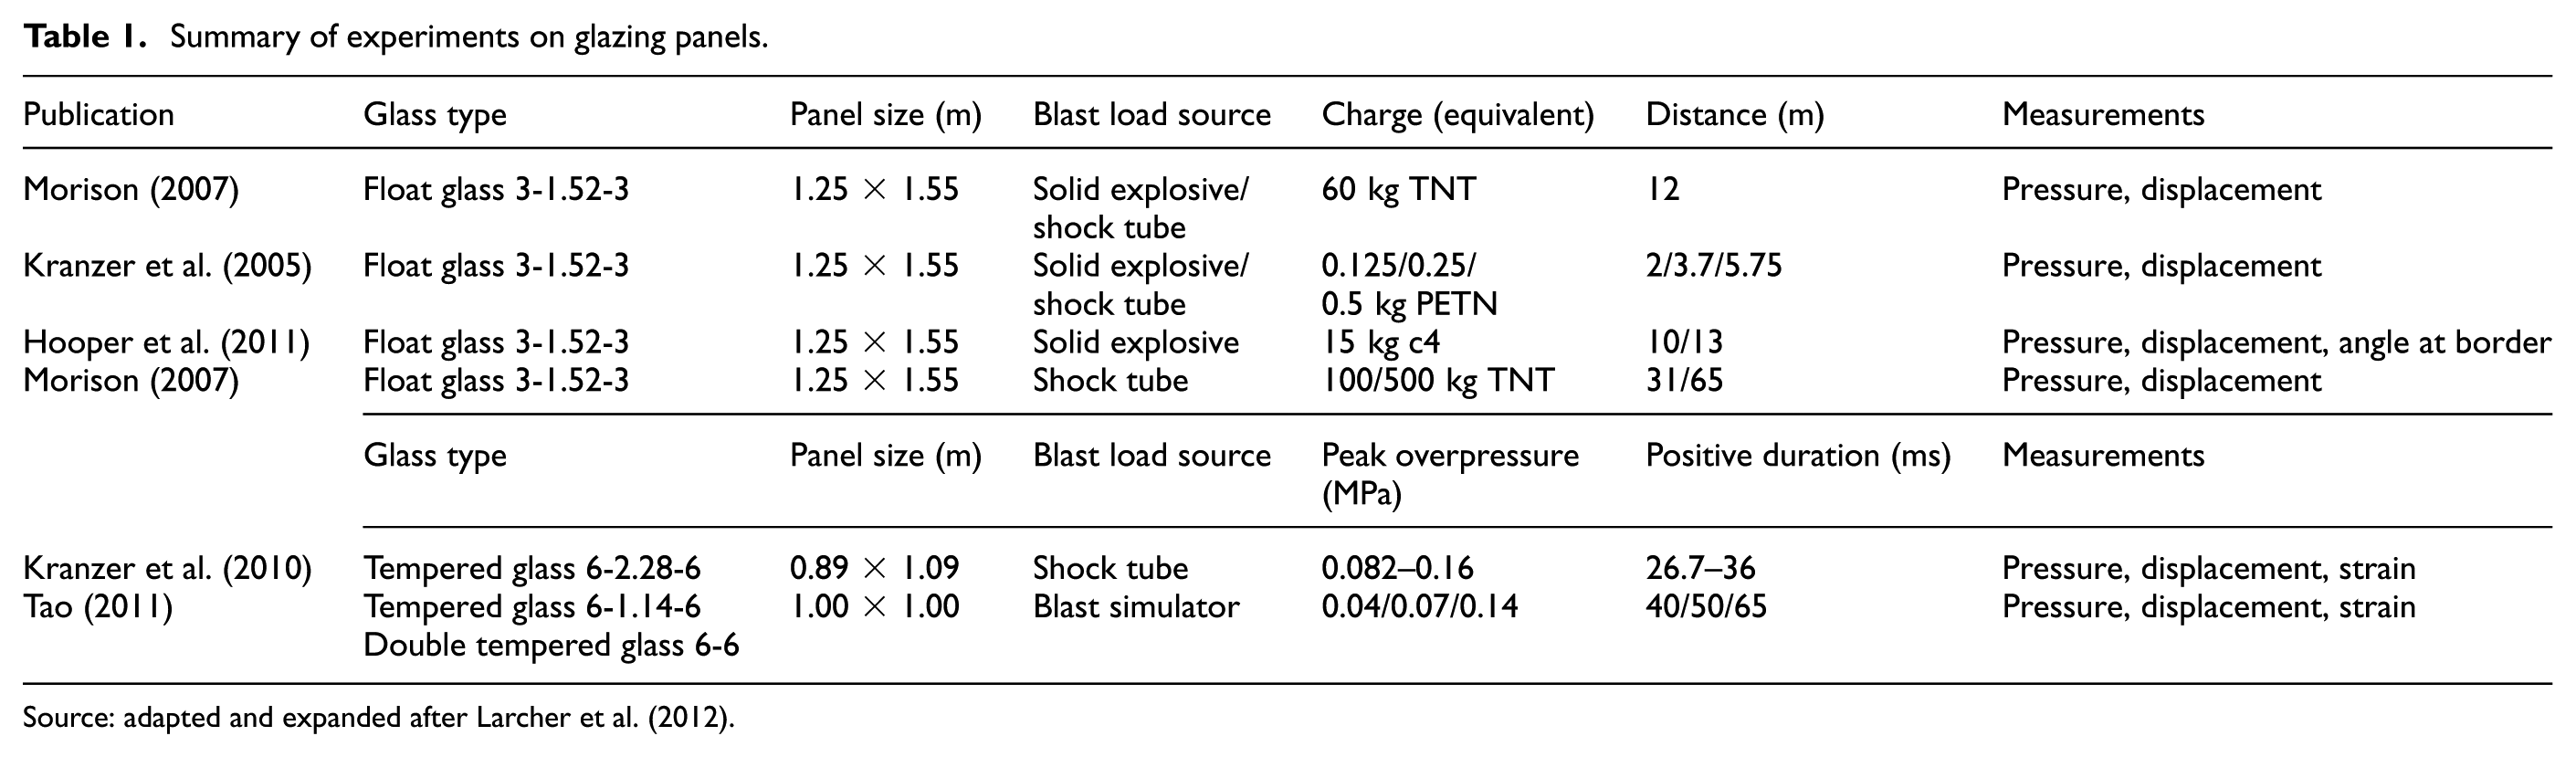
Source: adapted and expanded after Larcher et al. (2012).
Besides experimental studies, numerical analyses on glass curtain wall subjected to blast loading have been carried out employing various modelling techniques, namely, single-degree-of-freedom (SDOF) method (Krauthammer and Altenberg, 2000), smeared model (Timmel et al., 2007), layered and plated elements (e.g. Weggel and Zapata, 2008) and three-dimensional (3D) solid elements (Tao, 2011; Wei, 2010; Wei and Dharani, 2006). Larcher et al. (2012) compared the applicability of smeared model, layered shell model and 3D solid model in simulating the behaviour of laminated glass subjected to blast loading. The layered shell model was deemed to be efficient for design purposes, while smeared model was recommended for small displacement problems and 3D solid model may be considered if more detailed results are required.
Concerning the material descriptions in the numerical analysis, glass is often considered as linear elastic material with a brittle failure mode. For polyvinyl butyral (PVB), which is probably the most commonly used interlayer material, several modelling approaches have been employed, including a viscoelastic model (Morison et al., 2007; Hooper et al., 2012; Rong, 2012), a nonlinear elastic model (Ferry, 1980) and a hyperelastic model (Iwasaki and Sato, 2006; Mullerschon et al., 2004). For low strain rate or high-temperature applications, a viscoelastic model is deemed to be more appropriate because PVB is considered to exhibit viscosity in such conditions. For PVB at high strain rate or under low temperature, the viscosity may be neglected, and thus an elasto-plastic model (Morison, 2007; Rong, 2012) or hyperelastic model (Xu et al., 2011) may be adopted.
From the studies conducted so far, it is found that the positive peak overpressure, duration, composition of glazing as well as the supporting system (Weggel and Zapata, 2008; Wei, 2010) are important factors affecting the blast resistance of glazing, and in some circumstances the negative phase effect should also be considered (Krauthammer and Altenberg, 2000; Wei and Dharani, 2006).
However, the existing studies have mainly been focused on framed glazing. There are very few studies on point-supported glazing (Wei, 2010), although such a glazing system is commonly used in large-scale buildings.
In this study, a series of field blast tests have been conducted on four-point-supported laminated glass curtain walls. An associated finite element (FE) simulation study has also been carried out to check against the test observations. This article presents an overview of the experimental programme and the test results. The numerical model and some of the comparisons are also described and discussed. Finally, a parametric study on the influences of TNT charges and dimension of panel on the response is presented.
Field blast tests: experimental programme
Test specimens and test programme
The specimens in this test represented typical four-point-supported laminated glazing with a panel dimension of 1000 mm × 1000 mm, as shown in Figure 1. Each laminated glazing panel is made up of two layers of tempered glasses of equal thickness and a layer of PVB. Two different glass thicknesses of 8 and 10 mm, designated as B8-series and B10-series, respectively, were used, while the thickness of the PVB remained the same as 1.14 mm.
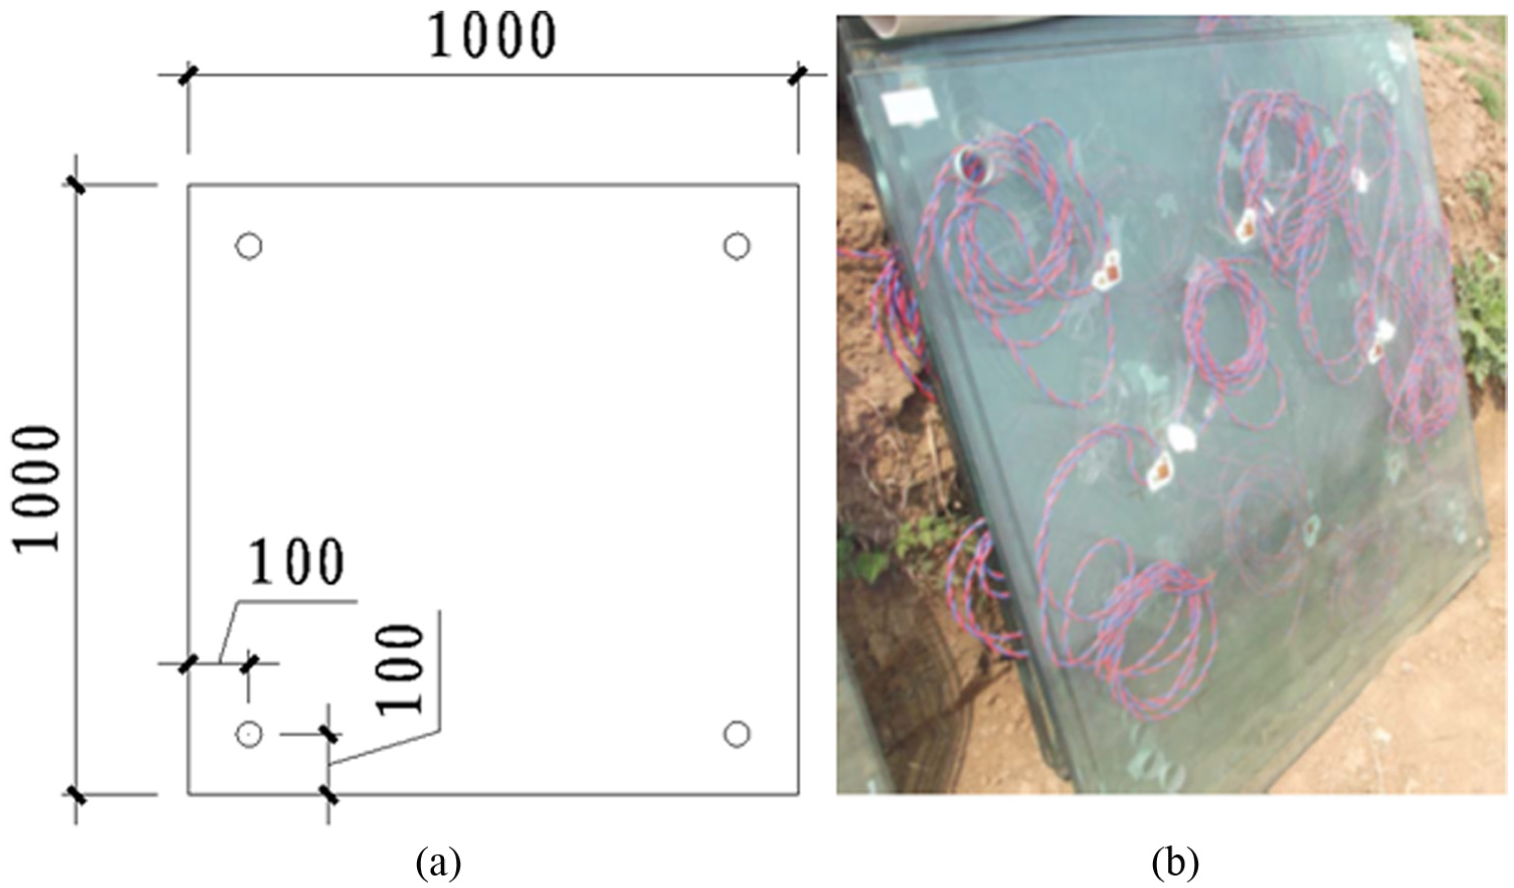
Dimensions of the laminated glass panel specimens: (a) dimensions (mm) and (b) sample of instrumented glass panels.
In each blast test, four identical glazing panels were installed into a large test frame as can be seen in Figure 2. One of the four panels (the upper left quarter) was instrumented for response measurements, while the remaining three were used to observe the consistency of the response and failure modes.
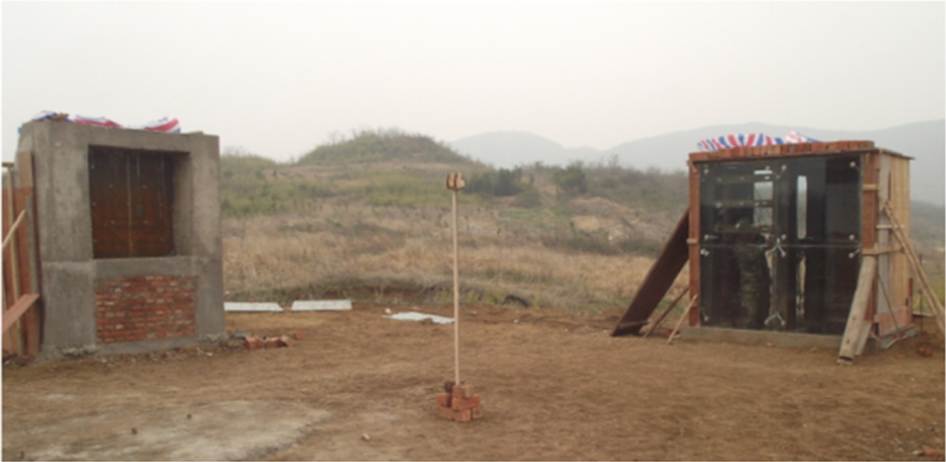
Photograph of blast test: Left: blast overpressure measurement panel. Right: test glazing panels (four) hosted in the test frame.
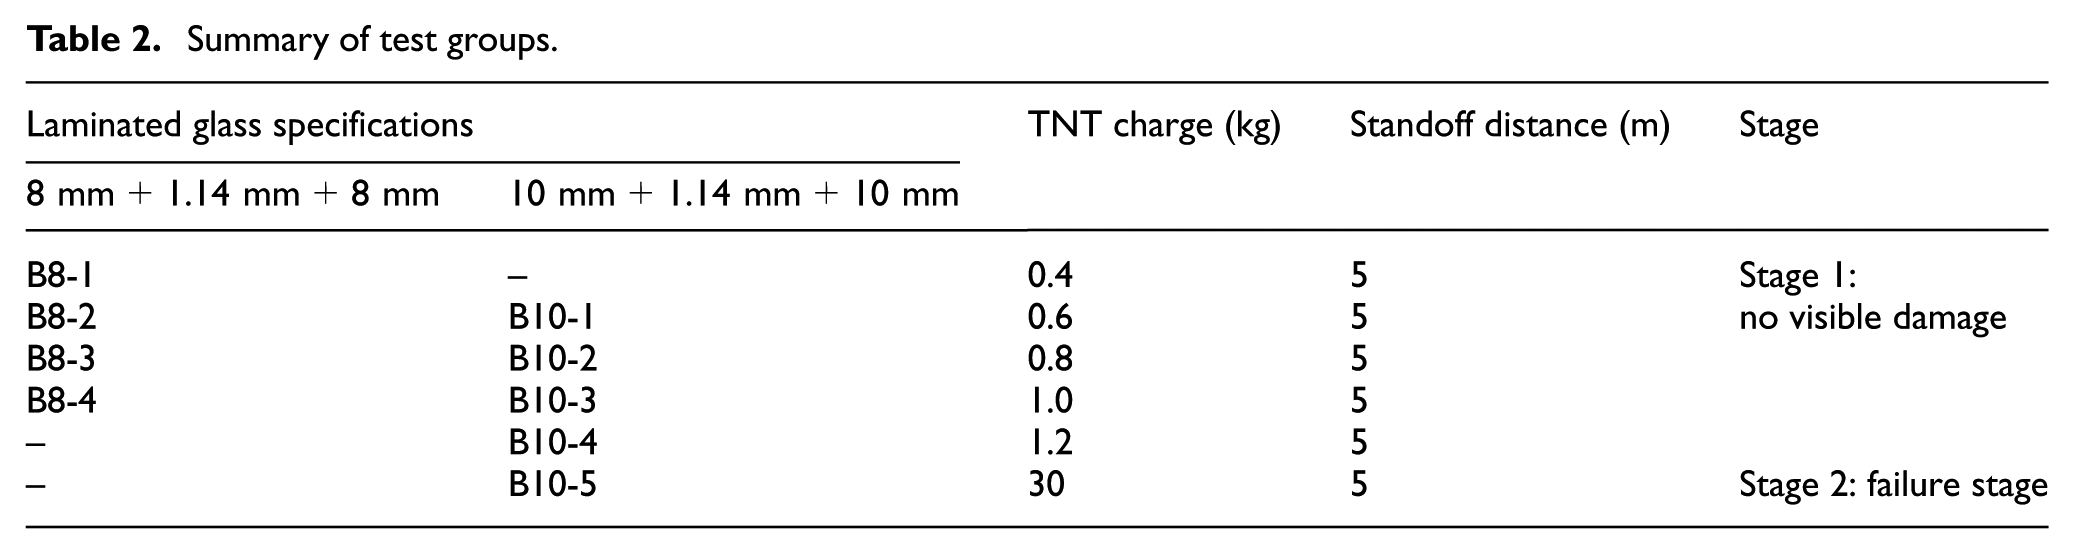
In all tests, the explosive charge was placed at a fixed standoff distance of 5 m (see Figure 3). The tests were organised into two stages. In the first stage, five levels of small blast tests with charges ranging from 0.4 to 1.2 kg TNT were conducted. No obvious damage was observed from these tests in either B8-series or B10-series specimens. In the second stage, a larger charge of 30 kg TNT was used to test the specimens to failure for observing the failure patterns. Table 2 summarises the test programme. It is noted that the failure test with 30 kg TNT was performed only on the B10-specimens. The B8-specimens were subjected to trial failure tests after Stage 1 to assist in the determination of a proper charge weight for the final failure test, and the response from the trial tests was not recorded.
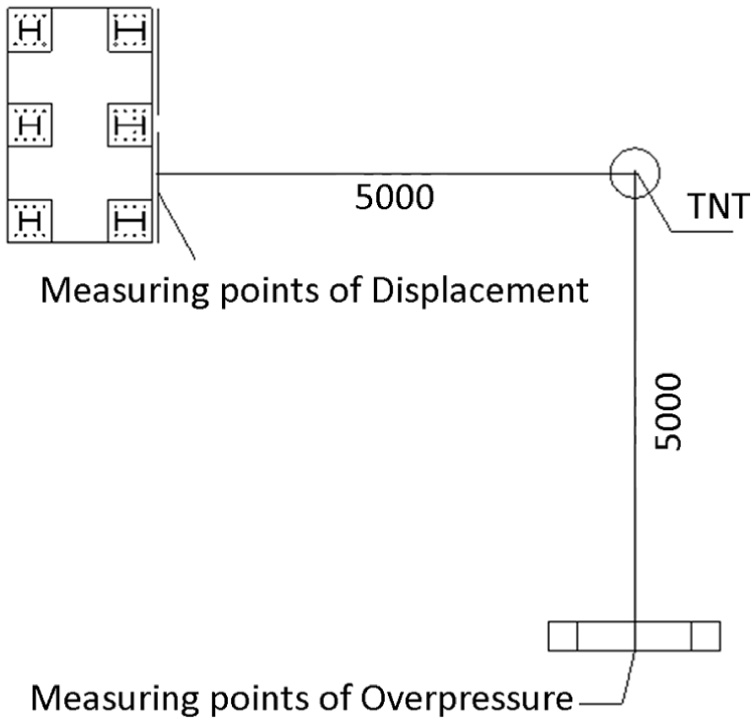
Layout of blast test.
Summary of test groups.
Instrumentation
Instrumentation was organised to measure the response of the glazing panels, as well as the blast load, during the tests.
For the measurement of the blast overpressure, it was not practical to install pressure gauges on the glazing itself; instead, this was measured on a steel panel which was fixed in a reinforced concrete frame and placed symmetrically at the same standoff distance as the glazing specimens, as can be seen from Figures 2 and 3. Totally, 13 pressure transducers (type CY-YD-205) were installed. Figure 4 shows the layout of the pressure transducers.
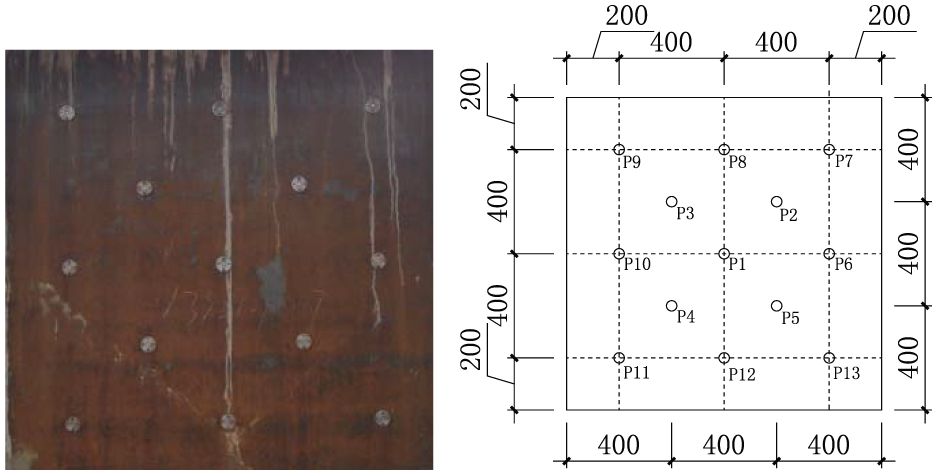
Arrangement of pressure transducers.
Five displacement transducers (type BWG4-100) were attached to the instrumented glazing panel for each test to measure the displacement response of the panel. Figure 5 shows a general layout of the displacement transducers. Besides, several strain gauges (visible from the photograph in Figure 5) were also installed on the same panel to measure the strain responses.
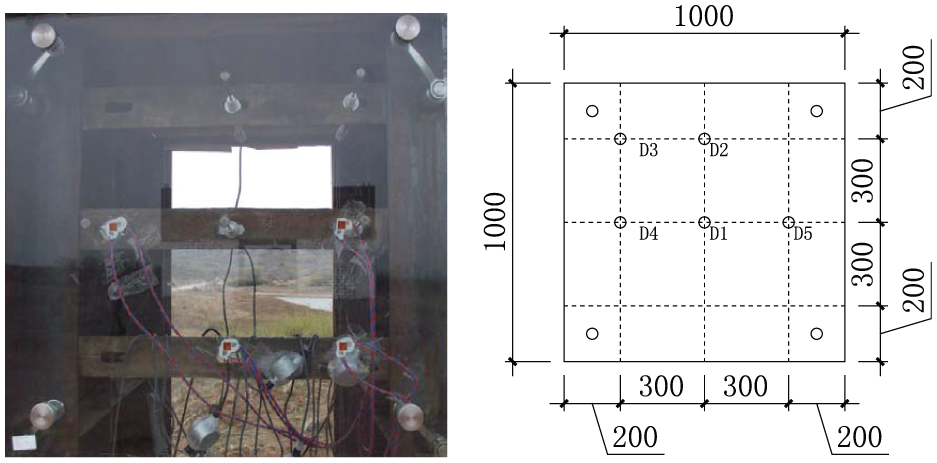
Arrangement of displacement transducers.
Field blast tests: results and discussion
General response characteristics and failure modes
The response of the laminated glasses remained essentially elastic throughout the first stage blast tests, with the maximum charge of 1.2 kg TNT at 5 m, or 4.71 m/kg1/3 in terms of scaled distance. No visible damage was observed. From the blast overpressure measurement, which will be presented in the next section, the maximum overpressure during the first stage tests was about 60 kPa.
Failure occurred when the B10-glazing panels were subjected to Stage 2 blast test with 30 kg TNT at 5 m, which gave rise to a scaled distance of 1.61 m/kg1/3. The peak blast overpressure exerted on the specimen exceeded 1 MPa. The global failure mode of the four-point-supported, laminated glass panel was featured by tearing of PVB at the supported areas, while the glass fragmented but the shards still adhered to the deformed PVB. Figure 6 shows the failure patterns around the support points and the fragmented panel being held by the PVB sheet.
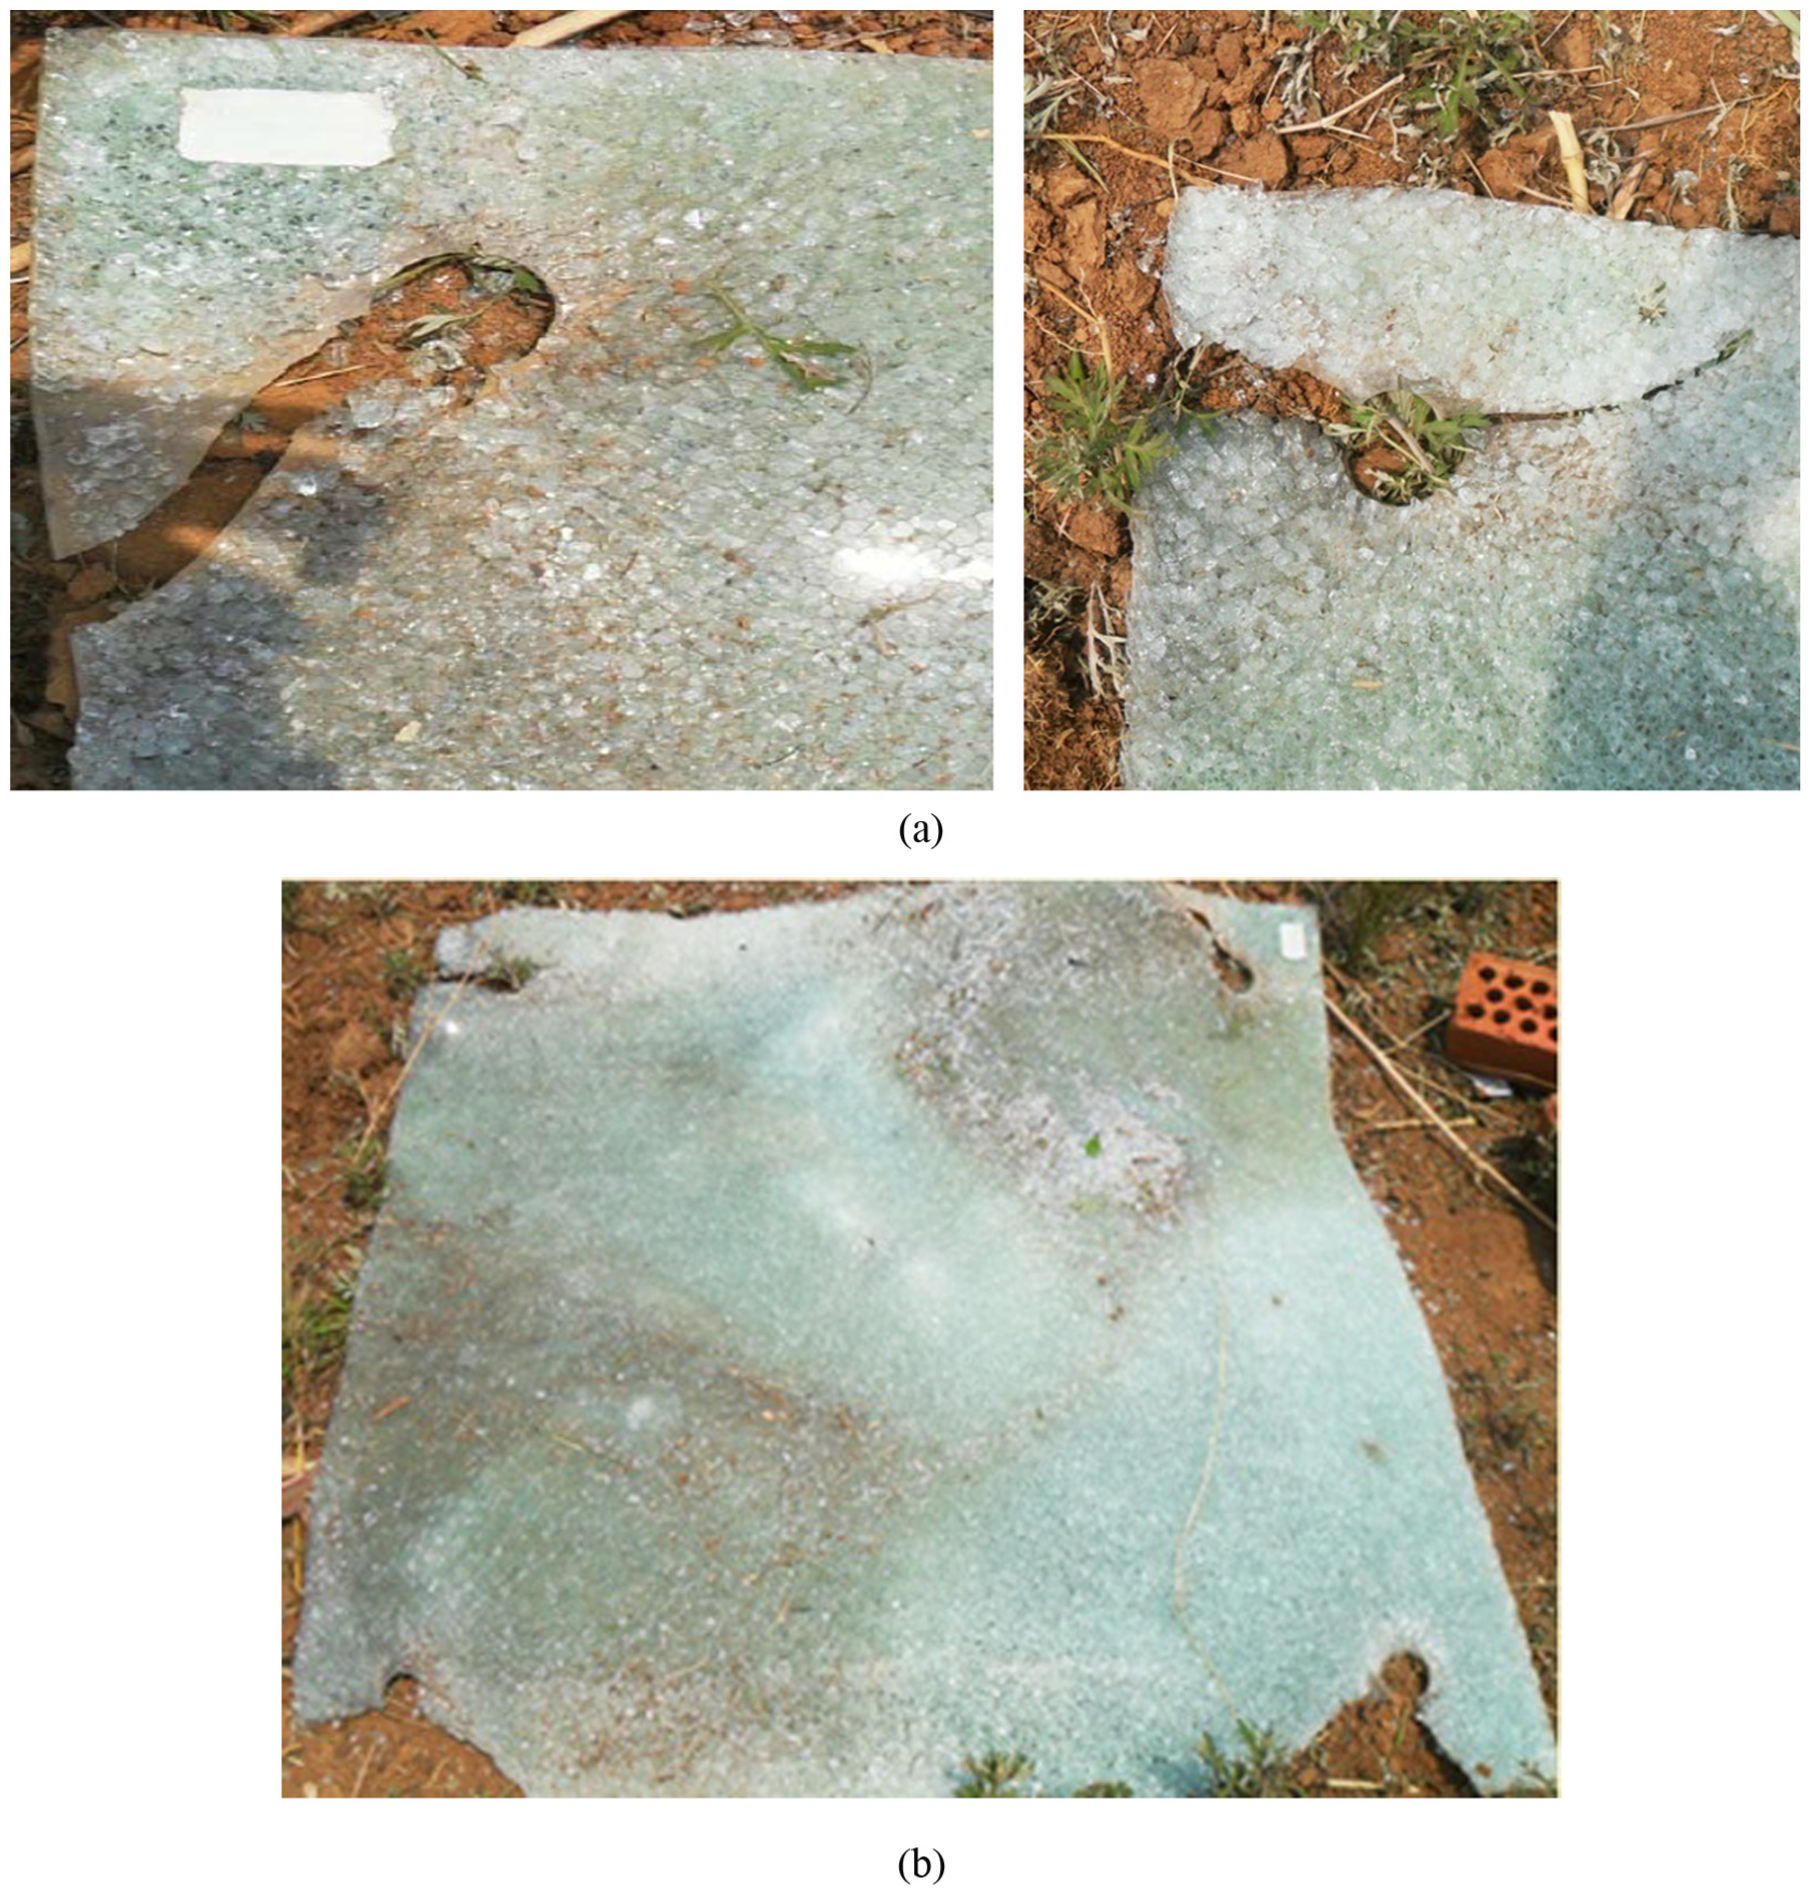
Failure mode (case B10-5): (a) failure at the point supports and (b) failed panel with glass shards adhering onto PVB sheet.
The ability of the PVB-laminated glass in effectively withholding the broken glass shards demonstrates a key advantage. On the other hand, the global failure of the glazing panel by tearing of the panel itself at the point-support regions helped protect the supporting system. The energy dissipated through the PVB tearing process also contributed in reducing the speed of the broken glazing sheet. Such a combination of failure mechanisms exhibited the robustness of the point-supported laminated glazing system for blast resistance. It is noted that in actual design the speed of the broken glazing sheet should be checked and a certain constraining mechanism may need to be considered in order to avoid total detachment of the glazing panel.
Measured blast overpressure
Typical blast overpressure time histories, measured at point P8 and P12 of case B10-5, are shown in Figure 7. The overpressure time histories exhibit a classical pattern, with a steep increase in the overpressure upon the arrival of the blast front, followed by a decay phase lasting a few milliseconds.
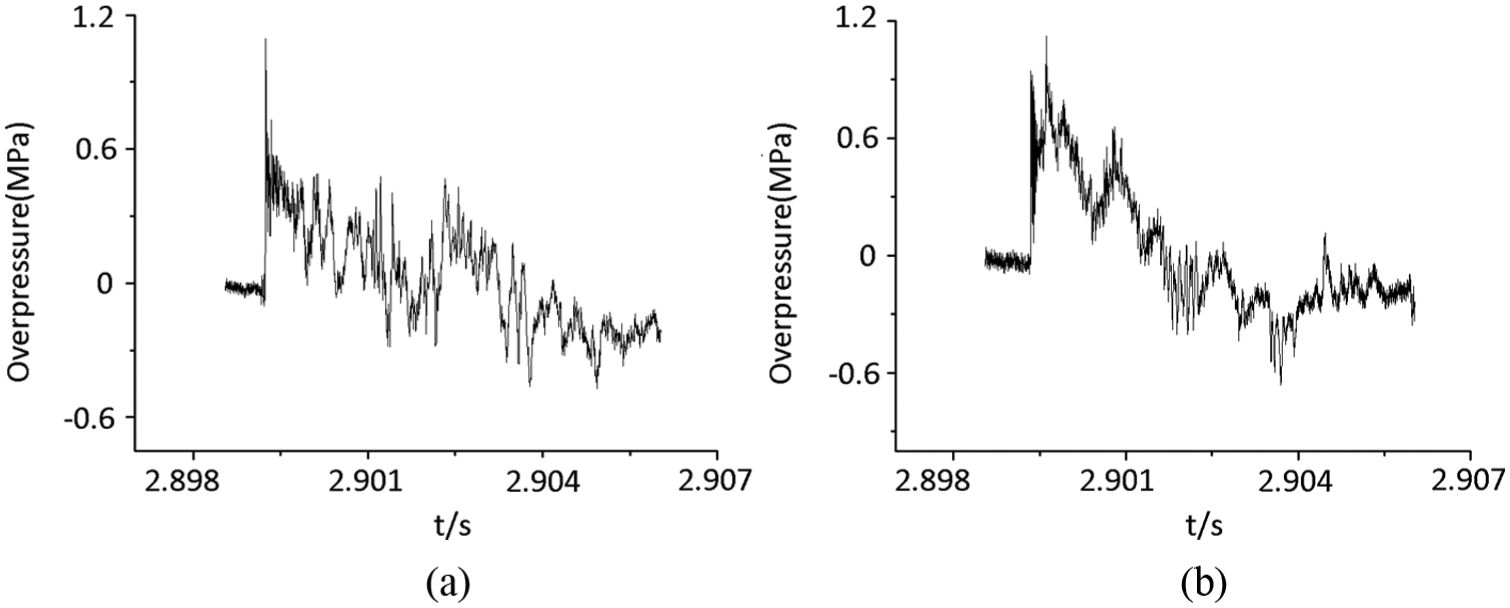
Typical overpressure time history curves (main pulses) for case B10-5: (a) P8 and (b) P12.
Based on the overpressure readings from different pressure gauges, the maximum, minimum and mean values of the peak overpressure over the measurement panel area for different tests are summarised in Table 3. As can be expected, the peak overpressure increases with the increase in the TNT charge, and it reached about 60 kPa in Stage 1 tests and exceeded 1 MPa under the 30-kg TNT test in Stage 2.
Comparison of predicted and measured peak overpressure.
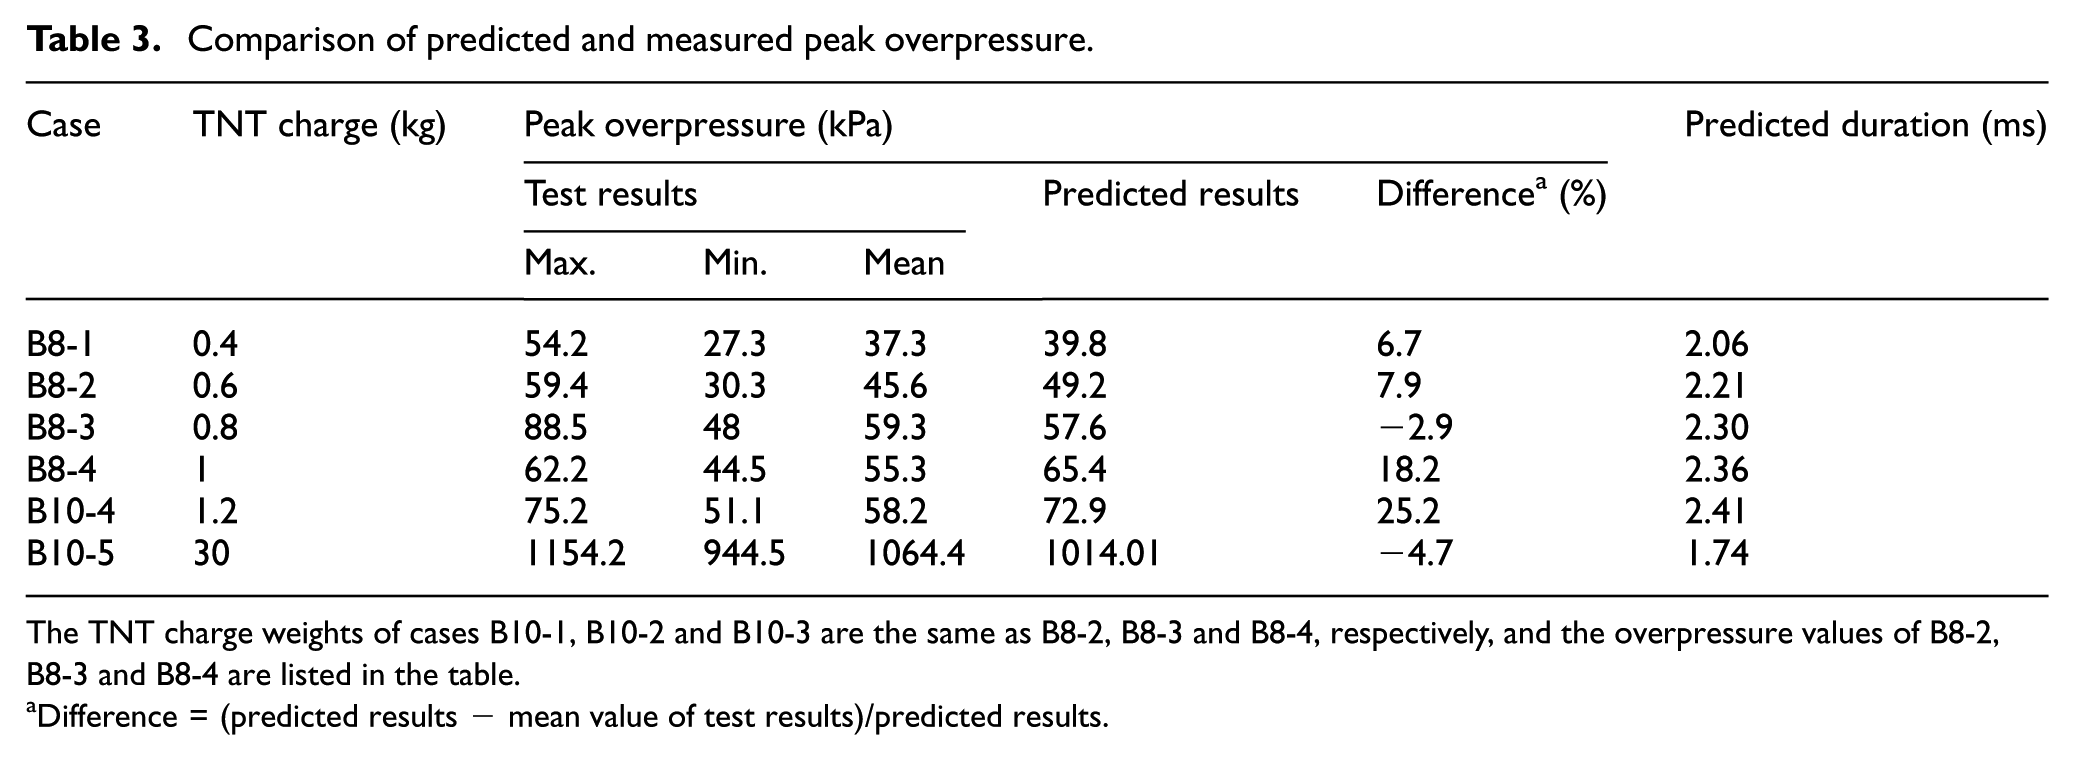
The TNT charge weights of cases B10-1, B10-2 and B10-3 are the same as B8-2, B8-3 and B8-4, respectively, and the overpressure values of B8-2, B8-3 and B8-4 are listed in the table.
Difference = (predicted results − mean value of test results)/predicted results.
The mean values of the peak overpressure for the individual tests are compared with the results predicted using the software A.T. BLAST (ARA, 2004), also listed in Table 3. The measured and predicted peak overpressures agree well. Thus, the predicted peak overpressure and positive duration as listed in Table 3 were adopted for the subsequent numerical simulations, which will be presented in section ‘Numerical simulations’.
It is worth noting that as the overpressure was measured on a steel panel, there could be a certain level of difference from the overpressure on the glazing surface.
Displacement and strain responses
Typical displacement–time curves at the central point (D1) of the glazing panel for different cases are given in Figure 8. The laminated glass panels mainly responded in the elastic range at small charges during Stage 1 tests and no visible residual displacement occurred. When the TNT charge was larger than 1.0 kg, residual centre displacements were observed for both cases with different thicknesses of the glass, and this indicated that these glass panels experienced nonlinear response although there was no visible damage. Under Stage 2 test with 30 kg TNT, the specimen (B10-5) failed totally with a large displacement as shown in Figure 8(d). Clearly, for this particular case, the displacement was primarily attributable to the free-body movement after the failure around the point-support regions. Except this case, in all other tests the point-support regions did not fail as the panel deflected; therefore, the measured deformation largely reflected the actual panel deflection. It is worth noting here that there was still a certain level of rigid body motion involved in the measured panel deflections, and this was due to the deformation of the cushion installed between the panel and the metal frame, and to a lesser extent the deformation of the support itself. In the later numerical simulation, the deformation of the cushion will be taken into account.
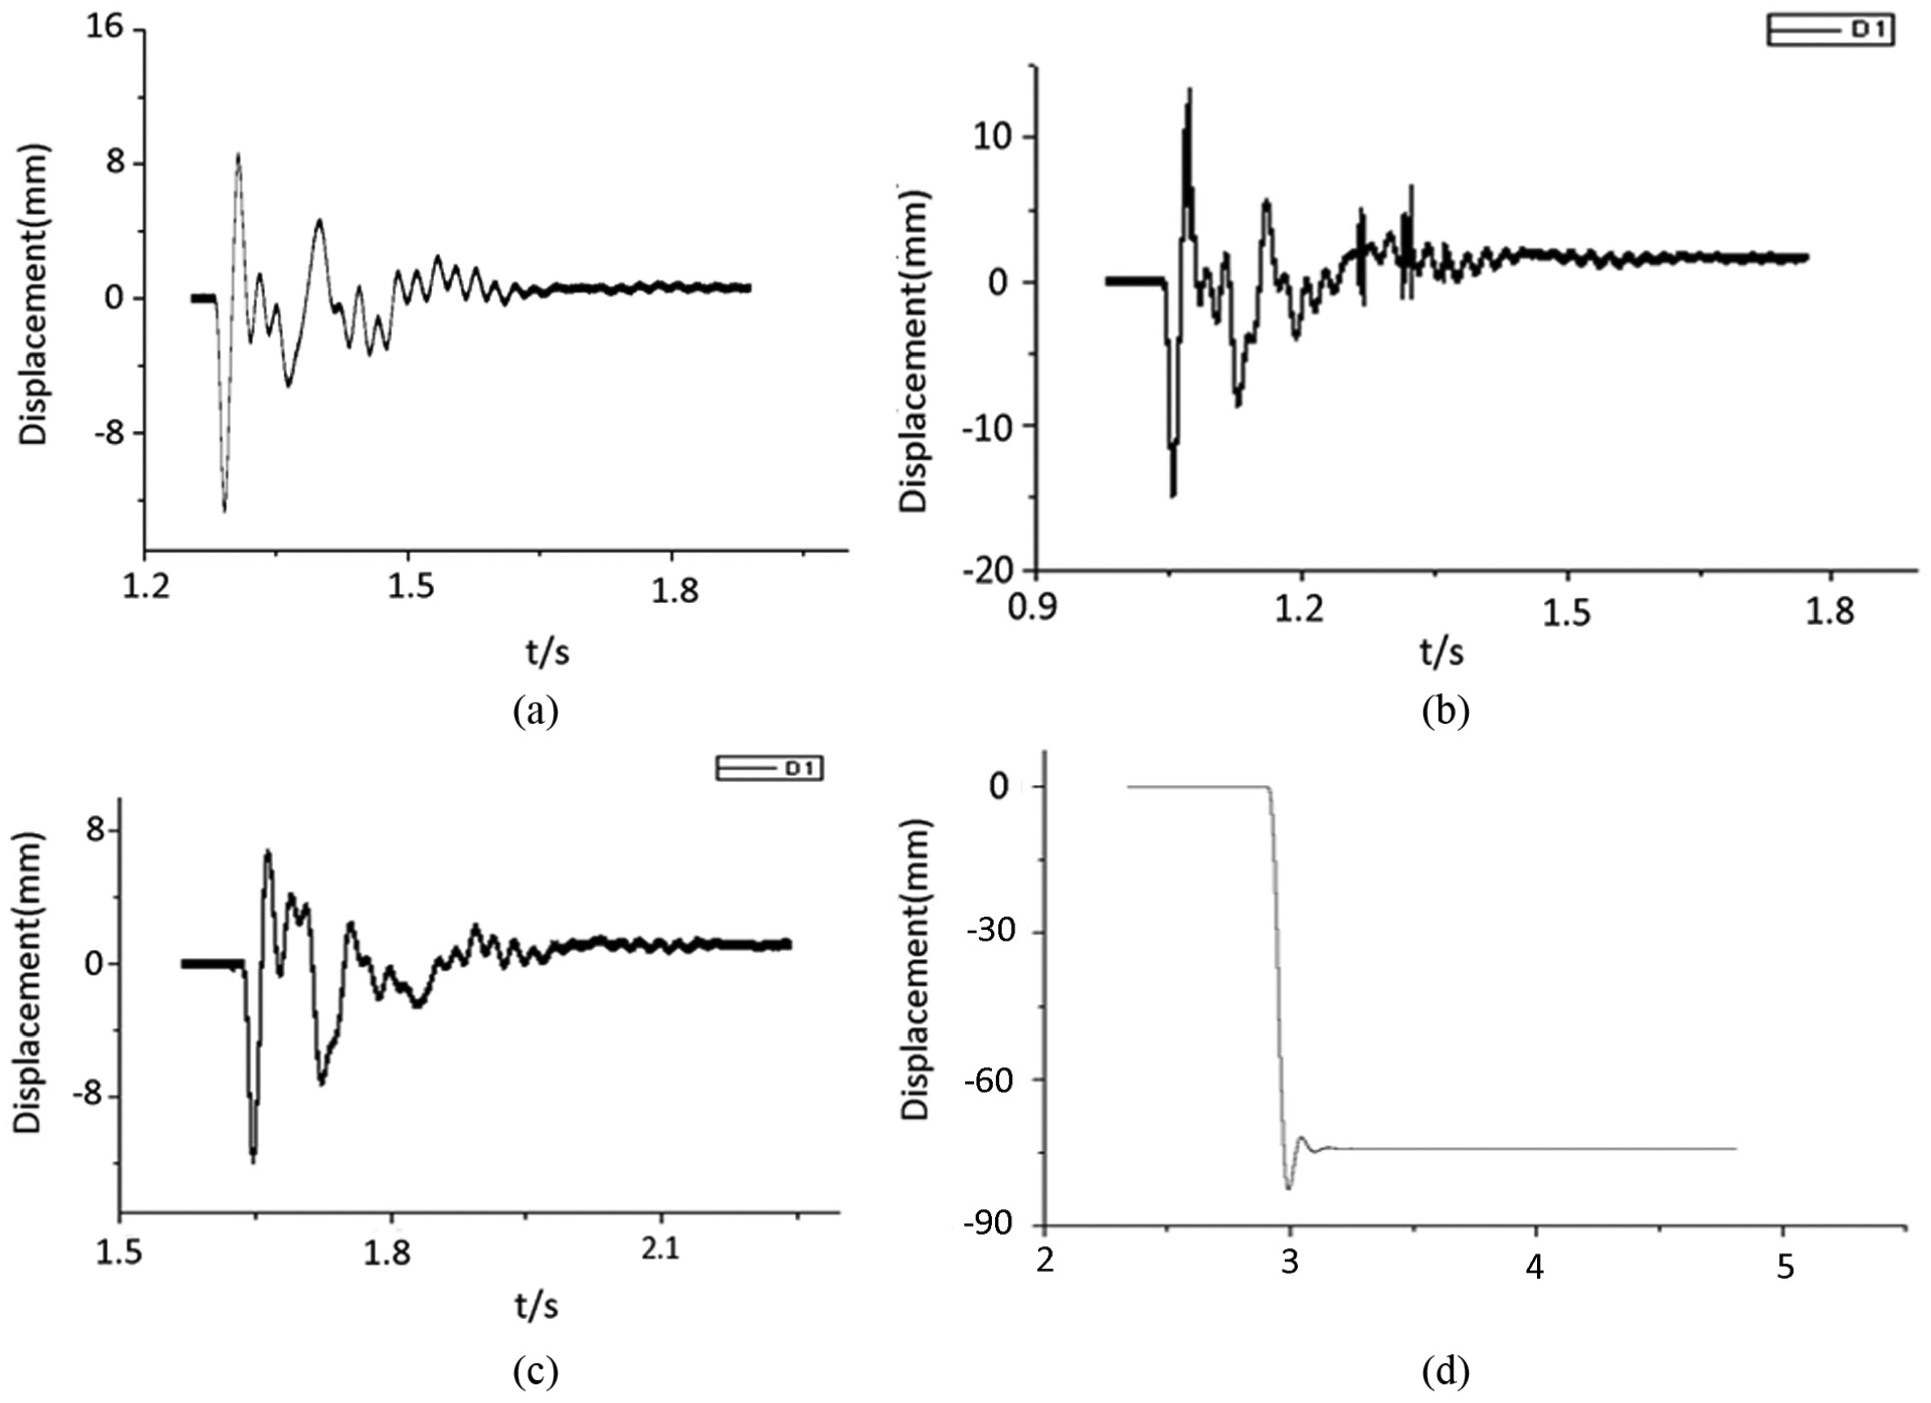
Typical time histories of the centre displacement for different cases: (a) B8-1, Stage 1, 0.8 kg; (b) B8-3, Stage 1, 1.0 kg; (c) B10-3, Stage 1, 1.0 kg and (d) B10-5, Stage 2, 30 kg.
The relationship between the maximum mid-span displacement and the TNT charge weights is depicted in Figure 9. It can be observed that for the same type of glazing panels, the displacement response increases with the increase in the TNT charge weight. The increase is almost linear with a slightly decreasing slope, and this is in line with the variation in the blast impulse in this range of charge intensity with a scaled distance of 4.5–7 m/kg1/3. Comparing the B8-series (8+1.14+8 mm) with the B10-series (10+1.14+10 mm) panels, increasing the thickness of the glass layers from 8 to 10 mm reduced the displacements by an order of 20%, thus improved the blast-resistant behaviour of the point-supported glazing panels.
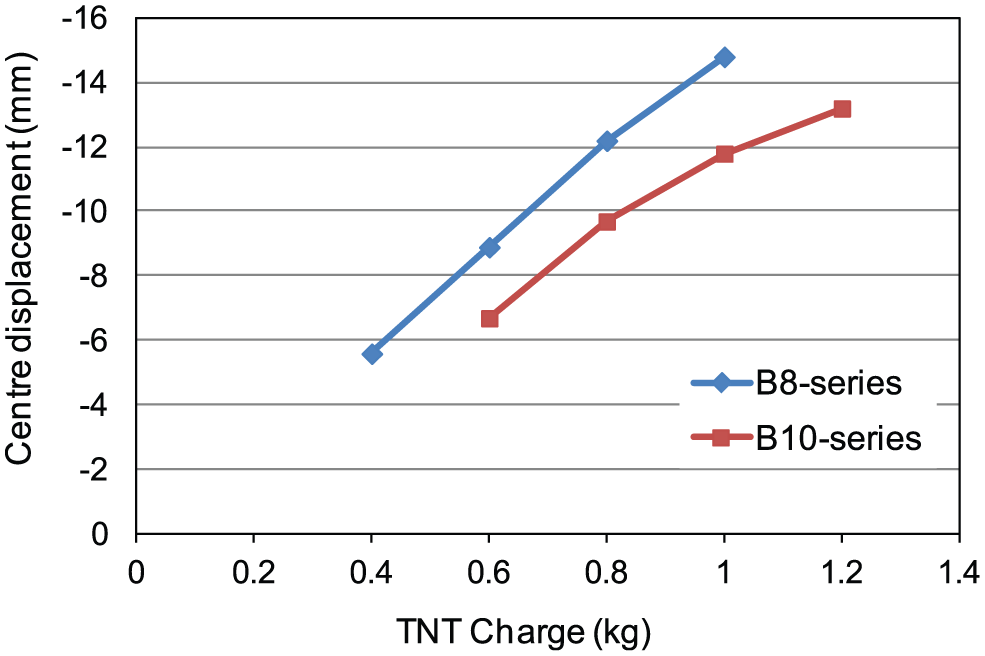
Variation in centre displacement with TNT charge.
The measured strains exhibited relatively large scatter. Overall, the maximum strain values reached during Stage 1 tests were in the order of 150 microstrain for the B8-series specimens and 100 microstrain for the B10-series specimens.
Numerical simulations
An FE model has been developed to analyse the general response of laminated glazing under blast load. The model is employed to simulate the tested glazing panels described in the previous sections and the predicted responses are compared with the test results, thus verifying the adequacy of the model and the corresponding failure criteria. The FE model is then employed to carry out extended parametric studies.
FE model
The FE model is developed with the general dynamic analysis software ANSYS/LSDYNA. For the laminated glazing panels under consideration, only a quarter of the panel needs to be modelled because of the symmetry. Figure 10 shows the configuration of the model along with the zoning of the mesh; the region around the point support is modelled using more refined mesh than the remaining region of the panel.
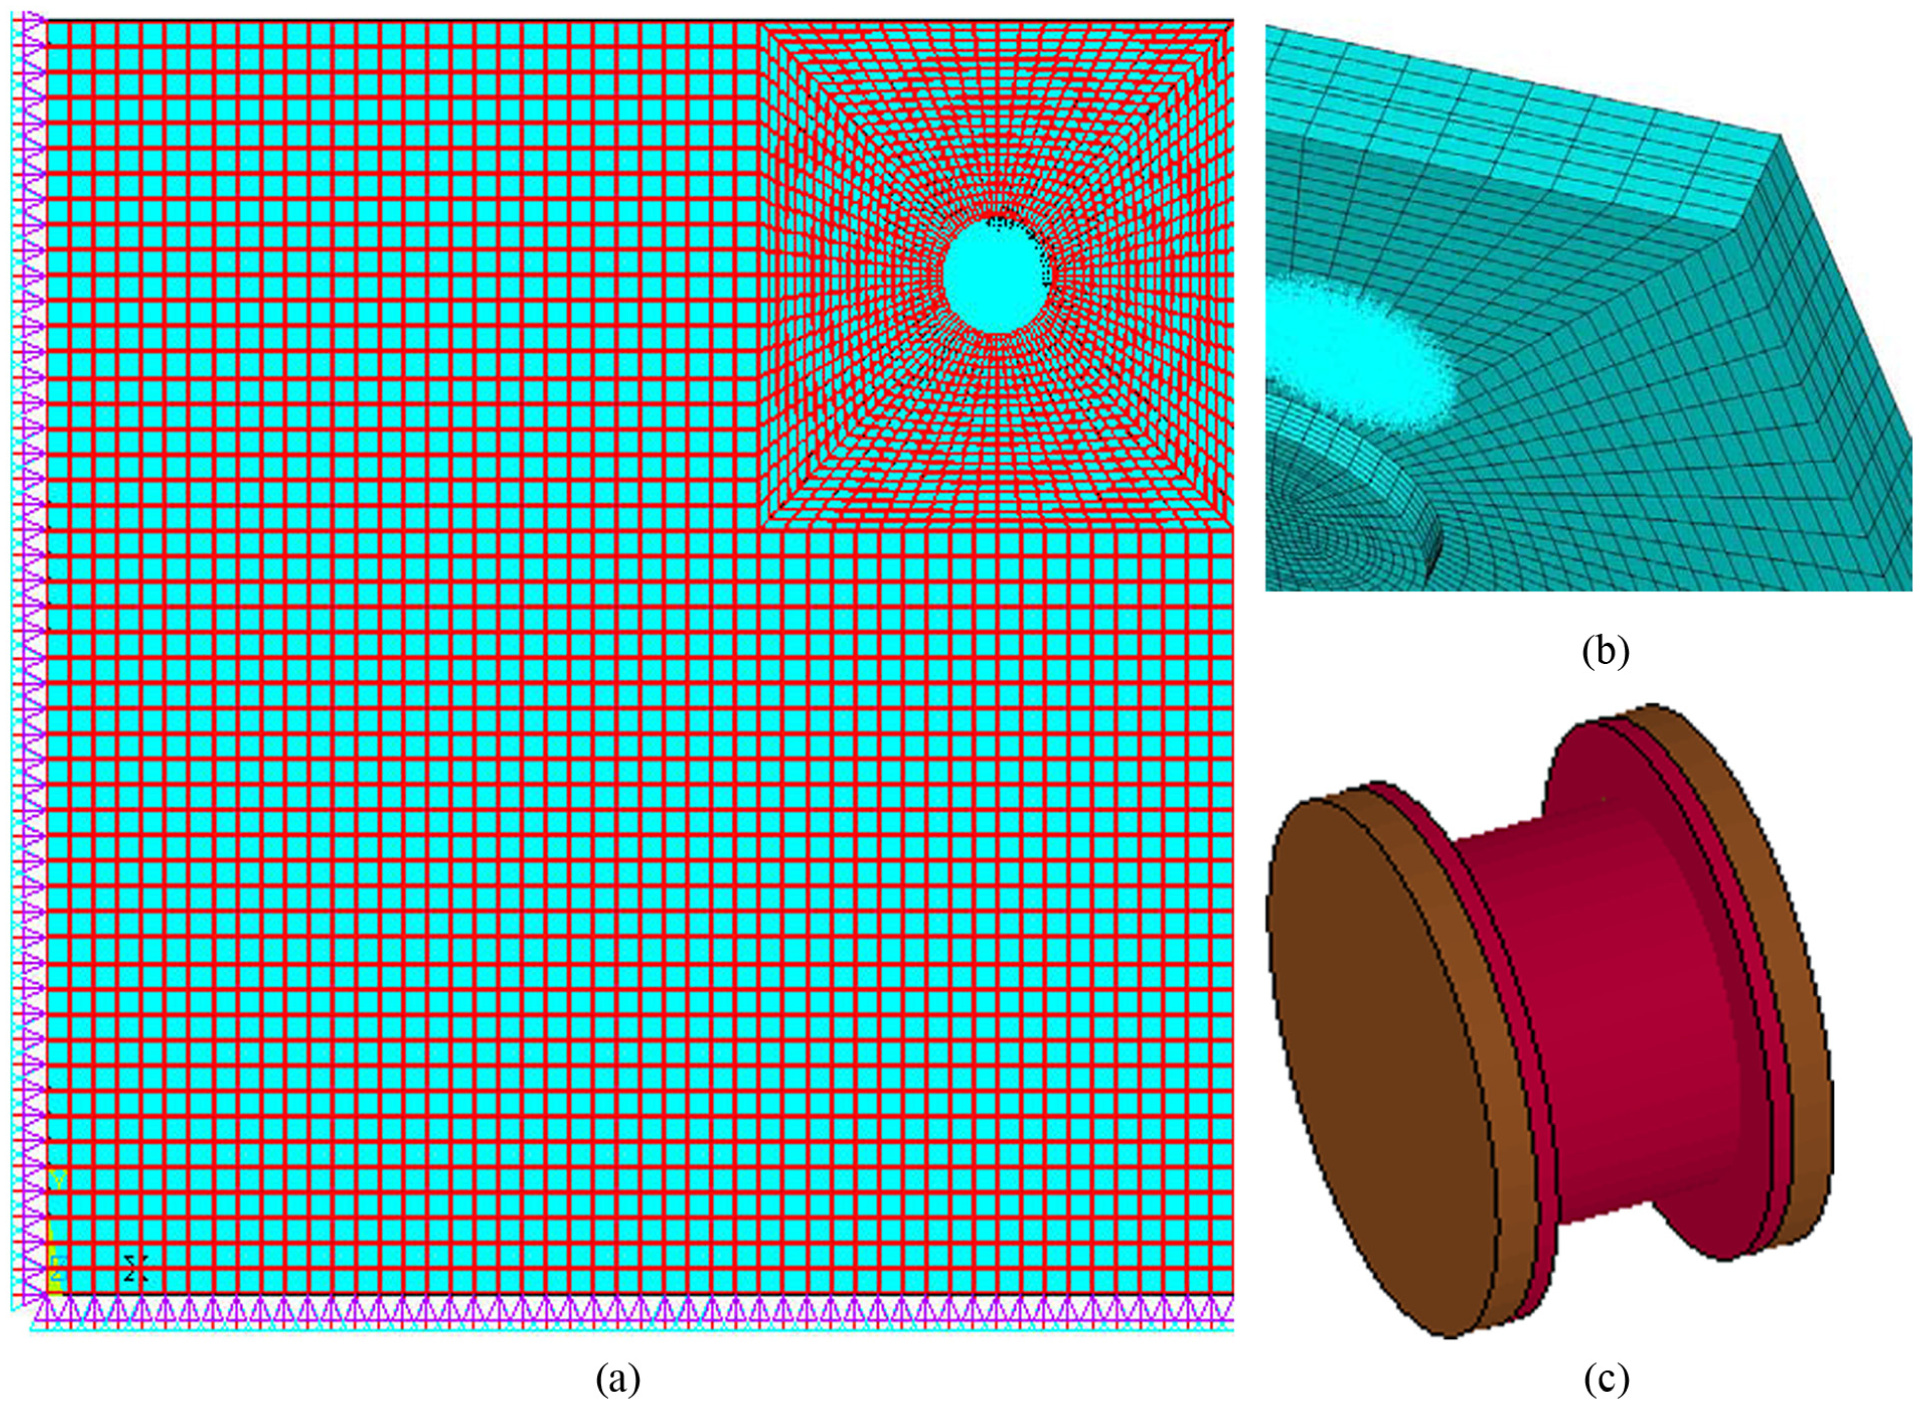
Finite element model: (a) FE model configuration, (b) close-up of support area and (c) close-up of the support connector.
The laminated glass is modelled directly using three layers of the materials, namely, a layer of glass, a layer of PVB and another layer of glass. The thickness of the glass and PVB layers can be specified separately and for the tested glazing panels these are 8 or 10 mm for the glass layers (for the B8-series and B10-series specimens, respectively) and 1.14 mm for the PVB layer. All three layers of the materials are modelled using solid elements (SOLID164 in LS-DYNA). Within each glass layer, the thickness is further divided into three solid elements (visible in Figure 10(b)) to ensure proper representation of the bending response. Considering that the glass layers are bonded to the PVB sheet in the actual laminated panel, in the FE model the glass layers are joined with the PVB layer at their interfaces assuming perfect bond. The debonding of PVB is not considered. The detail of the point support is modelled by inclusion of a fastener through a prepositioned hole in the 1/4 FE model at the designated location. The fastener itself is modelled by steel material, while the cushion interface between the fastener and the glass pane is modelled by a layer of rubber, as can be seen in Figure 10.
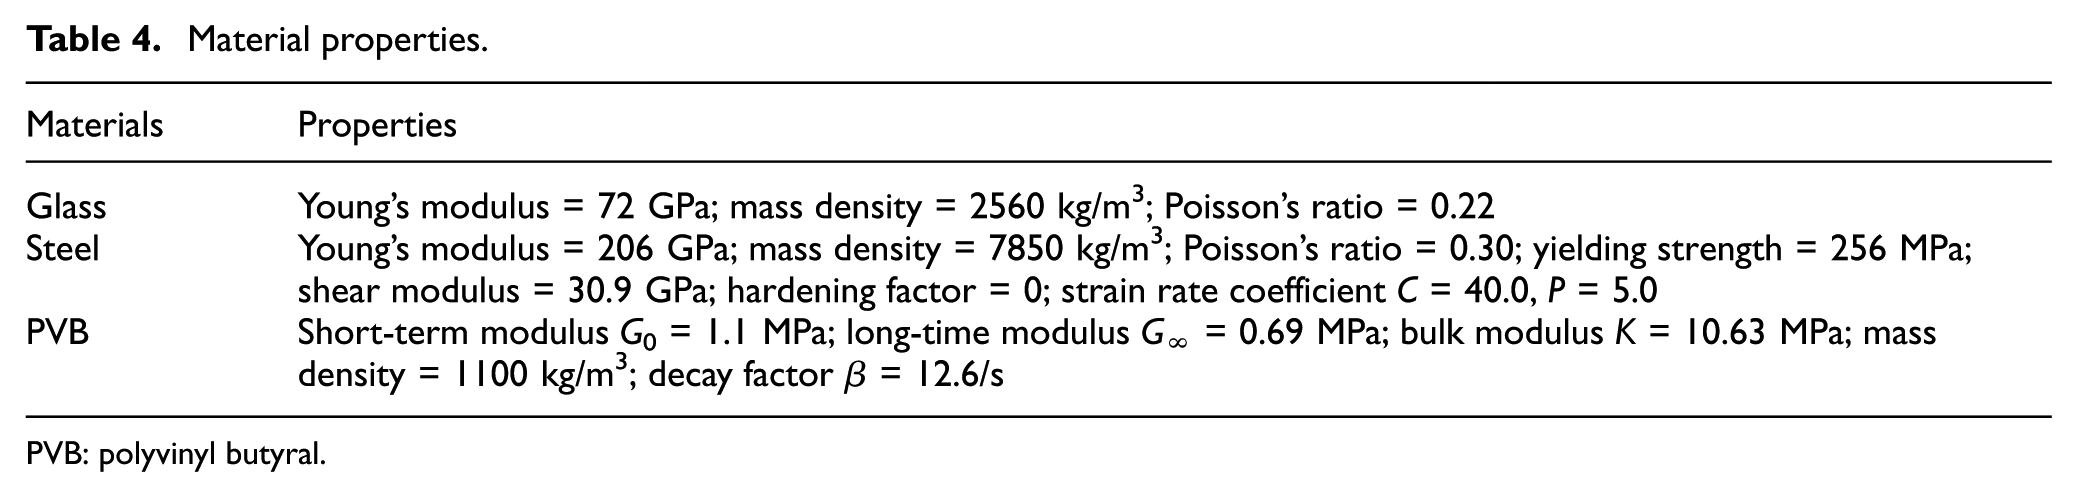
For the material properties, the glass is modelled as elastic-brittle material with a Young’s modulus of 72 GPa and a tensile strength of 84 MPa for the type of tempered glass under consideration. The PVB is modelled as a typical linear viscoelastic material, which may be described by

where

A strain failure criterion is adopted for the PVB and the ultimate limit strain is set to 1.0. The steel is considered as elastic–plastic material, for which the Cower–Symonds equation is adopted to take into account the strain rate effect.
Table 4 summarises the material properties (Wei, 2010).
Material properties.
PVB: polyvinyl butyral.
The blast loading is simulated by applying nodal forces uniformly over the front face of the glass panel. The time history of the applied blast load follows an idealised linear decaying curve, and it is defined by the peak load (overpressure) and the duration. As mentioned in section ‘Measured blast overpressure’, the blast peak overpressure and positive duration were taken from the predictions using the software A.T.-Blast (ARA, 2004), and the values of these parameters for the simulation of different blast tests are as listed in Table 3.
Simulation of field tests and comparison
The FE model is first verified by simulating the field tests and comparing the predicted responses and failure modes with the test results.
Representative displacement response time histories at selected locations for B10-2 and B10-4 tests are given in Figure 11. The maximum centre displacements from the simulation are compared with the test results in Table 5. The results tend to agree better for the B8-series of specimens than the B10-series specimens, but overall the comparison is favourable and the maximum difference between the simulation and test results is less than 35%, which is considered reasonable given the complexity of blast response and uncertainties involved in blast tests.
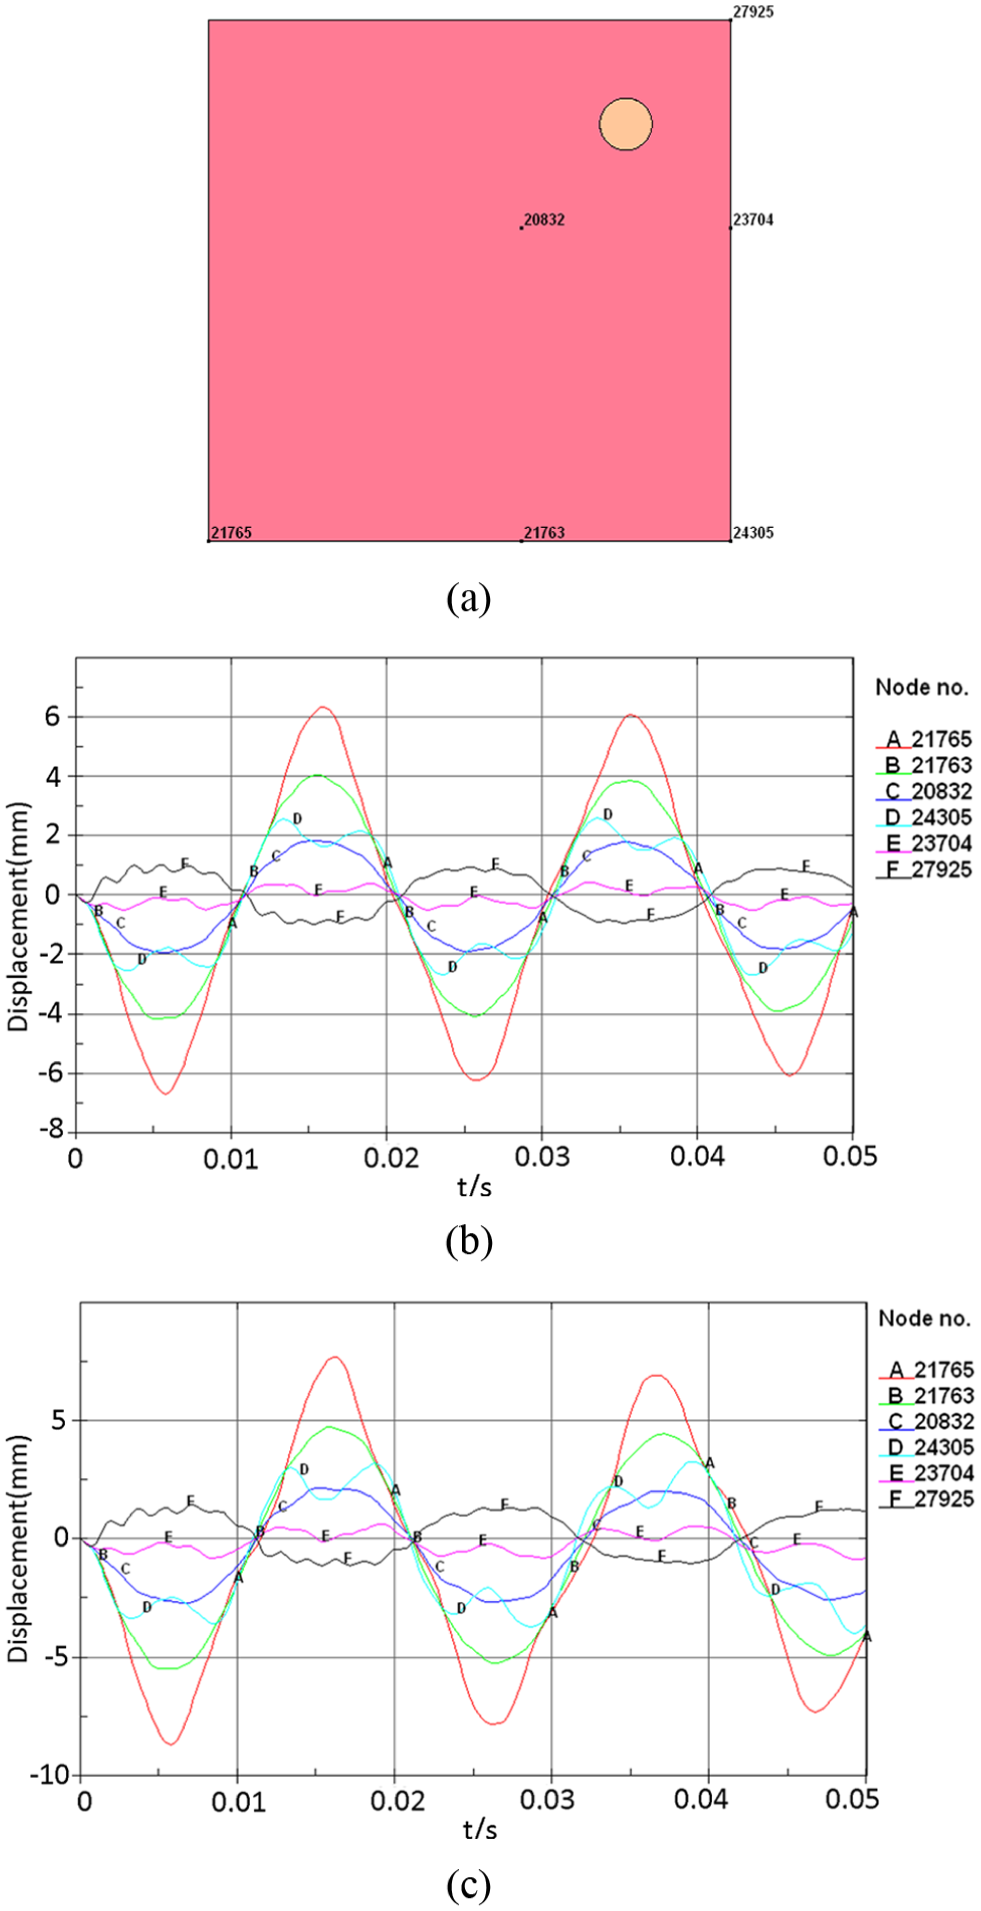
Typical time histories of displacement responses: (a) selected locations, (b) case B10-2 (0.8 kg, 5 m) and (c) case B10-4 (1.2 kg, 5 m).
Comparison of maximum centre displacements from simulation and tests.
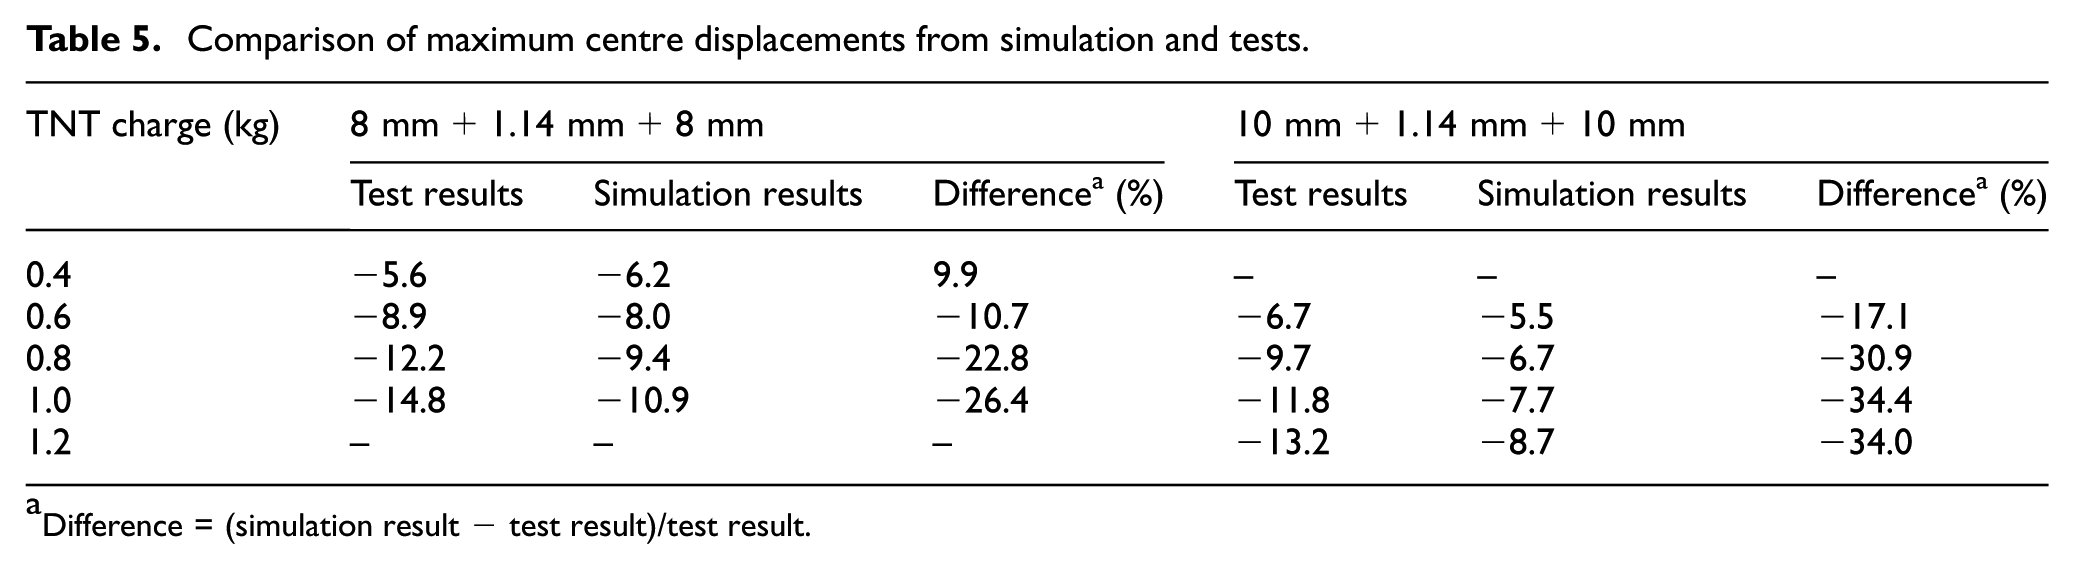
Difference = (simulation result − test result)/test result.
For the failure case of B10-5 under the 30-kg TNT blast load, Figure 12 illustrates the first principal stress contour at the time when the first crack is about to occur. The stress contour exhibits marked stress concentration around the rim of the support hole, leading to initiation of damage (fracture) at the rim of the support. Figure 13 shows the final failure modes for the B10-5 test. It can be seen that the glass layer fractures from the support hole in a radial pattern, while the PVB layer tears open in the corner area. This phenomenon agrees favourably with the observed failure mode from the test.
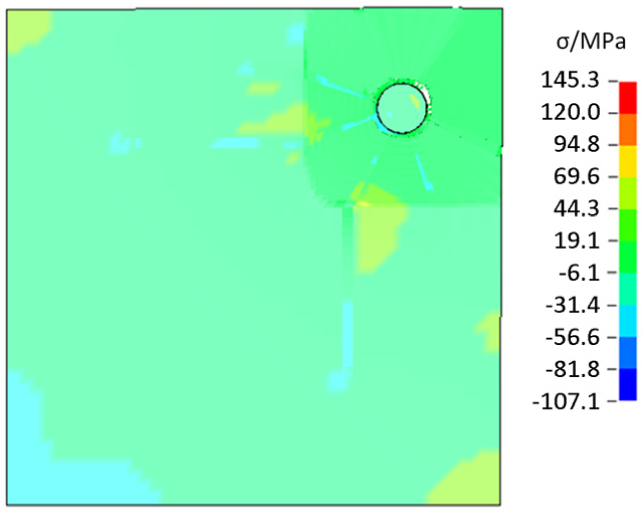
Stress (first principal stress) contour for case B10-5, 30 kg TNT blast load.
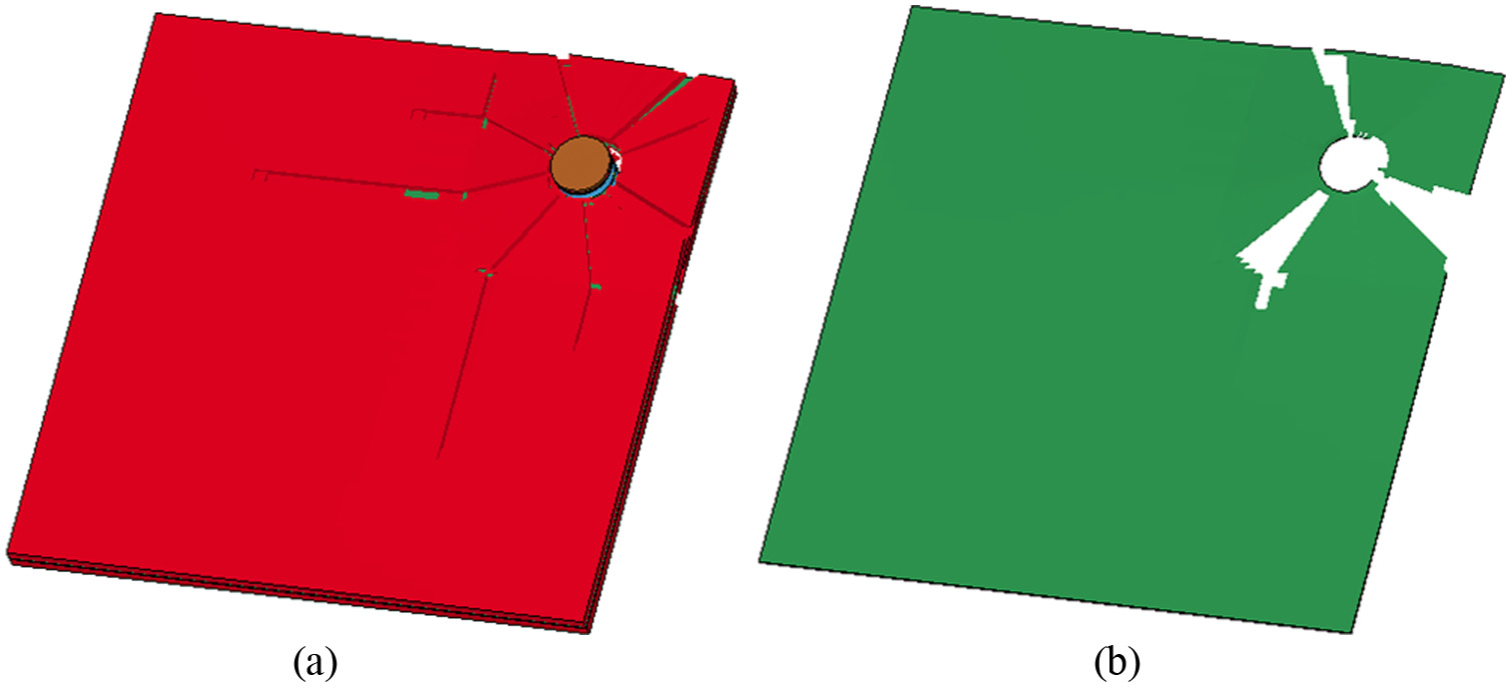
Failure modes of the laminated glass case B10-5 (blast load = 30 kg TNT at 5 m): (a) failure pattern in glass layer and (b) failure pattern of PVB.
Parametric study
Based on the verified numerical model, a parametric study has been carried out to investigate the influence of the TNT charge weights and the dimension parameters of the laminated glazing panel on the response of point-supported glass curtain wall subjected to blast loading.
Different combinations of the thickness parameters are analysed while the panel size is fixed to be 1 m × 1 m, including the following: (a) glass thickness 8 mm, varying PVB thickness from 0.76 to 1.52 mm (with a standard interval of 0.38 mm); (b) glass thickness 10 mm, varying PVB thickness from 0.76 to 1.52 mm; (c) glass thickness 6 mm, PVB thickness 1.14 mm and (d) glass thickness 12 mm, PVB thickness 1.14 mm. Each combination is analysed under a series of small blast loads corresponding to Stage 1 field tests, that is, with a standoff distance of 5 m and varying charge weight from 0.4 to 1.2 kg.
Figure 14 shows the variation in the maximum center deflection with an increase in the blast load for different panel thickness combinations. As expected, the deflection increases with the charge weight, and the increasing rate is almost linear for this range of the blast load, as explained before. Increasing the thickness of glass layers effectively reduces the deflection response. It should also be noted that under the 1.2-kg TNT (at 5 m) blast load, the laminated panels with glass thickness of 8 and 6 mm, respectively, already show signs of damage by glass fracture in the point-support region, as shown in Figure 15 (a) and (b). When the glass thickness increases to 10 mm, no crack is observed.
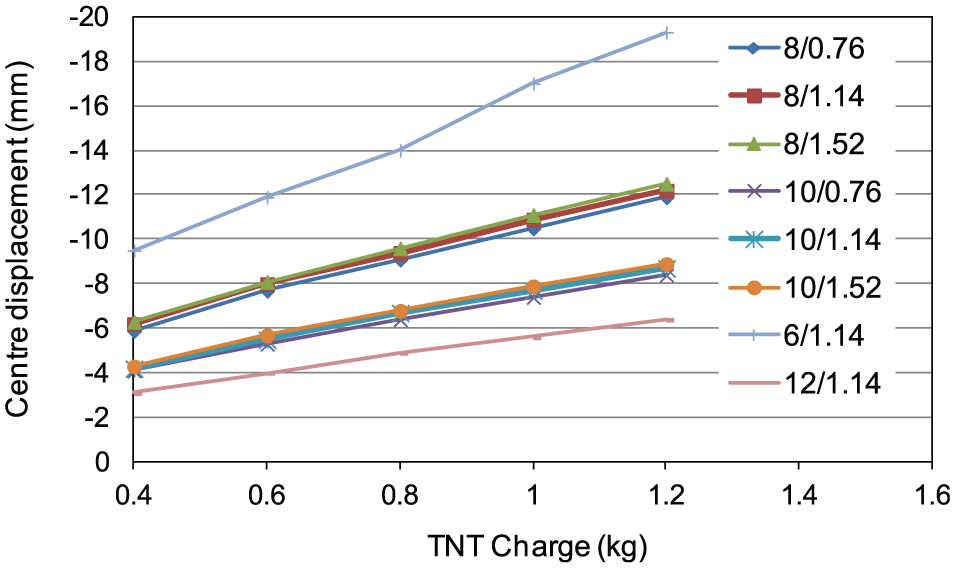
Maximum centre displacements of panels with different thicknesses of glass and PVB.
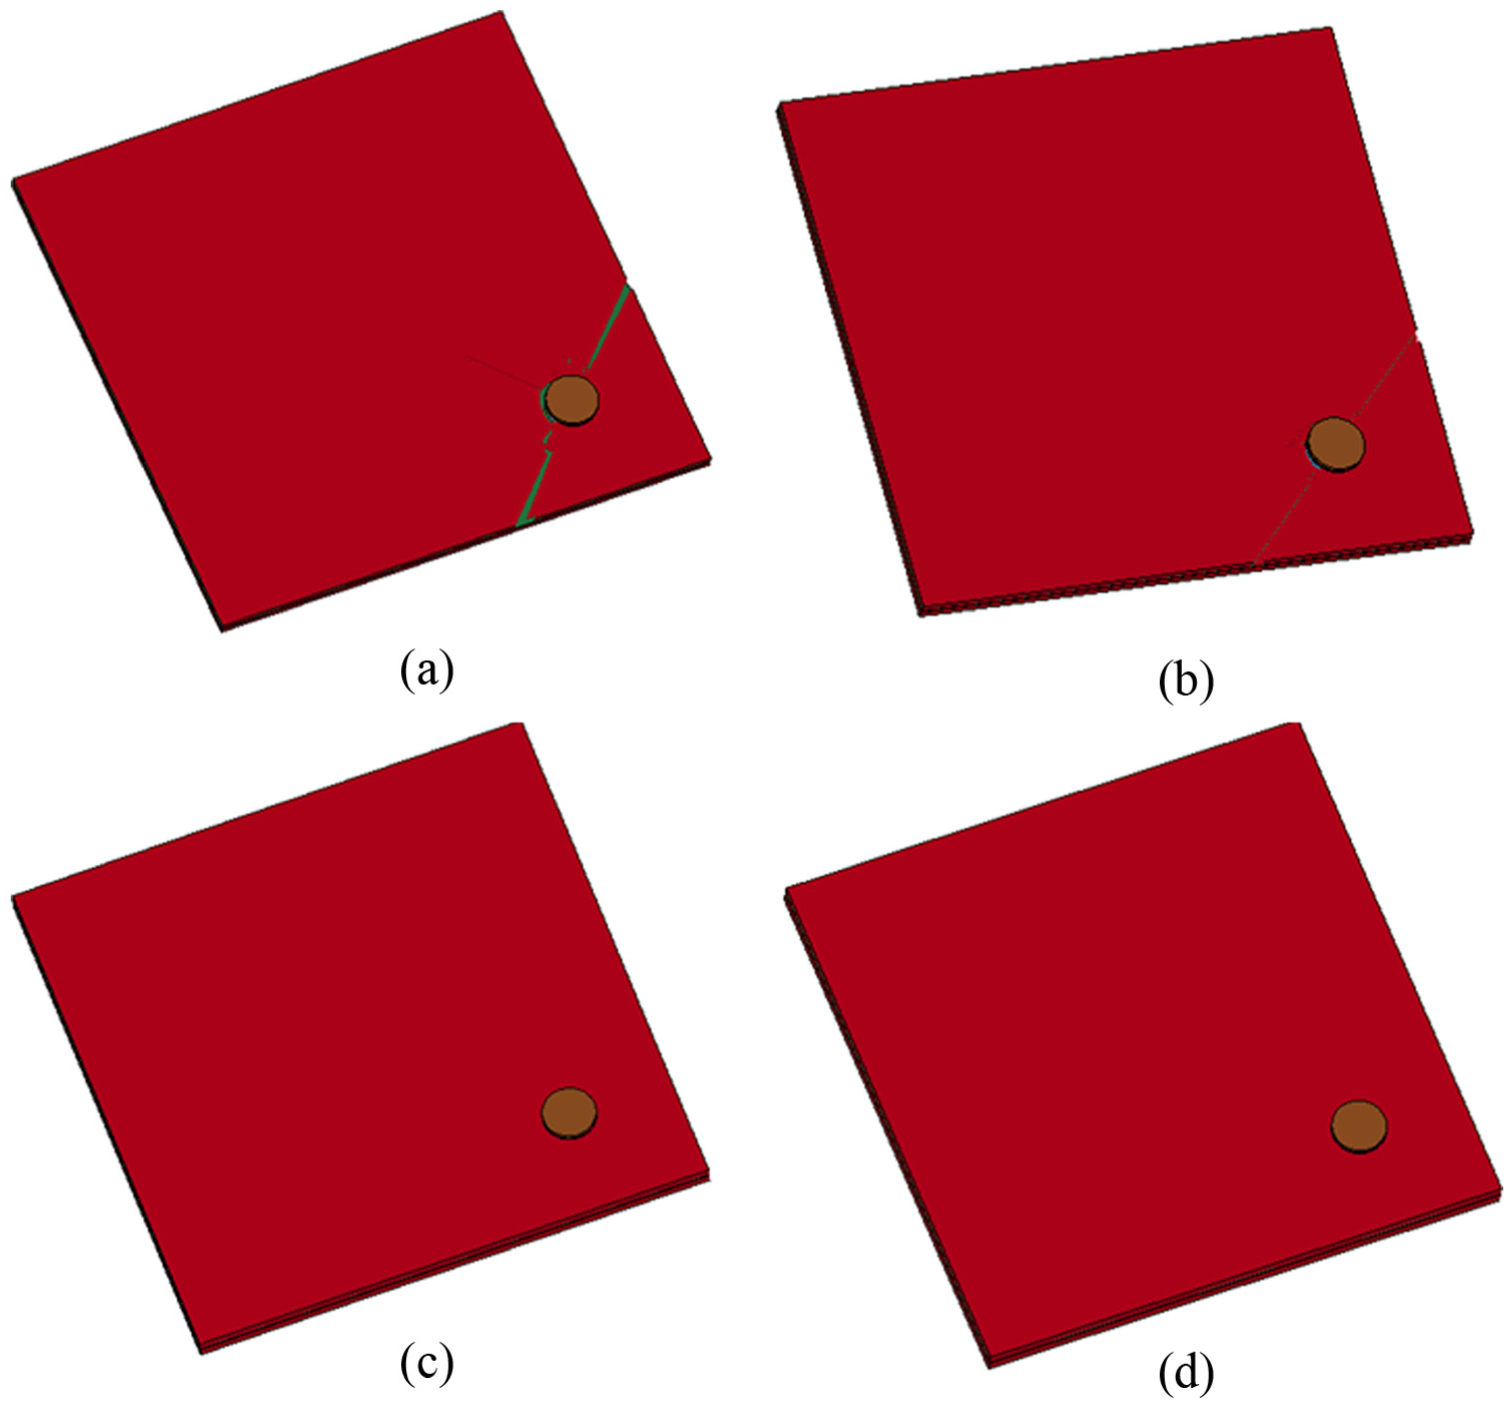
Performances for different compositions of panels (charge = 1.2 kg): (a) 6 mm+1.14 mm+6 mm, (b) 8 mm+1.14 mm+8 mm, (c) 10 mm+1.14 mm+10 mm and (d) 12 mm+1.14 mm+12 mm.
On the other hand, increasing the thickness of PVB results in some slight increase in the deflection response and decrease in stress response. For an example, when the thickness of PVB increases from 0.76 to 1.14 mm and then to 1.52 mm with the thickness of glass remaining at 8 mm, the maximum deflection increases from 7.7 to 7.9 mm and then 8.1 mm, whereas the maximum stress of the panel decreases from 50.9 to 43.5 MPa and then to 39.6 MPa.
The next set of parametric calculations is concerned with the variation in the area of the panel. Here, the thickness profile is fixed as 8 mm glass+1.14 mm PVB+8 mm and the glass edge distance is fixed at 0.1 m. The area is varied by varying the side length of the square panel, namely, 0.8, 1.0, 1.5 and 2.0 m. Figure 16 plots the variation in the maximum centre deflection with the increase in the charge weight, and Figure 17 shows the displacement–time histories. It can be observed that increasing the size of the panel results in persistent increase in the deflection response, and this apparently is attributable to the decrease in the global bending stiffness with an increase in the panel size, which also results in an increase in the natural period of the panel as can be noted from the response time histories. In fact, the glass in the larger dimension cases starts to fracture in the support areas at a charge weight below 1.2 kg. Figure 18 depicts the development of glass fracture in the 1.5-m panel case; the glass starts to show fracture under a TNT charge of 0.6 kg. The PVB still remains intact and therefore the centre displacement does not exhibit disproportionate increase despite glass fracture at the supports.
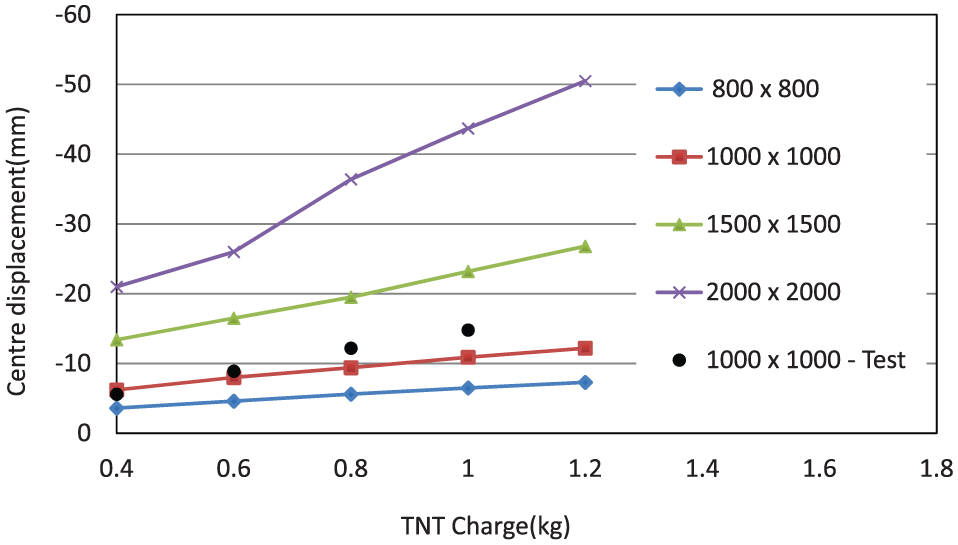
Maximum centre displacements of panels with different area sizes.
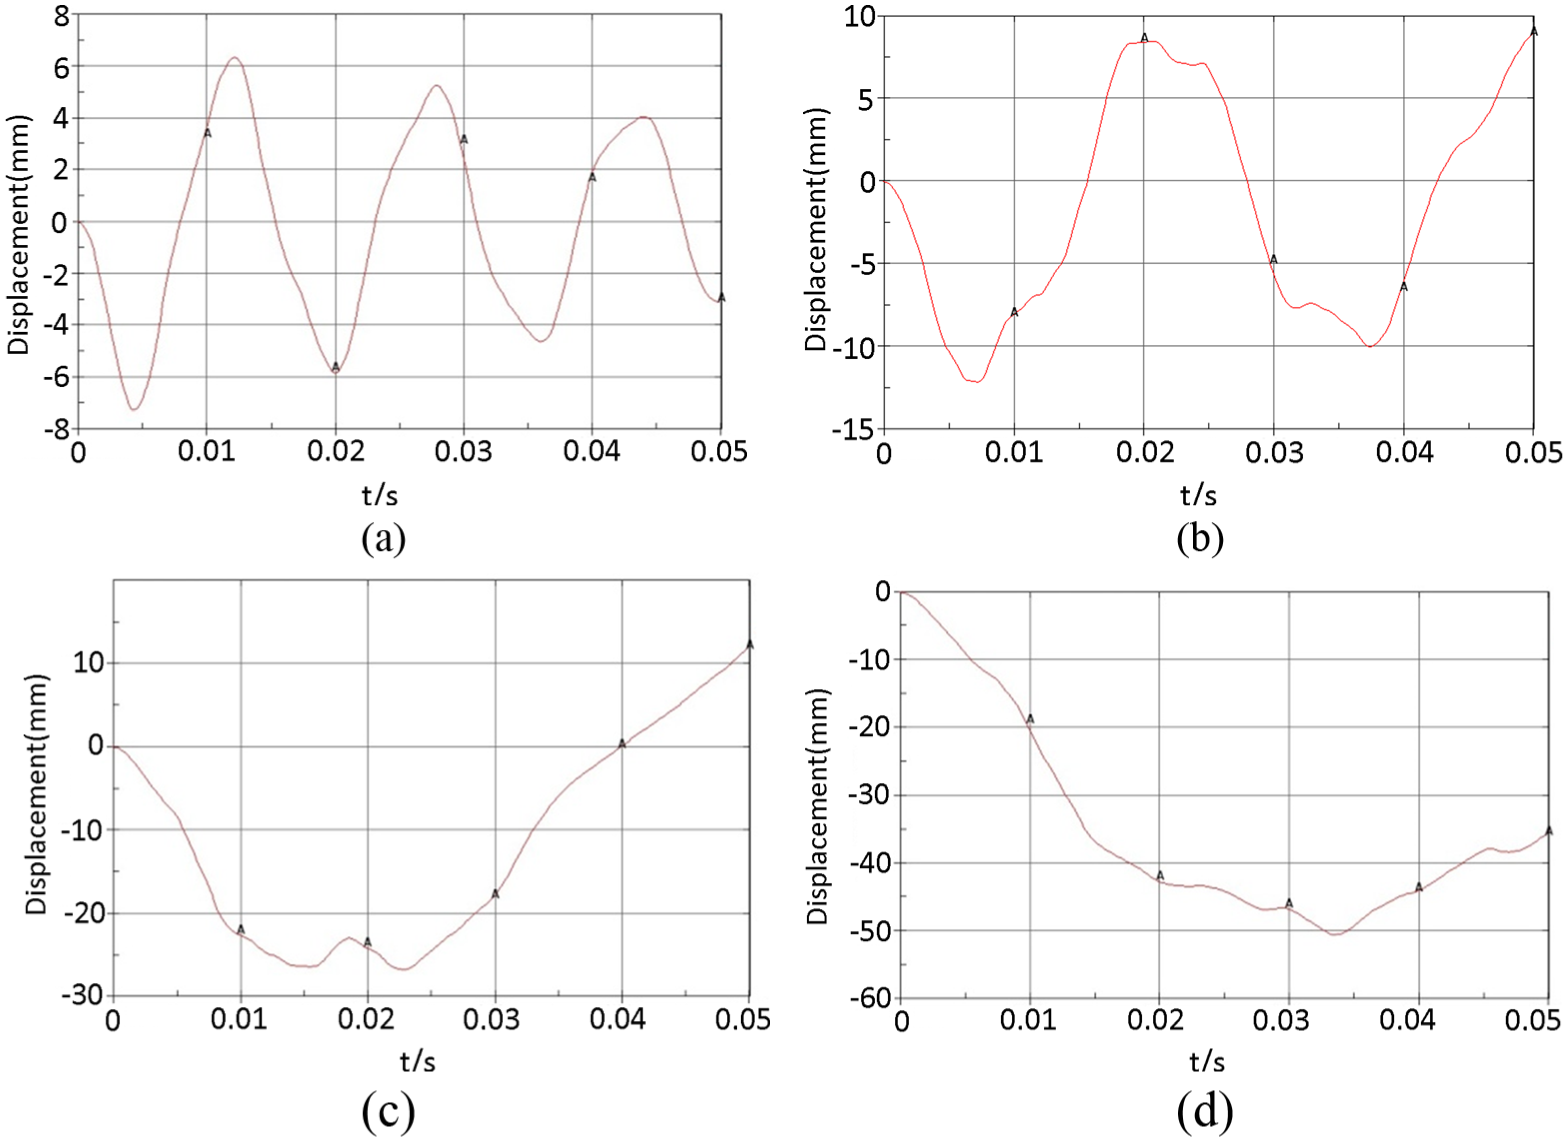
Time history responses of centre displacements with different area sizes (charge = 1.2 kg): (a) 0.8 m × 0.8 m, (b) 1 m × 1 m, (c) 1.5 m × 1.5 m and (d) 2 m × 2 m.
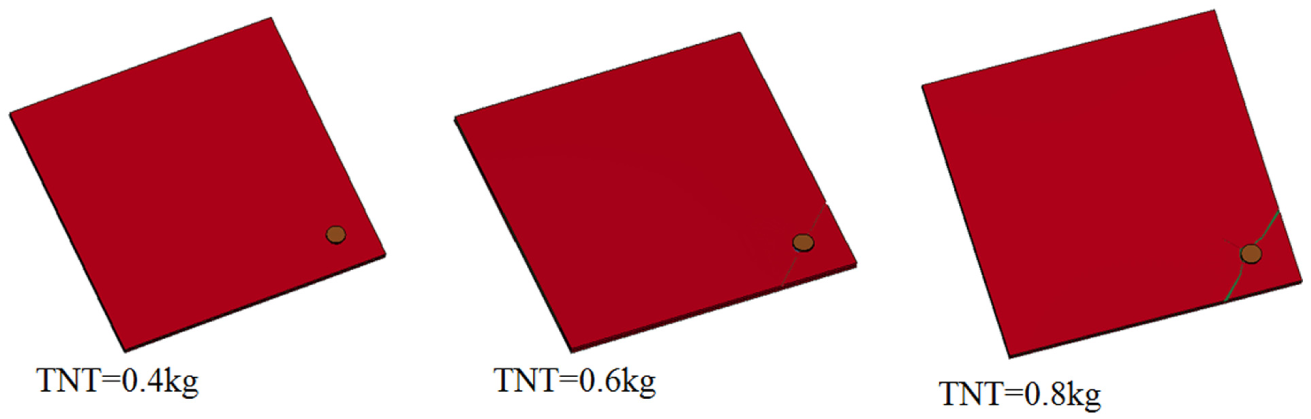
Response of glass at support region for panel of 1.5 × 1.5 m.
A similar effect is observed when the location of the point support relative to the panel side edge is varied, as shown in Figure 19 for the edge distances of 100, 150 and 200 mm, respectively. Reducing the support-to-edge distance effectively increases the net span of the panel, thus reducing the global bending stiffness and thereby resulting in an increase in the deflection response.
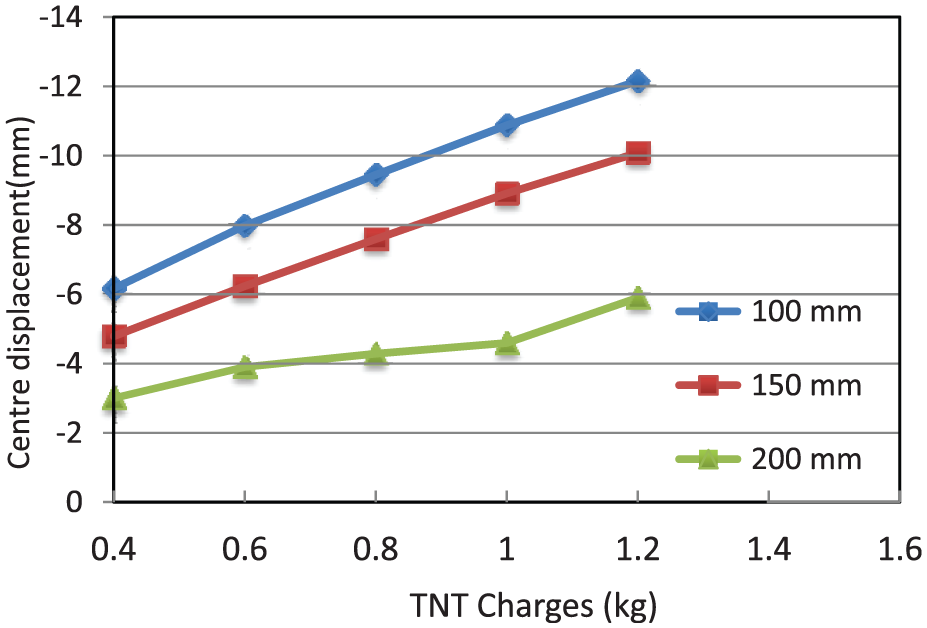
Maximum centre displacements of panels with different edge distances.
Finally, the responses of rectangular laminated panels with different aspect ratios (i.e. length-to-width ratios) are examined. Figure 20 shows two typical failure patterns. It is found that changing the aspect ratio of the panel, while keeping the same area, can change the failure pattern. When the aspect ratio is close to 1, cracking forms from the support hole in about 45° to the edge lines, that is, perpendicular to the diagonal of the panel. This agrees with the observed failure mode from the test of square panels. When the aspect ratio is larger and the shape becomes narrower, cracking tends to form along a line parallel to the shorter side of the panel.
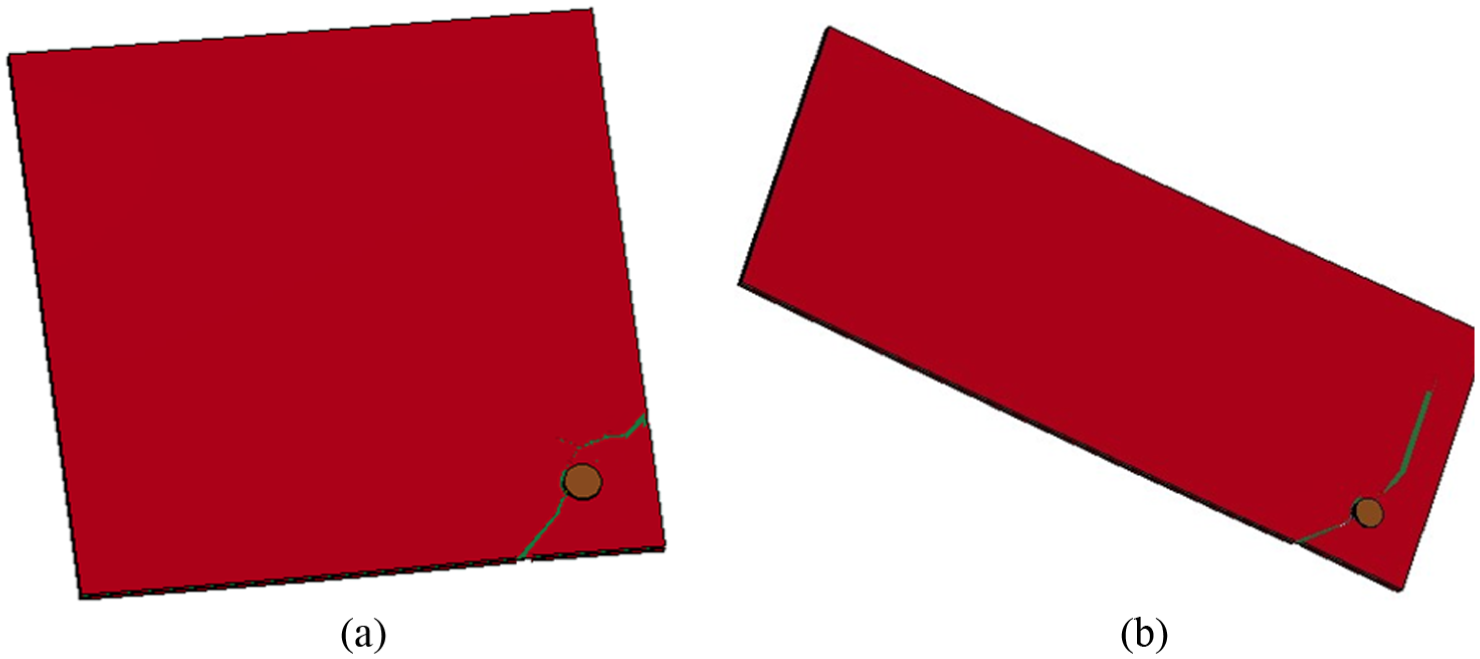
Failure patterns with different aspect ratios: (a) 1580 × 1580 and (b) 1000 × 2500.
Conclusion
This article investigates the blast response of point-supported laminated glass curtain wall through field blast tests and numerical simulation. The main findings of this study are summarised as follows:
The overpressure time histories as obtained from the measurement panel during the field tests exhibited typical characteristics of blast loading with an instantaneous rise, followed by a rapid decay and a relatively short positive phase. The measured peak overpressure and duration for different charge weights agree consistently with the empirical predictions. Thus, the blast load acting on a steel-like panel may be reasonably predicted using a standard empirical approach.
The displacement response of the laminated glass panels increases with the increase in the TNT charge. The failure mode of such a glazing system may be characterised by the tearing off of PVB at the point supports, while the glass shards still adhered on the PVB.
An FE model with a multi-layer mesh scheme, where the glass layers and the PVB layer are represented explicitly, is shown to be capable of simulating the response of the laminated glass panels. The displacement responses obtained by the numerical simulation agree favourably with those measured from blast tests. The development of fracture damage and the final failure modes are also captured in the numerical simulation in a realistic manner.
Parametric studies demonstrate that increasing the glass thickness is helpful in reducing the deflection response and increasing the blast resistance of the point-supported glass curtain wall. Increasing the thickness of the PVB tends to help in reducing the stress response.
Further work will be carried out to evaluate the response of the type of laminated glazing system under a wider range of blast load scenarios using the FE model, with an aim to generate systematic limiting damage criteria, for example, in the form of pressure–impulse (P–I) diagrams. It should also be pointed out that the exact blast load on a glass panel going through a damage (breaking) process is a complicated phenomenon, and in this respect further verification and calibration studies will also be required.
Footnotes
Declaration of Conflicting Interests
The author(s) declared no potential conflicts of interest with respect to the research, authorship and/or publication of this article.
Funding
The author(s) disclosed receipt of the following financial support for the research, authorship and/or publication of this article: The authors would like to acknowledge the financial support from National Science Foundation of China (51278365) and State Key Laboratory for Disaster Reduction in Civil Engineering in China (SLDRCE10-B-10).