
Abstract
We carried out an experimental investigation to study the influence of concrete carbonation on the natural frequency of simply supported reinforced concrete beams. A total of 10 reinforced concrete test beams and 12 concrete-carbonation test specimens were subjected to different accelerated carbonation stages for 0, 7, 14, 21, and 28 days. Modal tests were performed on reinforced concrete test beams after the accelerated carbonation stages. In order to reduce the effect of other factors on the modal tests, constant temperature, relative humidity, and boundary conditions of the test beams were maintained in the experimental process. The experimental results show a trend of the natural frequencies of reinforced concrete test beams to decrease with the increase in concrete-carbonation depths. With statistical analyses of experimental data, this study established the relationship between concrete-carbonation depths and natural frequencies. Fitting lines for the drop in natural frequencies and carbonation depths are obtained for the first four modal frequencies. Based on the analysis of the physicochemical processes of concrete carbonation, the main reason behind the drop in natural frequencies is the increase in mass after concrete carbonation. The percentage composition of increase in mass after complete carbonation is obtained based on the analysis of the physicochemical process. This analysis demonstrates part of the reason for the drop in natural frequencies and proves that the experimental results are reliable and credible. This study provides further insight into the use of modal parameters to assess damage in concrete structures in structural health monitoring.
Introduction
Reinforced concrete (RC) structures are used widely in a large number of bridges and other civil engineering structures. Because RC structures are exposed to many different types of environment, it is considerably important to understand the durability of RC. In these respects, the performance of RC structures has generally been given more attention (Maalej et al., 2010; Page and Treadaway, 1982). In the early development of RC structures, interest was motivated in the use of many nondestructive system identification (SI) techniques to monitor and assess the performance of structures (Chang et al., 2001). A better approach to assess bridge working conditions is one that uses global indices. The vibration test and modal analysis techniques enable global dynamic properties to be measured for the purpose of assessing performance integrity (Esfandiari et al., 2013; Salawu and Williams, 1995). The main purpose of structural health monitoring (SHM) is to detect damage in its early stage and minimize or prevent premature failure. Most popular SI methods are based on changes in measured vibration responses. These measured vibration responses include natural frequencies, mode shapes, and modal damping. The principle of SI methods is that measured system parameters, including natural frequencies, mode shapes, and modal damping, are functions of the physical properties of structures. These physical properties of structures include stiffness, mass, and damping, among other properties. In fact, any change in the physical properties due to damage results in measurable change in the system dynamic response. Natural frequencies give a good overview of the global structural condition (Siringoringo and Fujino, 2012). In some applications, these parameters have proven to be a reliable and sensitive indicator of structural performance (Bayraktar et al., 2015; Esfandiari et al., 2013; Vestroni and Capecchi, 2000). It is well known that natural frequencies are easy to monitor in many structures.
Concrete in bridge structures is constantly subjected to
The use of natural frequencies as parameters for SHM is popular and effective but needs to be further developed. Most numerical or experimental studies focus on a particular type of damage (Li et al., 2014; Ni et al., 2006), for example, the deterioration of stiffness due to severe damage or cracking. For RC structures exposed in an atmospheric environment, the first step of deterioration is concrete carbonation. The time for carbonation to reach the surface of the steel reinforcement is likely to be several decades, and prior to concrete carbonation, the degree of steel reinforcement corrosion is limited. In this process, the main effect of the degree of concrete carbonation is on the natural frequencies of RC structures. This article is concerned with the changes in natural frequencies caused by the concrete-carbonation process with the view of making the SHM technique more reliable and effective. The primary objective of the experimental study is to establish relationships between the degree of concrete carbonation and the changes in natural frequencies. Comparing the experimental data with the analysis of the physicochemical processes of concrete carbonation, we have determined the effect of concrete carbonation on natural frequencies. The main reason for this phenomenon is the increase in mass due to concrete carbonation. Using the experimental test data, we have established the fitting equations that describe the relationship between the natural frequencies and concrete-carbonation depth. This is the main new result of this study. The results may provide further insight into the use of modal parameters to assess damage in concrete structures in SHM.
Experiment setup
The experimental program is designed to investigate the effect of concrete carbonation on the natural frequencies of RC structures. In order to accelerate the concrete-carbonation process, a carbonation chamber was employed. The length and width of the carbonation chamber in our laboratory are 4.0 and 3.0 m, respectively. To ensure good pneumatic transport, the distance from the edge of the test beam to the carbonation chamber wall should be not <0.4 m. Therefore, the length of the RC test beam should be not >3.2 m. The tested beams were simply supported using a fixed-pin pedestal and hinged support. The boundary conditions were unchanged during the experimental process. The clear span of the RC test beam was 3.1 m. The modal test was performed in the carbonation chamber, and the carbonation depths were measured from concrete-carbonation test specimens at the same time.
The time spans of accelerated carbonation were 0, 7, 14, 21, and 28 days, defined as stages 0, 1, 2, 3, and 4, respectively. At the end of each stage, every RC test beam was subjected to a modal test to estimate its natural frequencies. Then, a dynamic test response was obtained using a fast Fourier transform (FFT). In order to measure the carbonation depths at the end of each stage, a total of six prism-shaped concrete-carbonation test specimens, sized at
Specimens
Two kinds of specimens were poured for this experiment at the same time. The first are the RC test beams, and the second are concrete-carbonation test specimens. Each RC test beam had a length of 3.2 m, a width of 0.15 m, and a height of 0.12 m. The main reinforcement comprised
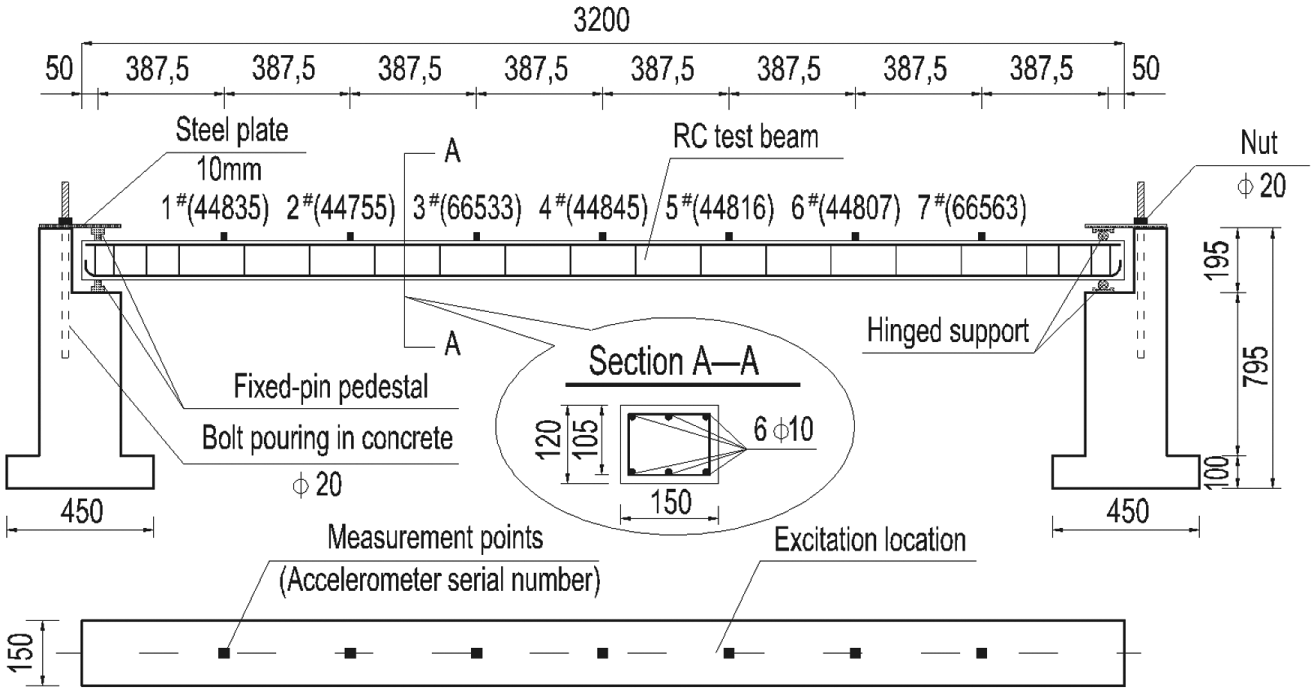
Detailed configuration of RC test beam (mm).
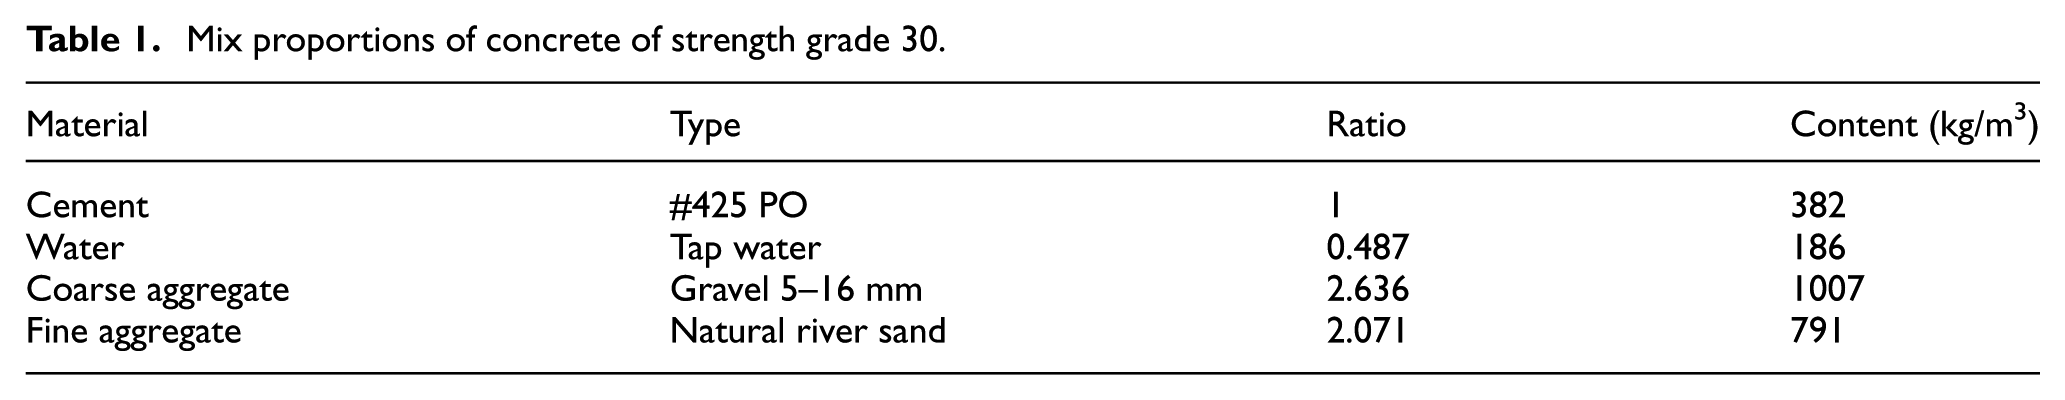
Mix proportions of concrete of strength grade 30.
Mix proportions of concrete of strength grade 40.
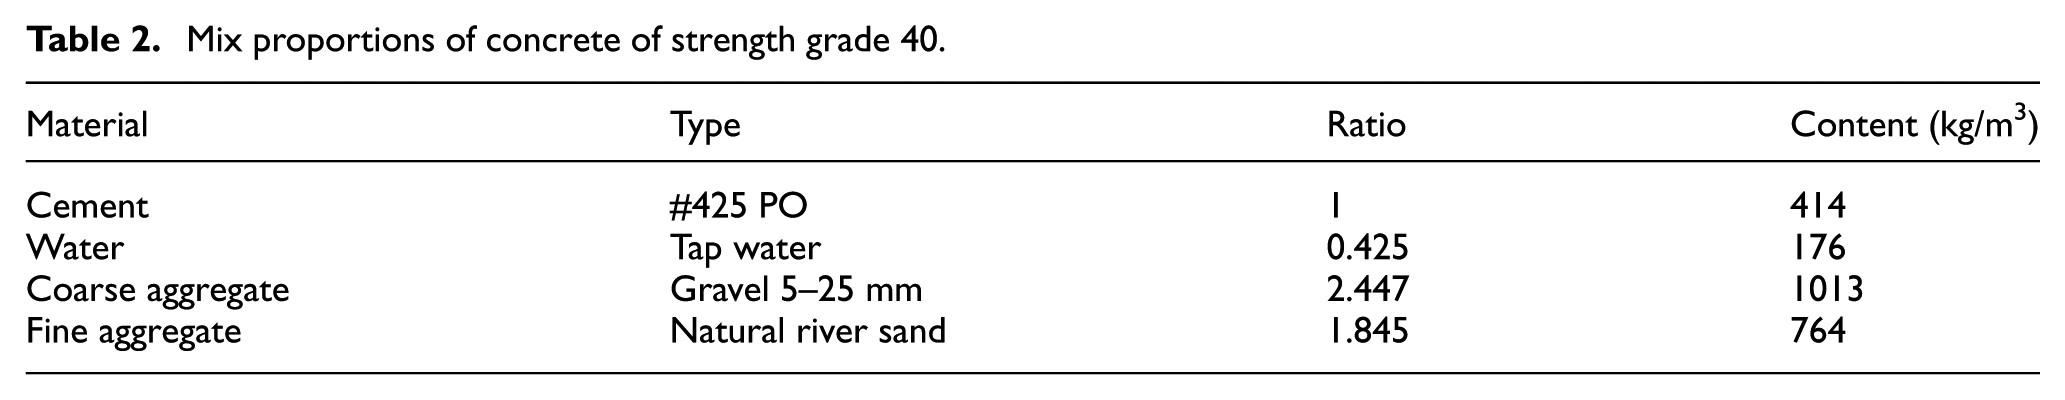
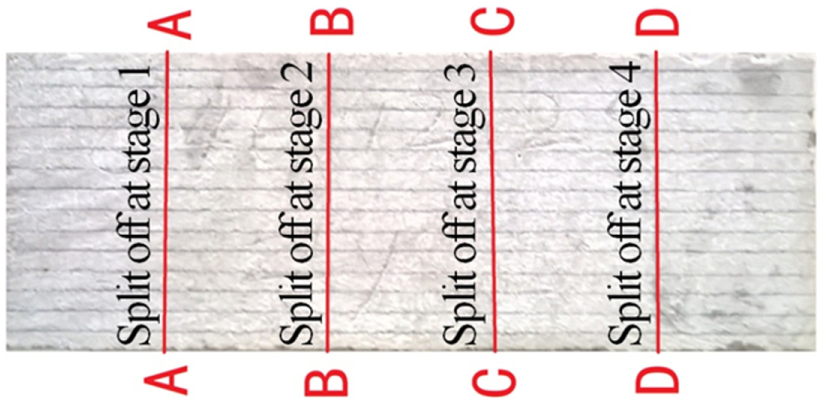
Table 3 shows the serial numbers of RC test beams, serial numbers of concrete-carbonation test specimens, and the type of test undergone. A total of 10 RC test beams (C30N01–C30N05 and C40N01–C40N05) were subjected to modal tests. A total of 12 concrete-carbonation test specimens (C30-1–C30-6 and C40-1–C40-6) were used for carbonation depth tests. The cross section of each concrete-carbonation test specimen is the same as the cross section of the RC test beams, namely, a width of 150 mm and a height of 120 mm. The length of the concrete-carbonation test specimens is 400 mm. The concrete-carbonation test specimens were split off four times to test carbonation depths after accelerated carbonation of 7, 14, 21, and 28 days. The locations of splitting are shown in Figure 2.
Test arrangement.
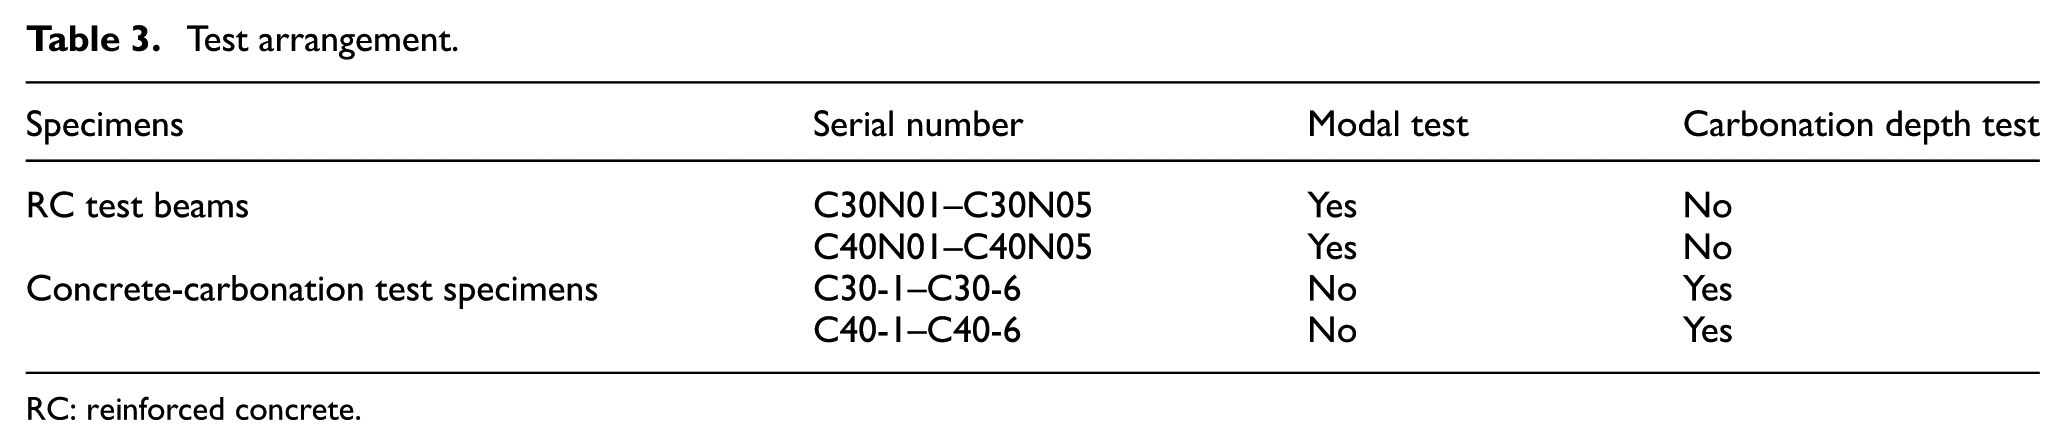
RC: reinforced concrete.
Details of concrete-carbonation test specimen.
Boundary conditions of RC test beams
Modal parameters, such as natural frequencies, mode shapes, and modal damping, are affected by mass, damping, stiffness, and boundary conditions. In order to remove or reduce the effect of boundary conditions on modal parameters, invariable boundary conditions are necessary. In this experimental study, four concrete support abutments were poured, and bolts (
Accelerated carbonation
There are several deterioration processes that affect RC structures at an early stage leading to loss of performance. The most common reason for deterioration is corrosion of the steel reinforcement. In most cases, the concrete cover should protect the steel reinforcement from corrosion because it provides an alkaline environment. If the pH value of concrete decreases below 9, the steel reinforcement embedded in concrete should be corroded easily. Generally, the acidic substances of concern are atmospheric carbon dioxide (
Portland cement is mainly composed of the following four minerals: tricalcium silicate (
For the purpose of measuring the carbonation depth, two groups, each with six concrete-carbonation test specimens (C30-1–C30-6, C40-1–C40-6) were poured. These two groups of concrete-carbonation test specimens were subjected to the same curing conditions (curing time, curing temperature, and curing RH) as the RC test beams at the same time. Five lateral surfaces of all concrete-carbonation test specimens in the carbonation test were sealed by paraffin wax, leaving open the top surface, guaranteeing that
In this experiment, 12 partially sealed carbonation test specimens (C30-1–C30-6 and C40-1–C40-6) and 10 simply supported RC test beams (C30N01–C30N05 and C40N01–C40N05) were subjected accelerated carbonation in the carbonation chamber with the following experimental conditions:
Modal test
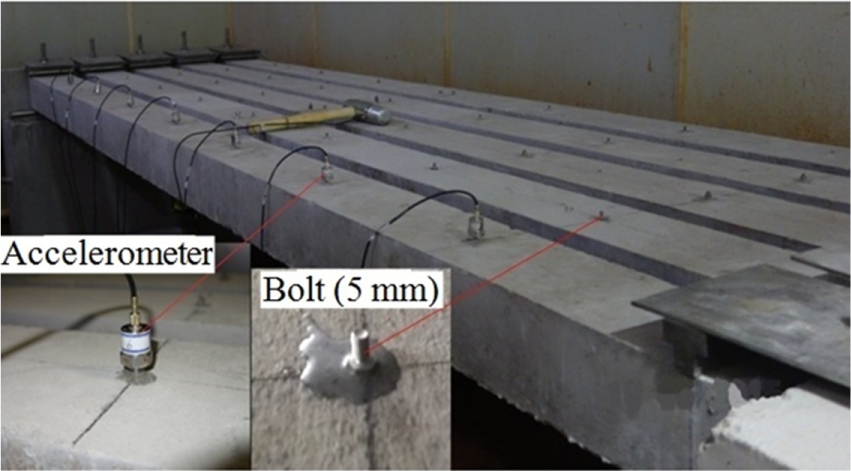
A total of 10 RC test beams (C30N01–C30N05 and C40N01–C40N05) were subjected to the modal test at the end of each accelerated carbonation stage. The boundary conditions are unchanged in the whole experimental process. The experimental stages were accelerated carbonation after 0, 7, 14, 21, and 28 days. Figure 3 illustrates seven vertical accelerometers mounted on the top surface of each RC test beam.
Sensor locations for modal test.
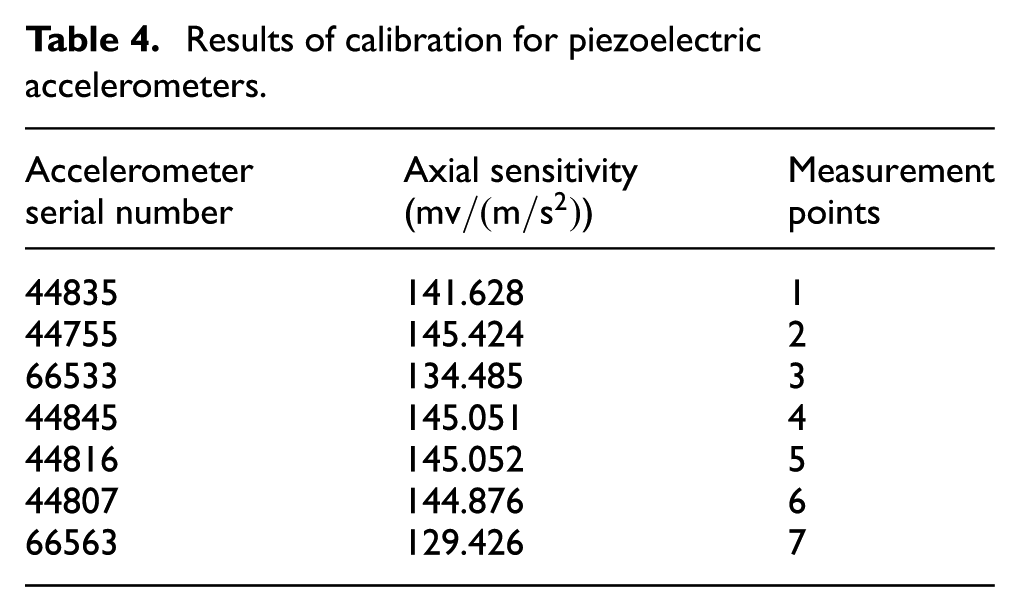
Piezoelectric accelerometers were selected for vertical measurements because of their high performance and shockproof qualities. The initial axial sensitivity of each piezoelectric accelerometer is
Results of calibration for piezoelectric accelerometers.
As shown in Figure 3, to ensure stability, each accelerometer was fixed with a bolt (
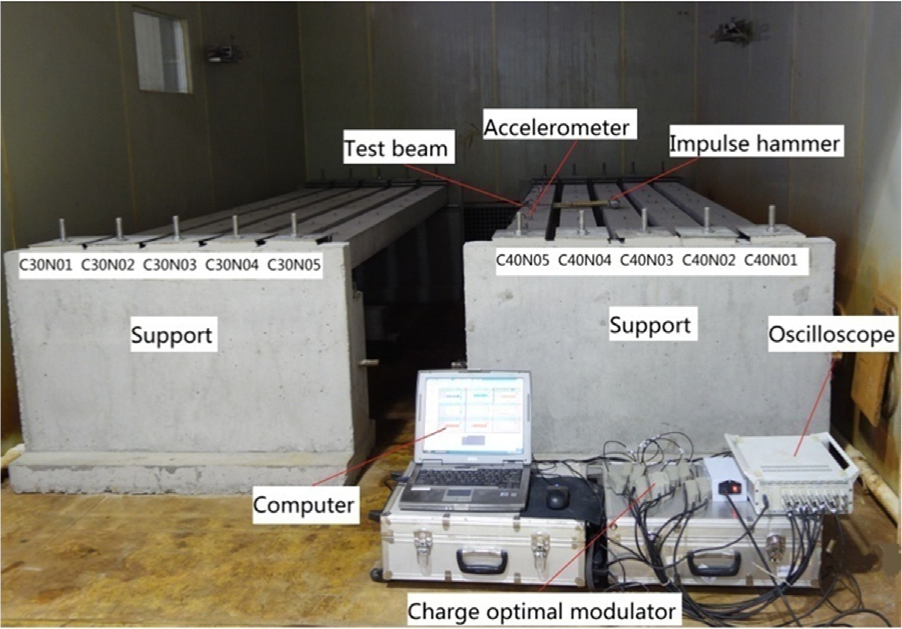
Figure 4 is a photograph of the modal test configuration in the carbonation chamber. The five RC test beams (C30N01–C30N05) at the left-hand side were poured using concrete of strength grade 30. The five RC test beams (C40N01–C40N05) at the right-hand side were poured using concrete of strength grade 40. The instruments we used include a computer, 16-channel oscilloscope, charge optimal modulator, piezoelectric accelerometer, impulse hammer, and signal cables. The piezoelectric accelerometers were connected to the 16-channel oscilloscope to capture acceleration signals in real time. The output from the piezoelectric accelerometers and the load input were amplified and filtered using a charge optimal modulator. The impulse hammer was used to excite the RC test beam. The inputs to the RC test beams were tested with an accelerometer installed on the head of the hammer. The impacts imposed by the impulse hammer were controlled to have a peak force between 100 and 1000 N. Measurement point 5, which can be seen in Figure 1 and which is located 3/8 of the way along the length of the RC test beam, was selected as the excitation location because this excitation location can excite first four modal parameters for a simply supported beam. Theoretical analysis demonstrated that the fourth-order frequency of the RC test beam is 326.647 Hz. Based on the sampling theorem, the sample frequency was selected as 1000 Hz. The measurements were made using a block size of 250,000 lines, thus giving a resolution of 0.002 Hz per spectrum line. With modal analysis software, the dynamic load test response was obtained using an FFT to extract natural frequencies.
Modal test for RC test beams.
Results and discussions
Carbonation test results
Figure 5 shows a phenolphthalein pH-indicator sprayed over the surfaces split from the concrete-carbonation test specimen (C30-2) after the specimen had been exposed to a CO2-rich atmosphere in the carbonation chamber for 21 days. The carbonated area, which is colorless, and the noncarbonated area, which is red, can be clearly seen.
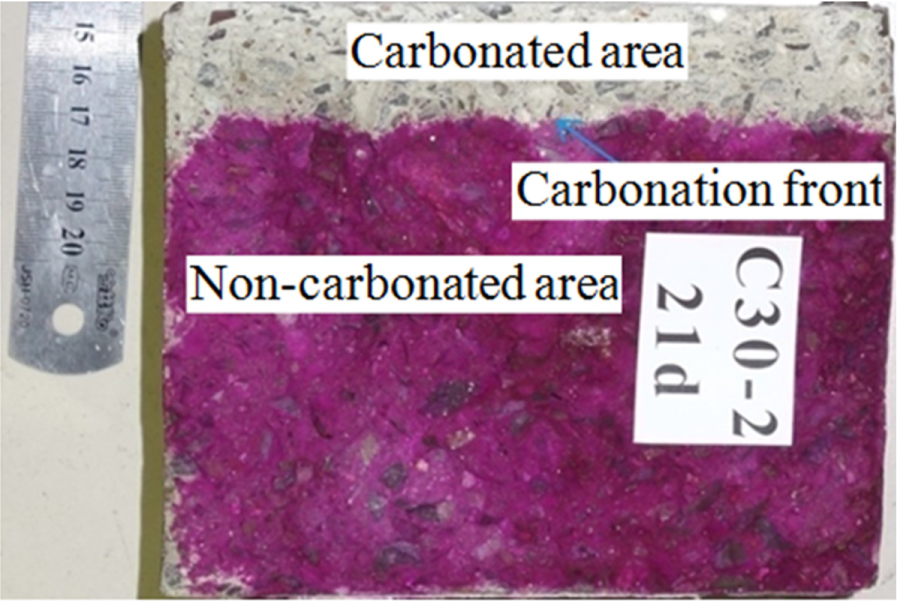
Split surface sprayed with phenolphthalein.
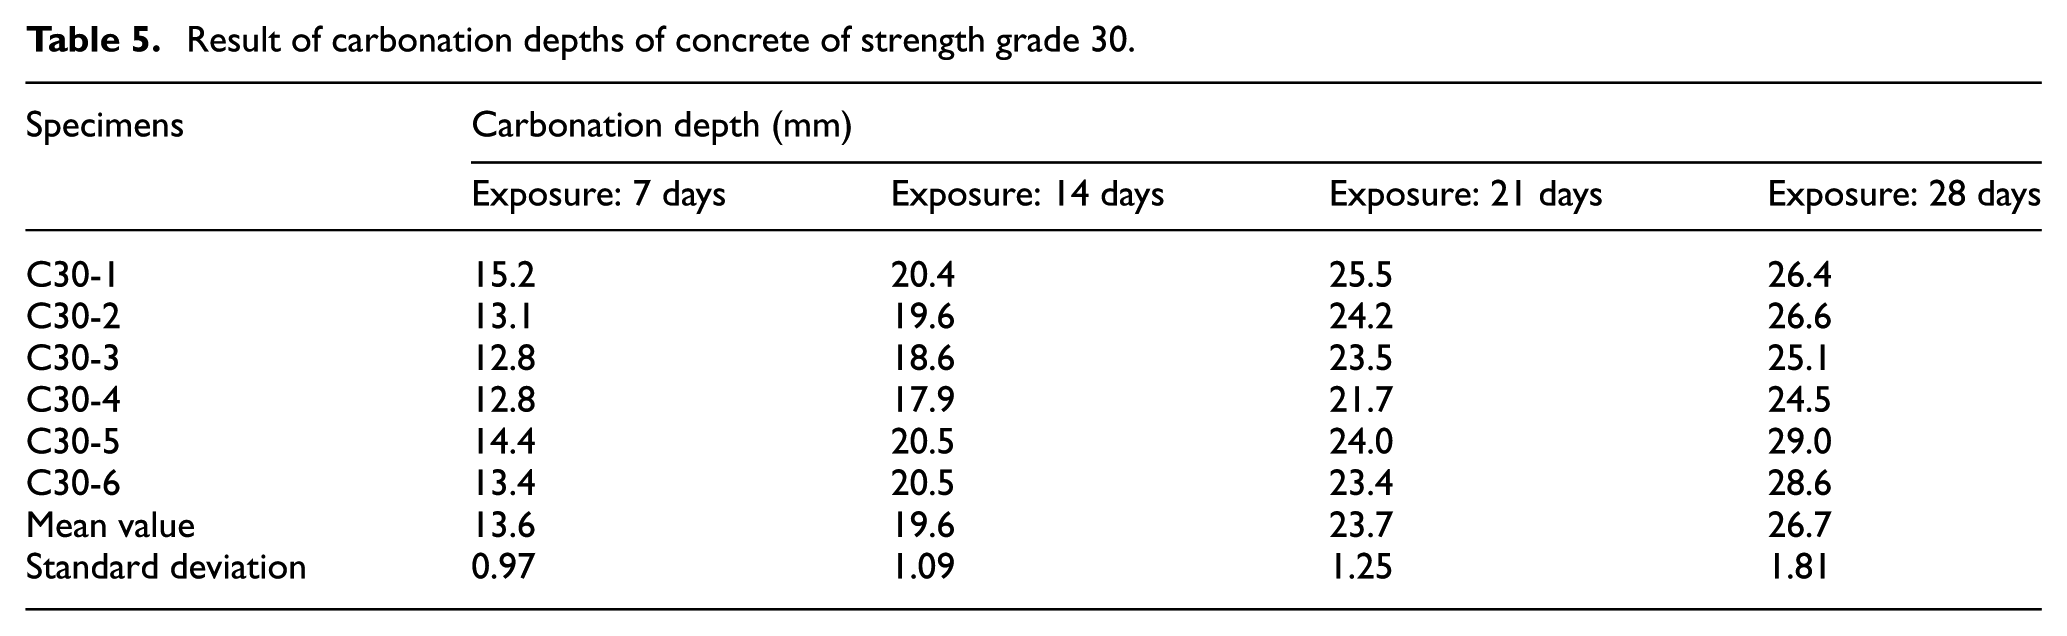
According to the measurement data from 12 concrete-carbonation test specimens (C30-1–C30-6 and C40-1–C40-6), the mean values of concrete-carbonation depths were determined and are shown in Tables 5 and 6. The standard deviation is used to quantify the amount of variation in the data.
Result of carbonation depths of concrete of strength grade 30.
Result of carbonation depths of concrete of strength grade 40.
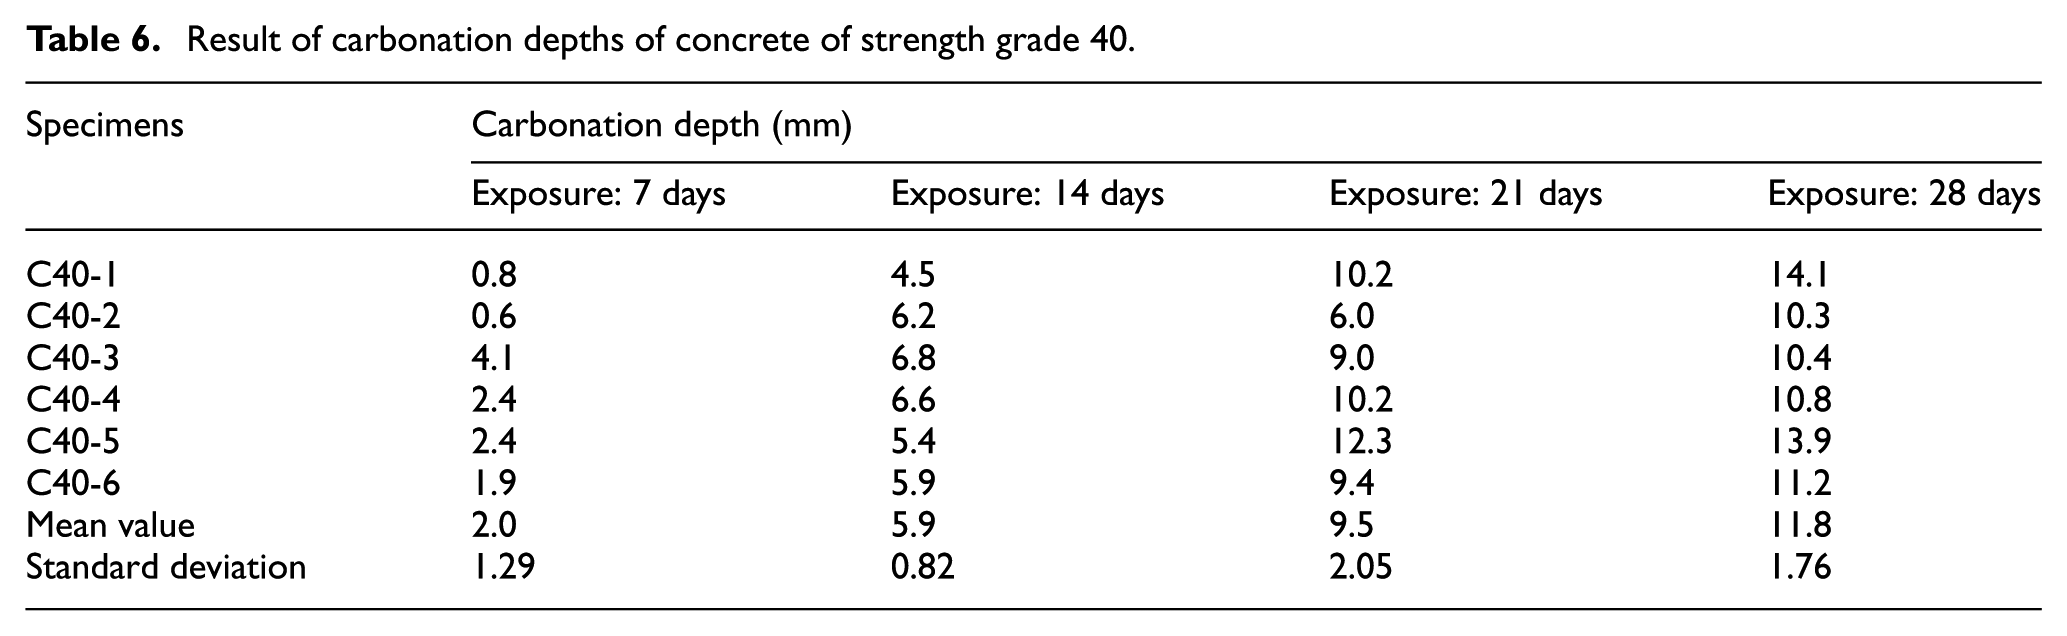
From the experimental results of concrete-carbonation depths, we can see that the degree of concrete carbonation is different between the concrete of strength grade 30 and the concrete of strength grade 40. In the same exposure environment, the carbonation depth of the concrete of strength grade 30 is more severe. Some of the factors that affect the degree of concrete carbonation include cement species and dosage, water–cement ratio (W/C), pore structure, and curing condition (Jiang et al., 2015). Because the concrete-carbonation test specimens and the RC test beams are exposed to the same environment, we take the carbonation depths in RC test beams to be the same.
Modal test results
When a structure is subjected to a certain degree of deterioration, the stiffness or mass is changed. The dynamic parameters, such as natural frequencies, mode shapes, and modal damping, will be changed consequently (Fertis, 1973). In this experimental study, it is apparent that the changes in natural frequencies at different accelerate carbonation stages are different. These stages are accelerated carbonation after 7, 14, 21, and 28 days. The main cause of this phenomenon is the difference in the carbonation depth at each stage. After the modal test at each stage, a total of 350 FFTs (7 measurement points, impulse excitation five times on every beam, and a total of 10 RC test beams) were computed. Figure 1 shows the locations of the measurement points on the RC test beam. There are seven vertical accelerometers mounted on the top surface of every beam. The distance between these vertical accelerometers is the same, which means the RC test beam is divided into eight equal parts by the seven vertical accelerometers. According to the dynamic response analysis of a simply supported beam, in the measurement of the second-order modal frequency, the measurement data coming from the accelerometer located at measurement point 4 should be removed because measurement point 4 is located at the mid-span of the test beam. Similarly, in the measurement of the fourth-order modal frequency, the measurement data coming from accelerometers located at measurement points 2, 4, and 6 should be removed. Therefore, the typical time history of acceleration and the power spectral density (PSD) at every measurement point are obtained. Figure 6 shows the time history of acceleration and PSD of C30N01 RC test beam at the end of stage 3, which is accelerated carbonation for 21 days. C30N01 is the serial number of RC test beam; T04A denotes the modal test at the end of stage 3; S5 denotes these test data obtained from accelerometer located at measurement point 5; and P1, P2, P3, P4, and P5 denote the times of impulse excitation. For example, C30N01T04A-S5-P1 means the serial number of the RC test beam is C30N01, testing was at the end of stage 3, the test data come from accelerometer located at measurement point 5, and it was the first of the five impulse excitations. In this study, the modal test was performed at the end of each of the five different stages. Therefore, the changes in natural frequencies should be obtained in this experimental process. Previous research (Ding and Li, 2011; Zhou et al., 2015) has shown that ambient temperature and RH are principal factors affecting structural modal parameters in the long term. In order to reduce the effect of temperature and RH on the modal tests, the tests should be completed as soon as possible after opening the carbonation chamber door (<3 h). Using a hammer-impacting method and the modal analysis program, the natural frequencies are extracted. Figures 7 and 8 show the typical relations between natural frequencies and carbonation depths at the end of each stage for concrete of strength grade 30 (C30N01 RC test beam) and strength grade 40 (C40N01 RC test beam), respectively. Because the carbonation depths of the concrete of strength grade 40 are small at the end of stages 1 and 2, the effect of concrete carbonation on natural frequencies is limited. The modal test results at the end of stages 0, 3, and 4 are shown in Figure 8. The modal test data at the end of stages 1 and 2 are not included because the changes from stage 0 are small.
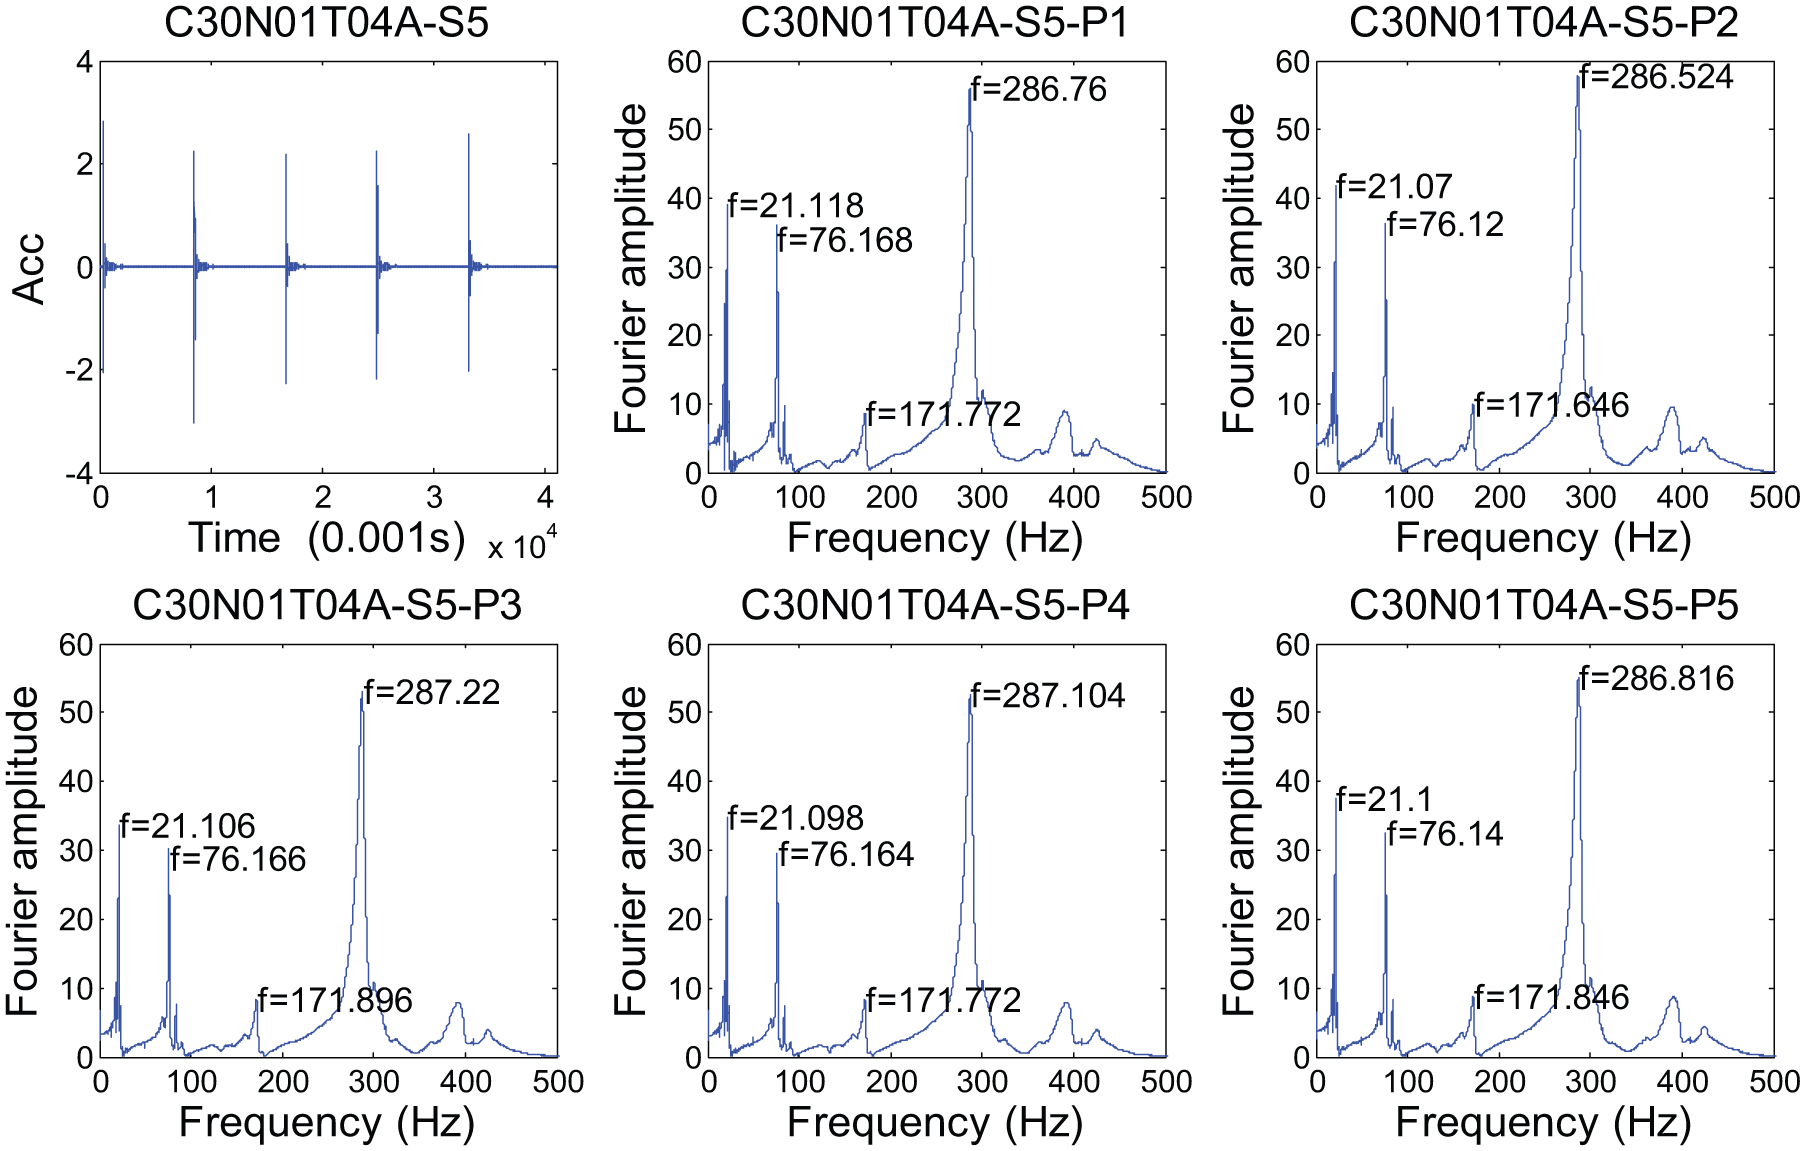
Typical time history of acceleration and PSD plots.
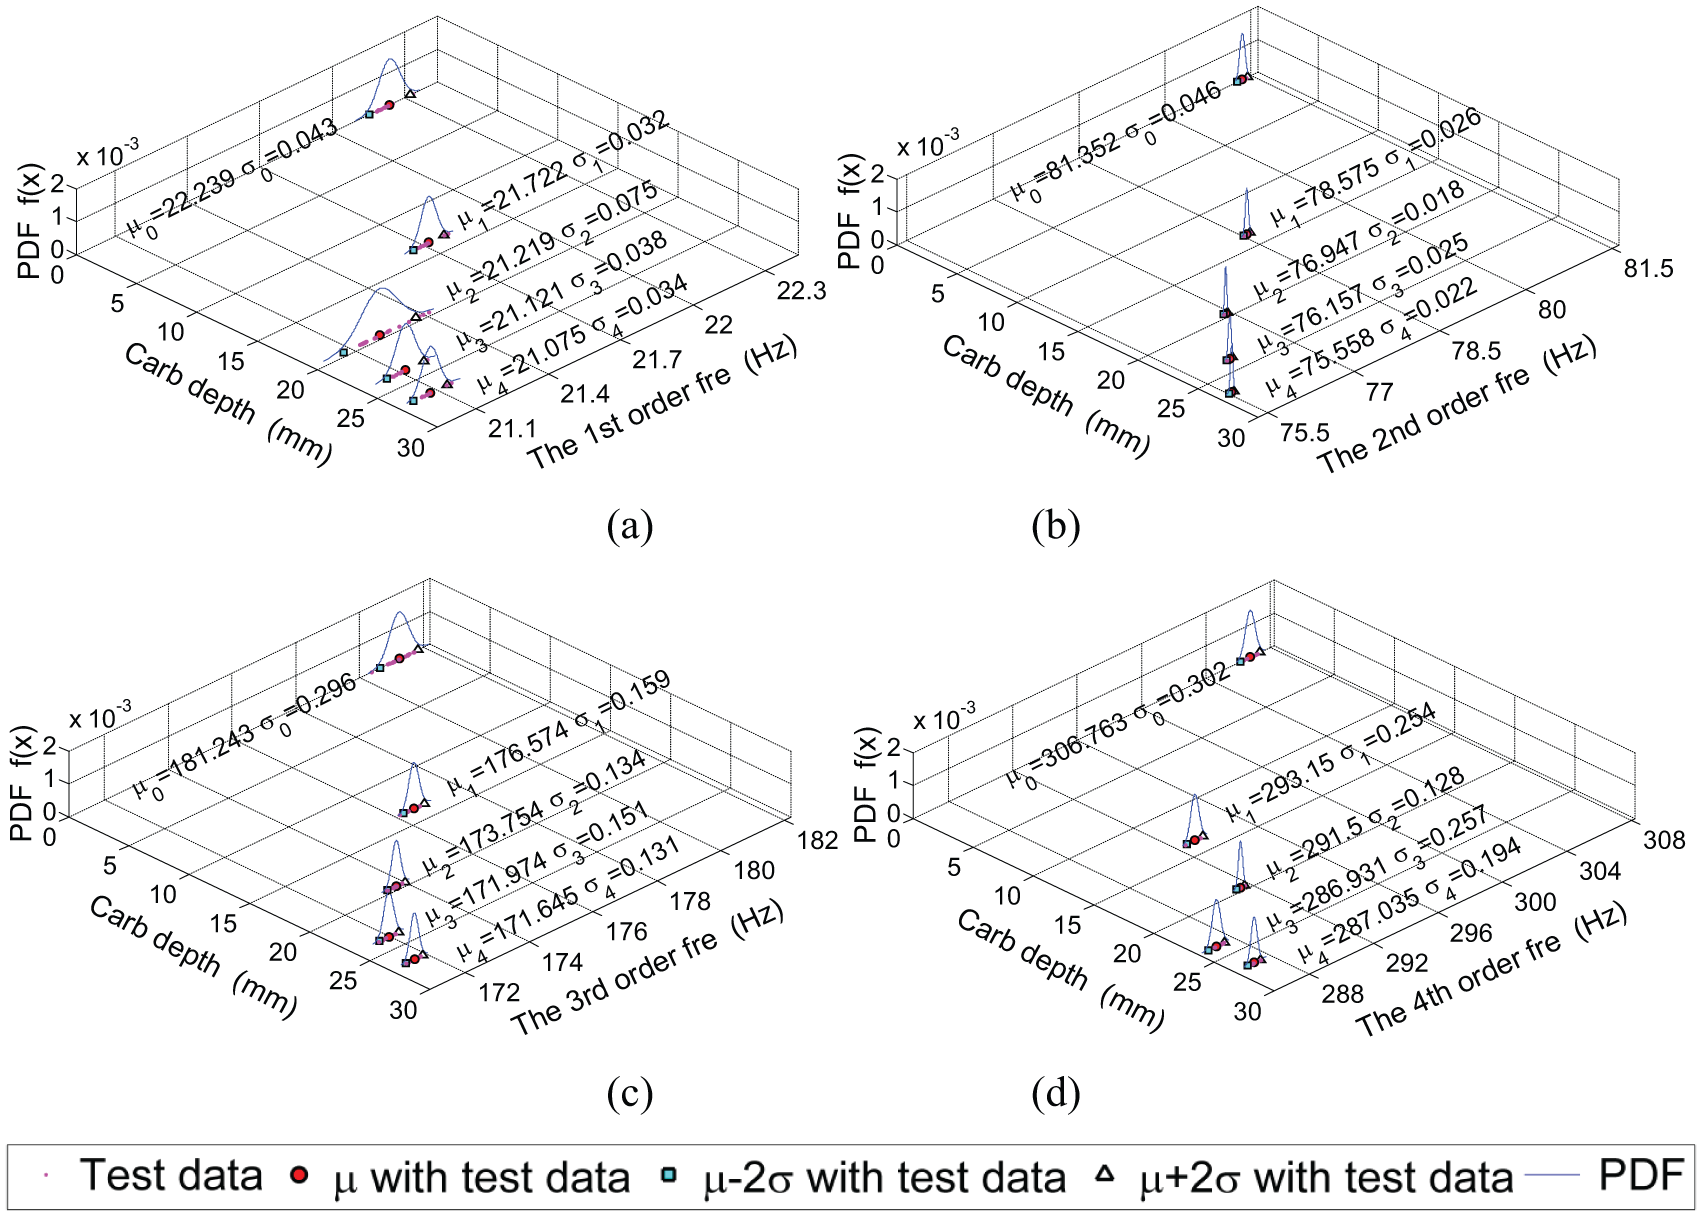
Typical results of relations between natural frequencies and carbonation depths (C30N01)
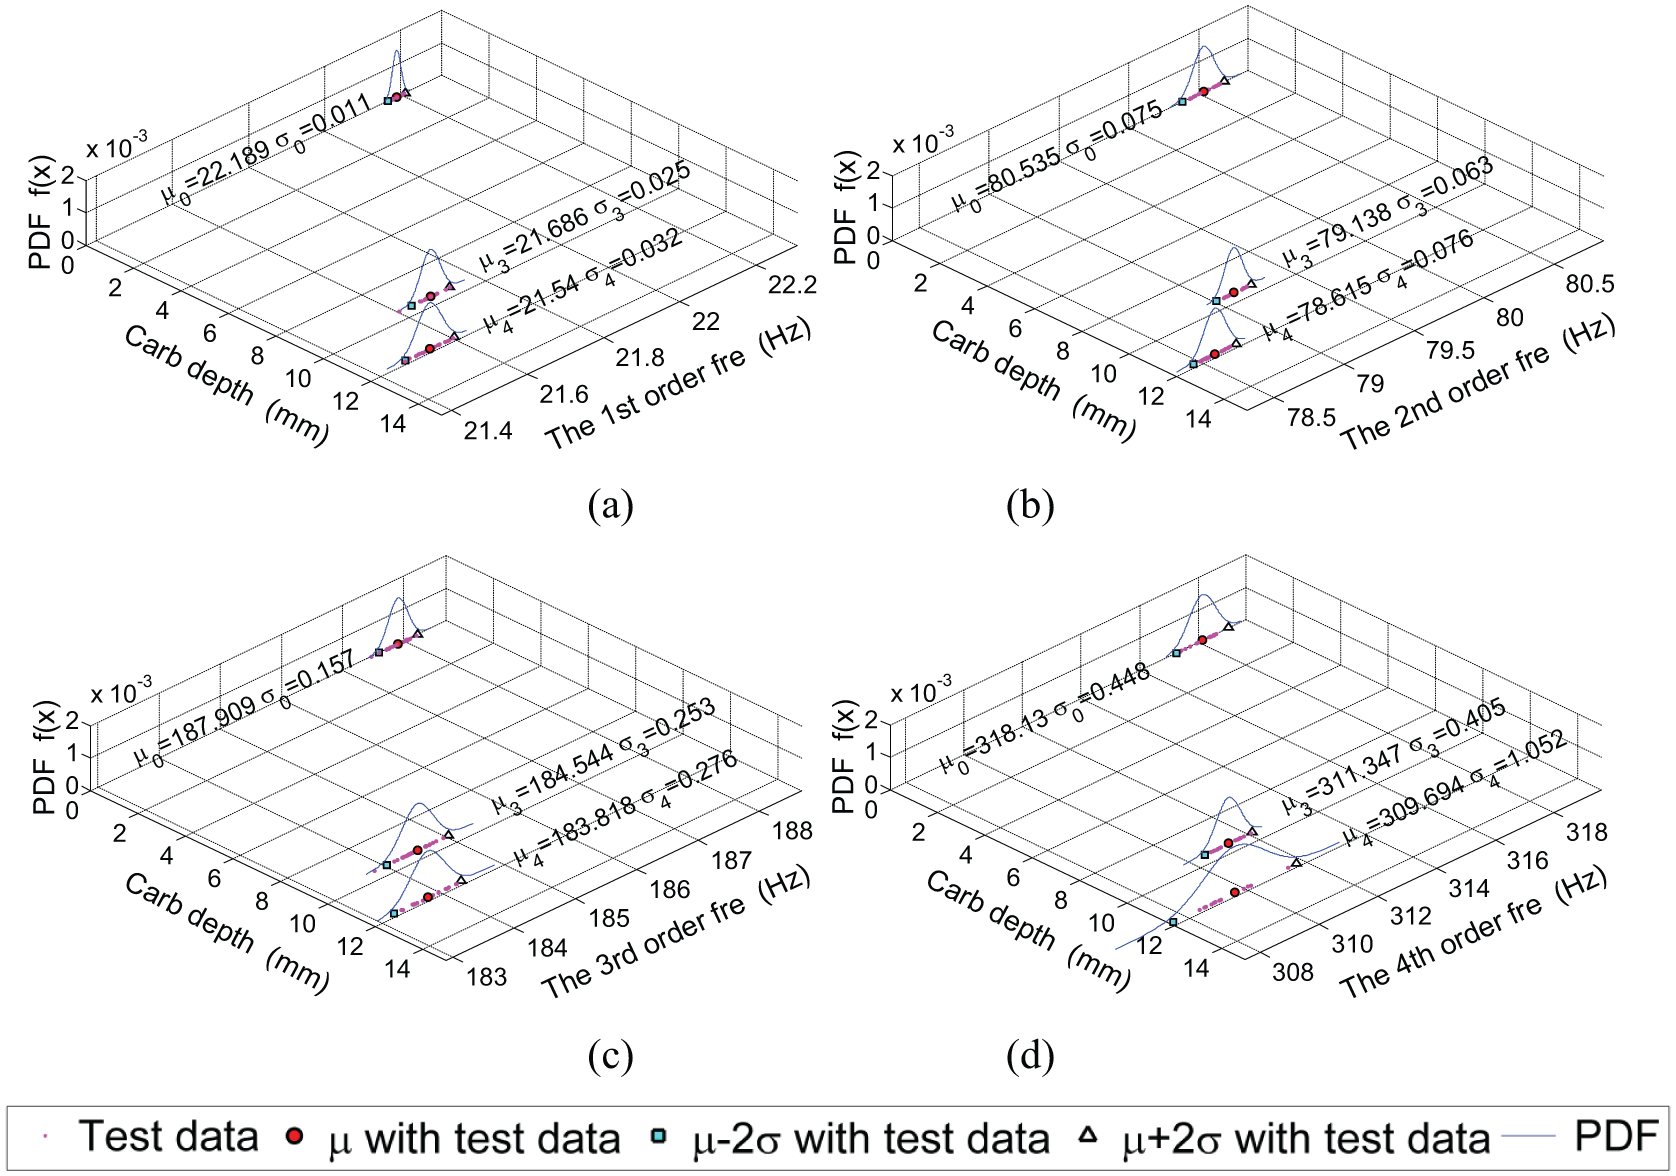
Typical results of relations between natural frequencies and carbonation depths (C40N01) μ0, μ3 and μ4 denote mean value of frequency at the end of stage 0, stage 3 and stage 4, respectively; σ0, σ3 and σ4 denote standard deviation of frequency at the end of stage 0, stage 3 and stage 4, respectively; PDF denotes probability density function.
From Figures 7 and 8, we see a tendency of natural frequencies of the RC test beams to decrease with the increase in carbonation depth. Figure 7(a) shows that the mean value of the first-order frequency decreases from 22.239 to 21.075 Hz, a drop of 5.23%, when the carbonation depth increases from 0 to 26.7 mm. In the same manner, Figure 7(b) to (d) shows that the mean values of the second-order, third-order, and fourth-order frequencies decrease from 81.352 to 75.558 Hz, from 181.243 to 171.645 Hz, and from 306.763 to 287.035 Hz, reductions of 7.12%, 5.30%, and 6.43%, respectively, when the carbonation depth increases from 0 to 26.7 mm. Figure 8(a) shows that the mean value of the first-order frequency decreases from 22.189 to 21.540 Hz, a drop of 2.92%, when the carbonation depth increases from 0 to 11.8 mm. In the same manner, Figure 8(b) to (d) shows that the mean values of the second-order, third-order, and fourth-order frequencies decrease from 80.535 to 78.615 Hz, from 187.909 to 183.818 Hz, and from 318.130 to 309.694 Hz, reductions of 2.38%, 2.18%, and 2.65%, respectively, when the carbonation depth increases from 0 to 11.8 mm. Statistical analysis shows that at stage 4, which is accelerated carbonation for 28 days, the reductions in first four natural frequencies of the RC test beams poured with concrete of strength grade 30 are in the ranges 3.99%–6.67%, 7.12%–8.34%, 4.48%–7.95%, and 5.17%–8.69%, respectively. In the same way, the reductions in the first four natural frequencies of the RC test beams poured with concrete of strength grade 40 are in the ranges of 2.46%–2.98%, 2.38%–3.35%, 0.87%–2.49%, and 0.91%–2.65%, respectively. These experimental test results obviously show the tendency of the natural frequencies to decrease with the increase in the degree of concrete carbonation.
Because of the many factors influencing the experimental process, there are two groups of data that are inconsistent with the tendency of the frequencies to decrease with increased carbonation. The first dataset is the fourth modal test from stage 3 to stage 4 for test beam C30N01. The second is the third modal test from stage 3 to stage 4 for test beam C40N02. The reason that these two datasets do not agree with the general trend is that the change in carbonation depths is so small that the modal test is not sensitive to any difference. Table 5 shows that the carbonation depths in the concrete of strength grade 30 at the end of stage 3 (exposure: 21 days) and at the end of stage 4 (exposure: 28 days) are 23.7 and 26.7 mm, respectively. The change in carbonation depths in the concrete of strength grade 30 is only 3.0 mm. Table 6 shows that the carbonation depths in the concrete of strength grade 40 at the end of stage 3 (exposure: 21 days) and at the end of stage 4 (exposure: 28 days) are 9.5 and 11.8 mm, respectively. The change in carbonation depths in the concrete of strength grade 40 is only 2.3 mm.
The two datasets described account for only 2.5% of the total modal test data. The tendency of natural frequencies to decrease with increasing carbonation depths is a real effect.
It is important to note that there are some errors in the survey of natural frequencies due to the influences of environmental noise and other factors. The data exhibit quite a significant variation of natural frequencies for a particular level of carbonation depth. In order to illustrate that the frequency change in this experiment is caused by the difference in carbonation depths, we use statistical methods to compare the variation of identified frequency with the statistical significance of the frequency change due to the difference in carbonation depths.
In statistics, the standard deviation (
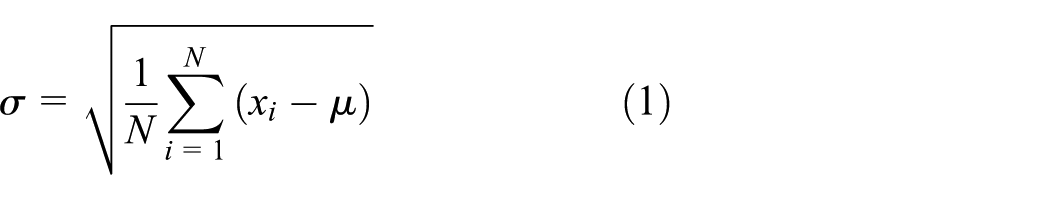
where
In this experiment, there are 35 measurements for every RC test beam at each stage because there are seven measurement points and five impulse excitations. Thus, we select the mean value of measured frequencies as the relevant frequency. Figure 7 shows the probability density function (PDF) and standard deviation (
The PDF was used to assess statistical properties for the test data. Stochastic analysis results of measured natural frequencies for test beam C30N01 at each test stage are shown in Figure 7. The statistical results of mean value
In order to obtain the quantitative relationship between concrete-carbonation depths and natural frequencies, statistical methods and curve fitting were used to analyze the experimental data. The data are categorized into two groups according to the strength grade of the concrete. Figure 9 shows the relationships between concrete-carbonation depths and first four modal frequencies from the five test beams C30N01–C30N05. Discrete points represented by different colors and markers denote the mean values of modal frequencies. From the experimental test results of concrete-carbonation depths, the carbonation depths at the end of stages 0, 1, 2, 3, and 4 are 0, 13.6, 19.6, 23.7, and 26.7 mm, respectively. Straight lines are fit to the data for the first four modal frequencies. The fitting equations are shown in Figure 9. In the same way, Figure 10 shows the relationship between concrete-carbonation depths and the first four modal frequencies from the five test beams C40N01–C40N05. The carbonation depths at the end of stages 0, 3, and 4 are 0, 9.5, and 11.8 mm, respectively. The fitting equations for the first four modal frequencies are shown in Figure 10. The results of the experiment should provide a reference and innovative insight for SHM using modal frequencies.
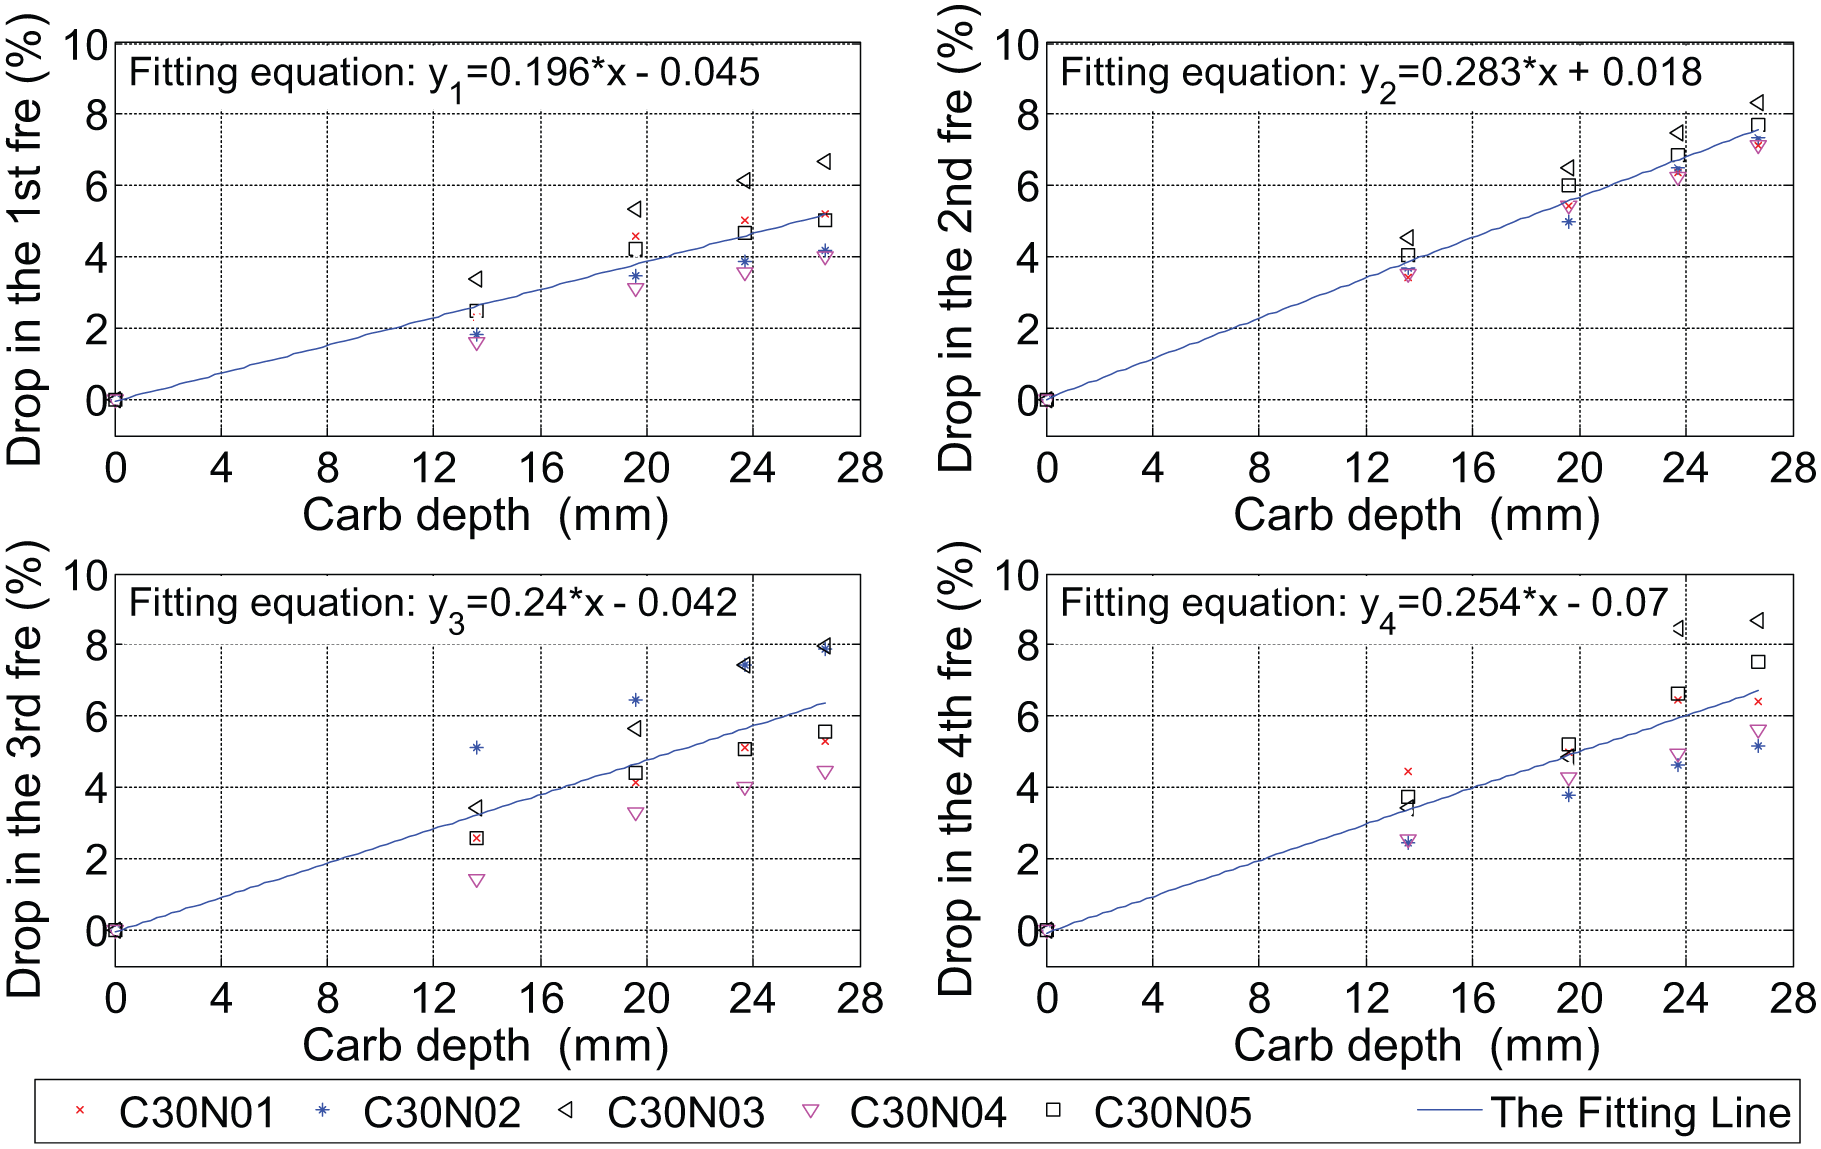
Fitting results for the drop in natural frequencies as a function of carbonation depth (concrete of strength grade 30).
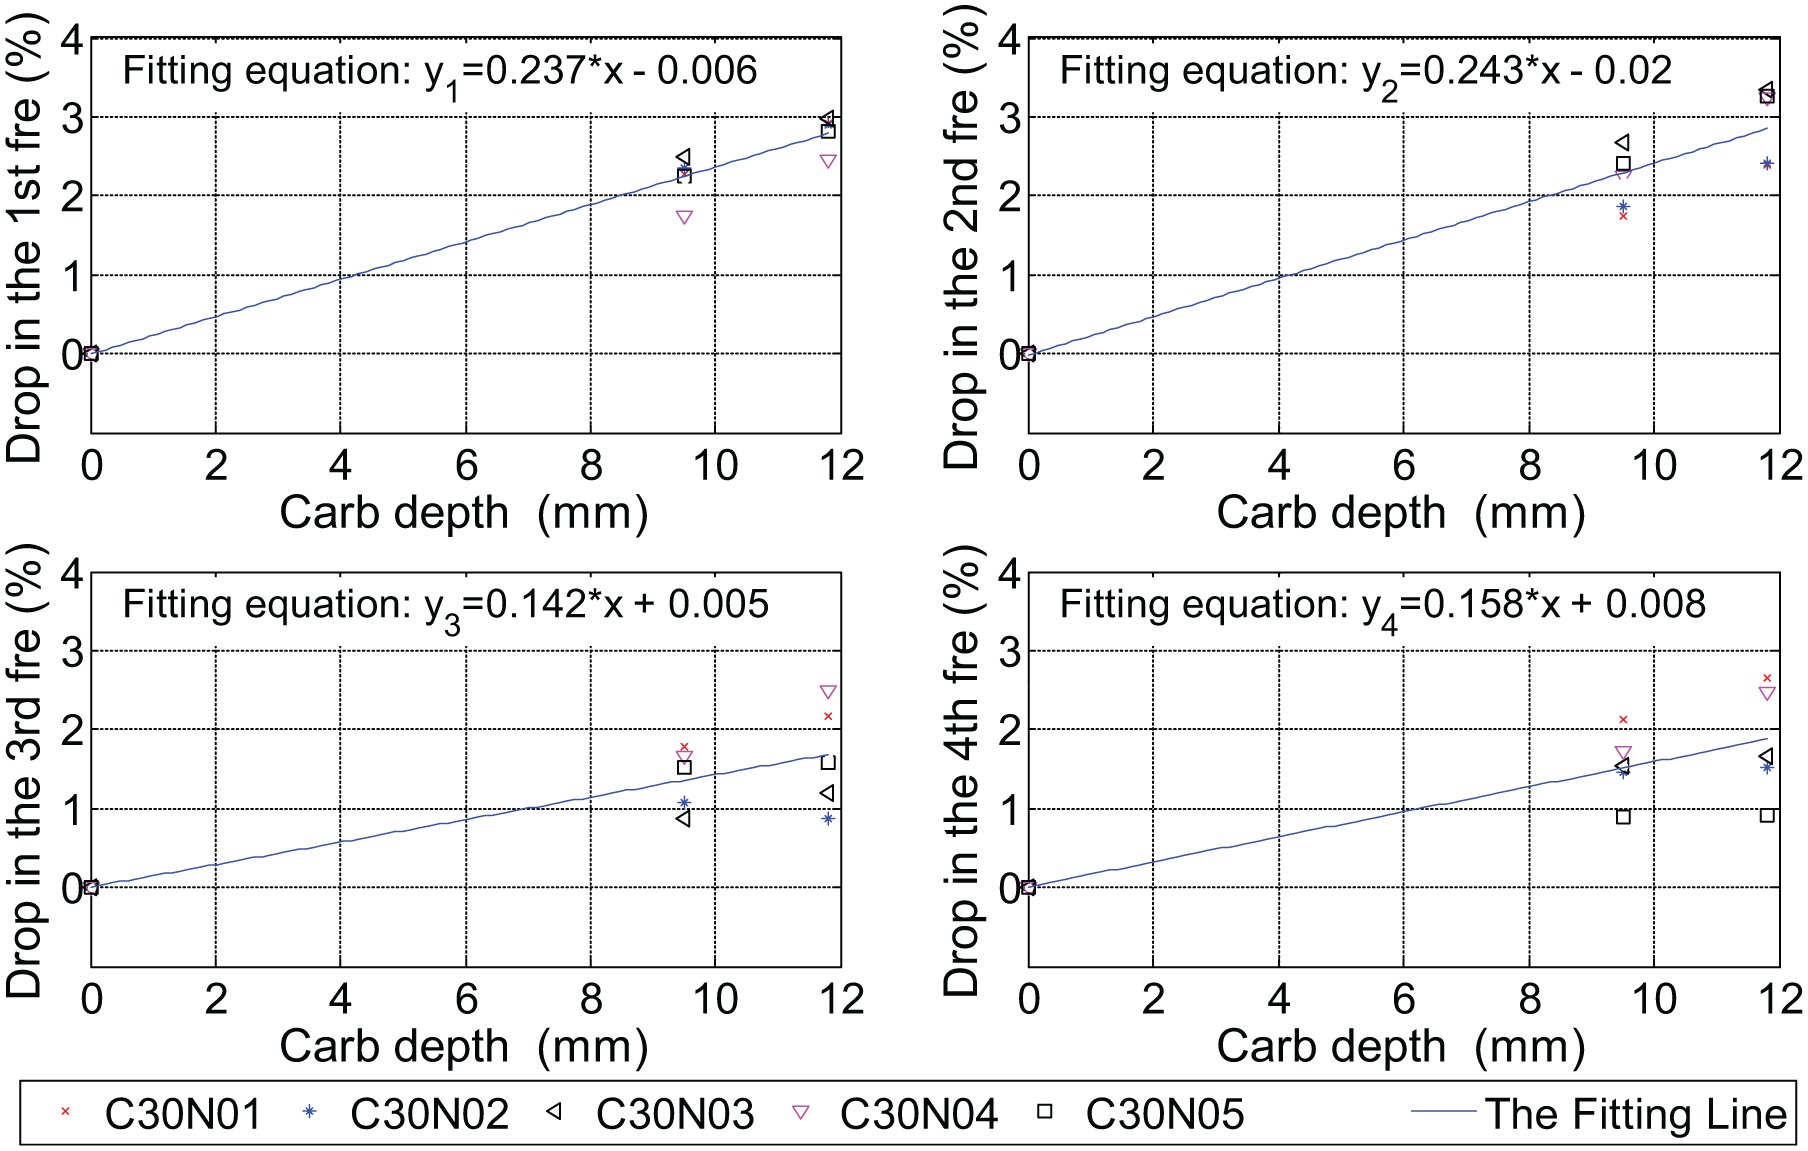
Fitting results for the drop in natural frequencies as a function of carbonation depth (concrete of strength grade 40).
Analysis of the main reason for drop in natural frequencies
Some reasons give rise to the above experimental results. The primary explanation of the experimental results is that the carbonation reaction increases the mass of RC test beam.
For a simply supported beam, the modal frequency is given by
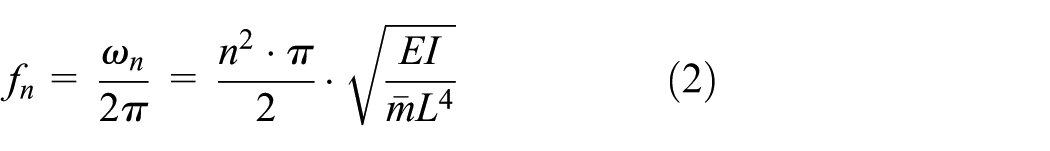
where
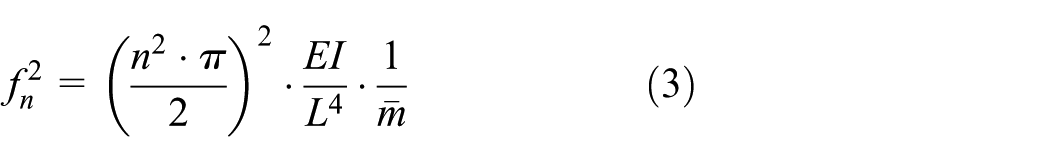
If the RC test beam is simply supported and the span length is unchanged in the whole experimental process, then
Differentiation of the above equation yields
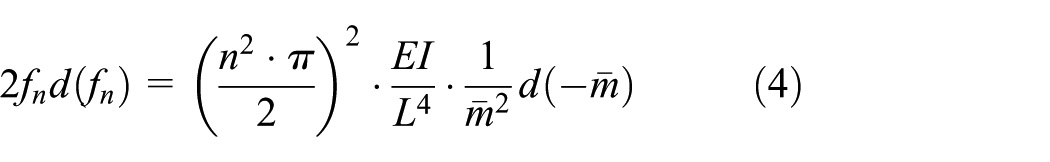
According to equation (3)
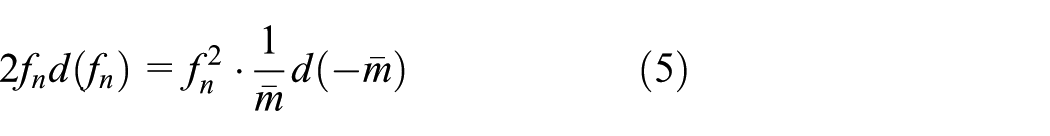
That is
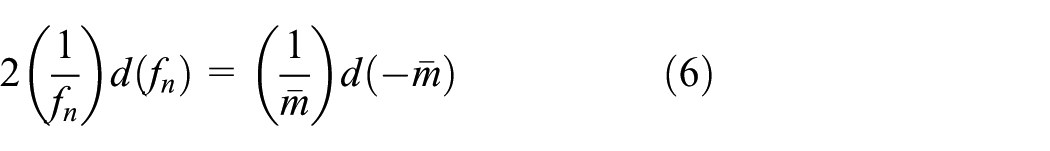
From equation (6), it is apparent that the fractional change in natural frequency of the beam is proportional to the fractional change in mass per unit length. Because of the minus sign, an increase in mass per unit length gives rise to a reduction in the natural frequencies. According to equation (6), a 2% change in mass per unit length would result in a 1% change in natural frequency. It is worth noting that the above analysis assumed ideal conditions. Namely, material and geometric properties, including mass, stiffness, damping, changes to the boundary conditions, and environmental conditions, are consistent with the assumed conditions of the theoretical analysis. In fact, there must be difference between theoretical analysis and engineering practice. The theoretical analysis should illustrate the phenomena in this article, but it is not the complete explanation.
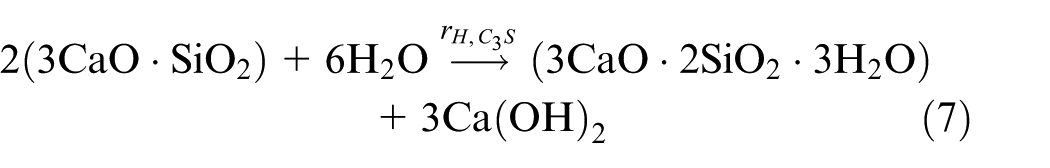
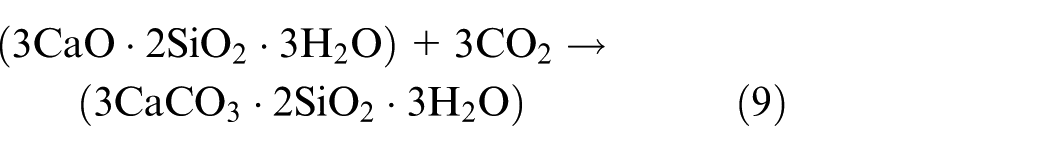
The mass of concrete will increase after carbonation because the carbonatable substances react with gaseous
Concrete carbonation is a complex physicochemical process in which

where
The carbonation of

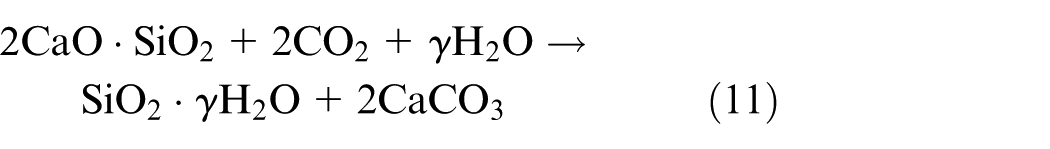
According to a study by Papadakis et al. (1991), the mathematical model of the carbonation process is based on the differential mass balances of gaseous
The dissolved
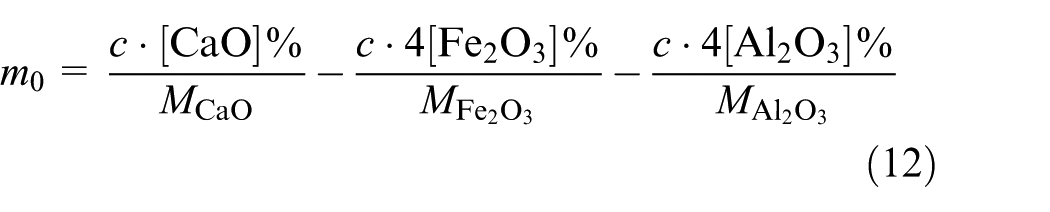
where
Equation (12) yields
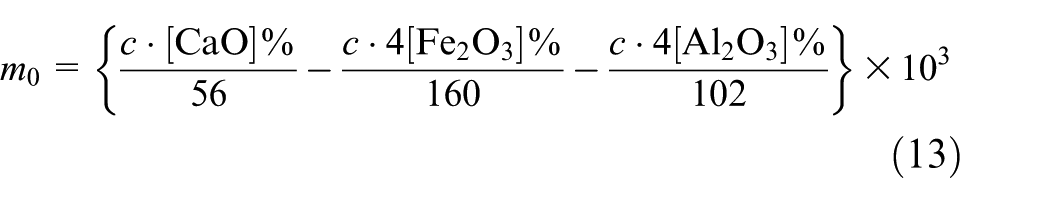
The dissolved
Oxides percentage composition of common Portland cement.
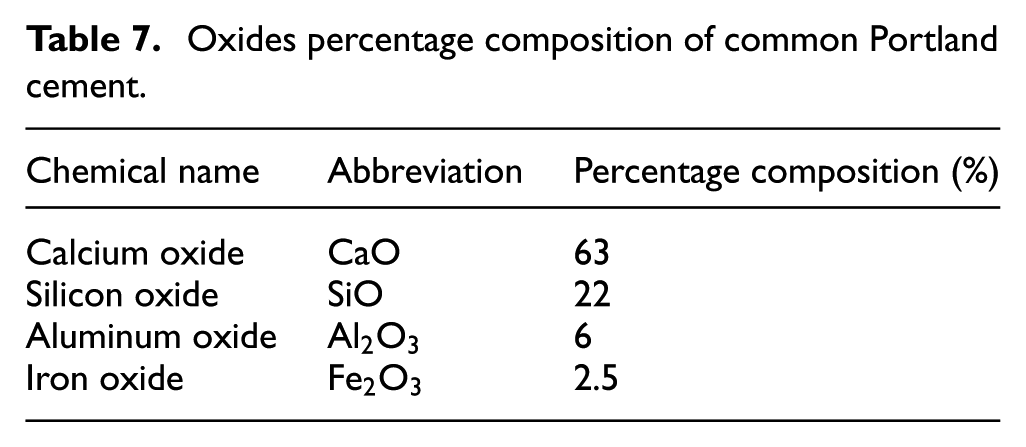
Therefore, equation (13) can be written as follows
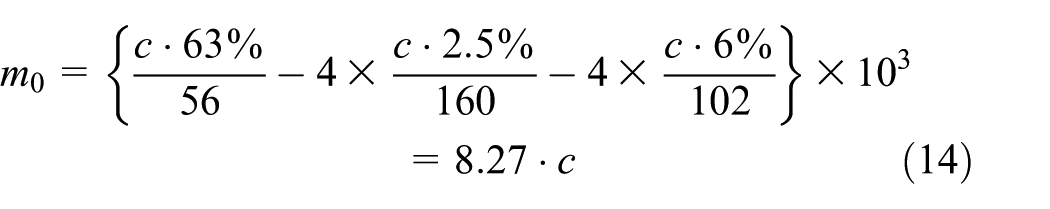
In this experimental study, the cement content of concrete of strength grade 30 is
Comparison of theoretical analysis and experiment results
In this experiment (see Figure 1), each RC test beam has a length of 3.2 m, a width of 0.15 m, and a height of 0.12 m. According to the test results of carbonation depths, the carbonation depth of the concrete of strength grade 30 is 26.7 mm at the end of stage 4. Table 8 shows that the percentage of concrete carbonated is
Theoretical analysis results of drop in natural frequencies.
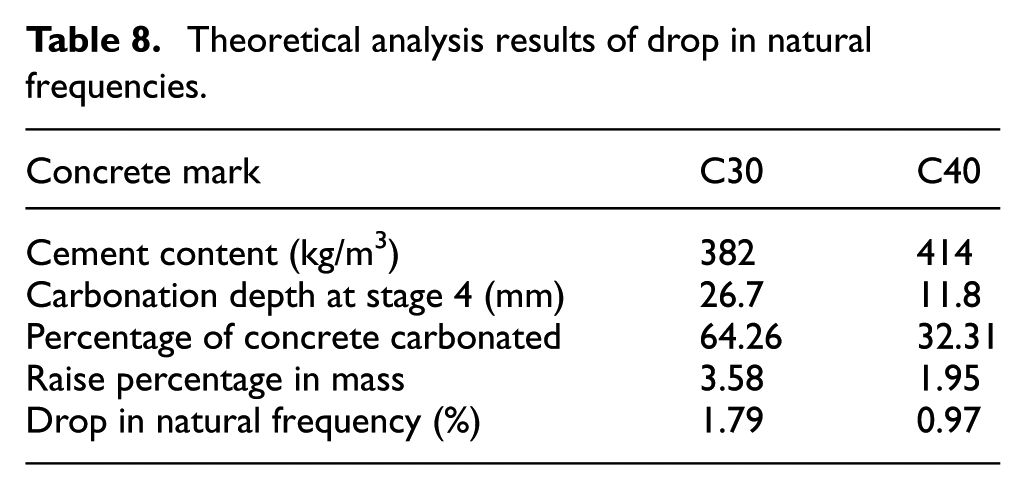
The drops in natural frequencies observed in the experiments are more than those predicted by theoretical analysis. Many factors give rise to the above results. First, the theoretical analysis depends on the percentage composition of chemical materials. The standard percentage composition of chemical materials differs from the composition of the experimental specimens. Second, the theoretical analysis is based on an ideal simply supported beam, and there are some differences between experimental boundary conditions and simply supported conditions. Third, the theoretical analysis considers only the completely carbonated volume. There must be a partially carbonated volume that gives rise to an increase in mass per unit length in the experiment that is higher than in the theoretical analysis. Therefore, we can understand that the drop in natural frequencies in the experiment is higher than in the theoretical analysis. Last but not least, the theoretical analysis considers only the increase in mass per unit length. In fact, many factors, such as stiffness, boundary conditions, temperature, and RH, slightly affect the natural frequencies in the experiment. To sum up, the experimental test and theoretical analysis demonstrate a tendency of the natural frequencies of the concrete test beams to drop as the carbonation depth increases.
In order to verify the accuracy of the mass increase estimated from physicochemical reactions, eight concrete block specimens of size
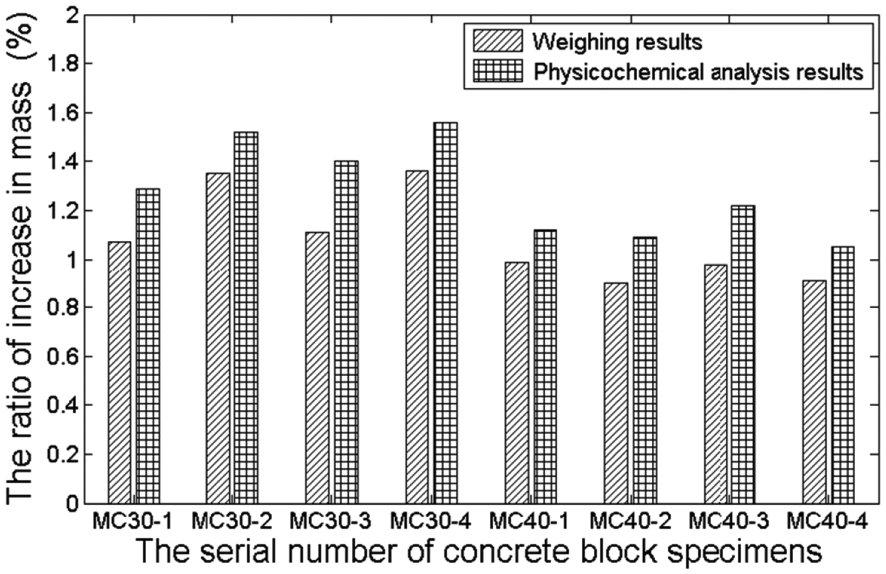
Comparison of increase in mass determined from weight with that from physicochemical analysis.
Conclusion
The experimental results presented show that concrete carbonation in RC test beams causes significant changes in natural frequencies. These results can apply SHM more effectively for RC structures based on natural frequencies. The following conclusions are drawn:
A tendency of natural frequencies of RC test beams to decrease with increasing carbonation depths is observed. At each successive stage in the accelerated carbonation process, there is a higher change in natural frequencies for every RC test beam. The natural frequencies decrease as the carbonation depths increase. The fitting lines provide quantitative relationships between carbonation depths and natural frequencies.
The main reason for the reduction in natural frequencies is the increase in concrete mass due to concrete carbonation. Based on an analysis of the physicochemical process of concrete carbonation, we obtain the percentage increase in mass after complete carbonation. For concrete of strength grade 30 and strength grade 40 at stage 4, the increases are 3.58% and 1.95%, respectively. The comparison of experimental weighing results with physicochemical analysis results demonstrates that experimental weight increases compare well with predicted weight increases based on physicochemical analysis.Therefore, the physicochemical analysis method is reliable when test conditions do not allow for weighing specimens.
Footnotes
Appendix 1
Declaration of Conflicting Interests
The author(s) declared no potential conflicts of interest with respect to the research, authorship, and/or publication of this article.
Funding
The author(s) disclosed receipt of the following financial support for the research, authorship, and/or publication of this article: This work was supported by grants from Subject of Project of National Key Fundamental Research Development Program (973 Program; grant no. 2013CB036305), Ministry of Transport of the People’s Republic of China (grant no. 2015318J38230), and National Science and Technology Support Plan (grant no. 2012BAJ11B01).