
Abstract
To diagnose the state of stay cables, a vibration-based model-free damage diagnosis method of stay cables using the changes in natural frequencies is further proposed and validated. The structural frequency is rapidly and easily acquired; moreover, it is simple and reliable for damage diagnosis. The frequency would change after the stay cable is damaged, so the frequency change could be used as the damage index. However, the stay cables are very long in long-span cable-stayed bridges, and their frequencies are very small; the frequency change due to small damage of the stay cable would be submerged by the surrounding noise and error of parameter identification process. A temporary diagonal steel bar–based method is used to solve this issue. The steel bar is installed with one end on the stay cable close to the bottom anchor head and the other end on the bridge deck; thus, the stay cable is divided into a short part and a long part by the steel bar. The frequency of a stay cable with a given tension force increases with the decrease in its length; according to the qualitative analysis, the frequency of the short part increases dramatically, and the local frequency change of the short part due to the same damage in the whole stay cable is amplified dramatically; thus, the small damage of a stay cable can be diagnosed easily. Numerical simulations of a stay cable selected from a cable-stayed bridge and a laboratorial stay cable are used to validate the method and also give a recommended rule for design of the temporary diagonal steel bar; experimental validation has also been conducted. All the results indicate that the proposed method works very well in damage diagnosis of stay cables. The proposed method is an output-only, model-free, fast and economical damage diagnosis method for stay cables.
Introduction
Structural health monitoring (SHM) has attracted considerable attention of researchers in the past decades (Doebling et al., 1996; Sohn et al., 2004; Ou and Li, 2010; An and Ou, 2013; An et al., 2014, 2015a, 2015b, 2016; Blachowski et al., 2015). SHM has become an important and challenging topic due to the rapid increase in the number of deteriorated structures (Jiang et al., 2011). It is necessary to monitor the structural integrity in order to improve the structural safety and reliability (Wang et al., 2011). Damage diagnosis is a process to monitor the structural dynamic properties which adversely affect the structural performance. Changes in the physical properties will cause changes in the modal properties (Machavaram and Shankar, 2012). Damage localization and quantification in large or complex civil structures is one of the most challenging topics (Yi et al., 2013).
Many studies about SHM and damage diagnosis have been published. Doebling et al. (1996) and Sohn et al. (2004) provided a review about damage diagnosis and SHM based on vibration characteristics, respectively. Ou and Li (2010) reported a review and the future trends of SHM in mainland China. Yi et al. (2010) presented an overview of the development activities including the monitoring technology and its accuracy assessment method in the field of bridge health monitoring using the global positioning system. Ding et al. (2008) proposed a procedure for wavelet packet transform (WPT)–based damage alarming method of frame structures, and the method has been validated based on the American Society of Civil Engineers (ASCE) benchmark experiments. Cao et al. (2013) proposed a fractal dimension method based on affine transformation for structural damage detection. Yi et al. (2013) investigated a multi-stage damage diagnosis method using the wavelet packet transform and the artificial neural network based on “energy-damage” theory, and the ASCE benchmark structure is employed to validate the proposed method. Cao et al. (2014) proposed a curvature mode shape–based method for identification of multiple damage in beams in noisy environment.
At the same time, many simulations and experiments on cable-stayed bridges related to SHM and damage detection have been conducted. Brownjohn and Xia (2000) investigated the application of sensitivity-based model updating technology to the dynamic assessment of a curved cable-stayed bridge; the simulated dynamic properties obtained via finite element analysis are improved based on the measured modal data. Ko et al. (2002) developed a multi-stage damage detection scheme for the cable-stayed Kap Shui Mun Bridge based on the measured modal data, but the damage can be detected only when a structural member is severely damaged due to the low modal sensitivities of the bridge to the local damage. Ni et al. (2008) studied the feasibility of using the measured dynamic characteristics of the bridge to formulate the relative flexibility change as an index for damage detection; the applicability of this index used in the cable-stayed bridge is examined by various damage scenarios including those at stay cables, longitudinal stabilizing cables, bearings and supports, longitudinal girders, and cross girders, in which the damage at stay cables is assumed by 20%, 50%, and 90% reduction in the cable tension force. Hua et al. (2009) presented a static-based damage detection method for cable-stayed bridges using the changes in cable forces; the method is validated by numerical studies of two damage scenarios in the bridge girders of the Sutong cable-stayed bridge. Ding et al. (2010) developed a multi-stage damage warning scheme using the measured dynamic responses and examined the approach on the Runyang cable-stayed bridge based on the monitoring data in 236 days. Talebinejad et al. (2011) investigated four damage detection algorithms, including the enhanced coordinate modal assurance criterion, damage index method, mode shape curvature method, and modal flexibility index method, for SHM of a cable-stayed bridge; with noise level of 2% and damage severity of 95% (i.e. a 95% stiffness reduction), in which two methods can detect the single damage simulated on the deck as well as single or multiple damage simulated in the cables; only one of the methods can predict the exact location of the damage with severity of 50% and 80%; their applicability for SHM of cable-stayed bridges is still required to be further investigated due to the low damage sensitivity. Huang et al. (2015) conducted both numerical and experimental studies of a newly proposed online system identification technique for global parametric identification of an experimental cable-stayed bridge model. All of these have made great progress; however, challenges still exist. For example, the sensitivity of damage detection methods to small damage in cable-stayed bridge is still required to be improved.
The research object of this article is stay cables of the cable-stayed bridge. Among the components of a cable-stayed bridge, damage most often occurs in the stay cables due to wire breakage, anchor head damage, corrosion, and so on. Therefore, damage diagnosis of stay cables is very important for a cable-stayed bridge. Irvine (1981), Irvine and Caughey (1974), and Irvine and Griffin (1976) provided a good foundation for the modern cable theories, and some most common-used formulas for tension force calculation are derived from these theories. Enlightened by a common-used formula for tension force calculation, this work will try to investigate a simple damage diagnosis method for stay cables based on their frequency changes. The structural damage results in the changes in modal characteristics (Ren and De Roeck, 2002), and the changes in modal characteristics provide a way to detect the damage. Xu and Wu (2007) pointed out that damage detection based on modal parameters such as natural frequencies is an important research area. Structure’s frequency is a sensitive parameter to detect structure, and it is easy to obtain (Salawu, 1997; Thyagarajan et al., 1998). Maity and Tripathy (2005) investigated the structural damage detection and assessment from changes in natural frequencies based on genetic algorithm. However, for most long-span cable-stayed bridges, the frequencies of stay cables are extremely small; thus, the frequency change resulting from a small damage is difficult to be identified with environment and measurement noise. To address this issue, the authors proposed a preliminary damage diagnosis idea for stay cables in early work (An et al., 2015b): a temporary diagonal steel bar is installed between a stay cable and the bridge deck; thus, the stay cable is divided into two parts by the temporary diagonal steel bar, that is, a long part and a short one (about 2–3 m in length), then the modal parameter identification methods such as the spectral analysis based on auto power spectrum are employed to investigate the frequencies of the short part. The natural frequency of the short part is many times of that of the whole stay cable. Accordingly, the frequency change of the short part resulting from damage is amplified many times than that of the whole stay cable. Using the frequency change of the short part rather than the whole stay cable, the small damage of a stay cable can be diagnosed.
However, the early work (An et al., 2015b) only provides the basic idea and a very simple numerical validation: first, in the further study, the authors found that the early work does not employ the first two local frequencies of the short part in the numerical example; second, the proposed method has not been experimentally validated; third, the early work has not provided the method for determining the sectional properties of the temporary diagonal steel bar. As a result, the main purpose of this article is to validate the model-free damage diagnosis method for periodic detection of the stay cables based on both simulation and experiment and also to provide a design method for the temporary diagonal steel bar. The proposed method is demonstrated with numerical study of a stay cable from a cable-stayed bridge and also the experimental and numerical studies of a laboratorial stay cable. The remainder of this article is organized as follows: section “The proposed damage detection method for stay cables” proposes the damage diagnosis method, section “Numerical simulation based on a stay cable from a cable-stayed bridge” provides numerical validation based on a stay cable from a cable-stayed bridge, section “Numerical simulation based on a laboratorial stay cable” describes numerical validation based on a laboratorial stay cable, section “Experimental validation” provides its experimental validation, section “Discussion in engineering application” shows the discussion about the proposed method in engineering application, and section “Conclusion” gives the conclusions.
The proposed damage detection method for stay cables
The frequency change–based damage diagnosis methods are commonly used because the frequencies can be obtained easily and accurately. This section proposes a damage diagnosis method for stay cables based on the frequency change before and after damage. The main idea is to improve the frequency change due to damage: the frequency of the stay cable decreases after the stay cable is damaged; however, the frequency change due to small damage is possibly submerged by the resolution in frequency axis, the surrounding noise and error in the process of parameter identification, and other uncertainties. To address this problem, a better way is to improve the frequency change due to damage; thus, the small damage can be identified through the frequency change. Therefore, the next step is to find a method to improve the frequency and the frequency change before and after damage for a given stay cable.
A common vibration-based method for tension force calculation of the stay cable is based on the flat taut string theory that neglects both sag-extensibility and bending stiffness (Irvine, 1981; Kim and Park, 2007)
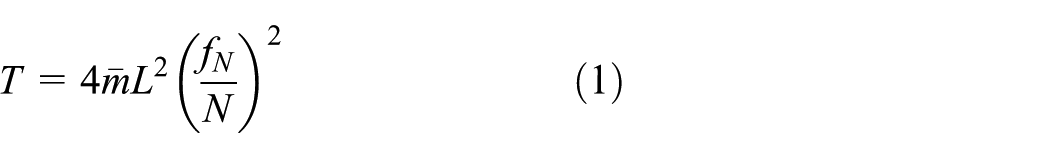
where T is the cable tension force,
In the proposed method, a temporary diagonal steel bar is designed and installed between the cable-stayed bridge deck and the measured stay cable. As shown in Figure 1(a), the steel bar’s one end is connected with the stay cable close to the bottom anchor head, and the other end is installed on the bridge deck. Figure 1(b) shows the designed steel bar, in which it can be seen one end of the steel pipe is connected with a steel plate (32 cm × 32 cm × 2 cm) by the pin connection, and the other end has a pipe connection coupler which can connect the steel bar with the stay cable tightly. The steel plate end of the steel bar is just put on the bridge deck, and it is immovable due to the friction force between the steel plate and the bridge deck. With installation of the steel bar, the cable is divided into a long part and a short part (about 2–3 m in length). As a result, the local frequencies of the short part would be amplified dramatically; note that because the short part is no longer a stay cable after the installation of a steel bar, equation (1) is no longer applicable for the calculation of the local frequencies of the short part; however, numerical simulation shows that the accurate local frequencies of the short part are still very close to those based on equation (1). The frequency change of the short part before and after damage would also be amplified, and thus, the stay cable with a small damage can be diagnosed. After the damage diagnosis of one stay cable is conducted, then the temporary diagonal steel bar should be removed and installed on the next stay cable.
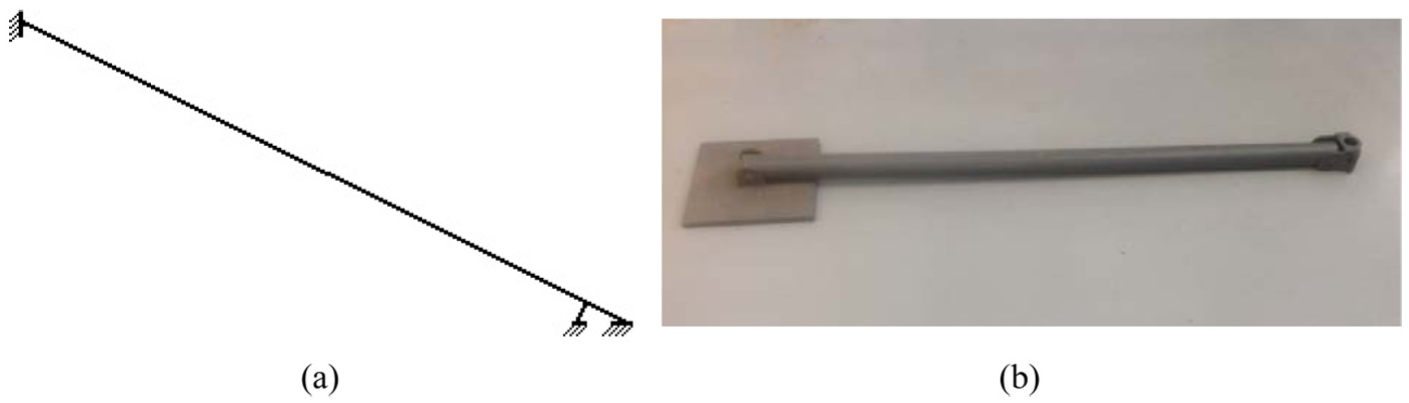
The general idea: (a) the sketch of the stay cable with installation of a temporary diagonal steel bar and (b) the temporary diagonal steel bar.
Note that with the installation of the steel bar on the stay cable, the local vibration of the short part of the stay cable should be measured, that is, what the proposed method need are the frequencies of the short part. Local modes of the short part cannot be excited easily under ambient excitation; therefore, pulse excitation should be selected to excite the short part to obtain the local vibration frequencies. The key point is to design the temporary diagonal steel bar, for example, its sectional area and moment of inertia. The parameter design rule is studied in sections “Numerical simulation based on a stay cable from a cable-stayed bridge” and “Numerical simulation based on a laboratorial stay cable.”
Parallel wire cables and twisted wire cables are two common-used types of stay cables. If one strand of a parallel wire cable is broken, the stiffness of full length of the cable will change, while the rupture of one strand of a twisted wire cable will only produce local stiffness reduction due to friction between the strands (An et al., 2015a). Generally, there are three common damage types in stay cables, that is, wire breakage, anchor head relaxation, and corrosion. The proposed method is suitable for the following six cases: (1) wire breakage at any location of the parallel wire stay cables, (2) anchor head relaxation in parallel wire stay cables, (3) corrosion in the short part of the parallel wire stay cables (the proposed method can diagnose the corrosion damage at any location of the cable if the strands are broken due to the corrosion), (4) wire breakage in the short part of twisted wire stay cables, (5) anchor head relaxation in twisted wire stay cables, and (6) corrosion in the short part of the twisted wire stay cables.
Numerical simulation based on a stay cable from a cable-stayed bridge
To verify the proposed method, two stay cables are selected in the simulation: one is from a real cable-stayed bridge, and the other is a stay cable installed in the laboratory. As mentioned above, the stay cable is divided into two parts by the steel bar. However, the cross connection point of the steel bar and the stay cable is not really fixed; therefore, the local frequencies of the stay cable’s short part cannot be calculated by equation (1), and they are influenced by the temporary diagonal steel bar’s sectional properties. In this work, the amplification rate of frequency change before and after damage is defined as the ratio of the short part’s local frequency change with the temporary diagonal steel bar to the whole stay cable’s frequency change without the temporary diagonal steel bar; the amplification rate is possibly influenced by the steel bar’s bending stiffness and/or axial stiffness. This section will investigate the influence of the sectional area and moment of inertia on the amplification rate of frequency change before and after damage due to installation of the steel bar. Damage of the wire breakage, which is one of the most common damage types in stay cables, is simulated in this section. The damage of wire breakage in a stay cable is simulated by 5% reduction in the sectional area of the stay cable (it is noted that the density of the cable should be improved after damage to keep the same mass with that before damage).
Research object and damage case
Figure 2 shows an overview of the cable-stayed bridge. This bridge is 350 m in length. Numerical studies are carried out using ANSYS. The three-dimensional (3D) linear finite strain beam element (beam 4) is employed in modeling of the main tower and the deck system, and the tension-only spar element (link 10) is employed in modeling the stay cables. The stay cable analyzed in this section is the fifth longest one (166.73 m in length), and it is divided into 334 elements, and its two ends are fixed with a rigid connection. Figure 3 shows the finite element model of the stay cable and the temporary diagonal steel bar. The temporary diagonal steel bar is perpendicular to the measured stay cable, and it is installed in the plane of stay cables with its top end at the node 330 (Figure 3).

A cable-stayed bridge: (a) the finite element model and (b) the overview (cm).

The temporary diagonal steel bar and the stay cable.
Ambient excitation is selected to excite the stay cable without installation of the steel bar, and the ambient excitation is simulated using white noise. The white noise excitation is applied to the nodes of the stay cable in the same direction with the diagonal steel bar with a frequency range from 0 to 60 Hz. The sampling frequency for the test without installation of the steel bar is 10 Hz, and the sampling time is 410 s (ambient excitation); the sampling frequency for the test with installation of the steel bar is 350 Hz, and the sampling time is about 12 s (pulse excitation). After the steel bar is installed with the stay cable, the pulse excitation is selected to excite the short part at the node 400. The node 331 is selected as the measured node to collect the acceleration responses. Besides the varieties of sectional properties, there are four different simulation conditions under ambient excitation: (1) before damage, without the temporary diagonal steel bar; (2) after damage, without the temporary diagonal steel bar; (3) before damage, with the temporary diagonal steel bar; and (4) after damage, with the temporary diagonal steel bar.
Relationship between the amplification rate of frequency change and the sectional properties of the steel bar
This section investigates the amplification rates of frequency change with different sectional properties (i.e. the moment of inertia and sectional area) of the steel bar.
Relationship between the amplification rate and the sectional moment of inertia
As shown in Table 1, consider the sectional area of A1 (A1 is the sectional area of the stay cable) is fixed, steel bars with the same sectional area of A1 but different moment of inertia values will be examined to observe the influence of the steel bar’s moment of inertia on the amplification rate of frequency change before and after damage due to the installation of a steel bar.
Three sections of the steel bar with the same sectional area of A1 and different values of moment of inertia (A1 is the sectional area of the stay cable).
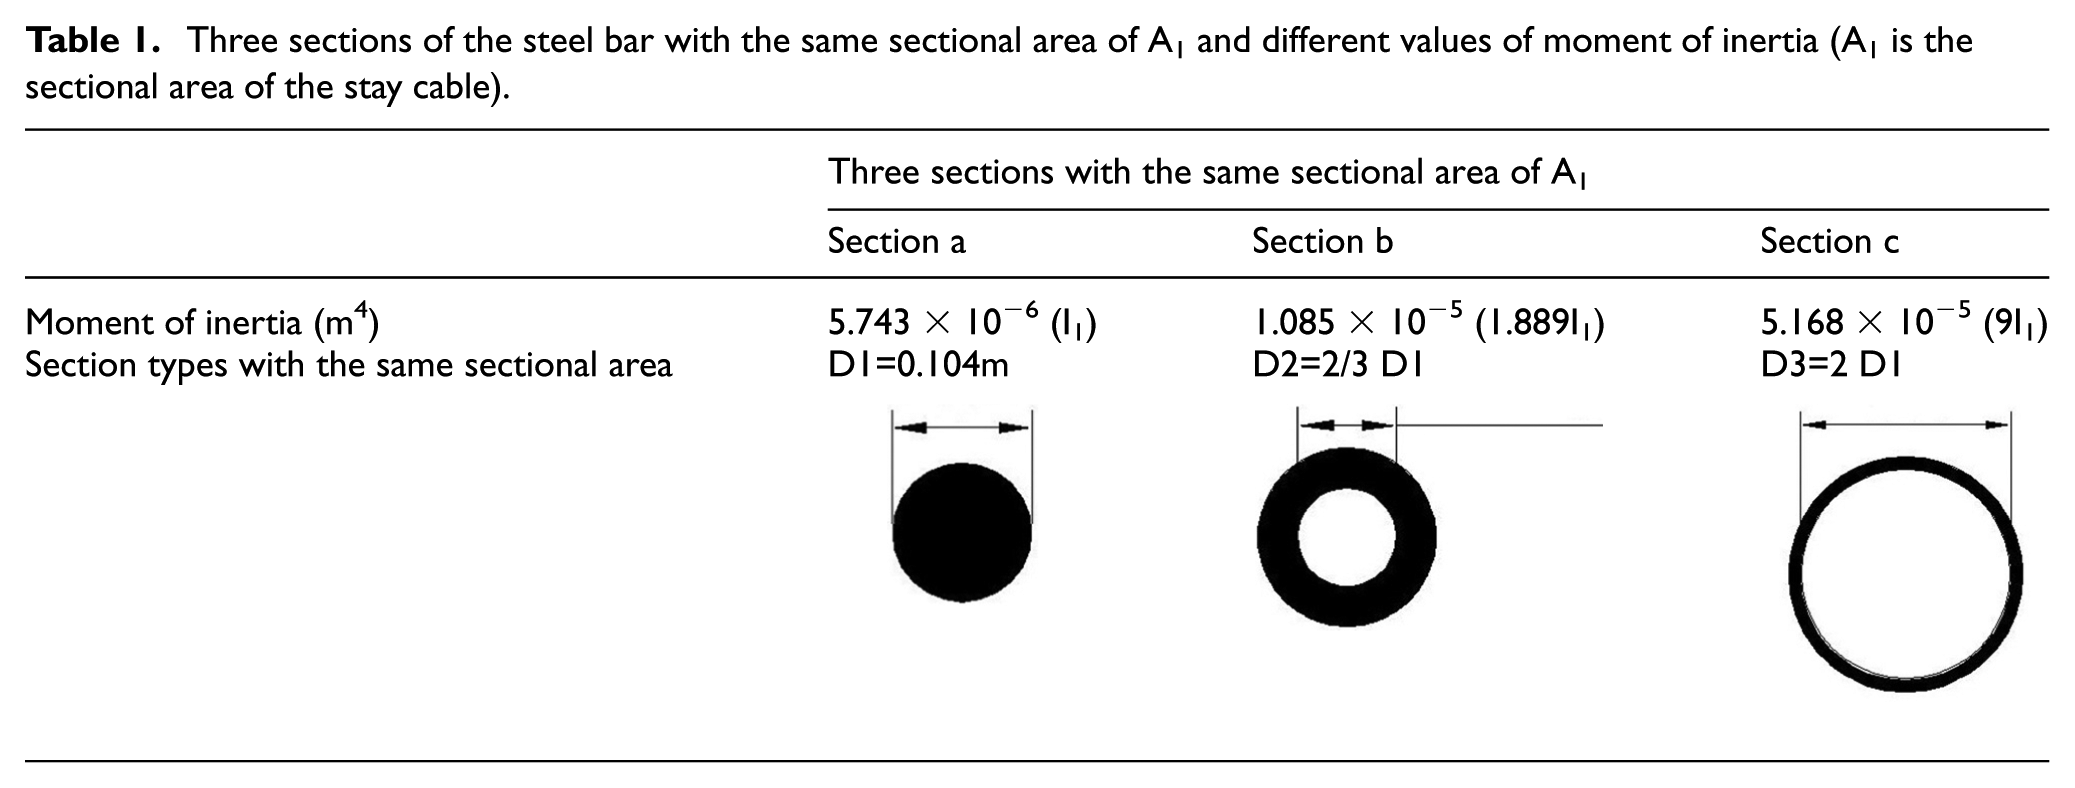
Table 2 shows the results based on the steel bars with the same sectional area of A1 but different sectional moment of inertia values (Table 1). As shown in Table 2, in the cases without the temporary diagonal steel bar,the first two natural frequencies of the whole stay cable are 1.1321 and 2.2641 Hz before damage while 1.1034 and 2.2068 Hz after damage. In the cases with the temporary diagonal steel bar, the first two local frequencies of the short part are 63.256 (63.257) and 130.804 Hz (130.806 Hz) before damage while 61.660 (61.661) and 127.506 Hz (127.508 Hz) after damage. The frequency changes in the cases without the temporary diagonal steel bar are 0.0287 and 0.0573 Hz while 1.596 and 3.298 Hz in the cases with the temporary diagonal steel bar, and the amplification rates of the frequency change in the first two frequencies after installation of the temporary diagonal steel bar are 55.61 and 57.56, respectively. The results in Table 2 demonstrate that there is no obvious relationship between the amplification rate of the frequency change and the steel bar’s sectional moment of inertia.
Amplification rates based on steel bars with sections a–c (the same sectional area but different moment of inertia values).
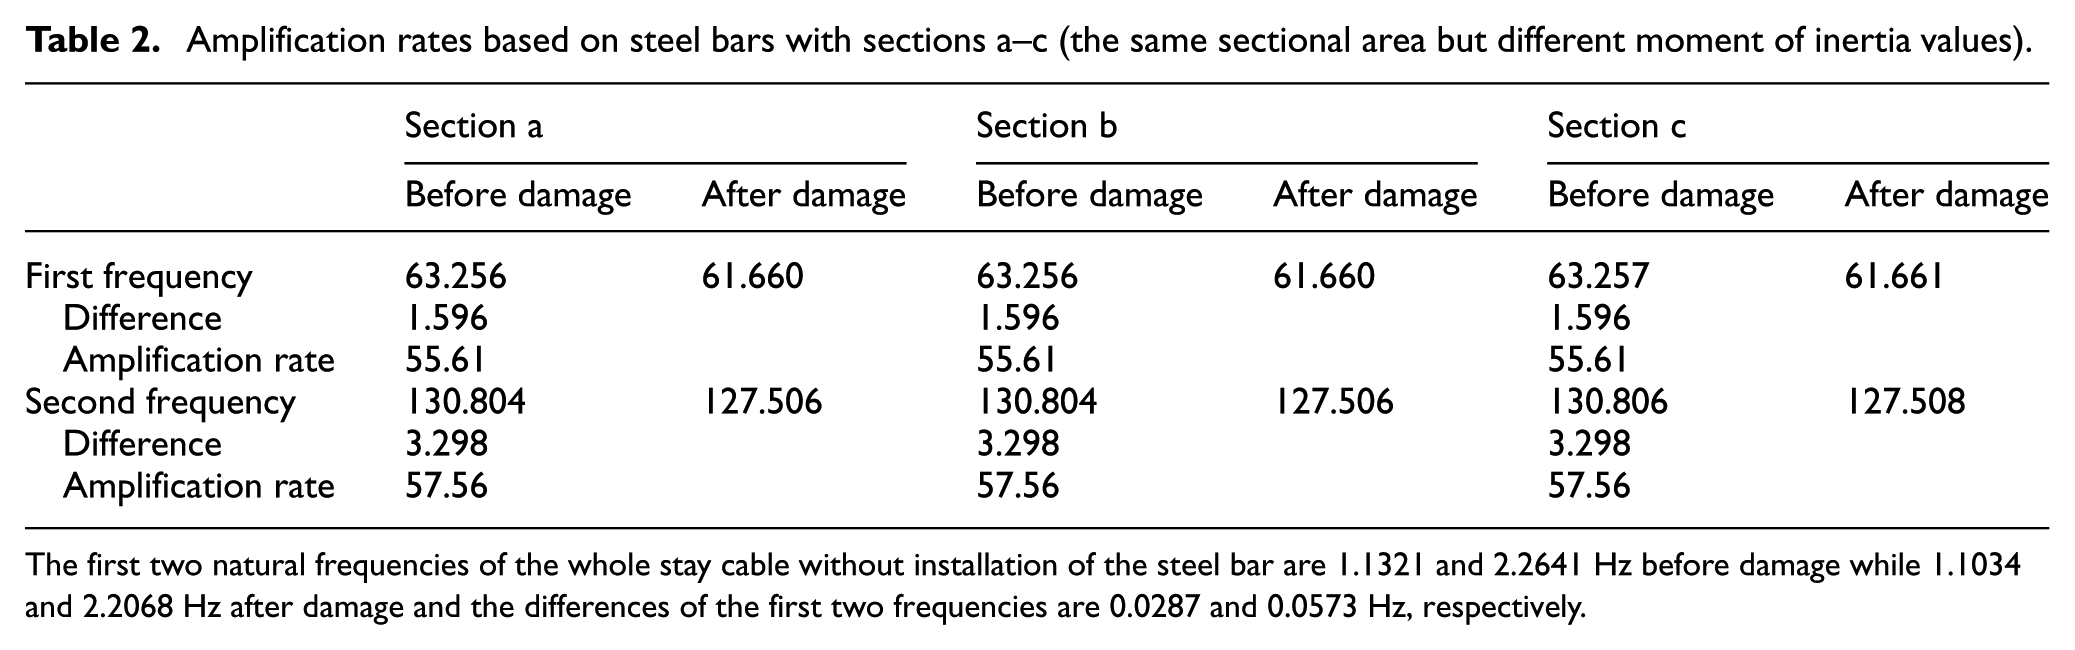
The first two natural frequencies of the whole stay cable without installation of the steel bar are 1.1321 and 2.2641 Hz before damage while 1.1034 and 2.2068 Hz after damage and the differences of the first two frequencies are 0.0287 and 0.0573 Hz, respectively.
Relationship between the amplification rate and the sectional area
Section “Relationship between the amplification rate and the sectional moment of inertia” concludes that there is no relationship between the amplification rate of frequency change and the sectional moment of inertia. This section investigates the relationship of the amplification rate and the steel bar’s sectional area. As shown in Table 3, four steel bars with different sectional areas, that is, 0.5A1, A1, 5A1, and 20A1, are examined.
Sectional properties of the steel bars with different sectional areas.
d: internal diameter (m); D: external diameter (m).
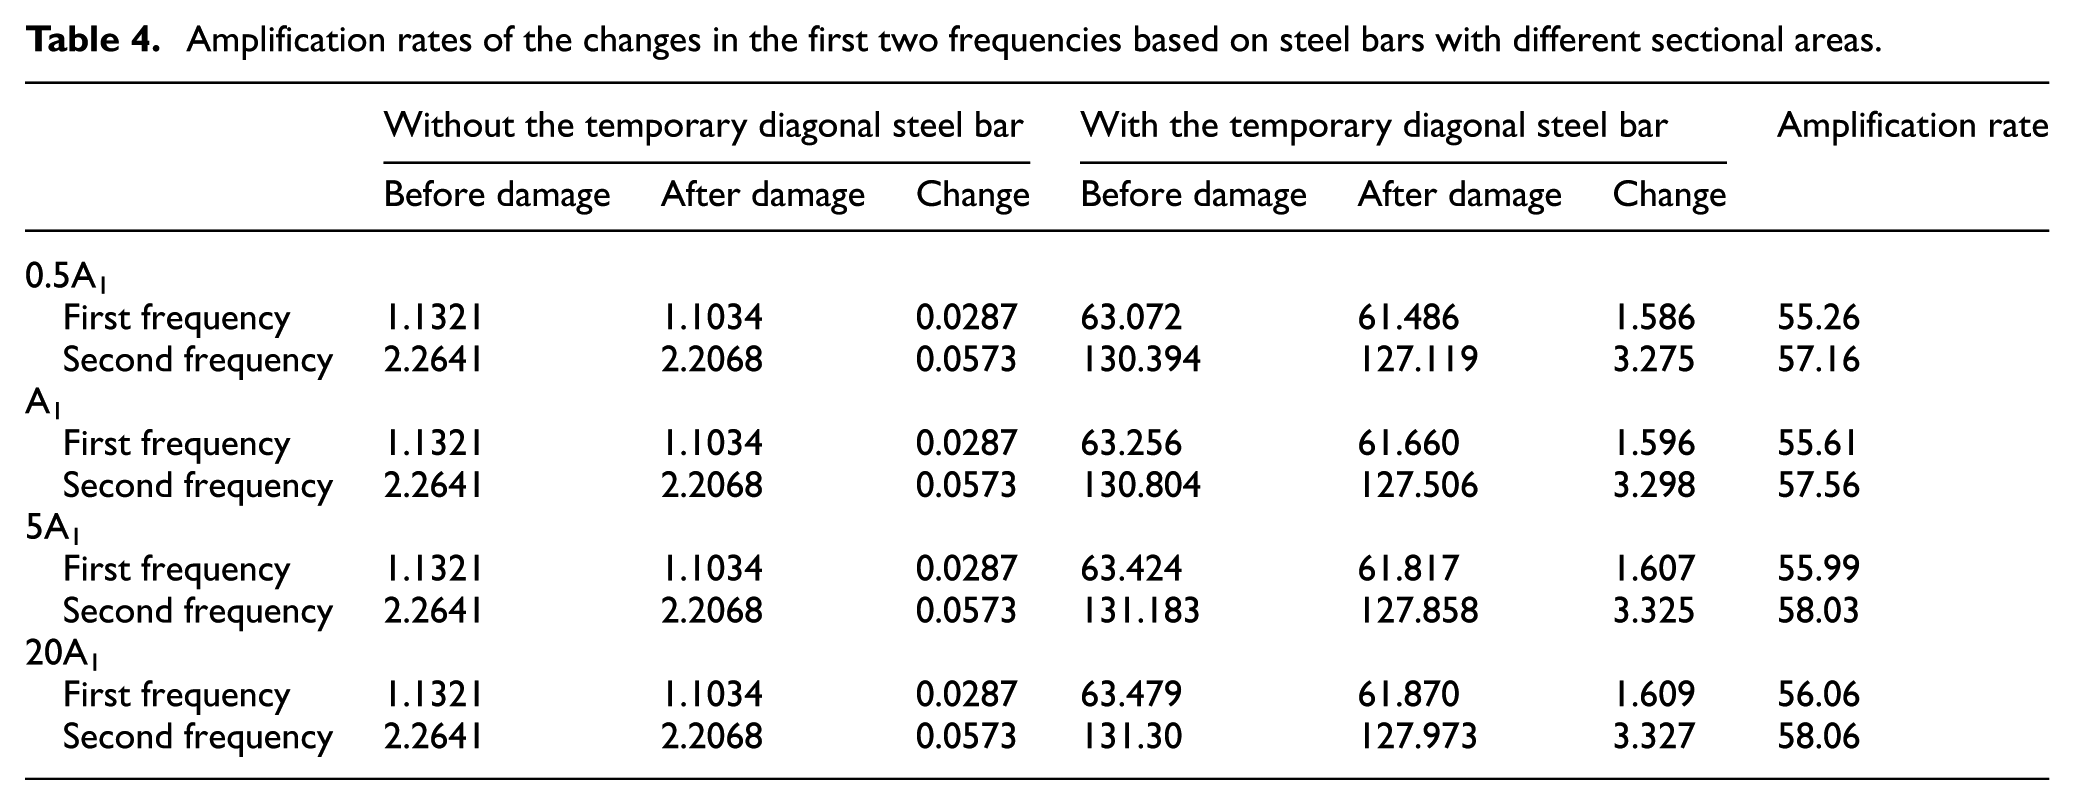
Table 4 shows the amplification rate results based on the steel bars with four different sectional areas. It can be seen that with the increase in the sectional area from 0.5A1 to 20A1, the change in first frequency increases from 1.586 to 1.609 and the change in second frequency increases from 3.275 to 3.327; when the sectional area is greater than A1, the amplification rate would not increase much. Figure 4 shows mode shapes of the stay cable with installation of a steel bar with different sectional areas; in which Figure 4(a) and (b) shows the results after installation of a steel bar with the sectional area of 0.5A1, Figure 4(c) and (d) shows the results after installation of a steel bar with the sectional area of A1, and Figure 4(e) and (f) shows the results after installation of a steel bar with the sectional area of 5A1. It can be seen that with the increase in sectional area of the steel bar, the local vibration of the long part cable decreases in the local modes of the short part. Therefore, the recommended sectional area of the steel bar for obtaining the biggest amplification rate is no less than A1. It can be used for the design of the steel bar in the proposed method.
Amplification rates of the changes in the first two frequencies based on steel bars with different sectional areas.
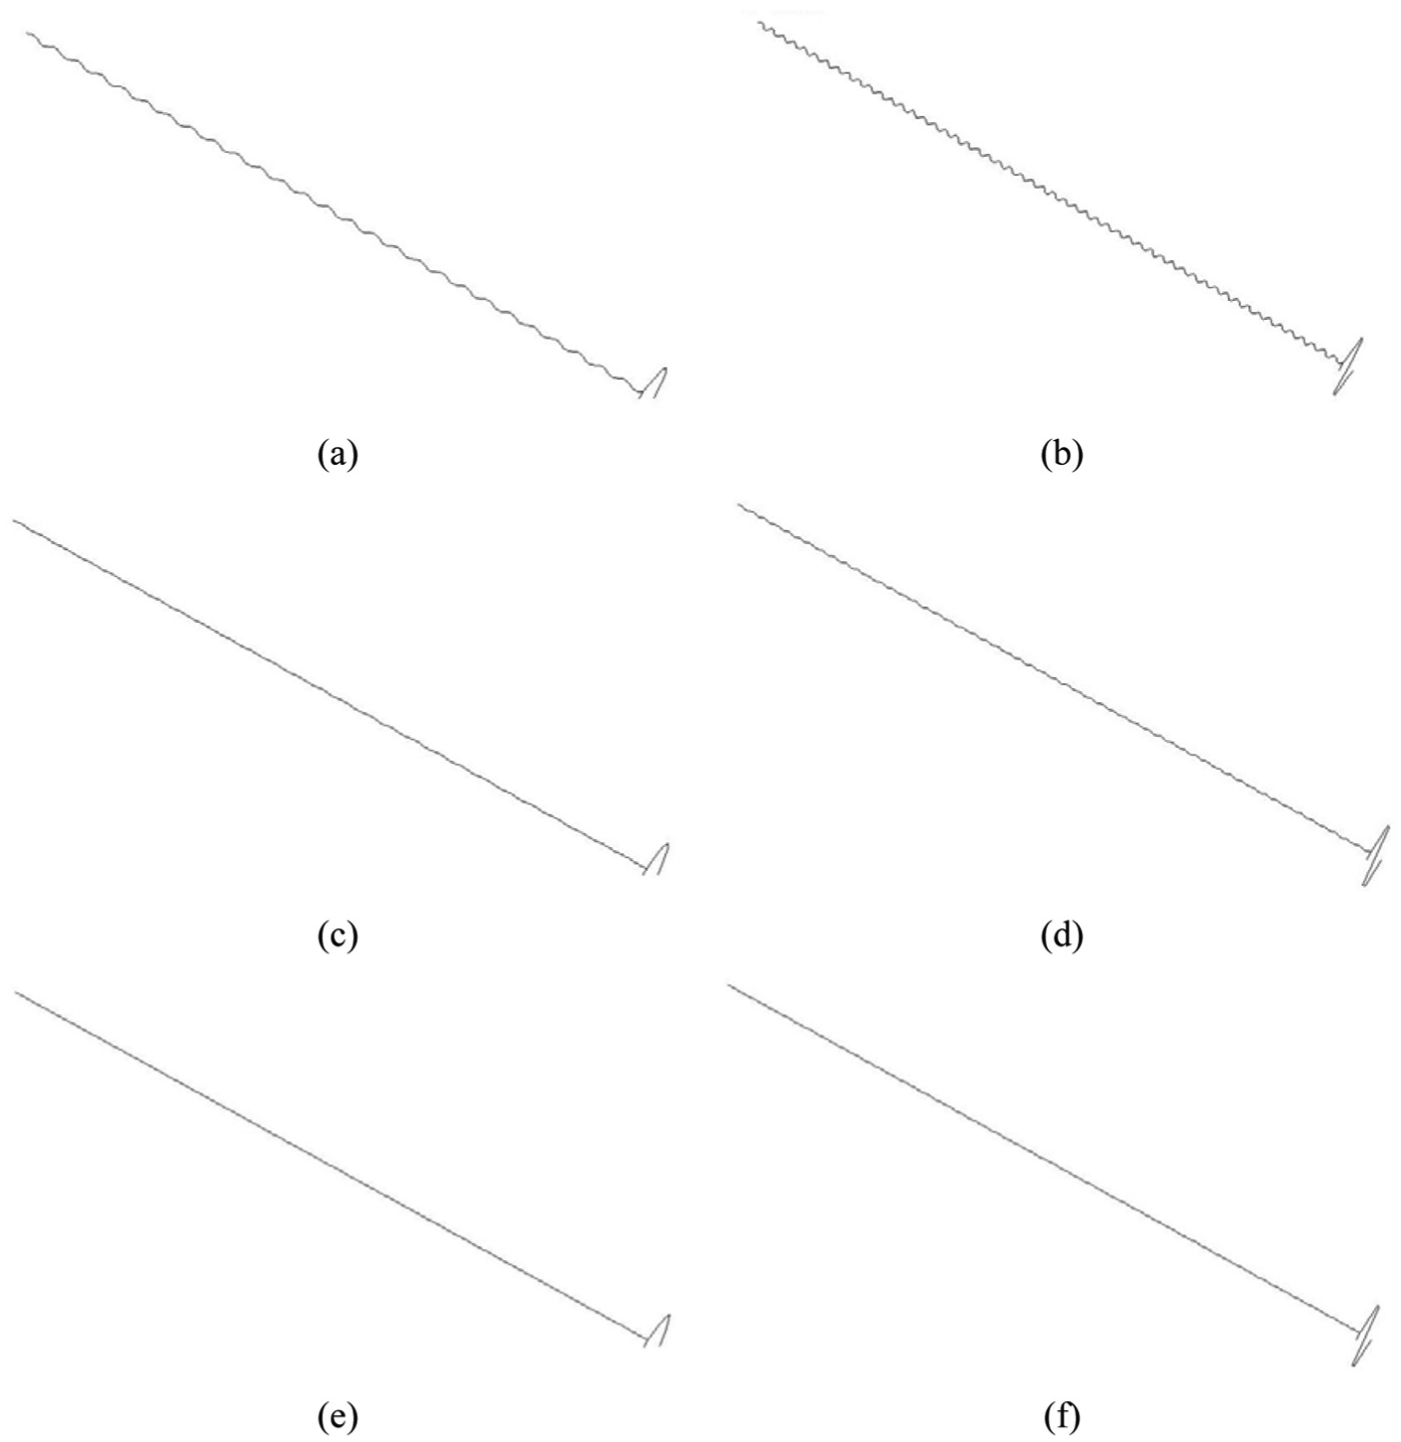
Mode shapes of the short part cable: (a) first mode shape based on a steel bar with sectional area of 0.5A1, (b) second mode shape based on a steel bar with sectional area of 0.5A1, (c) first mode shape based on a steel bar with sectional area of A1, (d) second mode shape based on a steel bar with sectional area of A1, (e) first mode shape based on a steel bar with sectional area of 5A1, and (f) second mode shape based on a steel bar with sectional area of 5A1.
Figure 5 shows the auto power spectral density based on the steel bar with the sectional area of A1 (section type a). Figures 5(a) and 4(b) show the auto power spectral density in the cases without and with the temporary diagonal steel bar, respectively; Figures 5(c) and 4(d) show the details of the first and second frequencies in Figure 4(b) with the same resolution in the frequency axis with Figure 5(a). It can be seen that (1) it is difficult to diagnose the damaged stay cable before the installation of the temporary diagonal steel bar because the frequency changes are very small (changes in the first two frequencies are 0.029 and 0.048 Hz); moreover, they are possibly submerged by the surrounding noise and error in the process of parameter identification (there is no frequency change if the frequency resolution in the parameter identification process is a little large); (2) however, the frequency changes in Figures 5(c) and 4(d) increase dramatically after the installation of the temporary diagonal steel bar; thus, the damaged stay cable can be diagnosed.
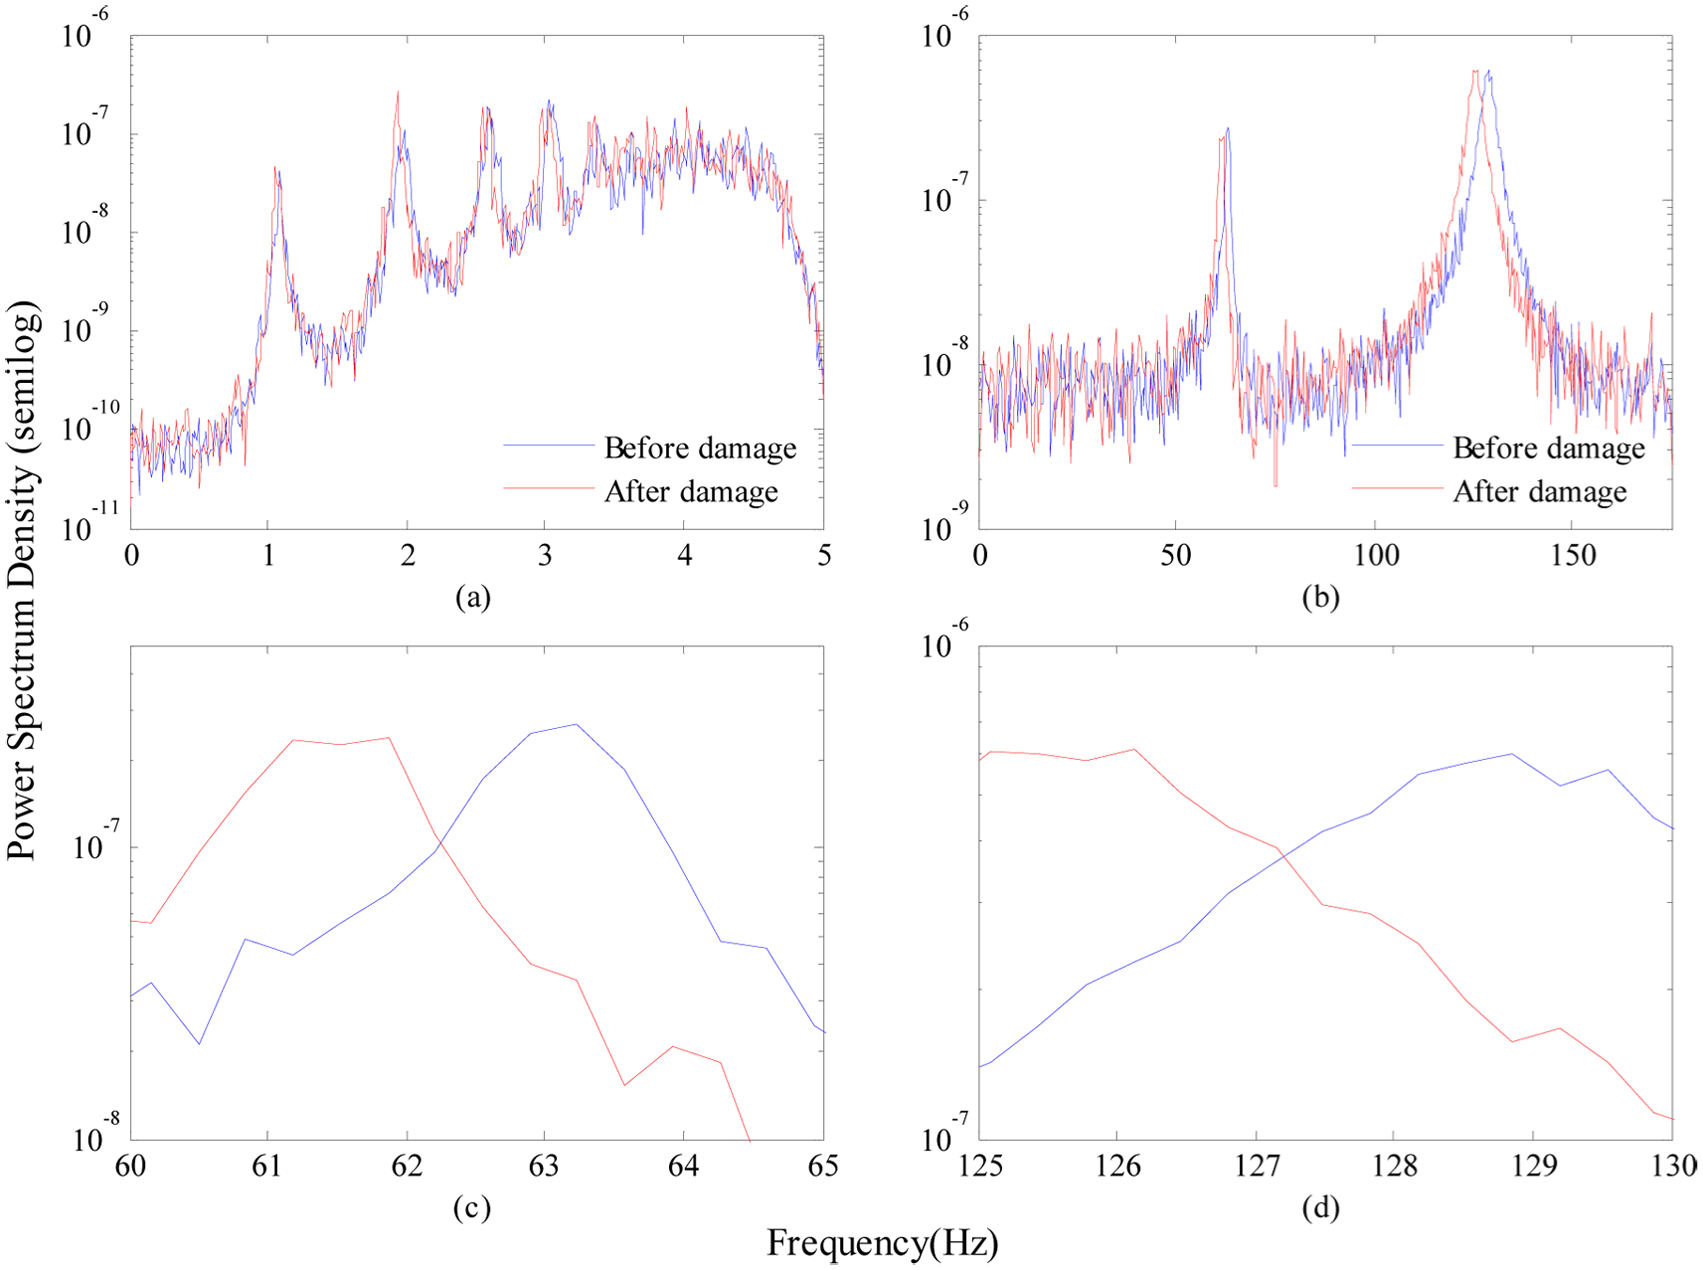
Auto power spectral density based on the steel bar with sectional area of A1: (a) without the temporary diagonal steel bar, (b) with the temporary diagonal steel bar, (c) detail of the first frequency in (b) with the same resolution in the frequency axis of (a), and (d) detail of the second frequency in (b) with the same resolution in the frequency axis of (a).
Numerical simulation based on a laboratorial stay cable
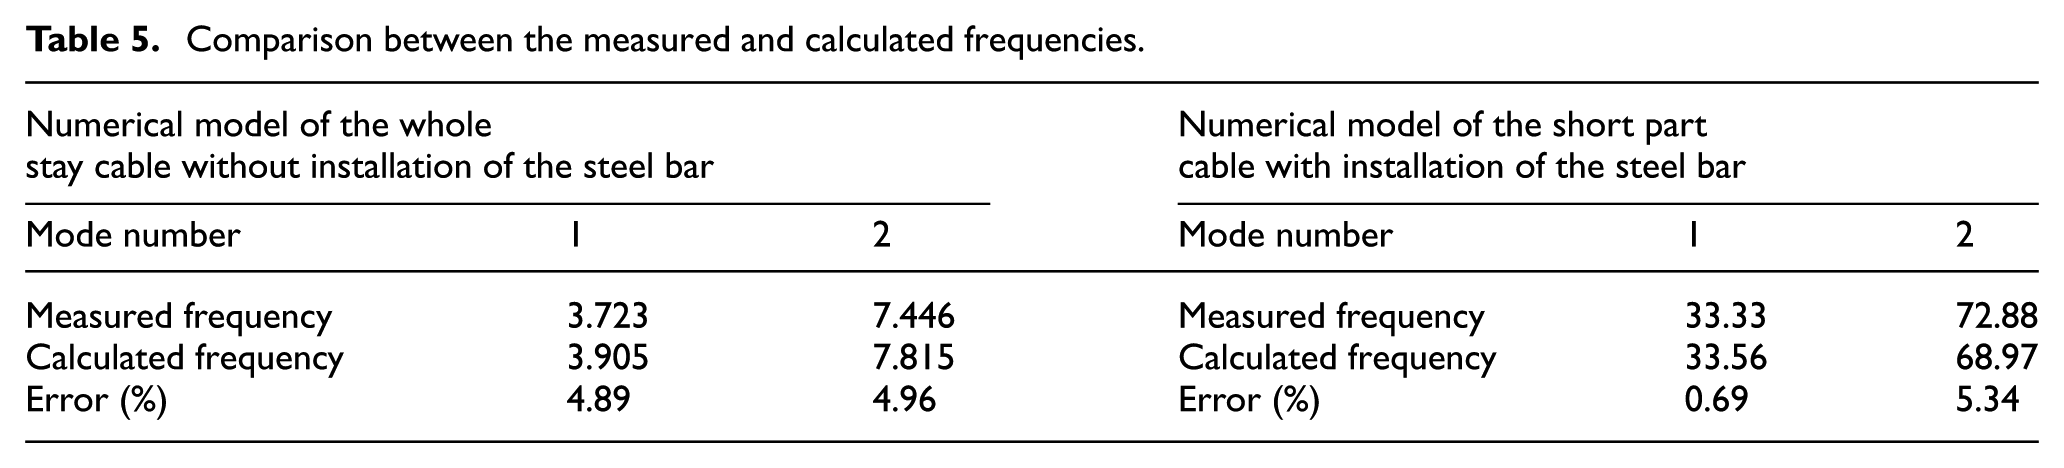
Section 3 gives a recommended sectional area of no less than the stay cable’s sectional area for design of the steel bar. To validate this rule is applicable for different stay cables, different from the stay cable in section 3, a laboratorial stay cable with different lengths, different tension forces, different angles, and different sectional areas is used to examine the recommended design rule of the steel bar. Figure 6 shows the finite element model of the laboratorial stay cable. The whole length of the stay cable is 13.08 m, and the other detailed parameters are shown in Figure 6. The steel bar and the stay cable are connected at node 7, a pulse excitation is selected to excite the short part stay cable at node 8, and the acceleration response of node 6 is used in the calculation. The sampling frequency is 200 Hz. The first two frequencies of the two numerical models with and without installation of the steel bar are shown in Table 5, which are very close to the experimental results, so the two numerical models are served as the reference finite element models.
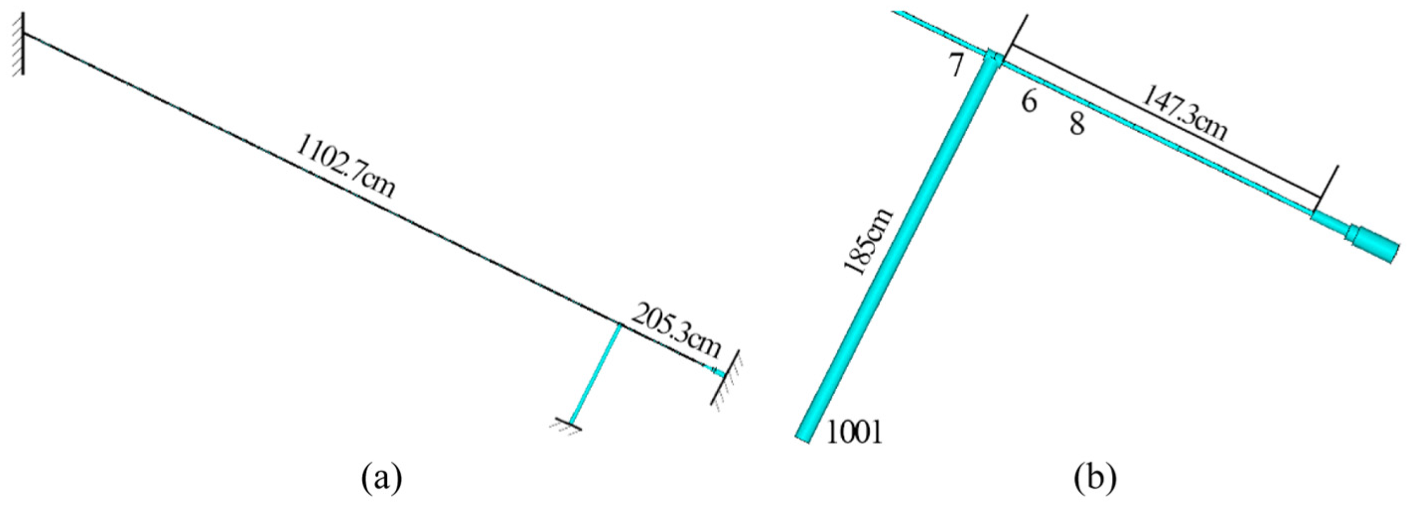
The laboratorial stay cable: (a) the finite element model and (b) the detail of the short part stay cable and the steel bar.
Comparison between the measured and calculated frequencies.
Four different simulation cases with different sectional areas of steel bar are listed in Table 6. It can be seen that the recommended sectional area of the steel bar for the laboratorial stay cable is still no less than that of the laboratorial stay cable’s sectional area.
Numerical results of the amplification rates of frequency change for the laboratorial stay cable when a steel bar with different sectional areas is used.
A2 is the sectional area of the laboratorial stay cable.
Therefore, a steel bar with the sectional area of A2 is selected to be installed on the laboratorial stay cable in simulation. Numerical results show that the accurate frequency changes in the first two frequencies of the whole stay cable without installation of a steel bar are 0.064 and 0.128 Hz, respectively, which are calculated from the modal analysis of the finite element model; the frequency changes are so small that they are possibly submerged and cannot be identified accurately due to the surrounding noise, error of parameter identification process, and other uncertainties. Numerical results show that the frequency changes in the first two frequencies after the installation of a steel bar with sectional area of A2 are 0.543 and 1.042 Hz, respectively; as a result, the corresponding amplification rates with and without installation of the steel bar are 8.48 and 8.14 (Table 6), respectively. Therefore, the small damage of the stay cable can be diagnosed easily based on the proposed method. Note that the amplification rate is not very big because the ratio of the laboratorial stay cable’s length to its short part’s length is small. The longer the ratio of the measured stay cable’s length to its short part’s length, the larger the amplification rate.
Experimental validation
As stated above, the recommended sectional area of the steel bar has been determined as no less than the measured stay cable. Therefore, any steel bar with the sectional area greater than the measured stay cable meets the requirement. However, for the possible use of the temporary diagonal steel bar in the on-site test of stay cables in the future research, the steel pipe with 0.070 m in exterior diameter and 0.005 m in thickness is selected as the temporary steel bar with consideration of the specifications of steel pipes in China. The steel bar has a sectional area of 2.55 times of the present laboratorial stay cable’s sectional area, which can be used in both the present experiment and some tests in real bridges.
The experiment is conducted in the Laboratory of Bridges and Tunnels, Dalian University of Technology. Figure 7 shows the laboratorial stay cable with installation of the temporary diagonal steel bar, in which the stay cable is installed between the foundation trench and the reaction wall. A pulse excitation is sent from a hammer at the same location with that in the simulation of section 4. The acceleration response before and after damage of the same point with the simulation is collected with the sampling frequency of 200 Hz. Damage most often occurs in the stay cables due to wire breakage and anchor head relaxation; both the two common damage types can introduce the frequency decrease. Here, the anchor head relaxation is simulated in the present experimental case. With the relaxation in the anchor head, the cable tension force decreases. In this experiment, damage is simulated by 3.25% reduction in the cable tension force. Figure 8(a) shows the accelerometer installed on the stay cable, Figure 8(b) shows the machine for adjusting the cable tension force, and Figure 8(c) shows the data acquisition equipment (NI PXI-4472).
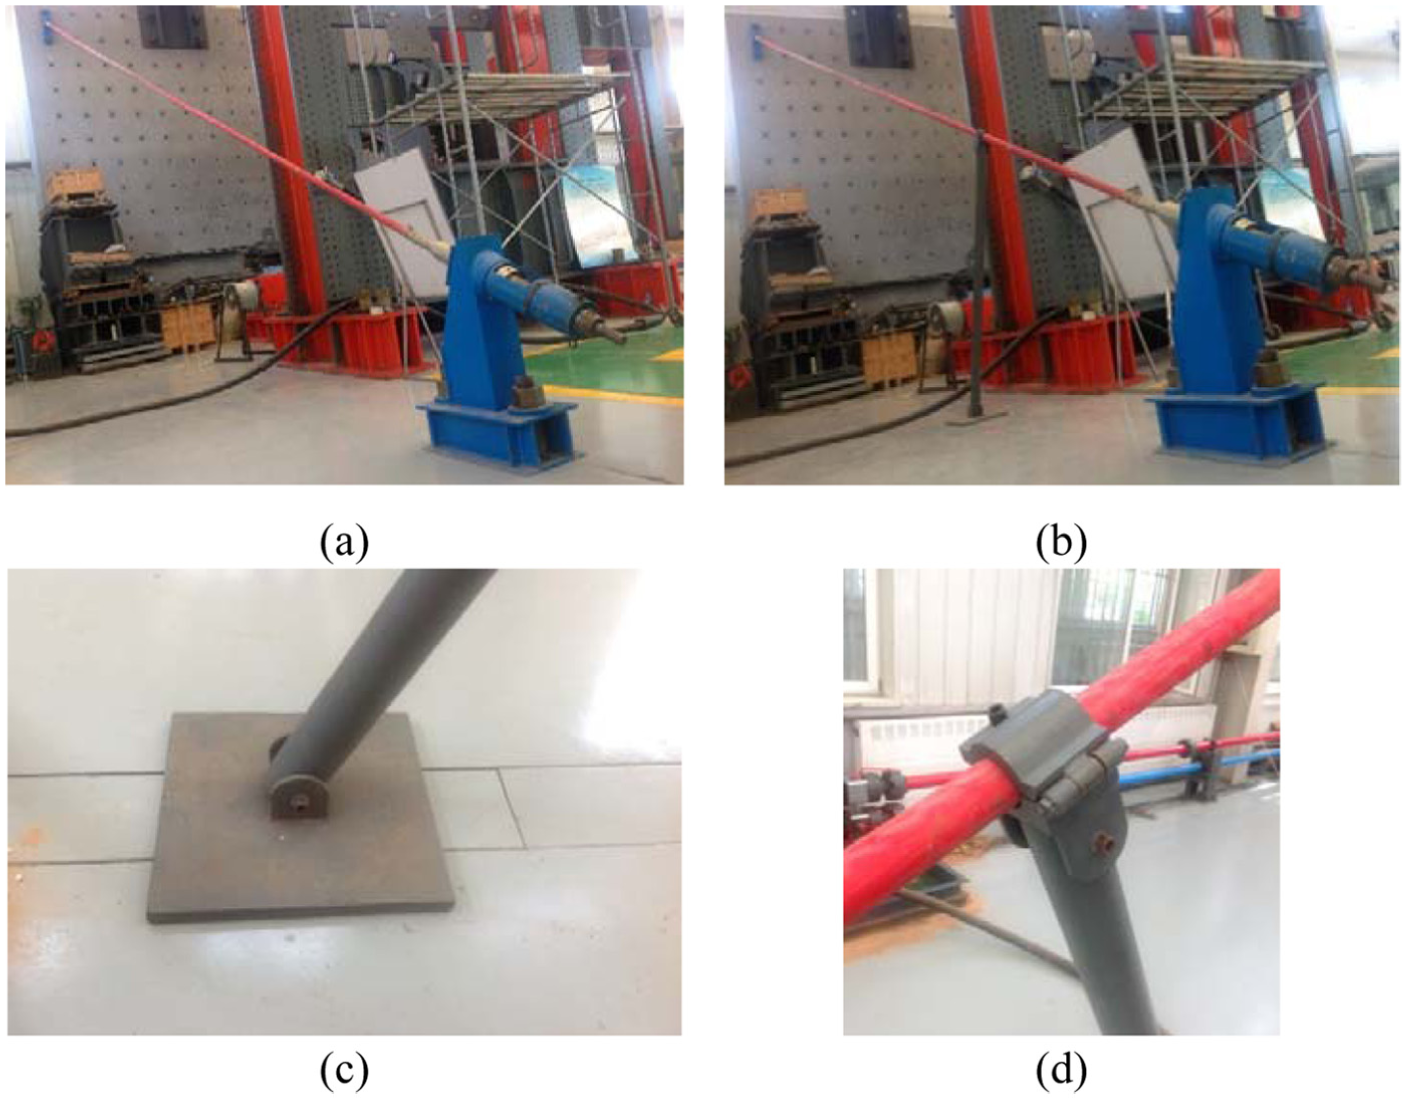
The stay cable in the laboratory: (a) without installation of the temporary diagonal steel bar, (b) with installation of the temporary diagonal steel bar, (c) one end of the steel bar, and (d) the connection joint of the other end of the steel bar.
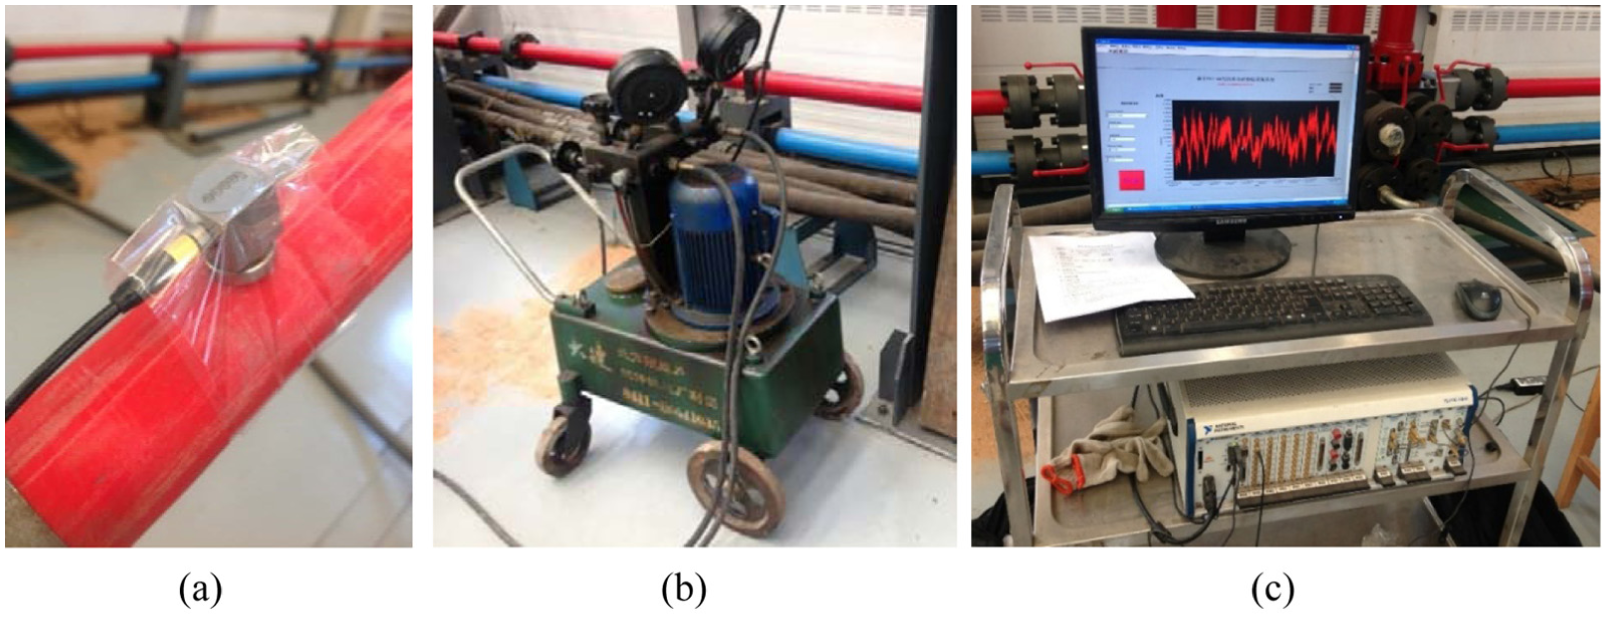
The experimental equipment: (a) the accelerometer, (b) the machine for adjusting the cable tension force, and (c) the data acquisition instrument.
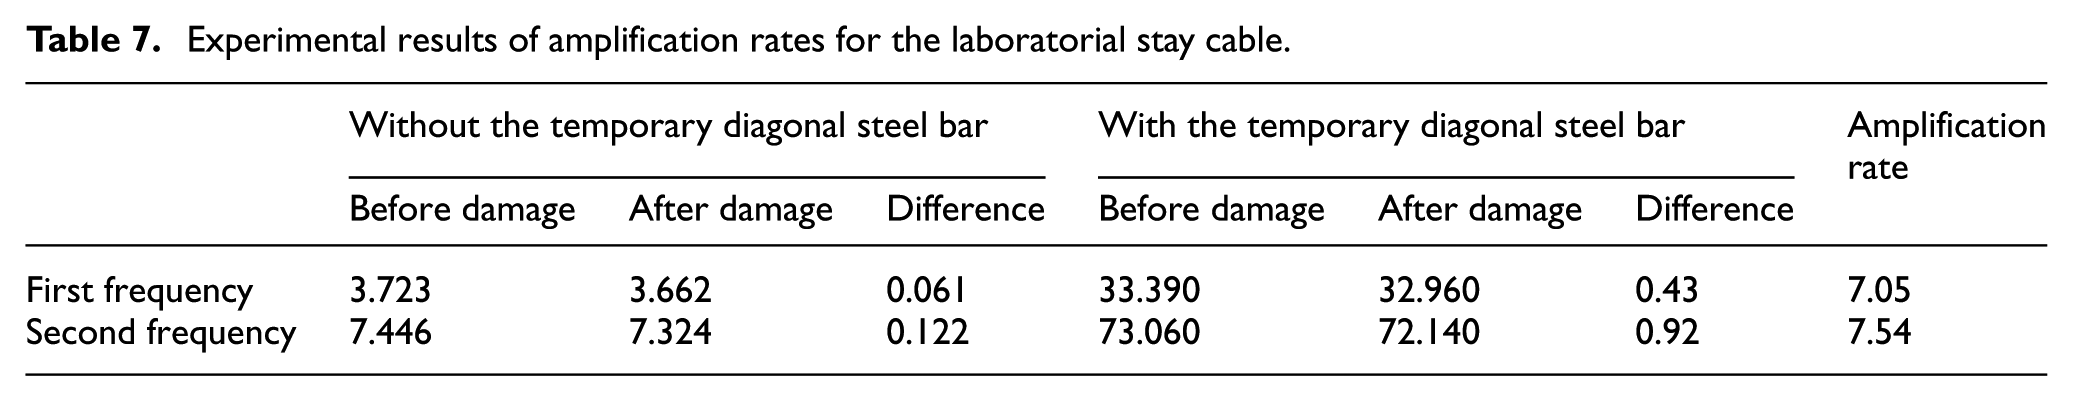
Table 7 shows the experimental results of the laboratorial stay cable before and after damage. In the cases without installation of the steel bar, the first two natural frequencies are 3.723 and 7.446 Hz before damage while 3.662 and 7.324 Hz after damage; the frequency changes in the cases without the steel bar are 0.061 and 0.112 Hz. In the cases with the steel bar, the first two frequencies are 33.33 and 72.88 Hz before damage while 32.96 and 72.14 Hz after damage; the frequency changes in the cases with the steel bar are 0.43 and 0.92 Hz. The amplification rates of the frequency changes in the first two frequencies after installation of the steel bar are 7.05 and 7.54 times, respectively. It can be seen that the small reduction in cable tension force can be diagnosed easily with the proposed method; the proposed method can successfully diagnose the small damage in the stay cable.
Experimental results of amplification rates for the laboratorial stay cable.
Discussion in engineering application
Xu and Wu (2007) pointed out that changes in dynamic characteristics due to damage in girders or cables may be smaller than those due to temperature variation; thus, changes in dynamic characteristics of the bridge due to damage are possibly submerged in changes in dynamic characteristics due to temperature; therefore, researchers should acquire the modal data before and after damage under the same or similar ambient conditions. In engineering application, when the cable-stayed bridge is healthy, the frequencies of each stay cable with installation of the temporary diagonal steel bar should be obtained under different temperatures in the temperature range of the bridge site at the temperature interval of 2°C. Then, when the damage diagnosis of stay cables is conducted, the frequencies before damage under the same or similar temperature with the present temperature should be used for reference. Note that almost all vibration-based damage diagnosis methods are faced with the temperature issue, and the discussion is also suitable for some other methods.
Moreover, a software named “Damage Diagnosis for Stay Cables” can be developed based on the proposed method for safety evaluation of the stay cables. The software contains two databases: the first one is a database of frequencies for each healthy stay cable under different temperatures in a certain temperature range, that is, the database of the healthy state. Then, when the periodic detection of the stay cables is conducted, the acceleration response of each stay cable and the corresponding frequencies based on a modal parameter identification method are collected and saved into the second database, that is, the database of the unknown state. Finally, the frequency changes can be obtained easily based on the data under the same or similar temperature in the first database. With the proposed software, the damage diagnosis becomes very easy and rapid.
Conclusion
This work validates a model-free frequency change–based damage diagnosis method for stay cables with the use of a temporary diagonal steel bar. The conclusions are summarized as follows:
Frequency changes after the installation of the temporary diagonal steel bar increase dramatically than those before the installation. Therefore, the proposed method can be used to diagnose the stay cable’s small damage, that is, the proposed method has a high damage sensitivity. The proposed method has been validated by both numerical and experimental results; its accuracy is easy guaranteed because the frequency can be easy acquired based on the reliable way.
Two ends of the steel bar have been designed and made in this work. Moreover, the key point for steel bar design is also provided by giving a recommended sectional area.
The proposed method is an output-only, model-free damage diagnosis method, which is very simple and practical in the operation steps. All requirements are listed as follows: a technician, an accelerometer, a data acquisition instrument, a computer, and a hammer. Therefore, it is a fast and economical damage diagnosis method for stay cables.
Footnotes
Declaration of Conflicting Interests
The author(s) declared no potential conflicts of interest with respect to the research, authorship, and/or publication of this article.
Funding
The author(s) disclosed receipt of the following financial support for the research, authorship, and/or publication of this article: This work was financially supported by the National Key Basic Research Program of China (2015CB060000 and 2011CB013705), the National Natural Science Foundation of China (51508070), the China Postdoctoral Science Foundation (2014M560208 and 2015T80252), and the Fundamental Research Funds for the Central Universities of China (DUT16YQ101).