




Abstract
Seismic damage detection of concrete dams has always attracted much attention in hydraulic structure community. In this article, a novel seismic damage detection system was developed to perform seismic damage monitoring in concrete dams. As its importance in achieving the dam damage detection, the arrangement of a distributed lead zirconate titanate sensor network was introduced in detail. A dam model system with a distributed lead zirconate titanate sensor network was used as an object for verification. A shaking table was used to simulate the earthquake ground motion for the object to be tested. The seismic damage detection system could be used in not only the seismic damage process monitoring by measuring the dynamic stress history but also the distributed detecting of the dam damaged region. By analyzing the sensor signals, the emergence and development of the structural damages could be monitored timely. A damage index matrix was presented to evaluate the damage status of the dam in different paths. The experimental results verified the timeliness and the effectiveness of the proposed method.
Keywords
Introduction
Several high concrete dams are being or are about to be constructed in China to meet the increase in energy demand (e.g. Jin Ping dam 305 m and Ma Ji dam 300 m). Since most of them are located in a region known for high seismicity, the ground accelerations designed for the Jin Ping and Ma Ji concrete dams are 0.197 and 0.226g, respectively, with a 2% probability of being exceeded in 100 years. Therefore, it is necessary to monitor the seismic health of these dams. An efficient seismic damage monitoring network of concrete dams should have the following characteristics: first, it must be highly flexible and adaptable given the dam’s complex structure and its environment, especially after a severe earthquake; second, even though the integrity has been compromised since several sensors fail under earthquake, the monitoring network should still effectively provide local information, such as acceleration, stress distribution, and damage quantification; third, to help engineers understand the destruction process of dams under earthquake and optimize the structure design, it also needs to monitor the seismic damage process by measuring the real-time information, such as dynamic stress history.
The use of strong-motion accelerometers and the on-site inspection is essential in seismic damage detection. In theory, the changes in modal properties can indicate structural damage. Many researchers used this method to predict the damage location and severity of relatively simple structures, such as reinforced concrete beams (Ren and Roeck, 2002), footbridges (Reynders et al., 2010), concrete box girders (Chung and Kim, 2011), and precast concrete frames (Belleri et al., 2014). In general, when applied to real large-scale complex structures, the above method still faces some problems including low signal-to-noise ratio, applicability to measurement errors, false frequency, system identification, and model order estimation. Due to these uncertainties, it is still a challenge for engineers to obtain the damage localization and quantification of concrete dams using accelerometers alone. However, on the basis of changes in the frequencies, this method can provide a “global” way to reflect some of the damages in a dam. Moreover, the on-site inspection method has also been adopted to evaluate the dam safety after an earthquake. The increased complexity of concrete dams and the high water level of reservoir actually lead to the low efficiency and high cost of the on-site inspection. Another disadvantage of the method is that it cannot identify the damage of internal dams. In short, these two commonly used methods cannot completely meet the requirements of seismic damage detection. In order to supplement the traditional methods, it is necessary to develop a new detection method by which the dam’s damage and real-time response can be easier to measure.
In recent years, piezoceramic transducer (lead zirconate titanate (PZT)) has emerged as a new tool for the health monitoring of concrete structures due to their advantages of quick response, wide frequency band, low cost, high signal-to-noise ratio, and simple implementation. Based on changes in the wave propagation properties, the damage inside the structures can be detected. This approach has been widely applied in various areas (Laskar et al., 2009; Liu et al., 2013; Okafor et al., 1996; Song et al., 2007; Zou et al., 2014a, 2014b, 2015). In addition, PZT transducers can also collect real-time information about the internal stress of the structure (Hou et al., 2012). This feature seems to be an advantage of using PZTs. In addition, compared with the method of using accelerometers, this one is more sensitive to initial damage of dam structure, and the measurement does not depend on modal identification. All the above-mentioned monitoring systems are effective in evaluating the health status of many types of concrete structures, but they have not been utilized to monitor the seismic damage of concrete dams, which is also important for timely safety assessment and dam reinforcement after the earthquake.
In this article, a novel seismic damage detection system was developed to perform seismic damage monitoring in concrete dams. The proposed method can be divided into two functions: (a) dam stress history monitoring based on direct piezoelectric effect and (b) assessment of damage by the change in stress wave propagation. A dam model with embedded dual-function PZT sensors was used as a testing object. A shaking table was used to simulate the earthquake ground motion for the object to be tested. Before the shaking table test, the sensitivity of sensors was calibrated by the loading test of concrete cylinder specimens. Experimental results showed that the proposed method for concrete dams would supplement the two traditional ones and could be applied to the seismic damage monitoring in real concrete dam.
Seismic damage monitoring method
Monitoring purpose
Although some concrete dams have been reported to be subjected to earthquake-induced damage (e.g. the presence of cracks in the Koyna gravity dam during the 1967 Koyna earthquake and the openings of the contraction joints of the Pacoima arch dam during the 1971 San Fernando and 1994 Northridge earthquakes), collapse of large dams due to earthquakes has not been reported. However, the 2008 Wenchuan earthquake in China demonstrated that the peak ground acceleration of a severe earthquake can far exceed the fortification level of dams. For concrete dams, the destruction induced by earthquakes does not only affect the structure itself but more likely to cause serious secondary disasters upon downstream areas. Therefore, the study on the seismic safety assessment for concrete dams is very necessary. A suitable monitoring system should be mutually complementary with the traditional methods, with good practicability. Moreover, in order to timely provide information about the concrete dam reinforcement and help designers understand the failure mechanism, the whole process of seismic damage should be monitored. To achieve the above monitoring goals, a seismic damage monitoring method for concrete dams was developed based on a distributed PZT sensor network in this article.
Monitoring principle
The adopted dual-function PZT sensor is fabricated by embedding two pieces of PZTs and one conducting plate into a small brass case, and the gap between them is filled with rubber, as shown in Figure 1. The PZT sensor is in a coin-like shape, with diameter of 18.5 mm, thickness of 2.8 mm, and weight of 5 g.

Structure of the dual-function PZT sensor.
The adopted sensor can monitor the stress history of concrete dams via the direct piezoelectric effect during earthquake. The sensitivity can be related to the piezoelectric coefficient of the PZT patch by Hou et al. (2012)

where the coefficients d31, d32, and d33 denote the normal stress in the 1, 2, and 3 directions, respectively, toward a field along the poling direction; A3 denotes the area of the adopted sensor in the 3 direction; and αi denotes the stress ratio, which can be expressed as

where σ1, σ2, and σ3 denote the normal stress in the 1, 2, and 3 directions, respectively. Since the constraint caused by the rubber is very small, the stress on the radial direction of the PZT can be neglected, so α1 = α2 = 0. The adopted dual-function PZT sensor contains two PZT patches, so the sensitivity of the sensors is two times of those with one piece of PZT. Equation (1) can be expressed as

The sensitivity can also be defined as the ratio between the output voltage of dual-function PZT sensor and the applied stress

where V is the generated voltage which can be obtained by experimental equipment and σ is the applied stress on the adopted sensor which can be obtained through calculation. The calibration test for the adopted sensors was conducted, as shown in Figure 2. As the strain rate of concrete dams under the real earthquake always ranges from 10−4 to 10−2 s−1, three different loads were undertaken corresponding to the strain rate of 10−2, 10−3, and 10−4 s−1, respectively. Calibration results showed that the sensors had constant sensitivity at three different strain rates. The average value of the sensors’ sensitivity obtained from the calibration test was 2.47 V/MPa.
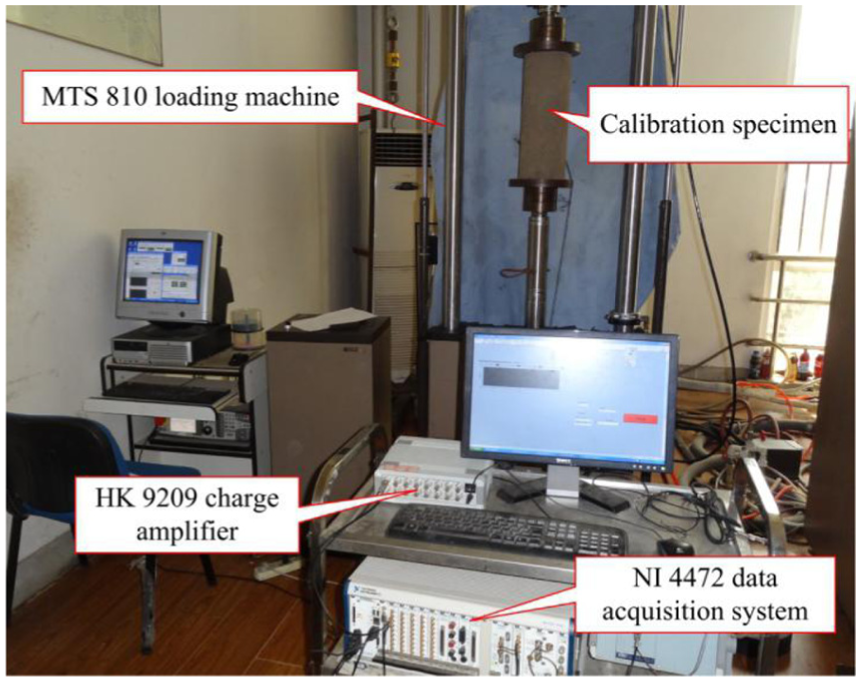
Configuration of the calibration test.
A pair of adopted sensors denoted as PZT 1 and 2 is embedded in the concrete dam. PZT 1 is used as an actuator and PZT 2 is used as a sensor. Stress wave with a range of frequencies, usually from 100 Hz to 20 kHz, can be generated by the actuator PZT 1 and transferred to the sensor PZT 2. When the dam damage occurs between PZT 1 and 2, the stress wave will be weakened at the affected area and the energy of received signal at PZT 2 will be reduced. By comparing the changes in the intensity of received signal at different frequencies, the damage in the concrete dam can be identified.
Root-mean-square deviation (RMSD) of the energy of decomposed signal is a suitable damage index to monitor the state of the concrete structures (Laskar et al., 2009; Soh et al., 2000; Song et al., 2007). In this article, RMSD between the energy vectors of the healthy and damaged states is also taken as the damage index to evaluate the damage status of concrete dams. The energy of the decomposed signal in the damaged state is represented as Ei,j, where i is the time index and j is the frequency band. The energy of the decomposed signal in the healthy state is represented as Eh,j. The damage index can be defined as
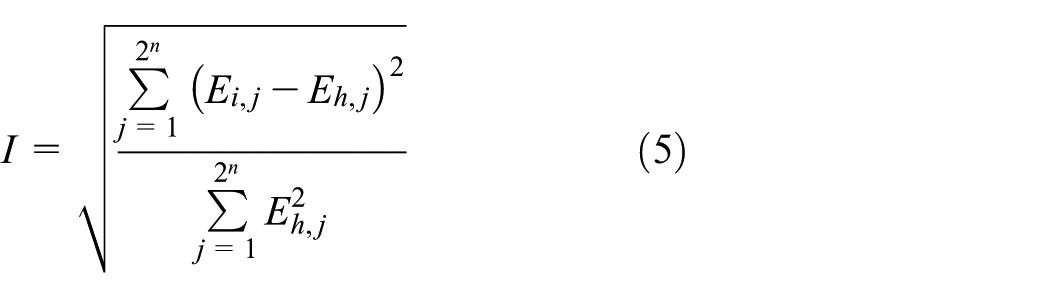
where 2 n is the number of the sensor signal decomposition at the frequency domain.
Based on historical experience, hundreds of aftershocks will rumble on since the main quake (e.g. a total of 233 aftershocks, with a magnitude of at least 4.0, occurred after the Wenchuan 5-12 Earthquake). In order to demonstrate the damage location information and damage process information, a path-history damage index matrix (PHDIM) Mp×h is defined as

where Ii,j, the matrix element at the ith row and the jth column, denotes the damage index of the ith monitoring path at the jth excitation, p denotes the total number of monitoring paths, and h denotes the total number of excitations. The damage status in different paths of the concrete dam at different excitations can be plotted by a three-dimensional damage index matrix. The PHDIM is useful in monitoring the seismic damage process to predict the failure of a concrete dam.
Monitoring method
The seismic damage detection system of concrete dams consists of two parts, which are connected by a local area network (LAN): the on-site monitoring and the remote monitoring center, as shown in Figure 3. The on-site monitoring of a concrete dam includes three parts, that is, input signal subsystem, distributed PZT sensor network subsystem, and data acquisition subsystem. The remote monitoring center includes three parts, that is, data analysis subsystem, safety assessment subsystem, and data storage subsystem.
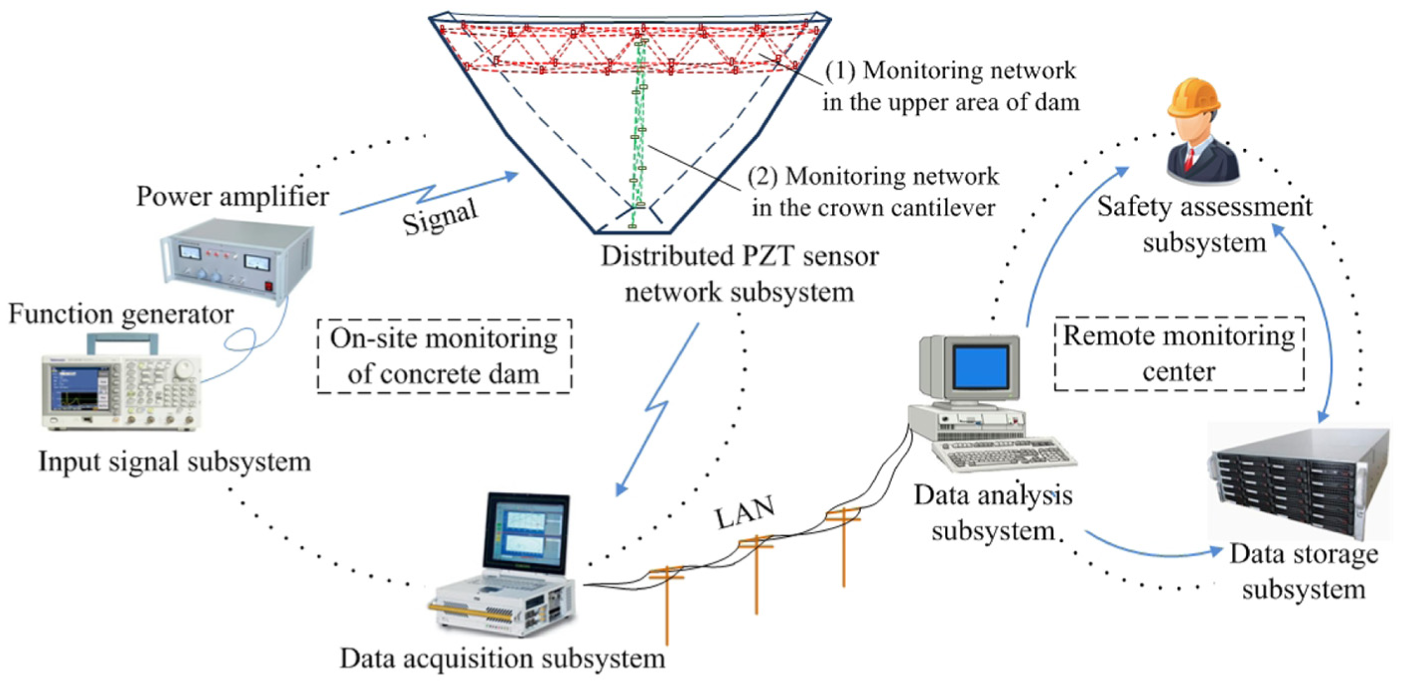
Seismic damage detection system of concrete dams.
Sensor placement optimization plays a key role in the structural health monitoring of large-scale civil structures (Yi et al., 2013, 2016; Yi and Li, 2012). Taking into account the actual, complex, and huge concrete dam, as well as the costs and other factors, only a few sensors are embedded into the limited positions. Therefore, a good distributed sensor network subsystem for monitoring concrete dams should use less measuring points to get sufficient information. According to the conventional actual damage (e.g. Shapai dam appeared an opening several meters deep at the top of right-side contraction joint during Wenchuan Earthquake) and experimental studies on concrete dams (Wang and Li, 2006; Zhou et al., 2000), it can be found that the upper area of the arch concrete dam, especially the location of the structural joints, is its weakest zone. After the destruction in the arch direction of dam, the crown cantilever of the dam will be the focus of monitored areas. Based on the above considerations, a distributed PZT sensor network subsystem should include two parts: the arch direction monitoring and the crown cantilever monitoring, as shown in Figure 3. In Figure 3, the distributed PZT sensor network is a three-dimensional network and can focus on monitoring the areas that are more prone to earthquake-induced damage. It should be noted that the actual layout of distributed PZT sensor network should take into account the impact of dam irregularities, owing to the complex structure of the real dam. Moreover, different materials of dam portions will also influence the sensitivity of the methodology. Therefore, before applying the methodology on real dams, a sensitive analysis must be performed on different materials.
Monitoring process
The seismic damage detection system monitored the stress history of dam using direct piezoelectric effect during earthquake, and it was used to detect seismic damage of the key areas by utilizing inverse piezoelectric effect after earthquake. The whole process of seismic damage detection can be divided into the following steps:
Real-time stress history information is collected by the distributed PZT sensor network subsystem during an earthquake.
The above information is collected by the data acquisition subsystem and sent to the remote monitoring center through the LAN.
After preprocessing in the data analysis subsystem, the data are sent to the dam safety assessment subsystem and the data storage subsystem.
Assessment results from the safety assessment subsystem are transferred to the storage subsystem.
Stress wave is generated by the signal input subsystem after the earthquake and transferred to the distributed PZT sensor network subsystem.
The distributed PZT sensor network subsystem is utilized to monitor the concrete dam damage.
Steps 2–4 are repeated to obtain the final result of the seismic damage detection for the concrete dam.
Steps 1–4 can detect the process of earthquake damage, while steps 5–7 can detect the damage areas of dam. The final result of the seismic damage detection can provide more timely, complete, and comprehensive information for the dam repair.
Experimental verification
General description of the test
Shapai high arch dam was selected as the prototype dam, which experienced Wenchuan Earthquake (Magnitude 8.0) and Lushan Earthquake both beyond its fortification level. Shapai concrete dam, which is 132 m in height, is located in the Wenchuan County, Sichuan Province, China. The seismic fortification level of this dam is 0.1375g, given the exceeding probability to be 10% in 50 years. One contraction joint is arranged at each end of the arch, and two induced joints are arranged near the arch crown.
Shaking table tests are often used to study the earthquake responses of arch dams. Many researchers used this method to investigate nonlinear earthquake response of concrete dams (Wang and Li, 2006; Zhou et al., 2000). According to the purpose of the experiment, the researchers will choose different similarity relation. A combination of the static load and the dynamic load was proposed to investigate an arch dam under earthquakes (Lin et al., 2000). Gravity accounts for a large proportion of the static load and significantly affects the seismic response of a dam. For this reason, elasticity–gravity similitude was employed in this study.
According to the above similitude, a small-scale model dam was built on the shaking table. Figure 4 shows the upstream view of the dam model on the shaking table. Due to the space limitations of the shaking table, the dam model was designed using a geometric ratio of 1:111.86, which resulted in a height of 1176 mm, crest length of 2215 mm, crest thickness of 85 mm, and bottom thickness of 257 mm. The model system also included the mountains that form the abutments and a partial foundation with a topographic feature near the dam. The system was fixed to the shaking table through a 120-mm-thick concrete plate. The simulated contraction joints took the effect of key grooves into consideration, while the simulated induced joints were based on fracture mechanics. To simplify the test and reduce the effects of uncertainties, the dam–reservoir interactions were ignored. It should be noted that one unavoidable deficiency of this test is the ignoring of scale effect.
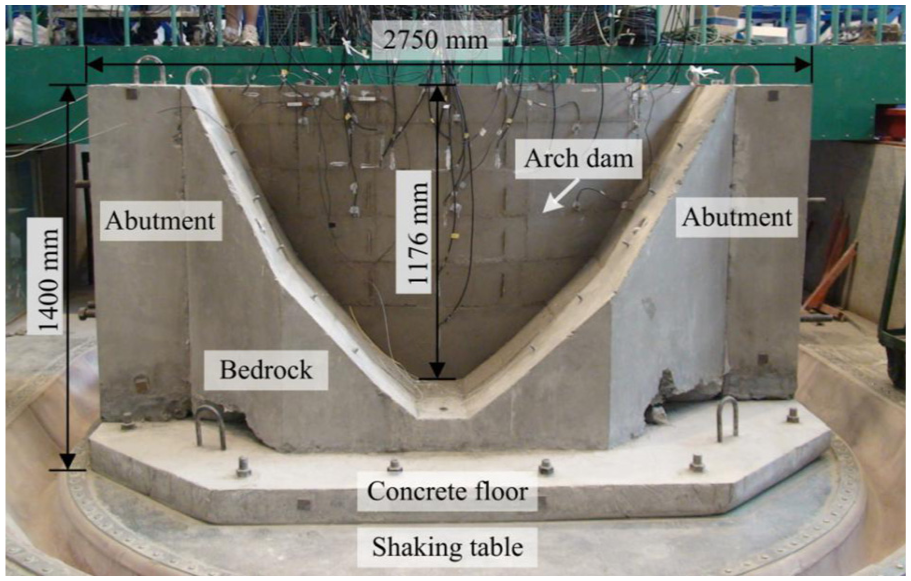
Upstream view of the dam model.
A total of 14 dual-function PZT sensors were embedded in the interior of the model when it was poured, as shown in Figure 5. Only a single-layer sensor network was arranged in the streamwise direction because of the size limitations of the dam model. Nine PZT sensors were embedded in the central axis of the upper area of the dam in the arch direction, and five were embedded in the central axis of the crown cantilever. It should be noted that precast concrete plates were arranged on whole surface of the contraction joints, where the dam is completely separated. As a result, active monitoring could not be achieved here, but stress history monitoring could. On the contrary, the precast concrete plates were arranged on the surface of induced joints discontinuously, so that both stress history monitoring and active monitoring can be carried out. A total of 10 monitoring paths in the dam were considered in Figure 5. Each arrow between a pair of sensors represents one monitoring path, such as the monitoring paths from PZT 4 to 3 and from PZT 4 to 5, as shown in Figure 5. Frequency sweep in the range of 1000–5000 Hz was conducted with amplitude of 90 V. By analyzing the wave response, the damage location and the damage status for the dam structure could be predicted.
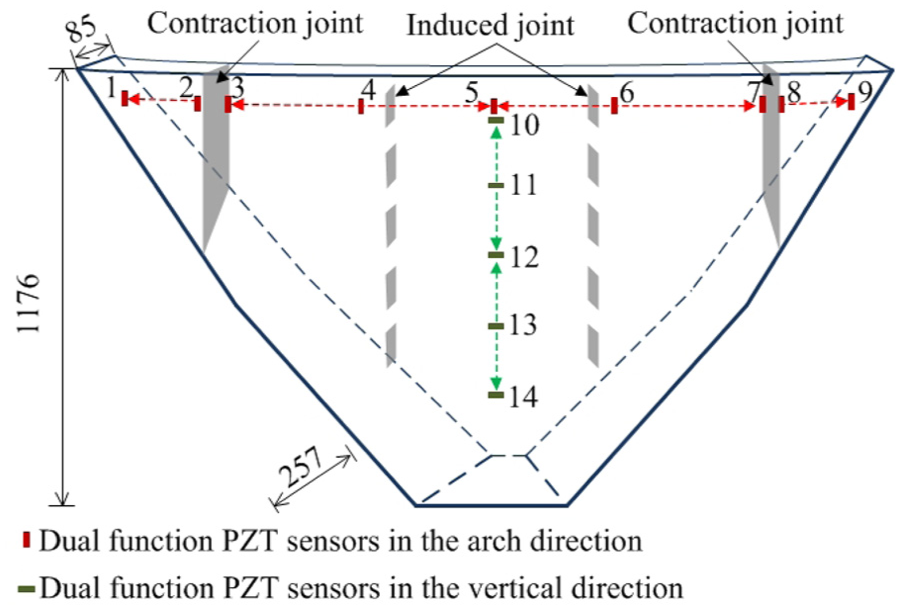
Distributed PZT sensor network embedded in a concrete dam (mm).
The harmonic waves corresponding to the fundamental frequency were employed to excite the shaking table with six excitation levels, that is, 0.1, 0.15, 0.2, 0.25, 0.3, and 0.4g. The advantage of the harmonic input lies in the repeatability of the model dam test. After each shaking, the distributed PZT sensor network was used to monitor the seismic damage of the dam model, and the next loading frequency was determined by the micro-amplitude white noise excitation. The amplitude of the harmonic wave was progressively increased until the model dam completely collapsed. The amplitude envelopes of the recorded accelerations on the shaking table at different excitation levels are shown in Figure 6. The excitation amplitude took several seconds to reach the target value and then remained largely unchanged.
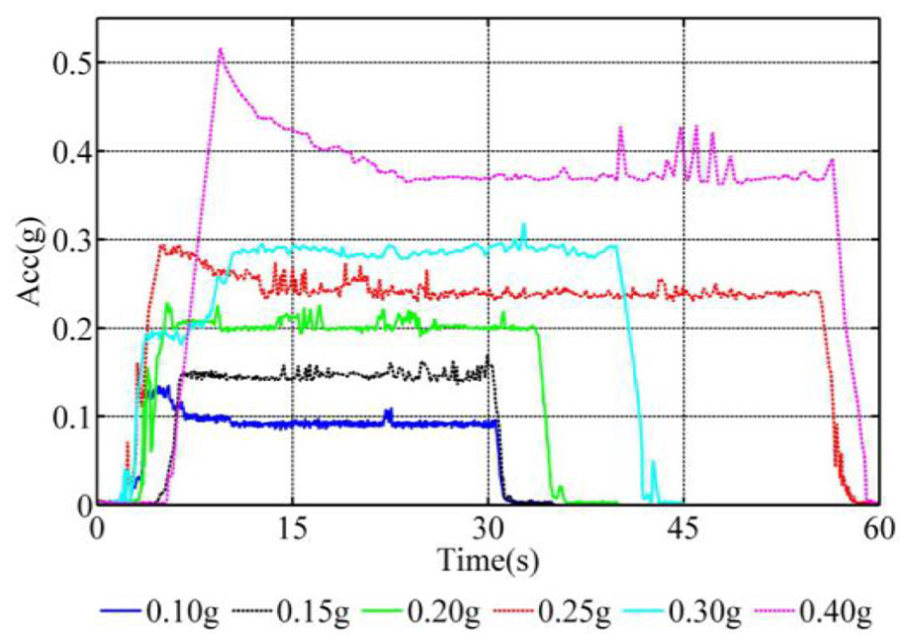
Amplitude envelopes of the accelerations on the shaking table at different excitation levels.
Experimental results and analysis
The distributed PZT sensor network was utilized for the real-time dynamic stress history monitoring of the concrete dam model. The stress history at different excitation levels in the arch direction and in the vertical direction are illustrated in Figures 7 and 8, respectively. In the upper area of the dam, the largest stress in the arch direction occurred at the position of PZT 5. The arch stress decreased from the position of PZT 5 to both contraction joints and then gradually increased from both contraction joints to the corresponding banks. At up to excitation level of 0.15g, the stress near the arch crown gradually increased. The decrease, instead of increase, in the stress near the arch crown at 0.20g excitation level indicated that the damage of the induced joints consumed energy at this level of loading. At the excitation level of 0.30–0.40g, the stress near the arch crown ceased to obviously increase, with the exception near the abutments. This implied that the contraction and induced joints had fully opened and the upper area of the dam in the arch direction had been completely damaged. On the crown cantilever of the dam, the vertical stress gradually increased at the excitation level of 0.10–0.15g, remained constant with a certain fluctuation around 0.20–0.25g excitation level, and then quickly reduced to 0.30g excitation level. The increase, instead of decrease, in the stress near the position of PZT 10 at 0.30g excitation level demonstrated that the destruction in the arch direction affected the stress distribution in the crown cantilever, and thus, the upper part of the crown cantilever would be destroyed.
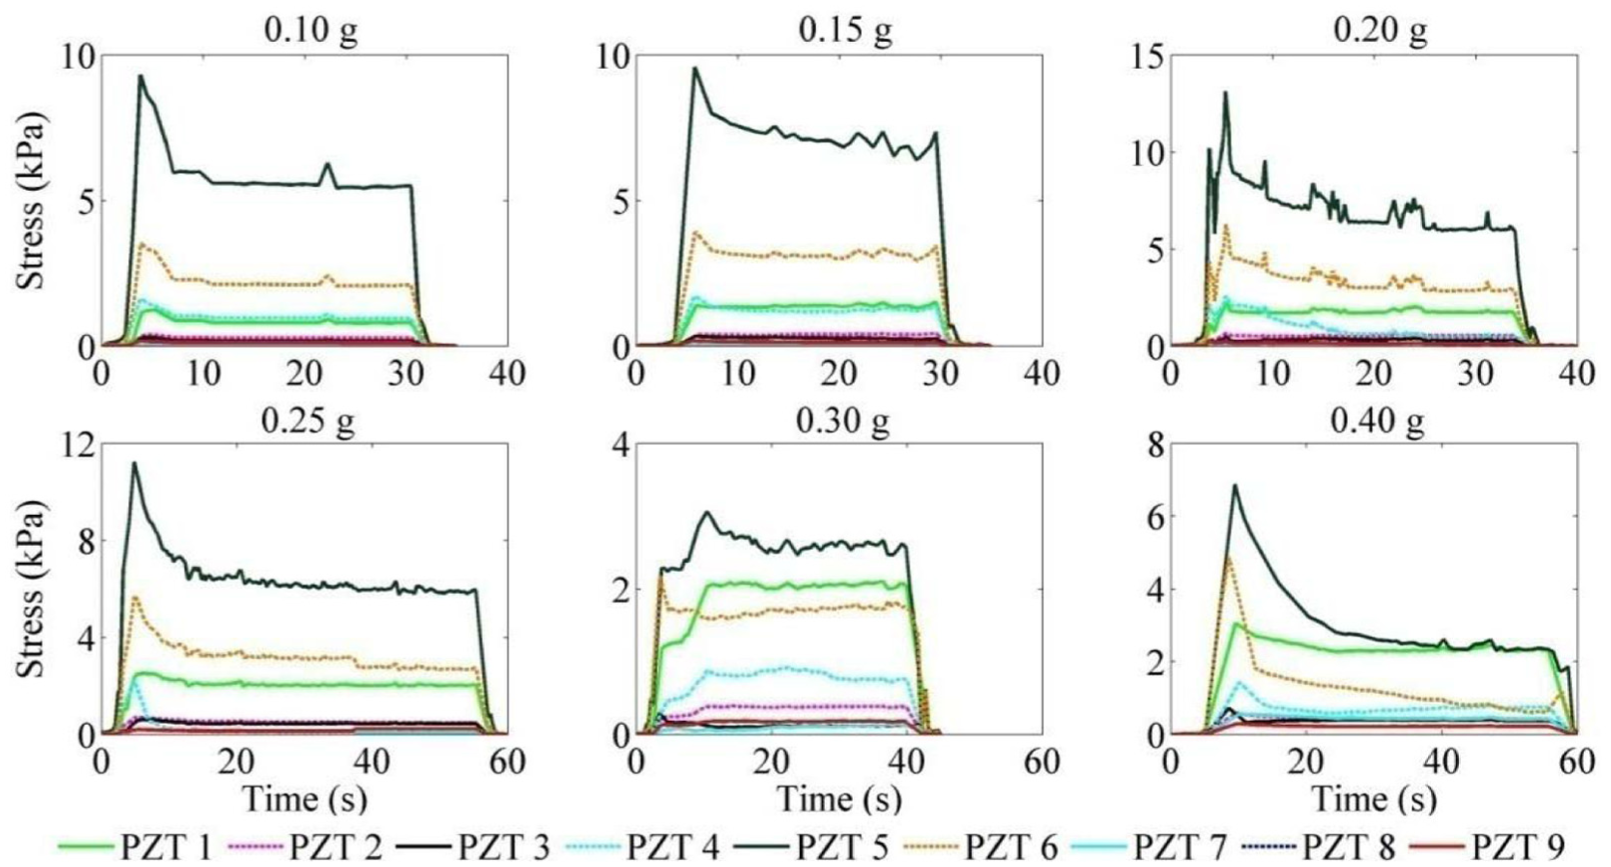
Stress history in the arch direction at different excitation levels.

Stress history in the vertical direction at different excitation levels.
The distributed PZT sensor network was also used to monitor the damage location and the damage state inside the dam at the interval between two excitation levels. The fast Fourier transform (FFT) spectrums of some monitoring paths are shown in Figure 9. Based on the changes in the frequencies and amplitudes of the signals, the following conclusions were drawn. There was no great damage on path A during the loading process, as shown in Figure 9(a). Minor damage occurred on path C before 0.30g excitation level, after which there was a serious damage, as shown in Figure 9(b). Path J was gradually destroyed at the different excitation levels, as shown in Figure 9(c).
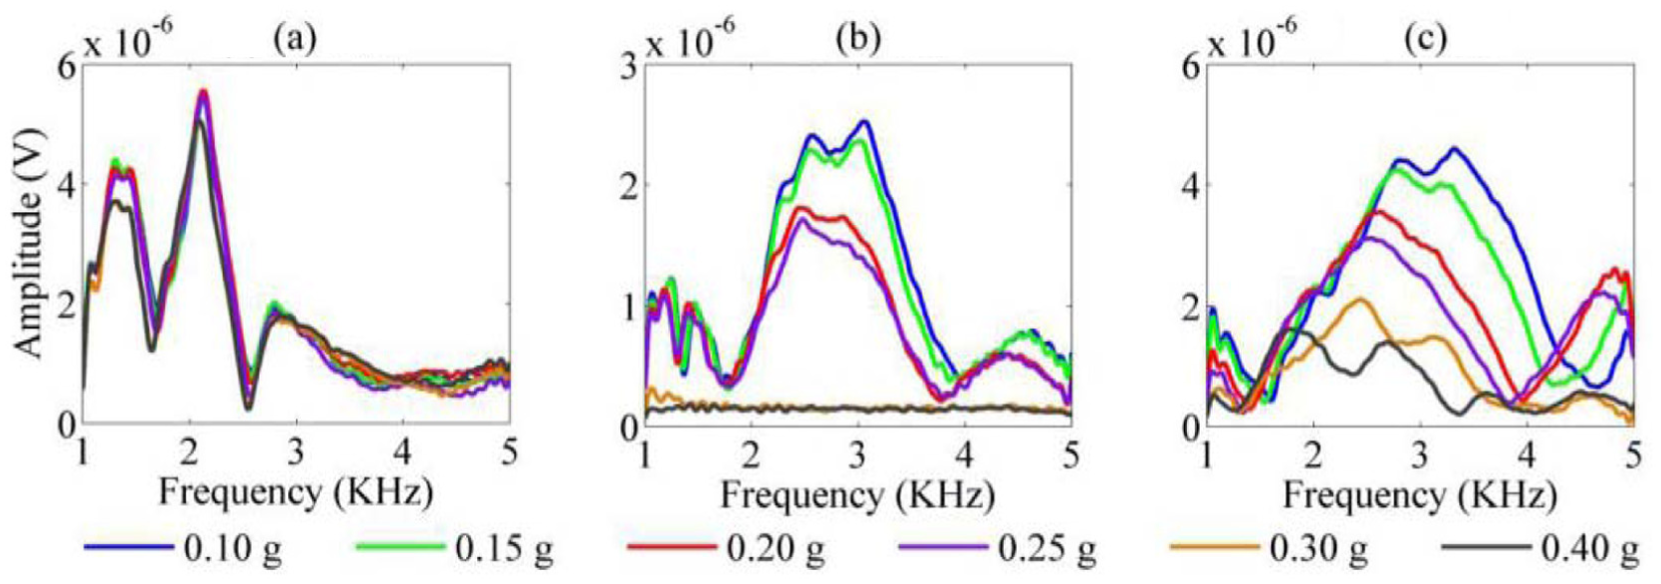
FFT spectrums in different monitoring paths: (a) path A, (b) path C, and (c) path J.
Figure 10 is the three-dimensional plot of the PHDIM of this validation test. In Figure 10, the damage index values of some monitoring paths did not reach 0.2 at 0.10g excitation level, with the exception of paths C and D. This means that the position near the arch crown was first damaged in the arch direction and collated with the values from the stress history monitoring. At 0.20g excitation level, the damage index values of paths H and J were more than 0.2 for the first time. This implies that the destruction in the cantilever direction took place after that in the arch direction. At 0.30g excitation level, most of the monitoring paths had been completely destroyed, with the exception of paths A and F. This result was consistent with the values from the stress history monitoring, suggesting that the contraction joints could effectively protect the abutment from damage.
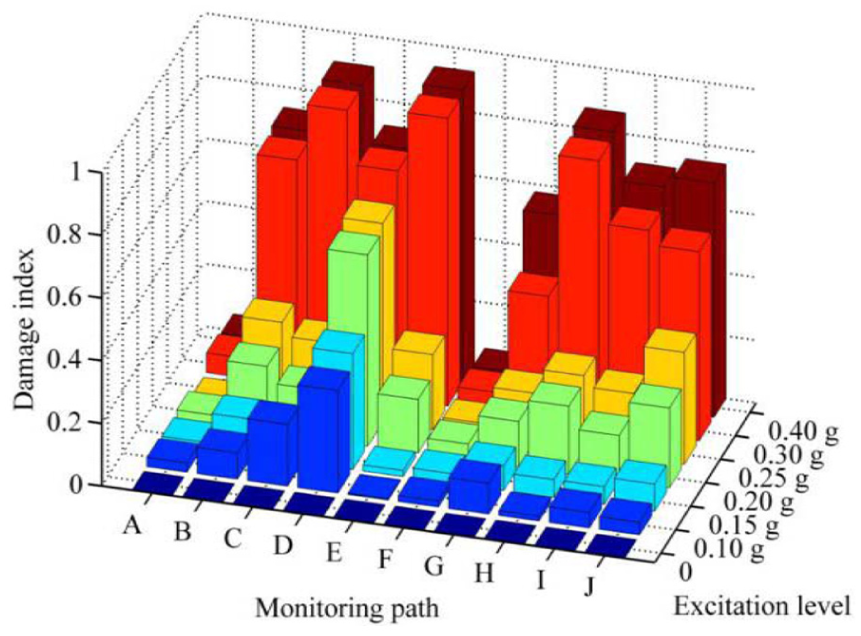
Path-history damage index matrix of the tested dam model.
According to the above experimental results, it can be concluded that the dam damage occurred first in the arch direction. The presence of contraction joints and induced joints weakened the stiffness of the dam section, and they were therefore the first areas to be damaged. The destruction in the cantilever direction took place after that in the arch direction.
Numerical analysis
In order to examine the damage process of the laboratory dam and to help the designers understand the failure mechanism of concrete dams, one numerical simulation using finite element software ABAQUS had been carried out. Discretizations of dam structure and its partial foundation were achieved by the use of 8-node solid elements, as shown in Figure 11. Structural joints were simulated by cohesive elements, and the mechanical behavior of the dam material was modeled using the concrete damage plasticity constitutive model. The material properties of the dam model were determined through the material property testing. The material density was 3150 kg/m3, the dynamic elastic modulus was 195 MPa, and the tensile strength was 38.6 kPa. Due to the spatial limitation, it was not possible to enumerate all the parameters here. The input motion of numerical simulation was similar to the shaking table test.

FEM model of the dam and foundation.
Figure 12 shows the final distributions of tensile damage at different excitation levels. The calculated results show that the earliest damage took place on the location of the structural joints. The damage of the contraction and induced joints released the stress near the abutments and the crown, respectively, thereby indicating the trend of dam damage. The damage in cantilever direction occurred on all monoliths between the structure joints, indicating that the monoliths became the weakness of a dam due to the destruction of structure joints. The numerical results about the damage process of the laboratory dam were in good agreement with the experimental results.
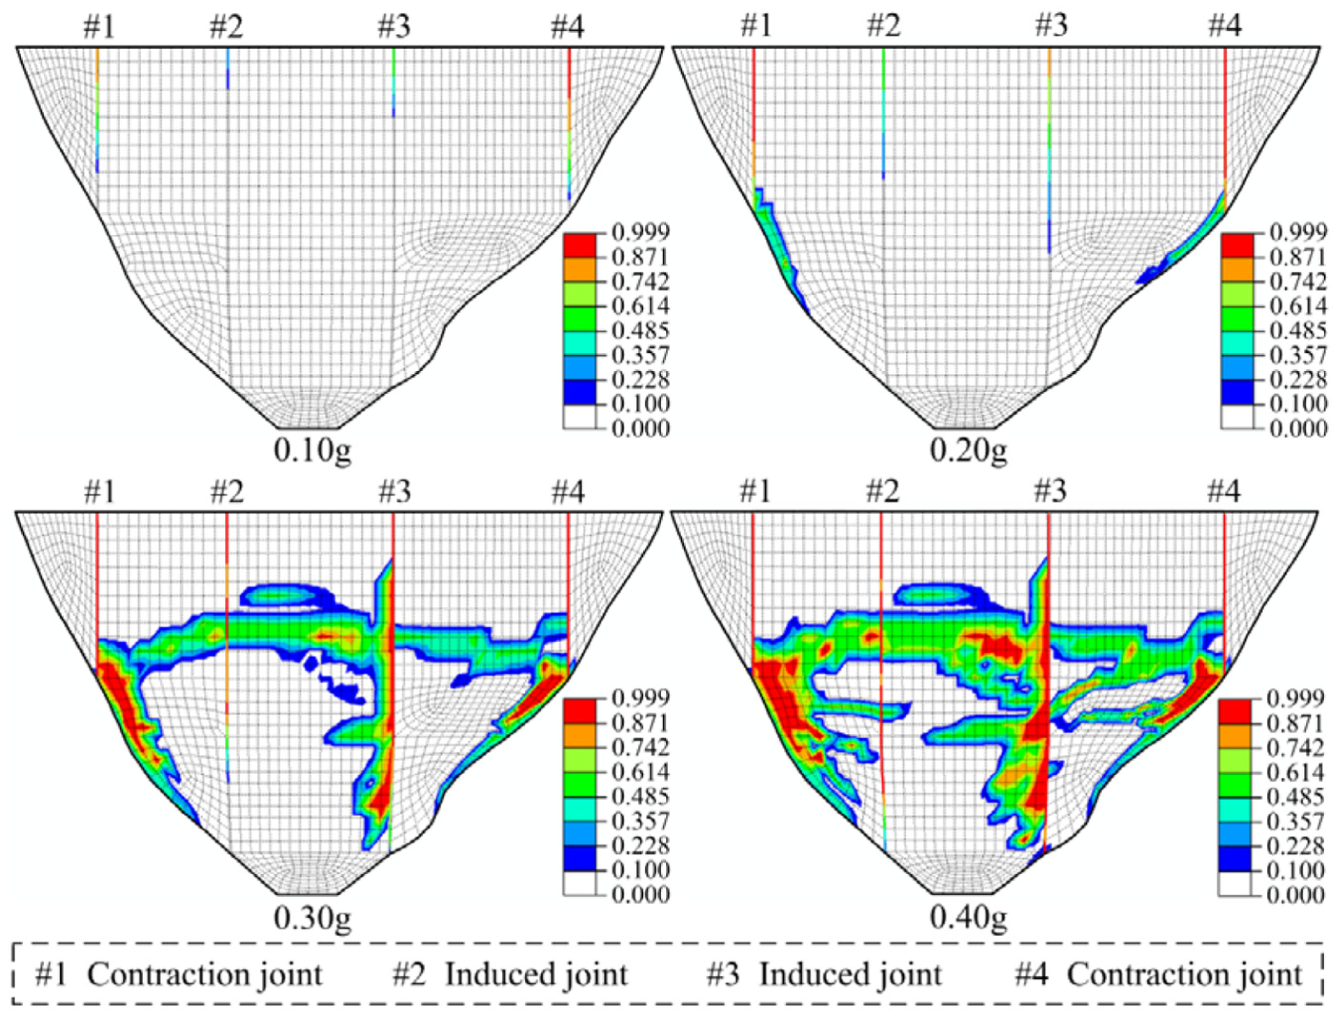
Tensile damage on upstream face at the end of different excitation levels.
Through experimental result and numerical analysis, one conclusion can be drawn that although the model test ignored the influence of scale effect and cannot meet all requirements of the similitude strictly, it still could reliably reflect and simulate the damage process of the prototype dam under a severe earthquake to some extent.
Conclusion
In this article, in an attempt to measure the dynamic stress history during earthquake and to detect the damage location and severity in a concrete dam after earthquake, a new seismic damage detection method was proposed. With the dual-function PZT sensor as the sensing element, the distributed PZT sensor network was embedded in a concrete dam. The experimental researches were carried out on the shaking table to verify the effectiveness of this method. In addition, one numerical study was developed to characterize the damage process of the laboratory dam and to correlate the numerical and experimental results.
The proposed seismic damage detection method has many advantages over the traditional one of using accelerometers, such as high signal-to-noise ratio, wide frequency response, good sensitivity of initial damage, and access to the stress history. The combination of the proposed method and the traditional methods can not only effectively detect the damage state but also obtain the stress history of a concrete dam.
Although this method has been used successfully in many concrete structures, it has not yet been applied to a real dam. It is anticipated that the well-designed laboratory will differ from real dams. The application of this method to a real dam is of practical interest. However, it is still a challenge to conclude whether the damage state and dynamic stress history of a real dam can be obtained by the proposed method. Moreover, monitoring frequency and voltage amplitude, arrangement of sensors, and sensitivity with respect to the presence of irregularities should be taken into account in practical application.
Footnotes
Declaration of Conflicting Interests
The author(s) declared no potential conflicts of interest with respect to the research, authorship, and/or publication of this article.
Funding
The author(s) disclosed receipt of the following financial support for the research, authorship, and/or publication of this article: This work was supported by the National Basic Research Program of China (973 Project) (Grant No. 2013CB035906) and the National Natural Science Foundation of China (Grant No. 91215301).