
Abstract
To decrease the cost of instrumentation for the strain and displacement monitoring method that uses sensors as well as considers the structural health monitoring challenges in sensor installation, it is necessary to develop a machine vision-based monitoring method. For this method, the most important step is the accurate extraction of the image feature. In this article, the edge detection operator based on multi-scale structure elements and the compound mathematical morphological operator is proposed to provide improved image feature extraction. The proposed method can not only achieve an improved filtering effect and anti-noise ability but can also detect the edge more accurately. Furthermore, the required image features (vertex of a square calibration board and centroid of a circular target) can be accurately extracted using the extracted image edge information. For validation, the monitoring tests for the structural local mean strain and in-plane displacement were designed accordingly. Through analysis of the error between the measured and calculated values of the structural strain and displacement, the feasibility and effectiveness of the proposed edge detection operator are verified.
Keywords
Introduction
Structural health monitoring (SHM), which has become a potential tool for quality assurance, is necessary for protecting the structural safety as well as people’s lives and property (Inam et al., 2014). The displacement and strain, as the macroscopic and microscopic embodiments of structural condition changes, are the most common measurands in SHM (Yi et al., 2012).
In the last several decades, traditional sensor technology has been widely applied in civil engineering structures (Galbreath et al., 2003; Ni et al., 2009; Teng et al., 2015; Wong et al., 2000). However, many limitations of traditional monitoring methods should be considered and resolved; for example, wired sensor–based methods often require many signal transmission lines, making the installation of such a SHM system time-consuming and expensive (Meyer et al., 2010). The method using accelerometers as an indirect measurement is not stable or accurate due to signal drift (Park et al., 2005). The wireless sensor–based methods are particularly susceptible to packet loss (Bao et al., 2014). The quality of the Global Positioning System (GPS) measurement is affected by various factors, such as satellite visibility and geometry, the quality of the signal sent, delays caused by GPS waves crossing the ionosphere and troposphere and the multipath effect (Yi et al., 2013). Sometimes, expensive equipment and professional operation also must be used.
For the above reasons, the direct, non-contact and low-cost monitoring method based on digital images has become an attractive alternative approach. Olaszek (1999) chose the black cross on a white background as the target. In his study, the cross edge is detected by differentiation of the grey level of the points; the coordinate of the cross axis is calculated using the arithmetic mean of the edge coordinates. Finally, the analysis of processed successive images provided information regarding the displacement of the examined point. Wahbeh et al. (2003) mounted targets consisting of black steel sheets 28 in high by 32 in wide, containing two high-resolution red lights to measure the displacement of the Vincent Thomas Bridge. In this case, the image feature of target was the centre of the high-intensity red spot, which was determined by sophisticated signal processing techniques, including optical data reduction and a nonlinear Gaussian regression curve fit. Lee et al. (2007) and Lee and Shinozuka (2006) developed a target object with four white spots of known geometry and a black background and then used digital image processing techniques to recognise the white spots on the target and locate the centres of the four white spots. The actual displacement was calculated using the target geometry and the number of pixels moved. Choi et al. (2011) introduced a target object that has five circles on the plate and determined the centre point of each circle by calculating the centre of gravity of the pixels from each of the circle images after searching for five circles with the boundary on the target that is in the region of interest. Qu et al. (2015) used the Canny operator to detect all of the edges of a rectangular piece of a copper specimen, and then, the straight edges of the specimen were recognised through a Hough transform. Finally, structural deformation was measured by comparing the locations of the straight edges. Zhang et al. (1999) used the big-window digital speckle correlation algorithm to measure the compression strain of polyurethane foam plastics. Hung and Voloshin (2003) presented a detection algorithm based on the speckled images and digital image correlation for measurement of the surface strains of planar objects. For validation, the specimen was coated with a white paint to obtain a white background. Black speckles were then deposited onto the white surface by randomly spraying the black paint on the background. To summarise the above-mentioned reports from the literature, structural displacement monitoring is based on the accurate extraction of the proper image feature, where the common image features are the edge and centre of circle pattern. Because the location of the centre of circle pattern is usually based on the edge detection, a good edge detection operator is thus important for extracting the required image feature. For strain monitoring, most researchers monitor the strain field using the digital image correlation method for the speckles’ pattern. While in the real engineering tests, spraying speckle on the specimen surface is usually not permitted. In other words, if there is no natural texture on the surface of the specimen, many of the strain monitoring methods mentioned above are not valid (Qu et al., 2015). In addition, the existing digital image–based displacement and strain monitoring always use different principles; as a result, the monitoring methods of strain and displacement cannot be transformed freely.
Based on the above review, the main purpose of this article is to propose an edge detection operator that can extract the image feature of target more accurately to implement the monitoring of structural displacement and mean strain. In the following sections, first, the calculation principles of structural in-plane displacement and the mean strain of a local region are illustrated. Second, the relevant digital image processing technologies for extracting the image features are introduced. Third, the edge detection operator based on mathematical morphology is designed. Finally, the effectiveness of the proposed edge detection operator is verified through the simulated test and the laboratory test.
Principles of structural displacement and strain monitoring
Design of the target object and the calibration board
The essential principle of the displacement and strain monitoring, which is based on digital image processing technology, is to use the image feature extracted from the target object to determine the structural displacement and strain. Therefore, the appropriate image feature is the basis and key of the monitoring method based on digital image processing technology. Because the circle is a non-directional pattern and many parameters can be selected as image features, such as centroid and diameter, the white circle with black background is selected as the target object, as shown in Figure 1.

Designed target object.
System calibration board is also necessary for converting the pixel-level measurements to actual measurements. In this article, a system calibration method based on the known calibration board is developed, where the calibration board has one black square with known size (10 cm × 10 cm) and white background, as shown in Figure 2.
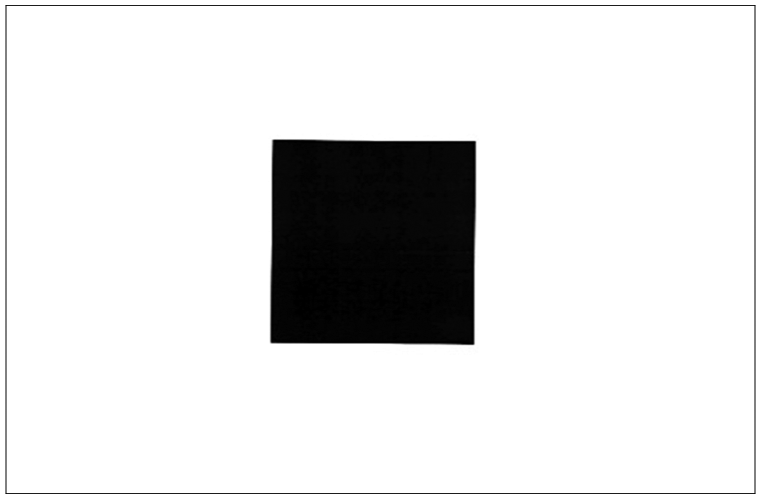
Square calibration board.
Monitoring principle of structural in-plane displacement
By obtaining the two-dimensional pixel coordinates of the centroid of a circular target, the relative pixel displacement of structural measuring point can be obtained by the two adjacent circular target images, and the absolute pixel displacements of structural measuring point can be obtained by the current image and the first frame. Furthermore, the real in-plane displacements of structural measuring point can be calculated by combining the relative or absolute pixel displacements with system resolution R.
The flowchart of structural in-plane displacement monitoring is shown in Figure 3. The main steps are as follows: (1) the square calibration board and circular target at the position of structural measuring point are set successively, based on the images obtained by a digital camera; (2) the image feature points, such as the centroid and vertices, are extracted using the relevant digital image processing technologies; (3) the system resolution R of the current monitoring system is determined through the visual monitoring system calibration and (4) the real displacement of the structural measuring point can be obtained by calculating the displacement of the image feature points.

Flowchart of structural in-plane displacement monitoring.
For the visual monitoring system calibration, the system resolution R is determined using the known square calibration board and its four vertices. The detailed processes are as follows: (1) the known calibration board is fixed (where each side is horizontal or vertical) and then more images of calibration board are obtained, (2) two-dimensional pixel coordinates of the square’s four vertices and the pixel length of each side of the square are calculated using the relevant digital image processing technologies and (3) the current system resolution Rx and Ry are calculated based on the calculated pixel length and the known real length.
Monitoring principle of the mean strain of structural interested region
Here, the image feature of target is the centroid of circle, and a series of targets are deployed at the interested region of the structure. The centroids of two adjacent circular targets can be identified, while the distance between two adjacent centroids can be obtained by the operation of the coordinates. Moreover, the distances that are obtained before and after the deformation are used to calculate the mean strain of the structural local region. The mathematical expression is shown in equation (1)

where
Relevant digital image processing technologies
In this article, five types of image processing technologies are used to extract the required image features: digital image preprocessing, binarisation, edge detection, further denoising and locations of the image feature points. The edge detection operator based on multi-scale structure elements and compound mathematical morphology operator is designed. The rest of the image processing technologies use the existed mature methods.
Digital image preprocessing
The two-dimensional median filter method is used to implement the digital image preprocessing, where the size of filtering template is 3 × 3. The mathematical expression of this method is shown in equation (2)
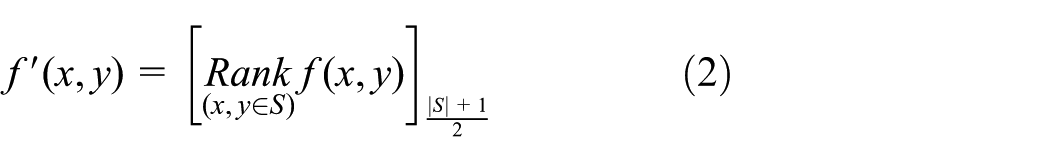
where f(x, y) is the pixel value of the original grey image, Rank f(x, y) indicates that the pixel values of pixel points located in the filter template are sorted according to the descending order, f′(x, y) is the pixel value of the grey image after preprocessing and (|S|+1)/2 is the sequence’s intermediate position. The effect of preprocessing is shown in Figure 4. Figure 4 reveals that the multiplicative noise in original grey image has been obviously reduced after the preprocessing.
Effect of digital image preprocessing: (a) before preprocessing and (b) after preprocessing.
Digital image binarisation
The binary image is obtained by threshold-based digital image segmentation, where the optimal threshold Ti+1 is determined by iterative method (Ridler and Calvard, 1978; Trussell, 1979). The mathematical expression of digital image binarisation is shown in equation (3)

where g(x, y) is the image matrix of binary image and 1 and 0 represent the white and black, respectively. The effect of binarisation is shown in Figure 5.

Effect drawing of binarisation of target image.
Edge detection operator
Edge detection is a process to extract the boundary line between the white circle and black background. In this article, the edge detection operator based on multi-scale structure elements and compound mathematical morphology operator is designed. A detailed description will be given in section ‘Edge detection based on multi-scale structural elements and the compound mathematical morphology operator’.
Digital image further denoising
Because the area composed by the edge of circular target is obviously larger than that of noise, the areas of different regions can be used to realise the digital image further denoising. The essential concept of this approach is that if the area of a certain region is not the largest value, then the white points in this region must be noise; thus, these white points can be eliminated using anti-colour processing. The effect of further denoising is shown in Figure 6. Figure 6 reveals that the residual white noise has been eliminated completely, and the image only contains the edge of circular target.
Effect of digital image further denoising.
Image feature extraction
For the system calibration, the selected image feature of calibration board is the vertex; for the structural in-plane displacement and mean strain, the selected image feature of circular target is the centroid.
Vertex of the square calibration board
The processed image of calibration board has the square’s white edge lines and black background. The coordinates of vertices can be determined according to the characteristic of the vertex because these four vertices of the square are the first white point at processed image’s top left corner, top right corner, bottom left corner and bottom right corner.
Centroid of the circular target
The image of circular target only contains the edge of circle after going through the edge detection and further denoising; thus, the coordinate of each edge point can be extracted and denoted as (xi, yi). Based on these coordinates of the edge points, the fast non-iterative fitting centroid method (Pratt, 1987) is adopted to fit the centroid; this method is a least square method that chooses the general equation of circle as the objective function F(A, B, C) given by equation (4)

where A, B and C are undetermined coefficients and δ is the error.
According to the principle of the least square method, the coefficients A, B and C can be solved when the partial derivatives of the objective function are equal to zero. Thus, the fitting result of the centroid is given by equation (5)
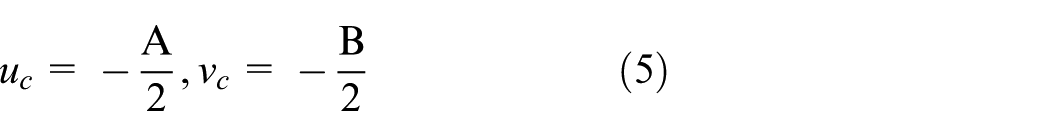
where uc is the abscissa of the centroid and vc is the ordinate of the centroid.
Edge detection based on multi-scale structural elements and the compound mathematical morphology operator
Edge detection is an important technique in the field of image processing. Over many years of research, many classical edge detection operators have been proposed, such as the Canny operator, the Prewitt operator, the Roberts operator, the Laplacian-of-Gaussian (LoG) operator and the Sobel operator. However, some disadvantages of these edge detection techniques still cannot be ignored. For example, the Sobel and Prewitt operators are sensitive to noise, and their detection accuracy is not high. The LoG operator has poor detection result at the corners, curves and where the grey level intensity function varies; in addition, because of the use of the Laplace filter, this operator was not able to find the edge direction. The Canny operator has the disadvantages such as complex computations, false zero crossings and time-consuming (Maini and Aggarwal, 2009).
For most of the traditional edge detection operators, the poor detection effect is often caused by the use of linear methods to approximately depict the nonlinear characteristics of the image. In contrast, mathematical morphology is a good nonlinear image processing method. Compared with the above methods, mathematical morphology not only can restrain noise and extract edge accurately but also can satisfy the real-time requirement.
Based on the basic mathematical morphology operators, many kinds of edge detection operators have been proposed (Deng et al., 2014; Mukhopadhyay and Chanda, 2002; Xiong and Huang, 2009). In this article, through analysing the characteristics of the existing edge detection operators based on the mathematical morphology and considering the influence of various structure element sizes on the result of edge detection, the compound mathematical morphological operator with multi-scale structural elements is designed for image edge detection. The mathematical expression of this operator is
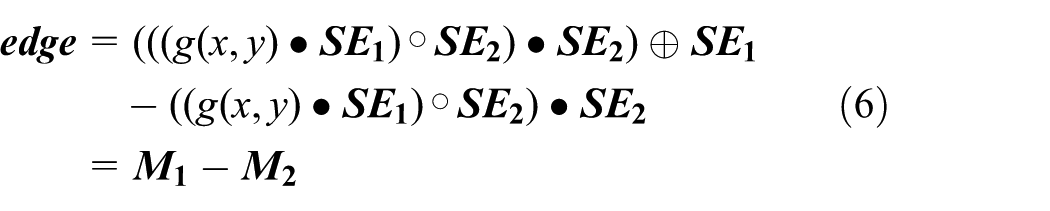
where
respectively.
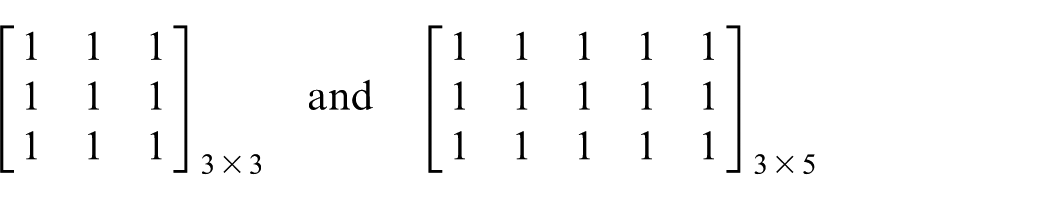
In this designed operator, the mathematical morphology closing operation for g(x, y) is first performed using the small structural element
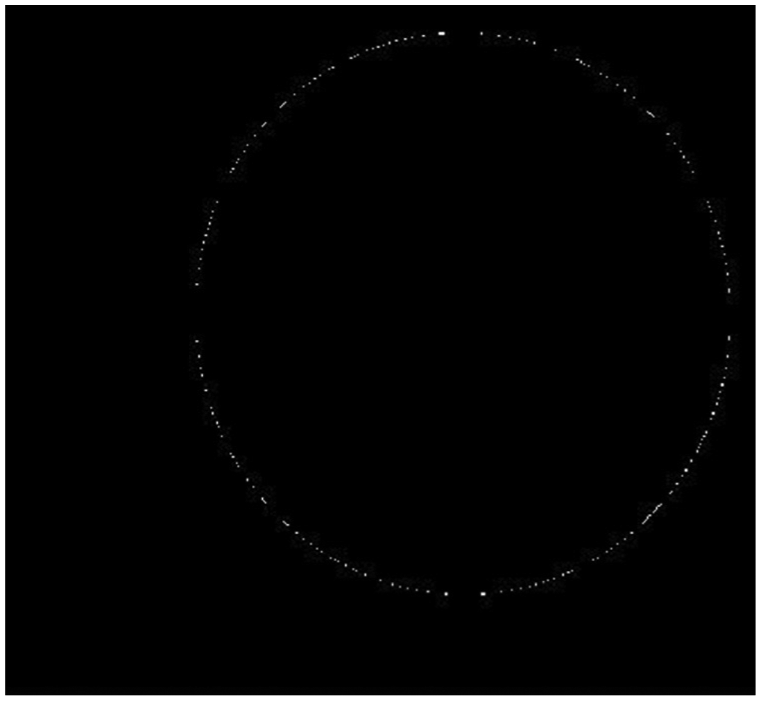
The result of edge detection is shown in Figure 7, where the white circle is the edge of circular target, and the remaining white points are the residual random noise, which can be eliminated using the method proposed in section ‘Digital image further denoising’.
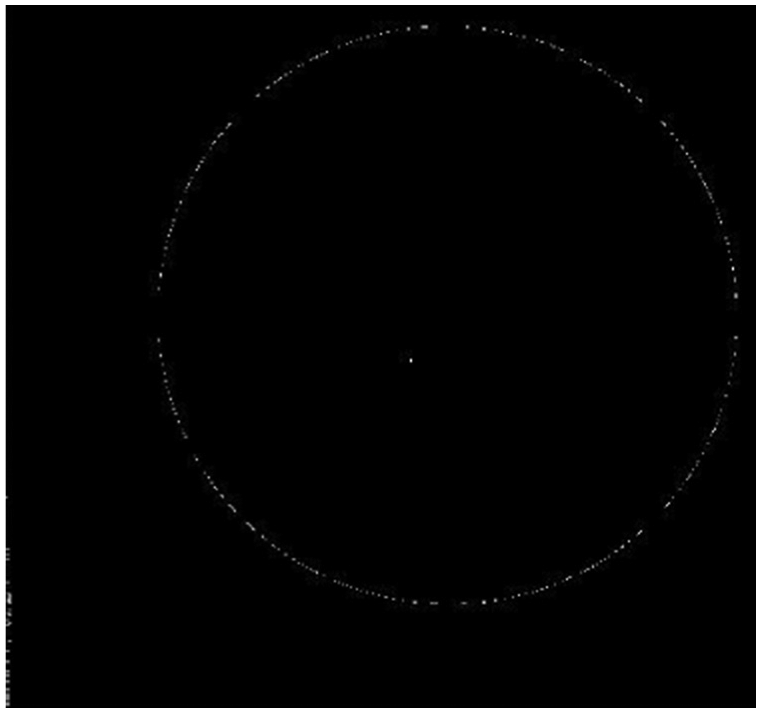
Result of the edge detection process.
Verification tests
In this article, two monitoring tests are designed to validate the proposed edge detection operator in theory and practice: a simulated test for mean strain of structural interested region and a laboratory test for structural in-plane displacement. The images captured by the non-contact visual monitoring system are processed off-line using the above digital image processing technologies. Next, the calculated value of the mean strain in interested region and the structural dynamic displacement can be obtained. If the error between the calculated value and the selected comparison value is smaller, the proposed edge detection operator, which is based on multi-scale structure elements and compound mathematical morphology operator, indeed can locate the edge of target accurately and effectively and contribute to the accurate extraction of the required image features.
Simulated test for mean strain of structural interested region
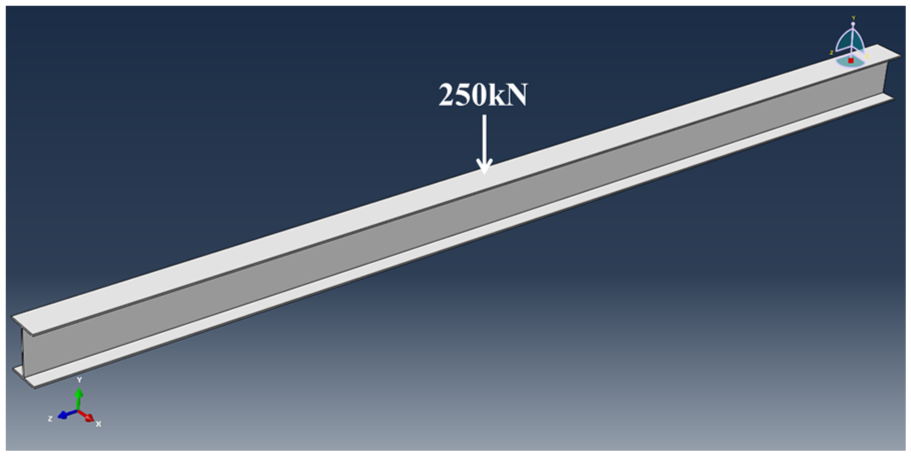
The finite element software ABAQUS is used to implement the simulated test. The test object is an I-shaped beam with fixed ends, and the length is 6 m. A 250 kN concentrated load is imposed on the mid-span of beam, as shown in Figure 8. The detailed sizes of I-shaped beam are shown in Figure 9. The position of strain monitoring locates at the edge of bottom flange of the I-shaped beam, and the range of interested region is approximately 1 m.
Finite element model of the I-shaped beam.
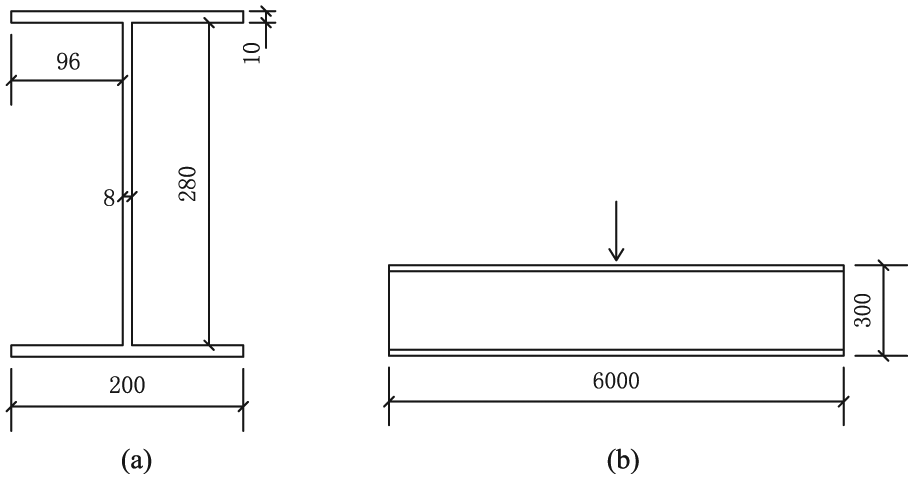
Details of the size of the I-shaped beam: (a) details of the size of the facade and (b) details of the size of the lateral side.
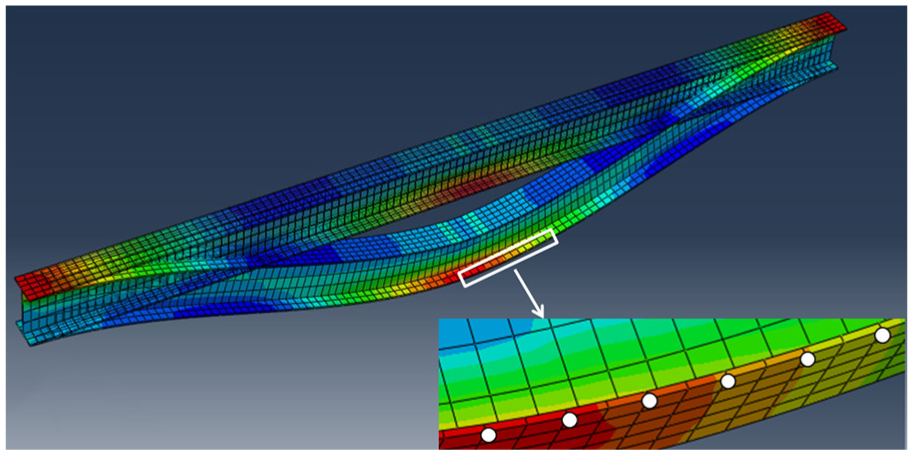
Using the ABAQUS software, the I-shaped beam can be meshed; the mesh size is 50 mm. Based on the calculated results using finite element software of deformation of the beam under the concentrated load, the coordinates of all mesh points before and after the deformation can be outputted directly.
In this simulated test, the mesh point that locates at the edge of bottom flange of mid-span section is selected as the centre point. Next, 10 mesh points around this centre point are extracted; thus, 11 mesh points are also selected as the mean strain measuring points. The distance between two adjacent measuring points is 100 mm. The locations of several measuring points are shown in Figure 10. The simulated images of targets’ positions can be drawn using the known coordinates and AutoCAD, as shown in Figure 11.
Locations of several measuring points.

Simulated images of the targets’ positions: (a) the position of the targets (before the deformation), (b) the position of the targets (after the deformation) and (c) the positions of the targets (before and after the deformation).
For Figure 11(a) and (b), the centroid of each circular target is extracted using the proposed edge detection operator, and then, the mean strains of this interested region are calculated using equation (1); the calculated mean strains are denoted as
Calculation results of the mean strain.

Laboratory test for structural in-plane displacement
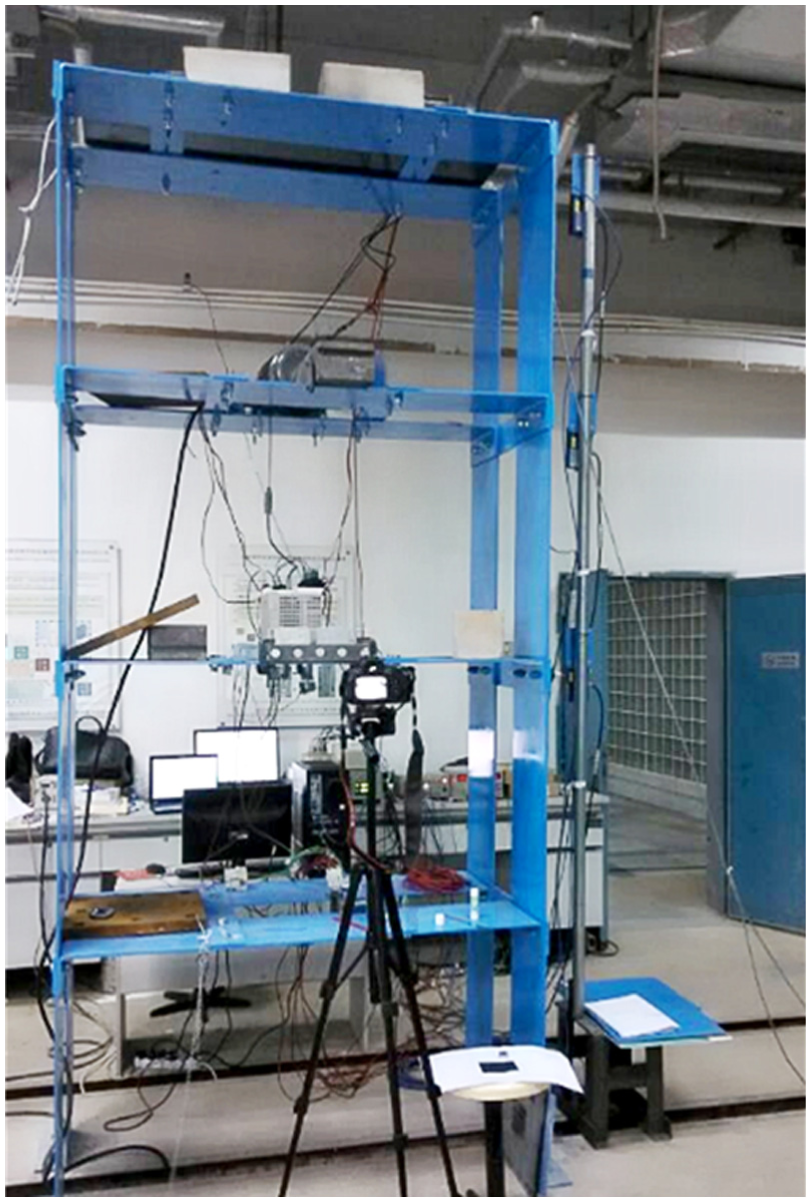
As shown in Figure 12, the contrast test system consists of three parts: the test structure, the loading system and the displacement monitoring systems. The specific information of the system is shown in Table 2.
Test system of structural in-plane displacement monitoring.
Specific information of contrast test system.
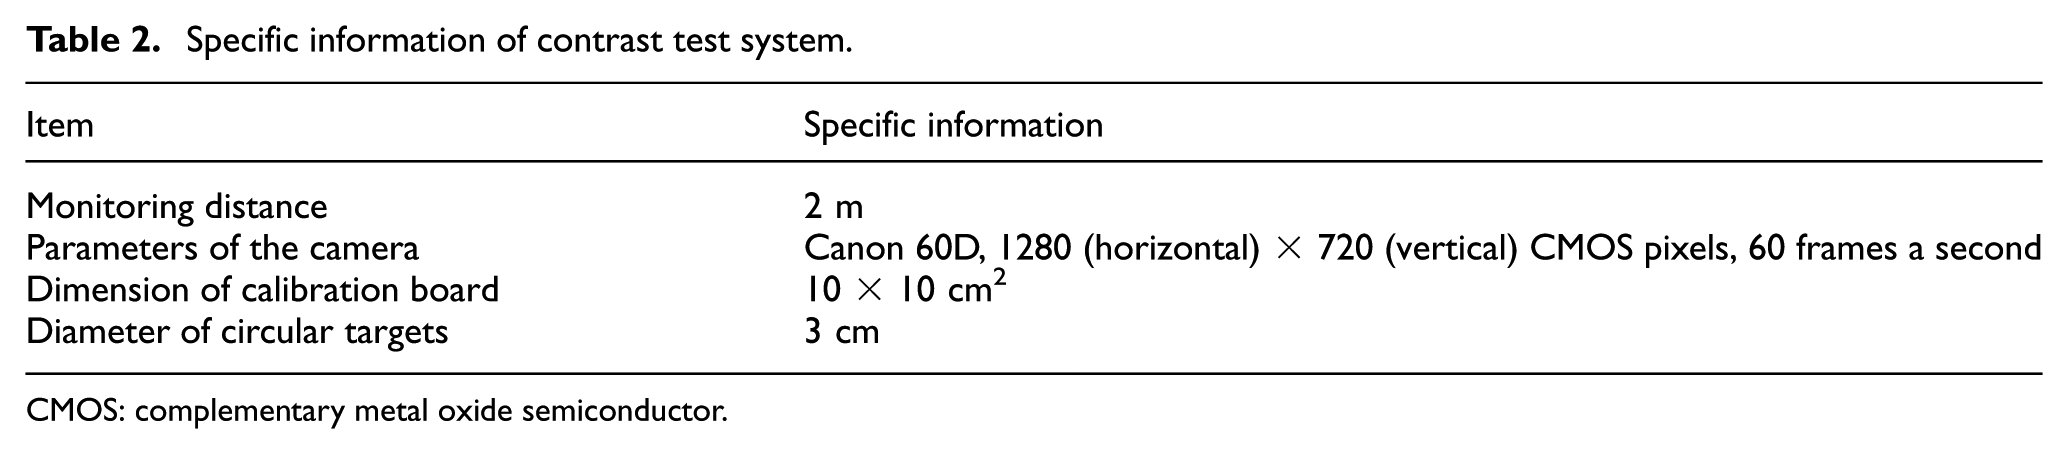
CMOS: complementary metal oxide semiconductor.
Test structure
The test structure, which consists of the Q235 steel plate, is a four-story frame. The span is 1.4 m and the height of layer is 0.8 m, the size of frame beam is 1.4 m × 0.8 m × 0.008 m (length × width × thickness) and the size of frame column is 3.2 m × 0.3 m × 0.008 m (length × width × thickness). Considering the steel plate is lightweight and has high flexibility and low stiffness, the test structure may produce large vibration or become damaged under load. Therefore, at each layer of the framework, some weights have been placed. In addition, two steel cables are installed at the sides of the structure to ensure that the displacement of the structure is not excessively large.
Loading system
The loading system is mainly composed of a reducer and some eccentric counterweights, where the speed of reducer is controlled by a frequency converter. As a result, the output of the reducer’s speed will be different when the input of frequency of the frequency converter is different. The images of the loading system are shown in Figure 13.
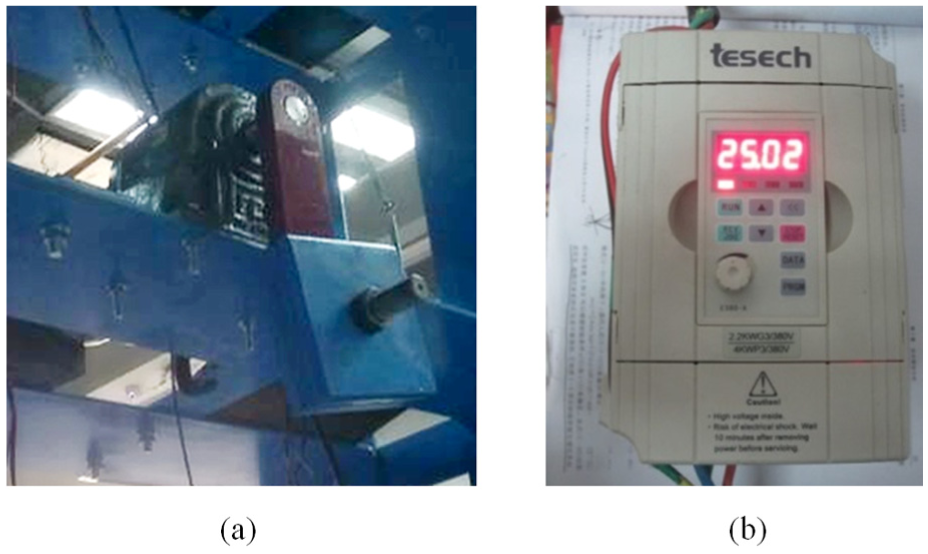
Loading system: (a) reducer and (b) frequency converter.
Because the input frequency of the frequency converter is a constant, the test structure just performs a simple harmonic vibration, and the displacement time history of this structure is a Sine or Cosine curve.
Displacement monitoring systems
In this contrast test, two sets of displacement monitoring systems are involved: a non-contact visual displacement monitoring system and a laser sensor–based displacement monitoring system. The non-contact visual displacement monitoring system mainly includes a Canon 60D digital camera, target object and a laptop computer, where the Canon 60D digital camera is used as the image acquisition device. The target object is fixed on the structure by a strong magnet or glue. The target object and the digital camera are at the same height level. The parallel state between the target surface and the camera image plane should be ensured.
Parameter selection of the contrast test
The parameters of contrast test are considered from the following aspects: contrast object, comparison and calculated value of displacement and sampling frequency. In particular, the contrast object is the time–displacement curve of the second floor of test structure, which is obtained by vision monitoring system and laser sensor–based monitoring system. According to the tests in the extant literature (Lee et al., 2007; Lee and Shinozuka 2006; Ye et al., 2013), the displacement measured by laser sensor can be set as the comparison value. The displacement measured by vision monitoring system is used as the calculated value. The sampling frequency is 25 Hz. The specific design of each parameter is shown in Table 3.
Specific design of contrast tests.
Analysis of the results
First, the square calibration board is deployed at the structural measuring point, and a digital camera is placed in front of the test structure to obtain the images of calibration board. For this group of images, the proposed edge detection operator is used to extract the vertices of the calibration board, to realise the calculation of system resolution Rx. The result of Rx is 0.1055 mm/pixel. Subsequently, the target object is deployed at the structural measuring point. With the rotation of the reducer, the test structure begins to perform the simple harmonic vibration. Simultaneously, the images of the target object are captured continuously. The results of the structural in-plane displacement are obtained using the above-described digital image processing technologies, as shown in Figures 14 to 16. The absolute error is equal to the displacement from the digital image minus the displacement from the laser sensor. The relative error is equal to the absolute value of the absolute error divided by the displacement from laser sensor.
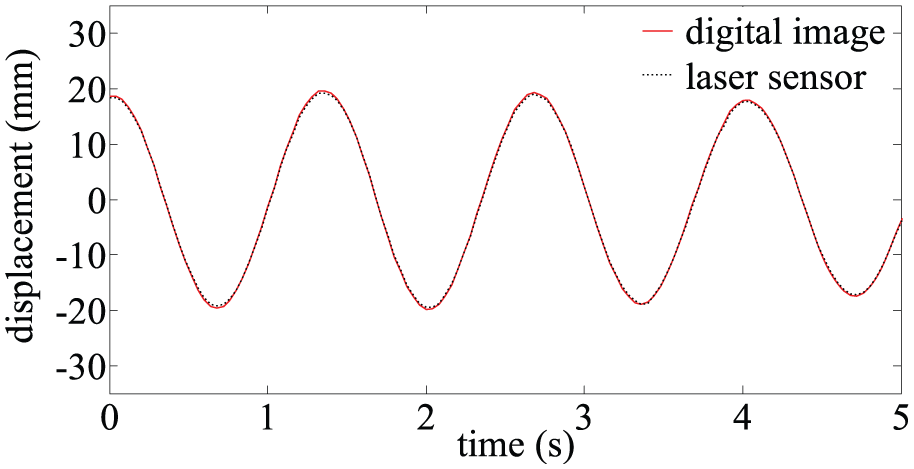
Contrast diagram of the structural in-plane displacement.
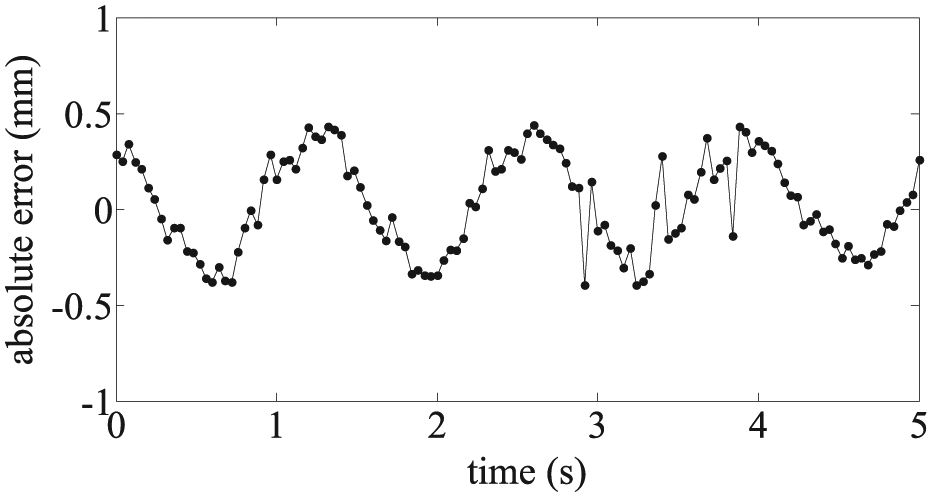
Absolute error of the structural in-plane displacement.
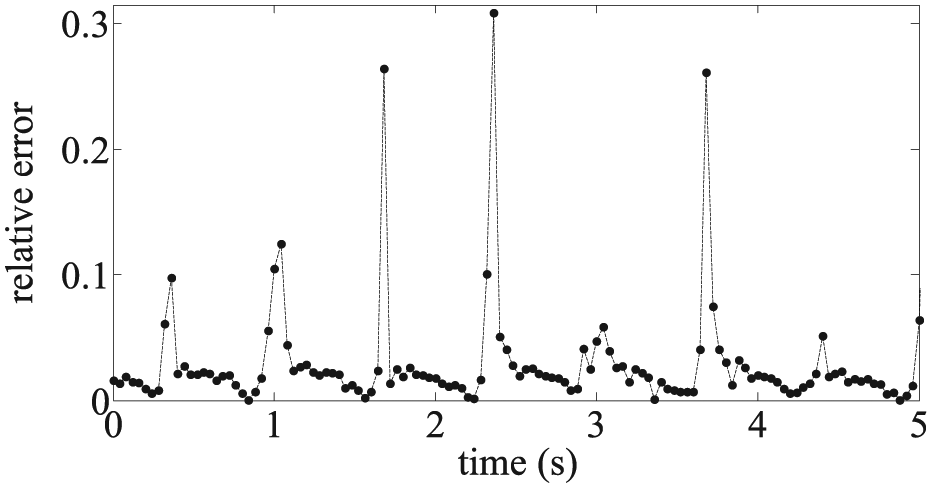
Relative error of the structural in-plane displacement.
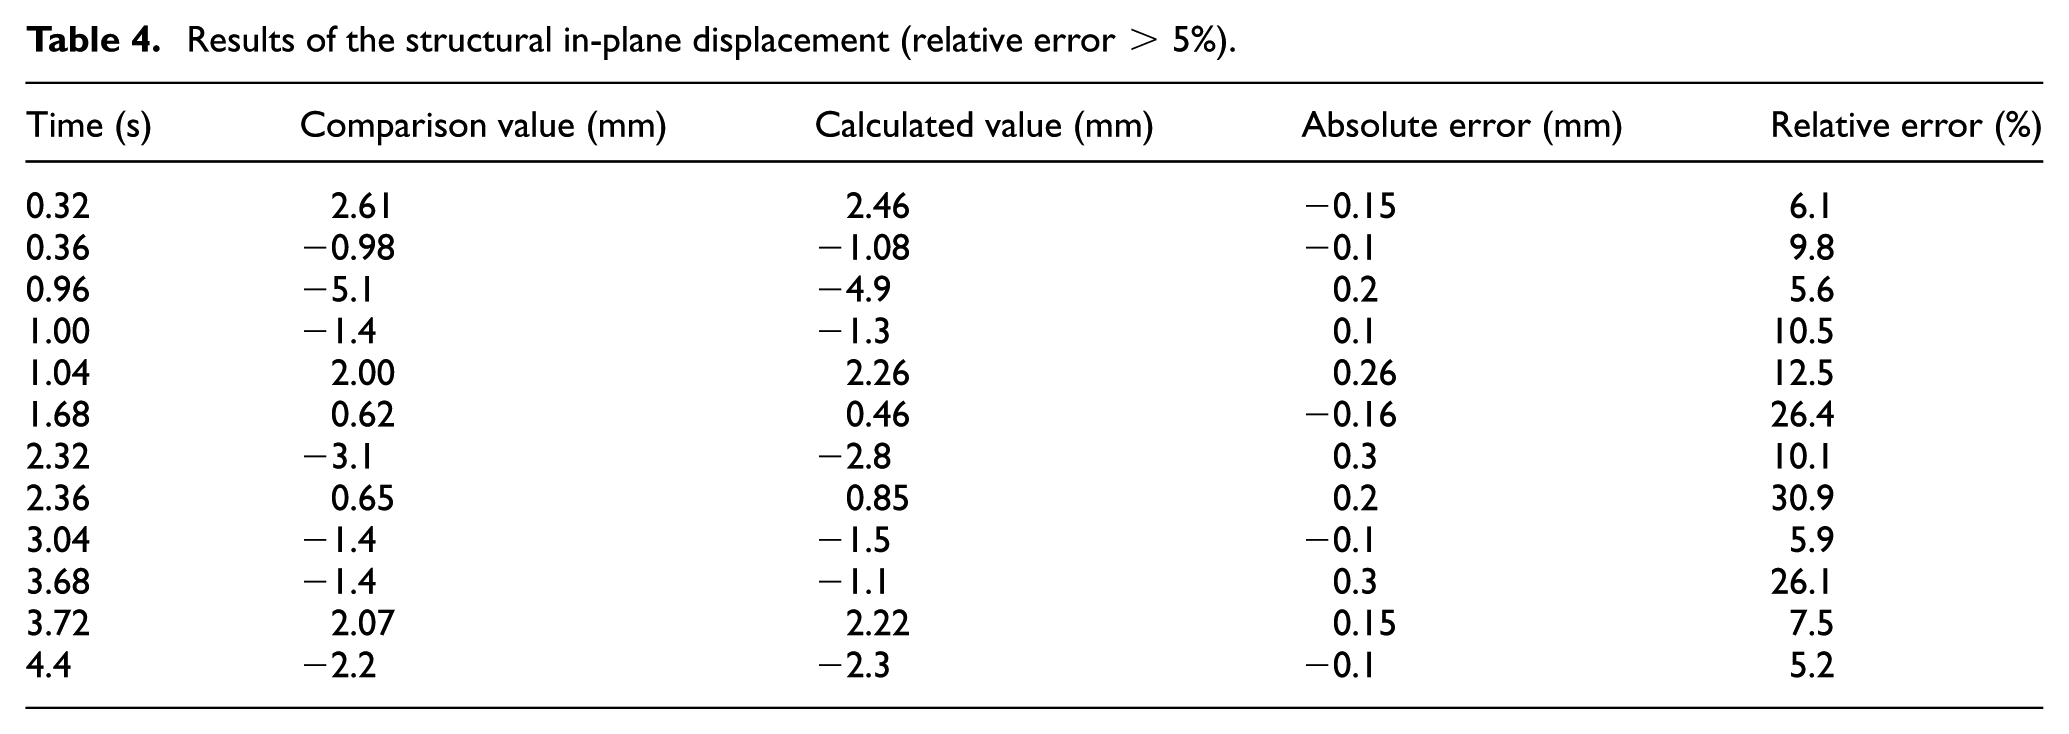
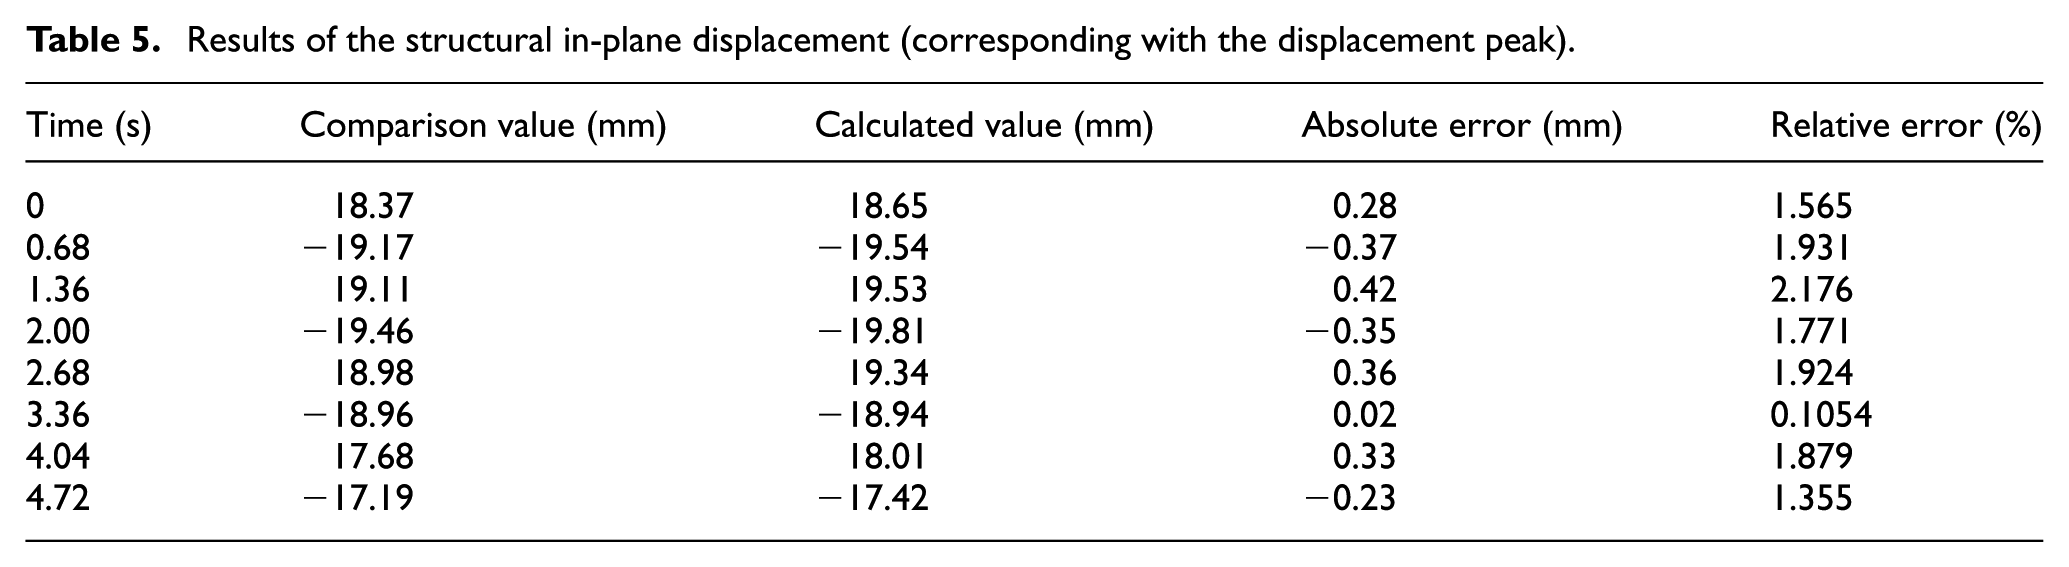
Figure 15 indicates that the maximum absolute error is 0.4401 mm. When the relative error is larger than 5%, the corresponding comparison value and calculated value of structural in-plane displacement are extracted, as shown in Table 4. It can be seen from Table 4 that the larger relative errors will be caused when the test structure has too small displacement. Thus, the proposed edge detection operator is not suitable for smaller displacement monitoring, especially when the displacement is close to zero. In addition, when the structure reaches the displacement peak, the corresponding errors are extracted, as shown in Table 5, where the maximum relative error is 2.176%. This result indicates that the proposed edge detection operator is feasible and reliable for extracting image feature when the structure has a large displacement.
Results of the structural in-plane displacement (relative error > 5%).
Results of the structural in-plane displacement (corresponding with the displacement peak).
Conclusion
In this article, the edge detection operator based on multi-structural elements and the compound mathematical morphological operator was proposed. The main conclusions of this study are as follows:
The proposed edge detection operator, which uses the multi-scale structural elements and compound mathematical morphology, not only can eliminate a variety of noise effectively and obtain better filtering effect and anti-noise ability but also can preserve the details of the image and extract more accurate edges.
The simulated test for the mean strain of the structural region of interest was designed. The maximum relative error was found to be 2.9%, by which the proposed edge detection operator is verified in theory, while the practical application ability requires further verification.
The laboratory test for structural in-plane displacement was designed. The analysis results indicated that the proposed edge detection operator is not suitable for monitoring smaller displacement, especially when the displacement is close to zero. However, the proposed edge detection operator was found to be feasible and reliable for extracting image feature when structure has a larger displacement.
Footnotes
Declaration of Conflicting Interests
The author(s) declared no potential conflicts of interest with respect to the research, authorship and/or publication of this article.
Funding
The author(s) disclosed receipt of the following financial support for the research, authorship and/or publication of this article: This research is supported by the National Science Foundation of China (Grant No. 51308162), the Shenzhen Knowledge Innovation Program – Fundamental Research (JCYJ20140417172417117), the Natural Scientific Research Innovation Foundation in the Harbin Institute of Technology (HIT.NSRIF.2015085) and the Supporting Project for Junior Faculties of the Harbin Institute of Technology Shenzhen Graduate School. The authors would also like to thank the technician and students who supported the experiments during the early stage.