



Abstract
This study investigates the fundamental characteristics of the longitudinal wind power spectra at the gorge terrain. First, a simplified V-shaped gorge terrain model, representing usual deep-cutting gorge terrains where long-span bridges usually straddle, was introduced for the wind tunnel test. The longitudinal wind power spectra at the gorge center were analyzed in detail and compared with those of the simulated oncoming wind. Then, a practical calculation method was proposed to directly calculate the power spectra values at the gorge terrain based on the oncoming wind field and minimum wind parameters at the gorge center. Finally, an infield V-shaped deep-cutting gorge terrain model was also introduced for the wind tunnel test, and the obtained wind power spectra further validated the proposed calculation method. The results show that for both gorge terrain models, the power spectra values in the low-frequency range become closer to those of the oncoming wind with the measurement positions moving away from the ground, while good agreements are always found in the high-frequency range for all of the specified measurement positions. The proposed calculation method can calculate the power spectra values at these two gorge terrains with relatively high accuracy. It is hoped that this study can more conveniently provide informative guidelines for determining the wind power spectra values for similar gorge terrains in engineering practices than traditional wind tunnel tests or computational fluid dynamics numerical simulations.
Keywords
Introduction
The fluctuating wind in the atmospheric boundary layer can be regarded as a random process that is always discussed and studied by statistical methods. To study the statistical characteristics of the eddies in the turbulent flow, a parameter named the wind power spectrum is usually used, which is a very important parameter in the structural wind engineering. For instance, when analyzing the buffeting response of a long-span bridge, the wind power spectrum at the bridge site should be first determined (Hui et al., 2009). Generally speaking, the expressions of the wind power spectra can be obtained by theoretical derivations with certain reasonable assumptions (Von Kármán, 1948), and it can also be obtained based on the field measurements (Davenport, 1961; Kaimal et al., 1972; Panofsky and McCormick, 1960). To better serve the engineering practices, Simiu and Scanlan (1996) proposed improved expressions for the wind power spectra which were consistent with the developments and more suitable for engineering applications. In addition, these improved expressions took into account the variation of the spectra values with height. However, it should be pointed out that the previous studies on the wind power spectra mainly focus on the flat terrains rather than the complex terrains, such as the valleys or gorge terrains. As more civil structures would be built in these valleys or gorge terrains (Hu et al., 2015), especially in the west regions of China due to the well-known strategy of developing the western region, the characteristics of wind power spectra over the gorge or valley terrains have become very important to the structures located in these terrains.
In order to study the characteristics of the wind power spectra over valleys or gorge terrains, Magnago et al. (2009) analyzed the wind velocity spectra observed at the bottom of a valley and found that the wind power spectra are appreciably different from those observed over the homogeneous terrain. More specifically, the characteristics of the spectra at the bottom of the valley depend not only on the mean wind speed but also on the wind direction with respect to the valley axis. In recent years, more long-span bridges have been built in deep-cutting gorges, especially in the west regions of China (Li et al., 2011). Actually, the deep-cutting V-shaped gorges are one typical terrain feature for the long-span bridges built in the mountain-gorge terrains (Hu et al., 2015). Therefore, it is necessary and important to study the wind power spectra over these deep-cutting gorges. Li et al. (2010) investigated the wind characteristics over four simplified valley terrains that are V-shaped in the simulated atmospheric boundary layer model. Their study was to gain some fundamental understanding of the wind power spectra characteristics over the real mountainous valley terrain and its further applications to determine the wind parameters for the long-span bridges straddling the V-shaped valley. The results showed that there is a slight decrease in the spectrum peak wave number at the center of valley as compared with that of the oncoming wind. Furthermore, the decrements are larger when the measurement positions are closer to the hill surface, but the spectra peaks gradually collapse to the values of the oncoming wind as the heights of the measurement positions increase. Generally, the study by Li et al. (2010) mainly focused on the simplified valley terrain, but there was no information given about the wind power spectra over the infield valley or the gorge terrains, and the results were not quantitative. Therefore, their study on the wind power spectra may not be convenient to use directly in engineering practices. Zhu et al. (2011) analyzed the wind power spectra of a bridge site based on a large number of measured data at an infield deep-cutting gorge with a V-shaped cross section. The results showed that compared to the spectrum model proposed by Kaimal et al. (1972), the wind power spectrum at the deep-cutting gorge is smaller in the low-frequency range and larger in the high-frequency range. However, it should be noted that the deep-cutting gorge terrain presented in Zhu et al. (2011) is just one specific gorge terrain, and it may not represent all scenarios. Since each deep-cutting gorge is not completely identical in shape, and differences among the characteristics of the wind power spectra over the gorges would be expected. Therefore, a representative gorge terrain needs to be considered in order to obtain more fundamental information of the characteristics of the wind power spectra over these deep-cutting gorges.
From the view of engineering practices, the wind power spectra are usually obtained by the methods of field measurement and wind tunnel test as discussed earlier. However, the field measurement method is usually very expensive to carry out and easily affected by the environmental conditions (Hui et al., 2009). As for the wind tunnel test method, the scale ratio of the model should not be too small (Bowen, 2003), and the wind speeds in the tests are always influenced by the supports of the model. In general, the costs of the labor, materials, time, and power in the wind tunnel tests are also very high. With the development of numerical solution methods and computer hardware, the application of the computational fluid dynamics (CFD) numerical simulation method in wind engineering has become an important subject to study. Theoretically, the CFD method can almost obtain all of the wind parameters. More importantly, the costs of the CFD method are generally much smaller than those of the field measurement and wind tunnel test methods. For these reasons, the CFD method has been more and more widely used in the numerical simulation of wind fields over the terrains (Cao et al., 2012; Hu et al., 2013; Liu et al., 2016). It should be noted that the present numerical simulations on the wind fields over the terrains are generally aimed at the mean wind speed and the turbulence intensity, and the corresponding numerical results have relatively very high accuracy. Hu et al. (2013, 2016) investigated the values of the mean wind speed and the turbulence intensity over a two-dimensional trapezoidal hill and some simplified gorge terrains by the shear-stress transport (SST) k − ω turbulence model. In these numerical simulations, the flow was supposed to be incompressible and steady, the pressure–velocity coupling method was SIMPLEC (SIMPLE-Corrected) algorithm, and the second-order scheme was adopted to solve the discretized equations. These numerical results showed that the mean wind speed and the turbulence intensity all agree well with those of the corresponding wind tunnel tests. Cao et al. (2012) studied the turbulent flow over two two-dimensional hills with/without surface roughness by the large eddy simulation (LES) method and compared the numerical results with those obtained from the wind tunnel test. The results showed that the numerical results of mean wind speed and the turbulence intensity over the hills are all in very good agreement with those obtained from the wind tunnel test. However, it should be pointed out that the previous studies on the wind power spectra values by the CFD method are very limited. The main reason is that the accuracy of the CFD method is generally not as high as the wind tunnel test, especially for the turbulence wind characteristics, such as the wind power spectrum and the coherence function. When improving the accuracy of the CFD results, such as the characteristics of wind power spectra, a tremendous amount of grid number is needed, and then the costs of the numerical simulation will significantly increase. Recently, a representative study on the wind power spectra over complex terrains by the CFD method was conducted by Liu et al. (2016). In their study, the wind power spectra in the wake of the 3D hill and 2D ridge and those over the flat terrain were investigated using the LES method. To improve the accuracy of these spectra values, the total grid number in the computational domain was as many as 27.4 million. From their numerical results, the low-frequency range of the power spectra values in the wake of the 3D hill and 2D ridge and those over the flat terrain agree well with those of the wind tunnel test results. However, the high-frequency range of the power spectra values are much smaller than those of the test results because the high-frequency range of the power spectra decay due to the relatively large grid size. From the information above, we can see that directly simulating the wind power spectra with high accuracy is still a very difficult task using the routine CFD method. Therefore, it is very necessary and important to find a relatively fast, low cost, and simple method to obtain the wind power spectra over the complex terrains.
Motivated by these remaining problems as discussed above, this study aims to study the fundamental characteristics of the wind power spectra in the longitudinal direction at the gorge terrain and tries to find a simple method to determine the values of the wind power spectra. First, a simplified V-shaped gorge terrain model, representing typical deep-cutting gorge terrains where long-span bridges usually straddle, was introduced for the wind tunnel tests. The wind power spectra at the gorge center were analyzed in detail and compared to those of the oncoming wind. Then, a practical calculation method which can directly calculate the power spectra values at the gorge terrain was proposed in the process. Furthermore, an infield deep-cutting gorge terrain model was also introduced, and the obtained wind power spectra were validated by the proposed calculation method. Finally, some main conclusions were presented. The flow chart for the structure of this study is shown in Figure 1.
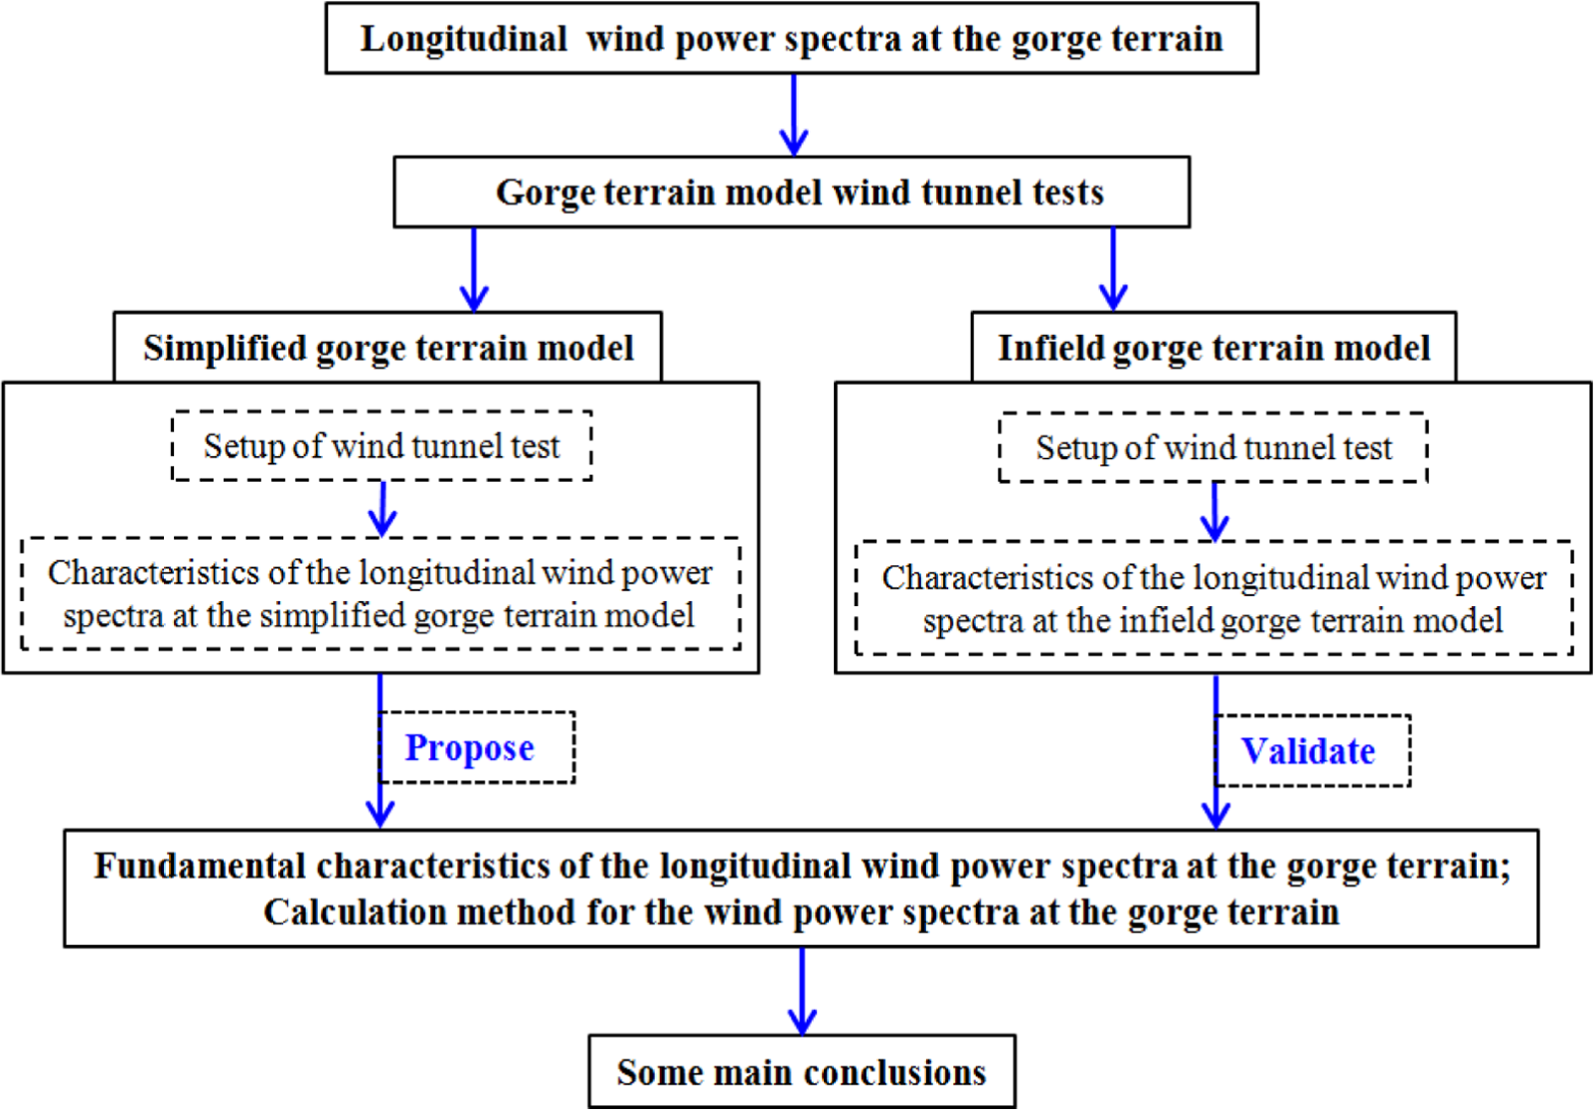
Flow chart for the structure of this study.
Longitudinal wind power spectra at a simplified gorge terrain model
Setup of wind tunnel test for the simplified gorge terrain model
Since each infield gorge terrain is not completely identical to the others in geometric shape, the wind power spectra at these infield gorge terrains should be different from each other. To avoid the case-by-case studies on these terrains, an effective method is to obtain the fundamental information about the wind characteristics including the wind power spectra at the typical or simplified gorge terrain (Li et al., 2010; Sierputowskia et al., 1995). In addition, the as-obtained fundamental information from the typical or simplified gorge terrain can also help understand and explain the complex wind characteristics over the real gorge terrains. Therefore, a simplified V-shaped gorge, representing typical infield deep-cutting gorges where the long-span bridges usually straddle, was introduced in the present wind tunnel studies.
The wind tunnel tests were conducted in the XNJD-1 wind tunnel at Southwest Jiaotong University, China. The test section of the wind tunnel is 3.6 m in width and 3.0 m in height, and the wind speed ranges from 0.0 to 22.0 m/s. To make full use of the test section size and to further conveniently investigate the effects of oncoming wind directions on the wind characteristics at the simplified gorge terrain, the simplified gorge terrain was made in a circular shape with a diameter of 3.066 m and a height of 0.25 m. Furthermore, to make the oncoming wind flow over the edge of the terrain model smoothly and reasonably, a transition section from the wind tunnel floor to the edge top of the terrain model was established around the circular gorge terrain (Hu et al., 2015). Then, a V-shaped groove with a 120° angle was cut along the center of the circular gorge terrain to simulate a simplified gorge terrain. The final V-shaped gorge terrain model results in a blockage ratio of about 5.4% of the wind tunnel test section, as shown in Figure 2. In addition, it is noted that the surface roughness has remarkable effects on the wind characteristics of the terrain (Cao and Tamura, 2006; Derickson and Peterka, 2004; Miller and Davenport, 1998). Considering that there exist lots of vegetation and trees on the surface of the infield gorge which can represent certain surface roughness, about 3500 small roughness elements (10 mm cubes) were placed in a staggered pattern on the terrain surface to appropriately simulate the infield surface roughness, as shown in Figures 2 and 3. This arrangement gives a roughness density of λ = 8.0%, where λ is defined as the total roughness front area per unit ground area (Cao and Tamura, 2006).
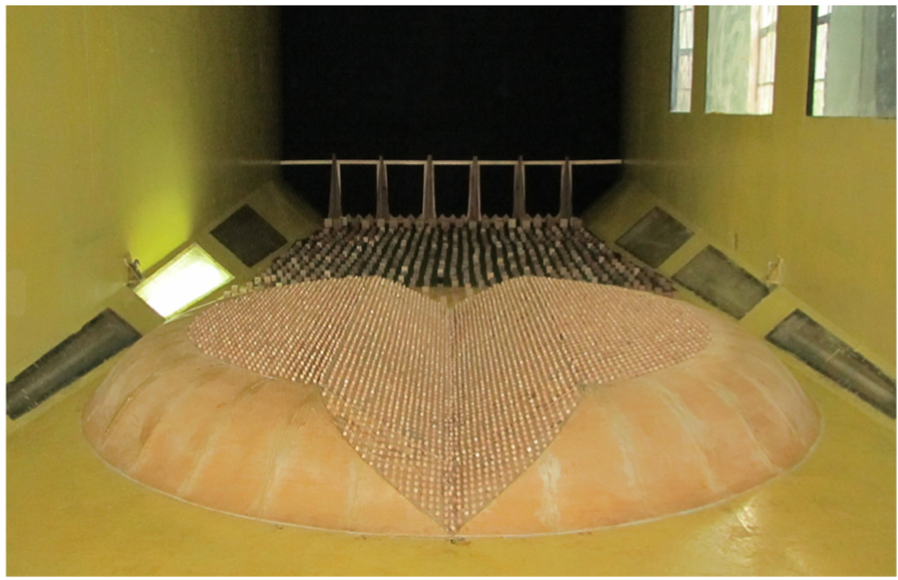
Simplified gorge terrain model.
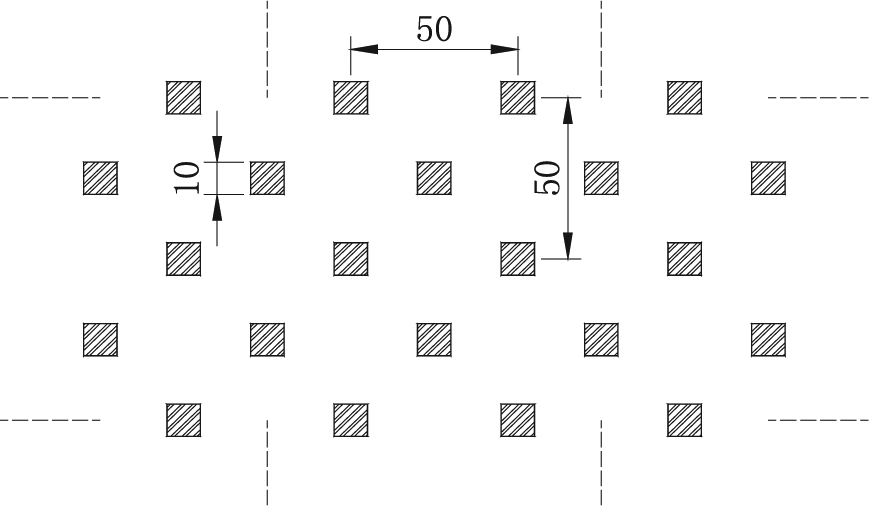
Arrangement of roughness elements on the terrain surface (in mm).
In the wind tunnel tests, Cobra probes were used to measure the wind velocity in the simplified gorge terrain. The sampling frequency was 1250 Hz, and the sampling time was about 60 s for each measurement position. Considering that an infield gorge terrain always exists in a very complex terrain, the surface roughness of the terrain and the oncoming wind field should belong to type IV according to the Chinese specification (CCCC Highway Consultants CO., Ltd., 2004). Therefore, the oncoming wind field using a scale of 1/600 was simulated by the combination of spires and floor roughness arrays in the wind tunnel. Here, the oncoming wind field was measured at the model center position before the terrain model was placed into the wind tunnel. The simulated wind speed profile with the power law exponent (denoted by α) of 0.296 agreed well with the target one which is represented by the power law exponent of 0.30, as shown in Figure 4, where the simulated values were fitted by the Origin software (OriginLab Corporation, 2010). Moreover, the simulated longitudinal turbulence intensity profile and the longitudinal wind power spectra (refer to the scale values, similarly hereinafter) at the height of 0.132 and 0.262 m above the ground generally agreed well with the corresponding target values, as shown in Figures 5 and 6, respectively, where the simulated longitudinal wind power spectra in Figure 6 were obtained by the method proposed by Welch (1967) based on the commercial software MATLAB (The MathWorks Inc., 2012), and the corresponding target values were the wind power spectra models proposed by Kaimal et al. (1972) and Von Kármán (1948). As such, the simulated oncoming wind field was generally in accordance with the specification.
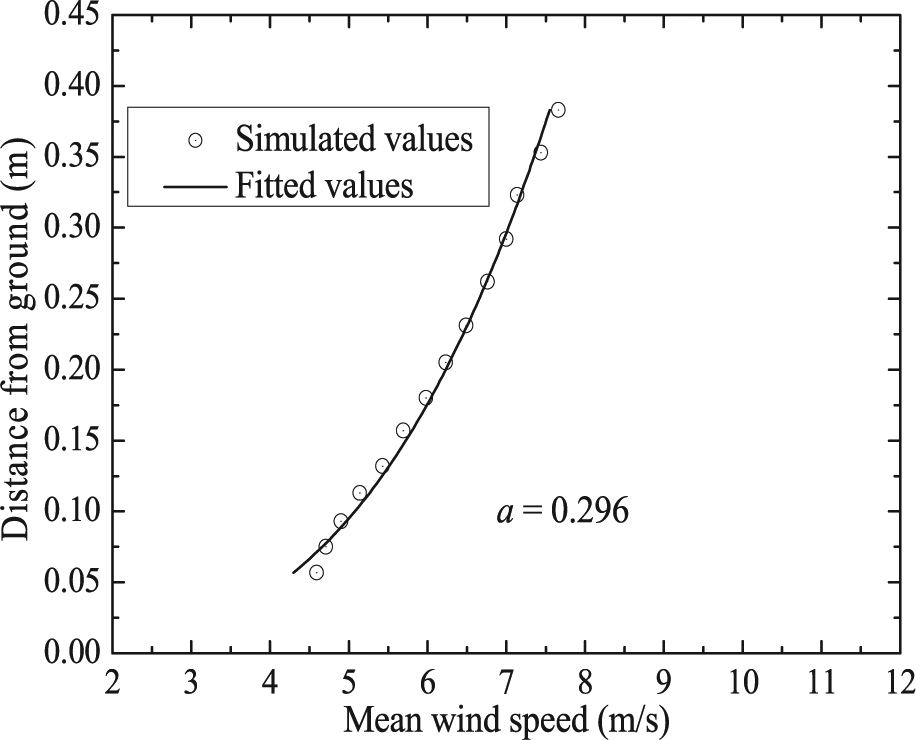
Mean wind speed profile and its fitted results by power law model.
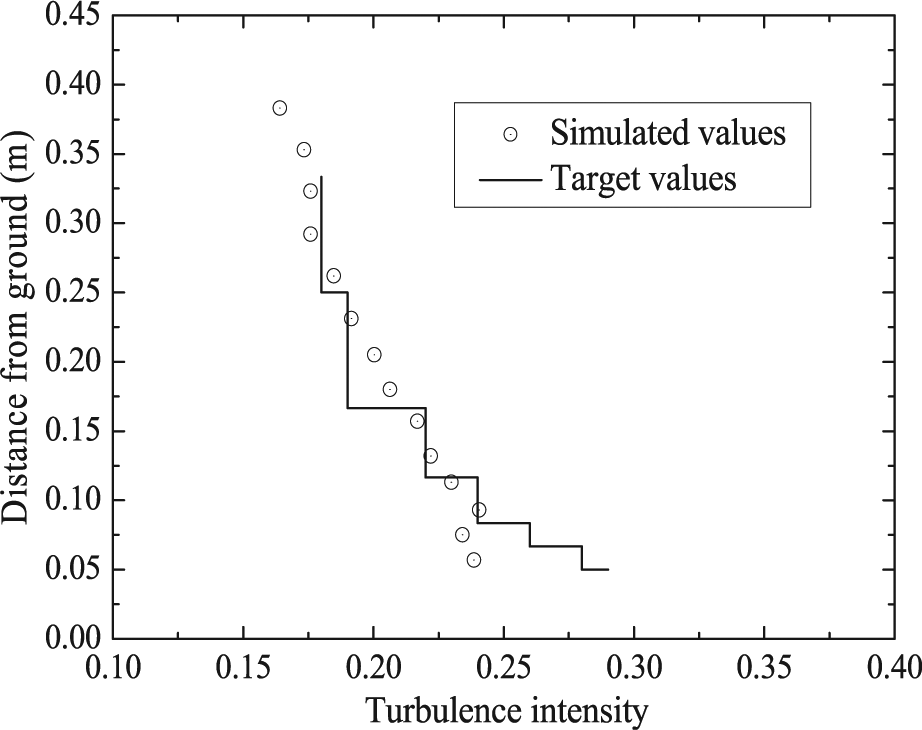
Longitudinal turbulence intensity profile.
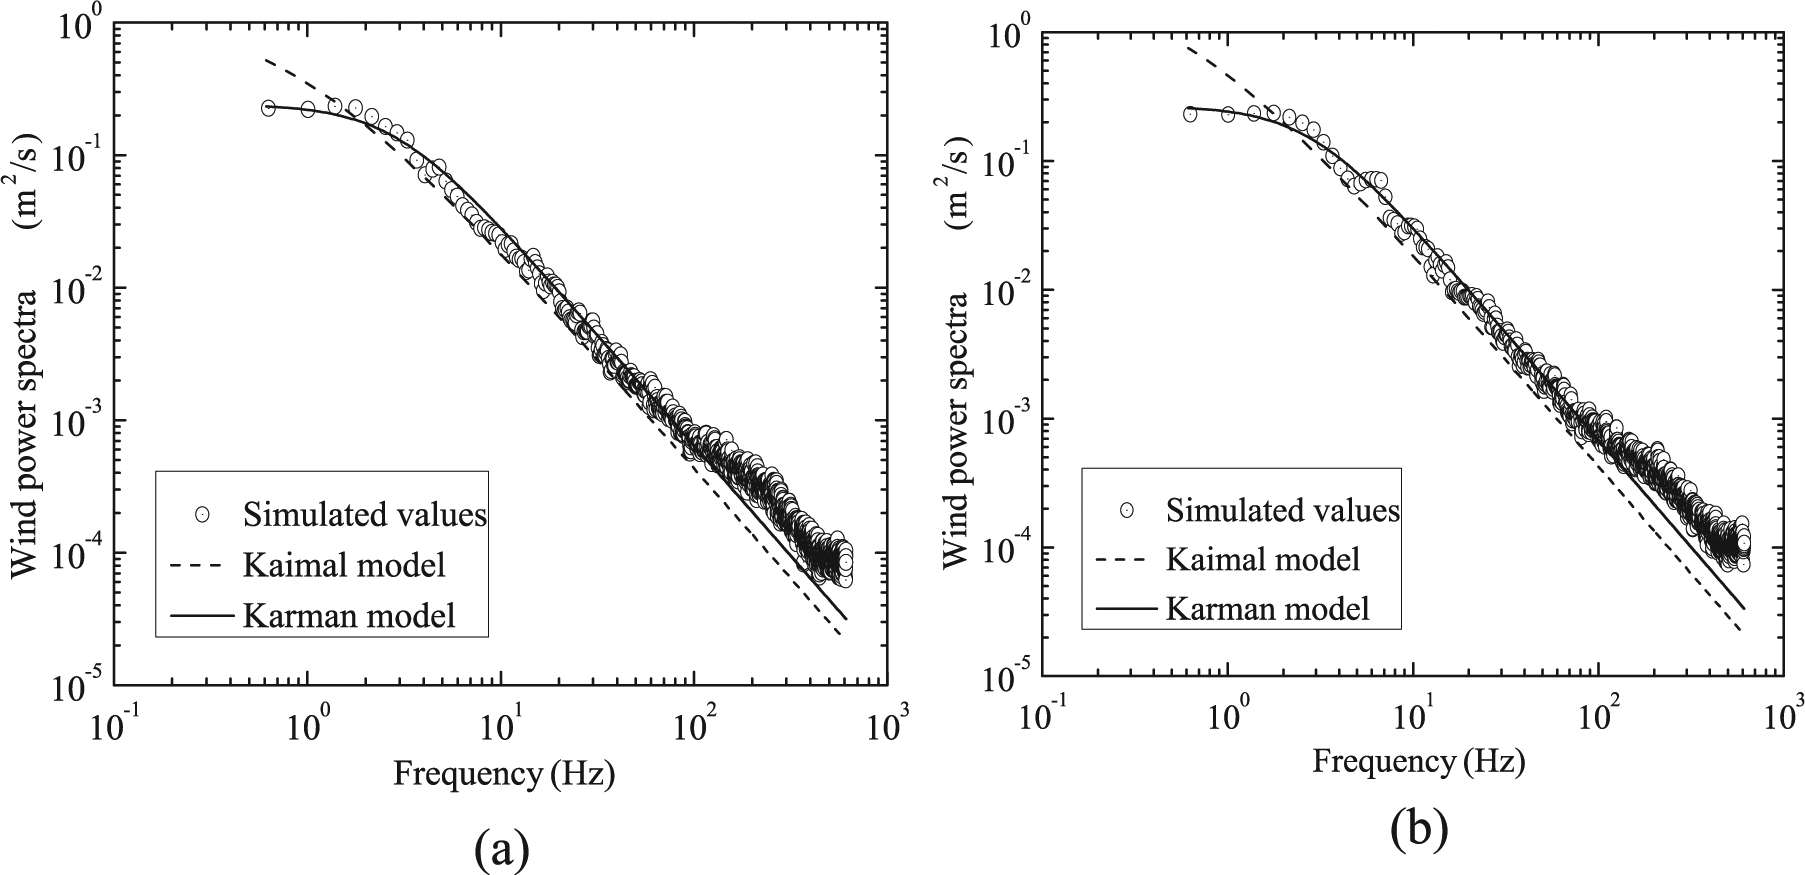
Simulated wind power spectra compared with the target values: (a) 0.132 m and (b) 0.262 m from the ground.
Characteristics of the longitudinal wind power spectra at the simplified gorge terrain model
For a long and straight gorge terrain, the wind always flows along the gorge (Bullard et al., 2000). To avoid the influences of the two ends of the gorge terrain on the characteristics of the wind power spectra at the gorge, the wind power spectra at the gorge center with the simulated oncoming wind flowing along the gorge are of significant importance and will be analyzed in detail later. This scenario can be regarded as the most representative one for the present gorge terrain. In the tests, a total of fourteen vertical measurement positions were located at the gorge center, as shown in Figure 7, and their heights were given in Table 1.
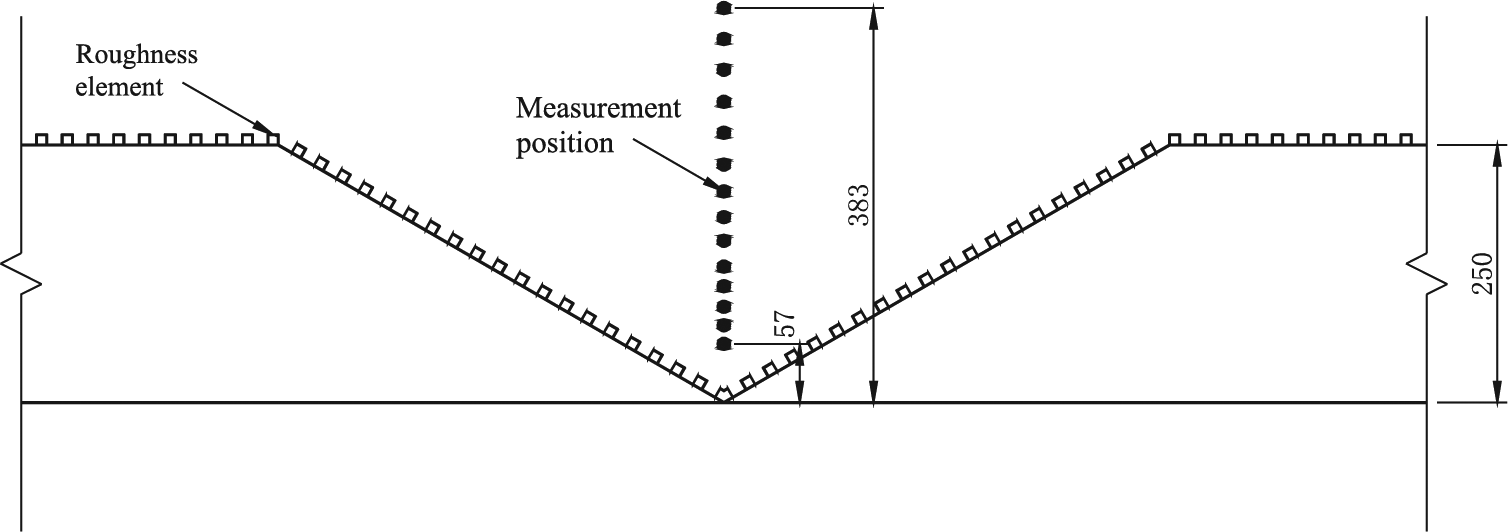
Measurement positions at the gorge center (in mm).
Comparison of fitting results of power spectra coefficients c at the oncoming wind and at the gorge center.
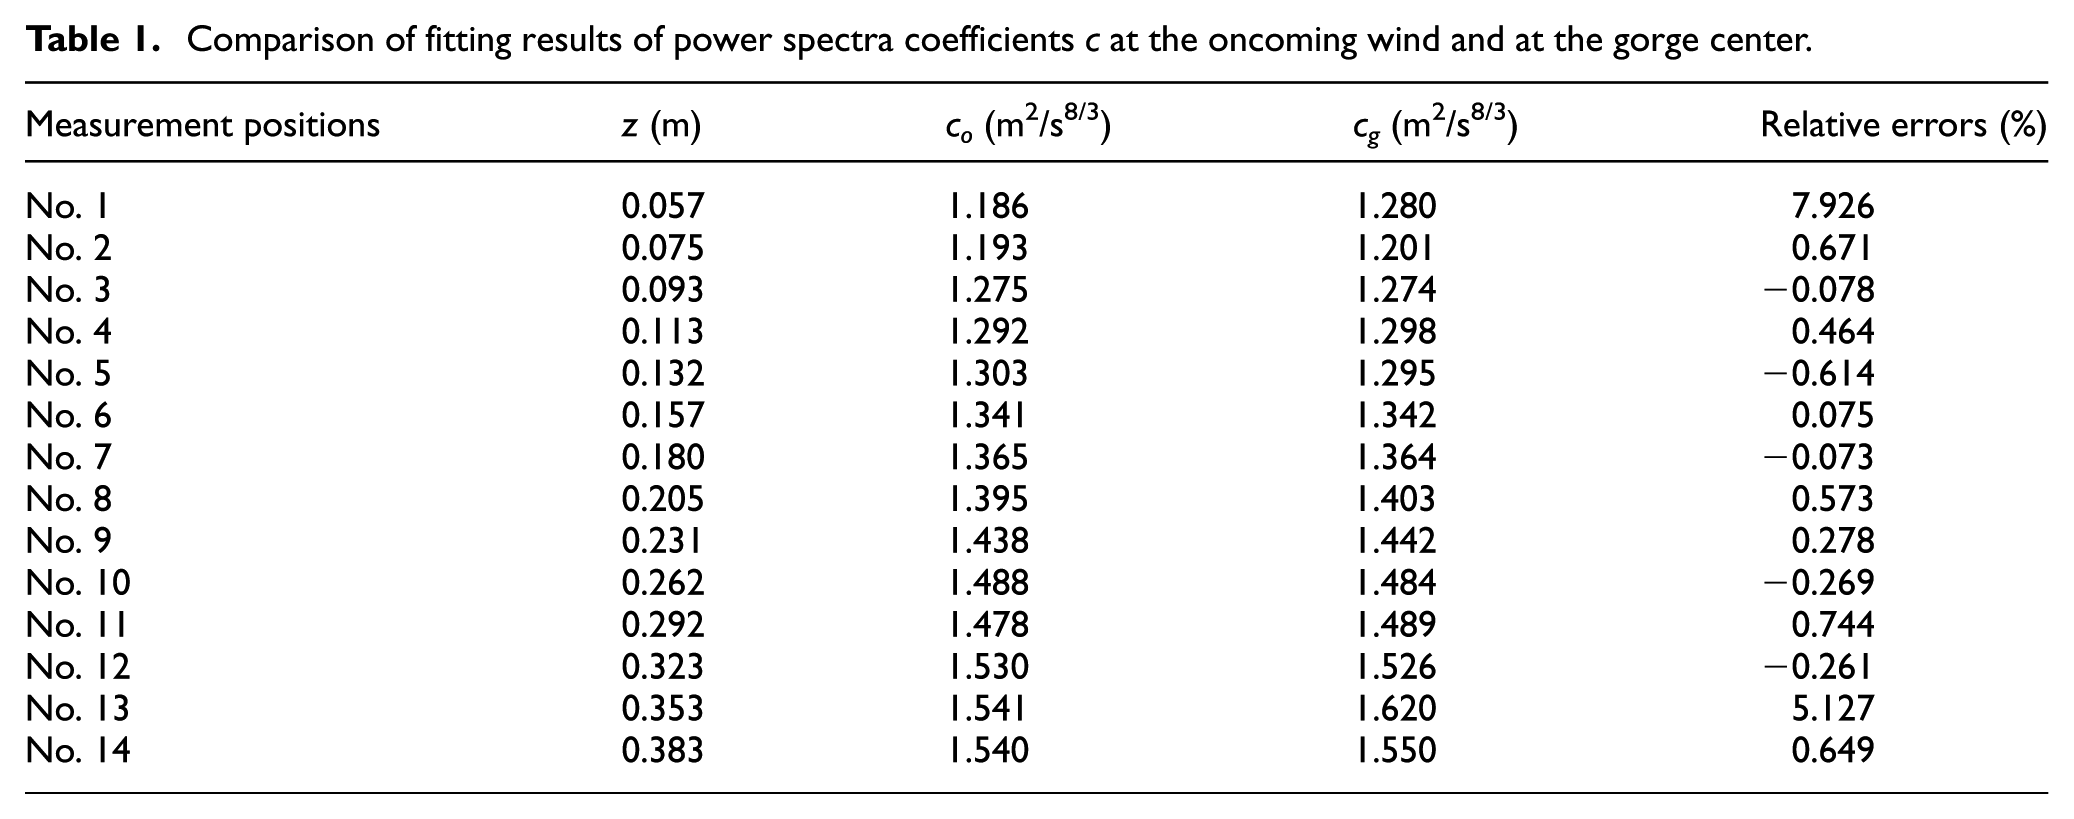
Figure 8 shows the comparison of wind power spectra between the gorge center and the oncoming wind with several typical measurement positions moving away from the ground. It can be seen that with the measurement positions moving away from the ground, the power spectra values in the low-frequency range associated with the gorge center are gradually closer to those associated with the oncoming wind. However, the power spectra values in the high-frequency range associated with the gorge center and the oncoming wind are essentially the same. In general, the higher the measurement positions from the ground, the closer the power spectra values associated with the gorge center are to those associated with the oncoming wind. For instance, when the distance from the ground reaches 0.323 m, the whole power spectra values associated with the gorge center are generally in full agreement with those associated with the oncoming wind, as shown in Figure 8(d).
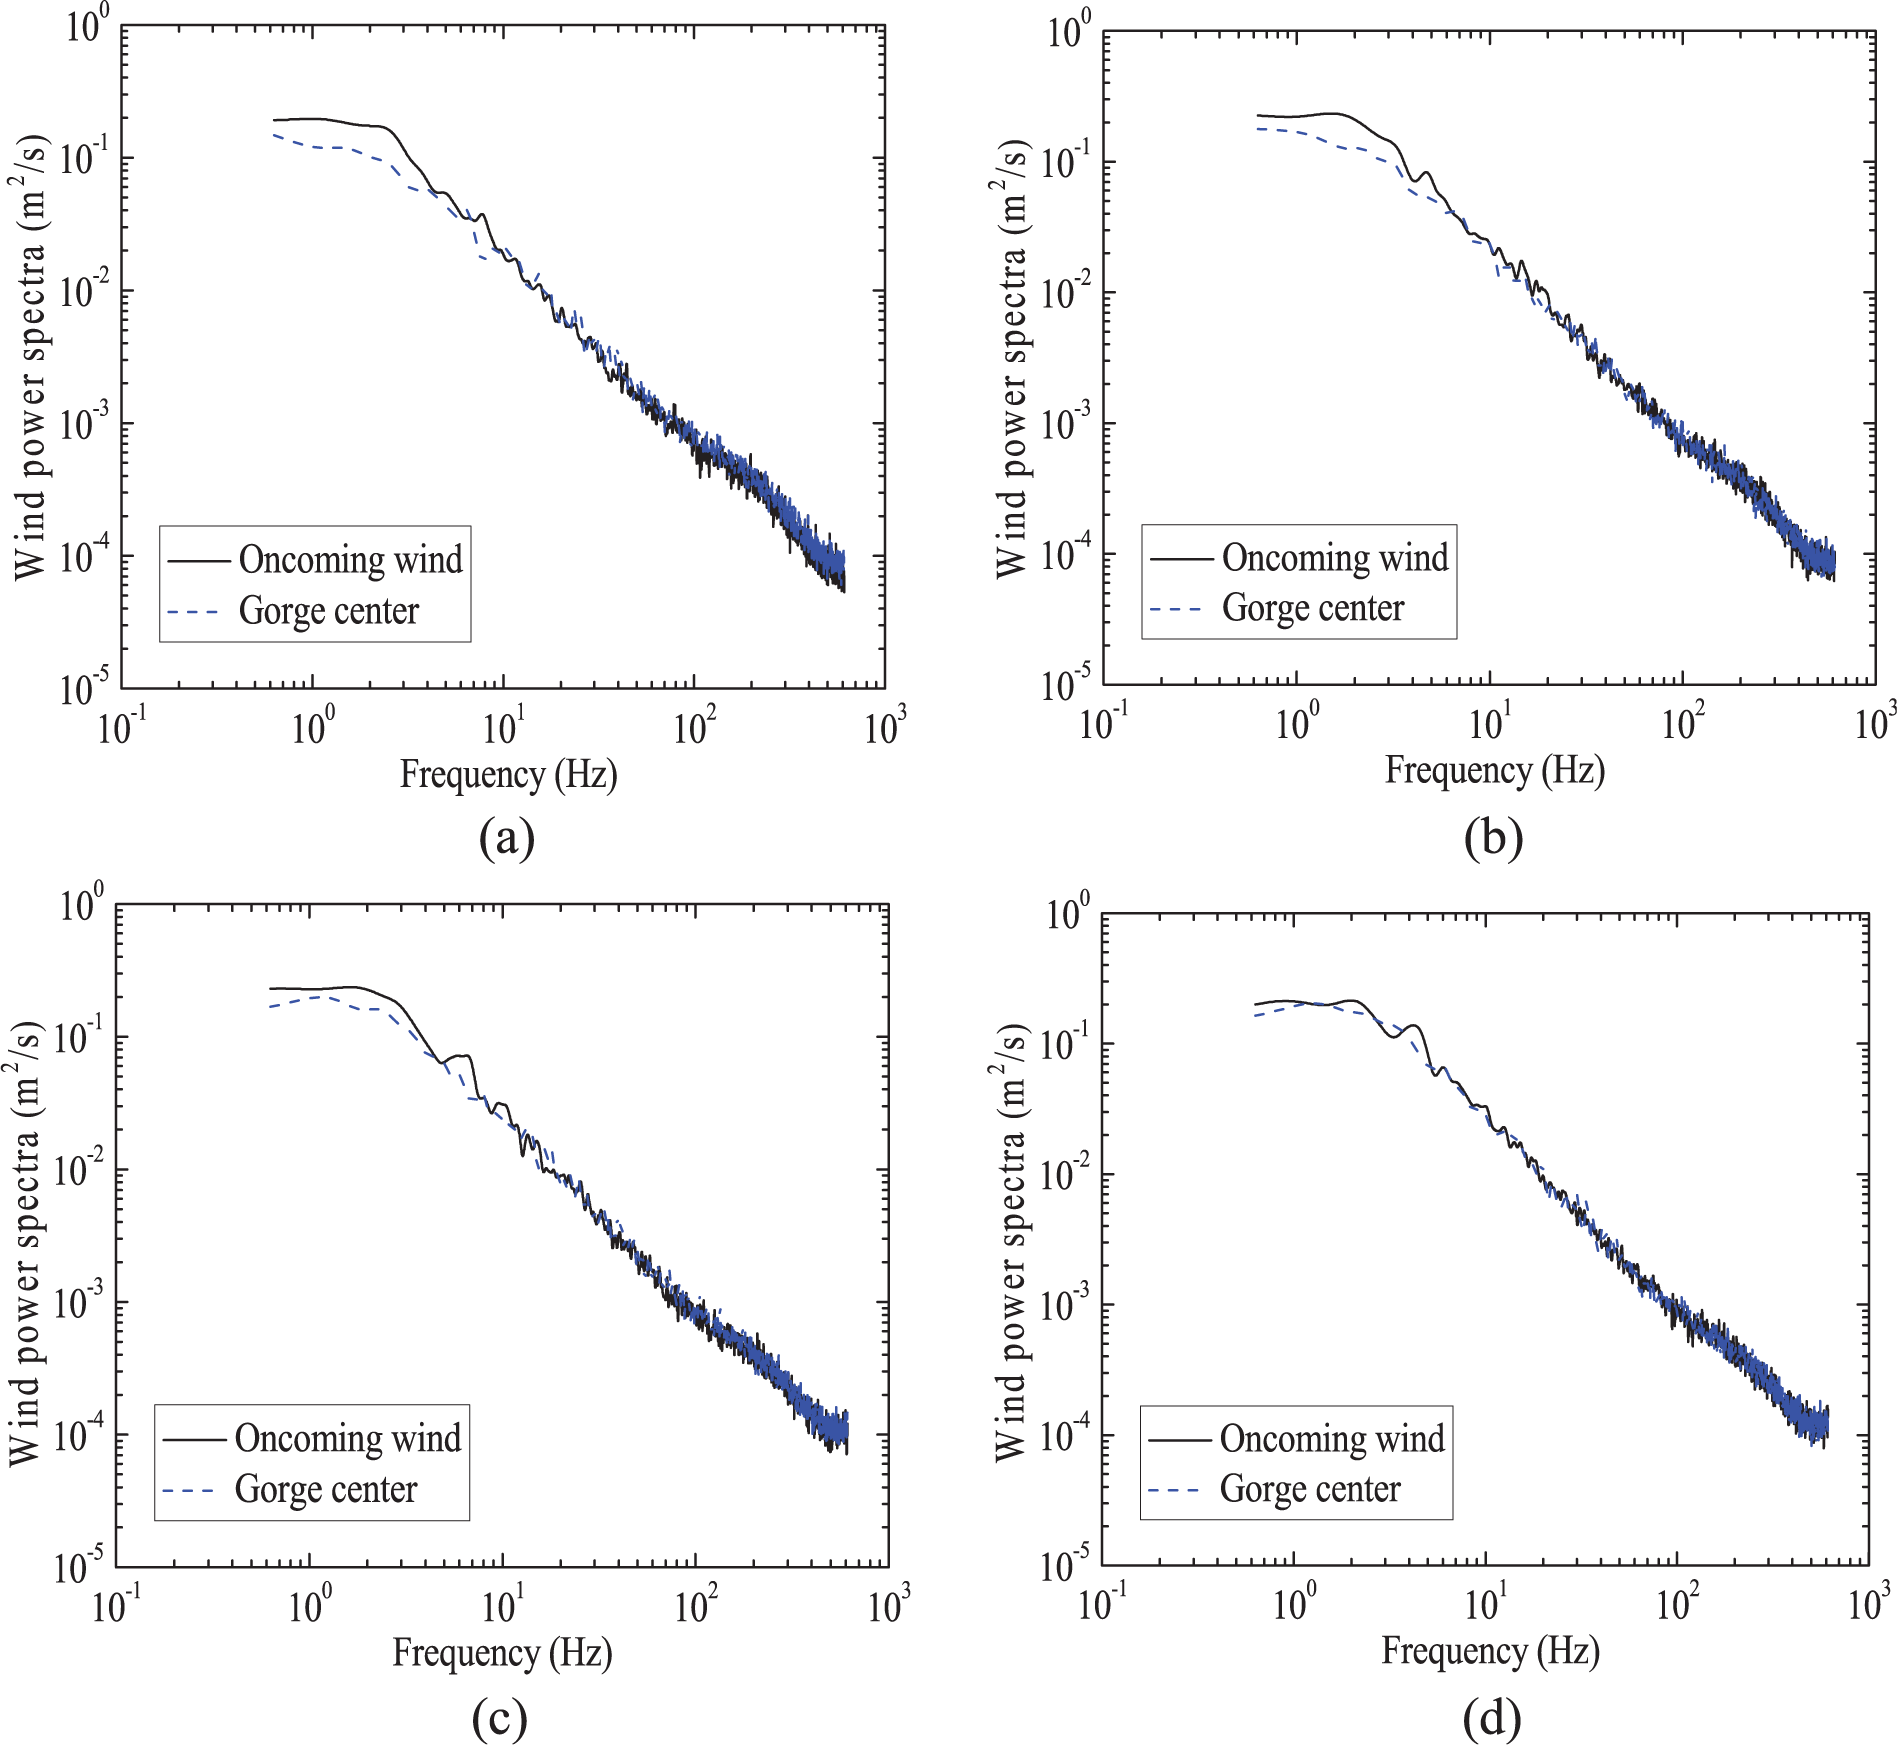
Comparison of wind power spectra values at the gorge center and at the oncoming wind with several typical measurement positions moving away from the ground: (a) 0.075 m, (b) 0.132 m, (c) 0.262 m, and (d) 0.323 m from the ground.
The differences of the wind power spectra values between the gorge center and the oncoming wind can be explained as follows. The turbulent velocity fluctuations can be considered to be caused by a superposition of eddies. The large eddy motion which can cause the low-frequency velocity fluctuations is mainly determined by the boundary condition of the flow. The small eddy motion which can cause the high-frequency fluctuations is mainly determined by the viscosity effects of the flow (Simiu and Scanlan, 1996). When the oncoming wind flows into the gorge, the large eddies of the turbulent flow break into the small eddies due to the existence of the gorge terrain (Hu, 2013). Therefore, the low-frequency energy of the turbulent flow at the gorge center decreases, which results in the power spectra values in the low-frequency range at the gorge center become smaller than those at the oncoming wind. Furthermore, the lower the measurement positions from the ground, the greater the changes of the eddies influence, such as in cases of the lower positions as shown in Figure 8(a) and (b). On the one hand, the power spectra values in the high-frequency range are independent of the large eddies; on the other hand, the measurement positions are in the middle plane of the gorge center and have certain distances away from the two side slopes of the gorge surface. Therefore, the influences of the viscosity effects on the small eddies at the measurement positions are very small. As a result, the power spectra values in the high-frequency range associated with the gorge center are in good agreement with those associated with the oncoming wind. Meanwhile, it is expected that when the measurement positions move higher away from the ground, the wind characteristics at the gorge center will mainly depend on the oncoming wind. As a result, the whole power spectra values at the gorge center will be close to those of the oncoming wind, as shown in Figure 8(d).
From Figure 6, the wind power spectra shapes for the oncoming wind are generally close to those proposed by Kaimal et al. (1972) which is given as follows (Simiu and Scanlan, 1996)

where Su is the longitudinal wind power spectrum; u* is the friction velocity; f is the Monin similarity coordinate, f = nz/U; n is the frequency in Hz, z is the height from the ground, and U is the mean wind speed.
In addition, it is also noted that the wind power spectra shapes at the gorge center are also generally close to those of the oncoming wind, as shown in Figure 8. Therefore, it can be considered that both the wind power spectra at the oncoming wind and at the gorge center have similar expressions to those proposed by Kaimal et al. (1972). According to equation (1), the expressions of the wind power spectra at the oncoming wind and at the gorge center denoted by So and Sg, respectively, can be expressed in equations (2) and (3)


where ao, bo, ag, and bg are the coefficients corresponding to the terms in equation (1). For the power spectra values in the high-frequency range (such as in the inertial subrange), equations (2) and (3) can be generally simplified as follows (Simiu and Scanlan, 1996)


where co and cg are the power spectra coefficients at the oncoming wind and the gorge center, respectively, both of which are related to the parameters such as z and U.
As discussed earlier, the power spectra values in the high-frequency range associated with the gorge center are in good agreement with those associated with the oncoming wind. To quantitatively analyze this agreement, equations (4) and (5) are fitted to the power spectra values in the high-frequency range both associated with the gorge center and the oncoming wind. The fitting range of n is from 24.5 to 98.0 Hz, and the mean wind speeds at the gorge center and the oncoming wind are shown in Figure 9. Certainly, the values of f = nz/U for each measurement position at the oncoming wind and at the gorge center are all larger than 0.2, which means that the values of f are in the inertial subrange (Simiu, 1974; Simiu and Scanlan, 1996). The fitting results of co and cg are listed in Table 1, and the relative errors of c associated with the gorge center to those of the oncoming wind are also given here. It can be seen that the relative error for each measurement position is quite small, except for the measurement positions at 0.057 and 0.353 m. The reason is probably that the Cobra probes were not at their exact positions in the test. From the information above, Table 1 further confirms that the power spectra values in the high-frequency range associated with the gorge center are in good agreement with those associated with the oncoming wind.
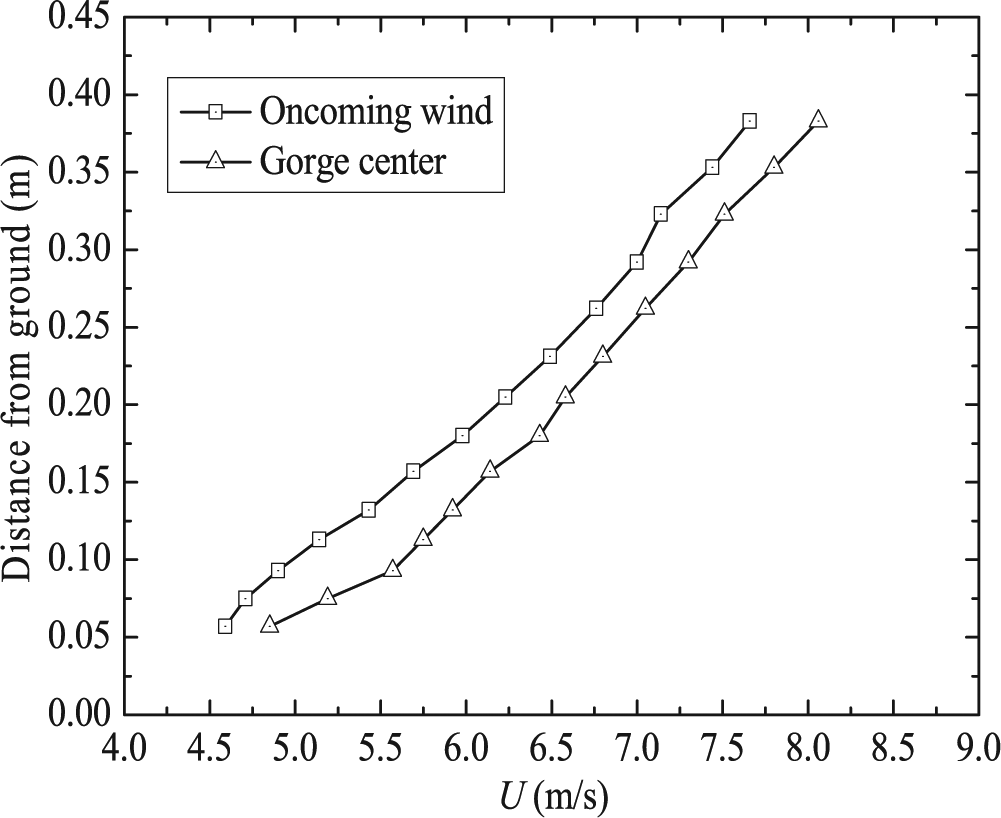
Mean wind speed profiles at the oncoming wind and at the gorge center.
Proposed calculation method for wind power spectra at the gorge terrain
It is noted that the integral of the wind power spectrum by equation (2) or (3) over the frequency domain is equal to the square of the mean square deviation values of the turbulent flow. For instance, the longitudinal turbulent flow at the gorge center yields

where σug is the longitudinal mean square deviation value of wind velocity at the gorge center and σug = UgIug, where Ug and Iug are the mean wind speed and the longitudinal turbulence intensity at the gorge center, respectively, as shown in Figures 9 and 10.
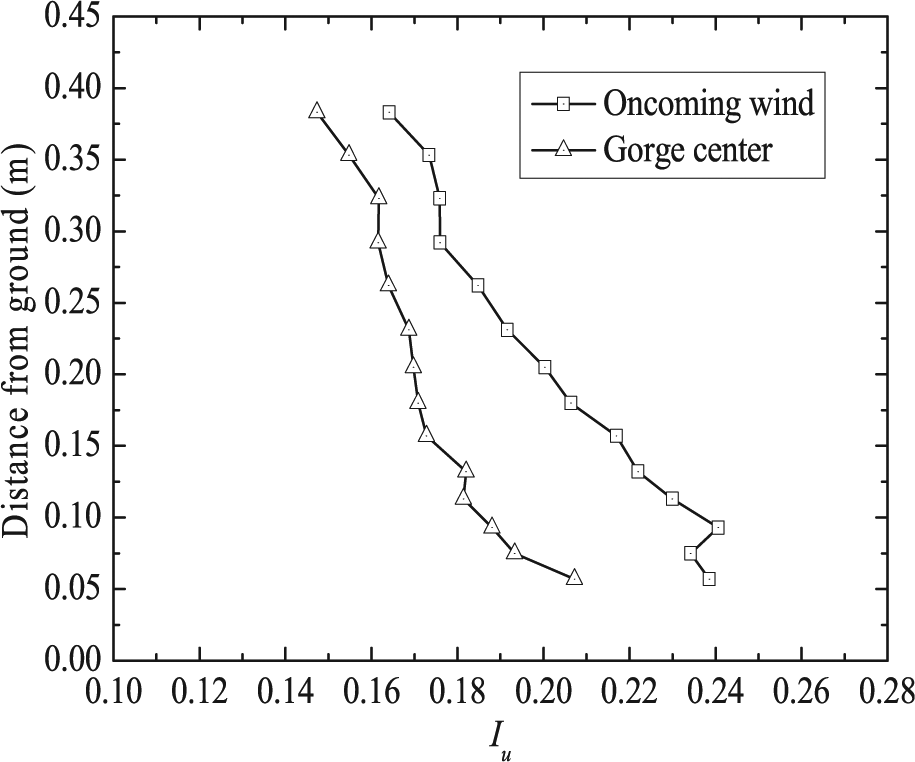
Turbulence intensity profiles at the oncoming wind and at the gorge center.
Integrating the wind power spectrum by equation (3) over the frequency domain yields

Substituting equation (7) into equation (6) yields

As a matter of fact, equations (6) and (8) also hold true for the case of the longitudinal turbulent flow at the oncoming wind. As discussed in section “Characteristics of the longitudinal wind power spectra at the simplified gorge terrain model,” the power spectra values in the high-frequency range associated with the gorge center are in good agreement with those associated with the oncoming wind, that is, the value of cg is very close to that of co for each measurement position. If one takes the value of cg equal to that of co, it yields

However, the ratios of Sg to So can be obtained from equations (2) and (3), and it yields

For a special case when n = 0, it yields

where n≥nc and nc is the critical frequency generally following the principle fc = ncz/U > 0.2 as discussed earlier. Based on equation (9), equations (4) and (5) yield

Actually, the relationship represented by equations (11) and (12) can be found in Figure 8. In addition, it should be noted that for the power spectra values in the frequency range from 0 to nc, the power spectra values in this range associated with the gorge center become gradually closer to those associated with the oncoming wind. Using linear interpolation, the ratio of the power spectra values in the frequency range from 0 to nc can be obtained from equations (11) and (12)

It is seen from equation (13) that the values of Sg in the frequency range from 0 to nc can be calculated by the values of ag/ao and the determined values of So. However, equations (8) and (9) yield

where σuo is the longitudinal mean square deviation value of wind velocity at the oncoming wind and σuo = UoIuo, where Uo and Iuo are the mean wind speed and the longitudinal turbulence intensity, respectively, of the oncoming wind as shown in Figures 9 and 10. Substituting equation (14) into equation (13) yields

From equations (15) and (12), it is concluded that the power spectra values at the gorge center Sg(n) can be calculated by the power spectra values at the oncoming wind So(n) and the values of σug/σuo.
To validate the applicability of equations (12) and (15) in calculating the power spectra values in the gorge terrain, the power spectra values obtained from the gorge center with the simplified gorge terrain shown in Figure 2 are adopted here. As discussed earlier, the value of fc = ncz/U is typically larger than 0.2 for each measurement position. Based on the test data, it is found that the value of fc = ncz/U should be larger than 0.3. As such, the value of fc is determined to be 0.3 for each measurement position in this study. As a result, the value of nc for each measurement position can be determined according to the relationship nc = 0.3U/z, and the values of U and z are shown in Figure 9. Furthermore, the values of the mean square deviation ratio σ ug /σ uo can be obtained from the corresponding mean wind speeds shown in Figure 9 and the turbulence intensities shown in Figure 10. From the above analysis, the wind power spectra at the gorge center with several measurement positions can be calculated, as shown in Figure 11, where the calculated wind power spectra are compared to the wind tunnel test results. It is seen from the figure that the calculated wind power spectra are very close to the testing wind power spectra, which indicates that the calculation method represented by equations (12) and (15) is effective and applicable to calculate the wind power spectra values at the gorge center. Since the parameters in equation (15) only include the oncoming wind power spectra So(n) and the values of the mean square deviation ratio σug/σuo but not the time history of the turbulent flow, the calculation method by equations (12) and (15) are expected to be more practical and convenient for calculating the wind power spectra values at the gorge center.
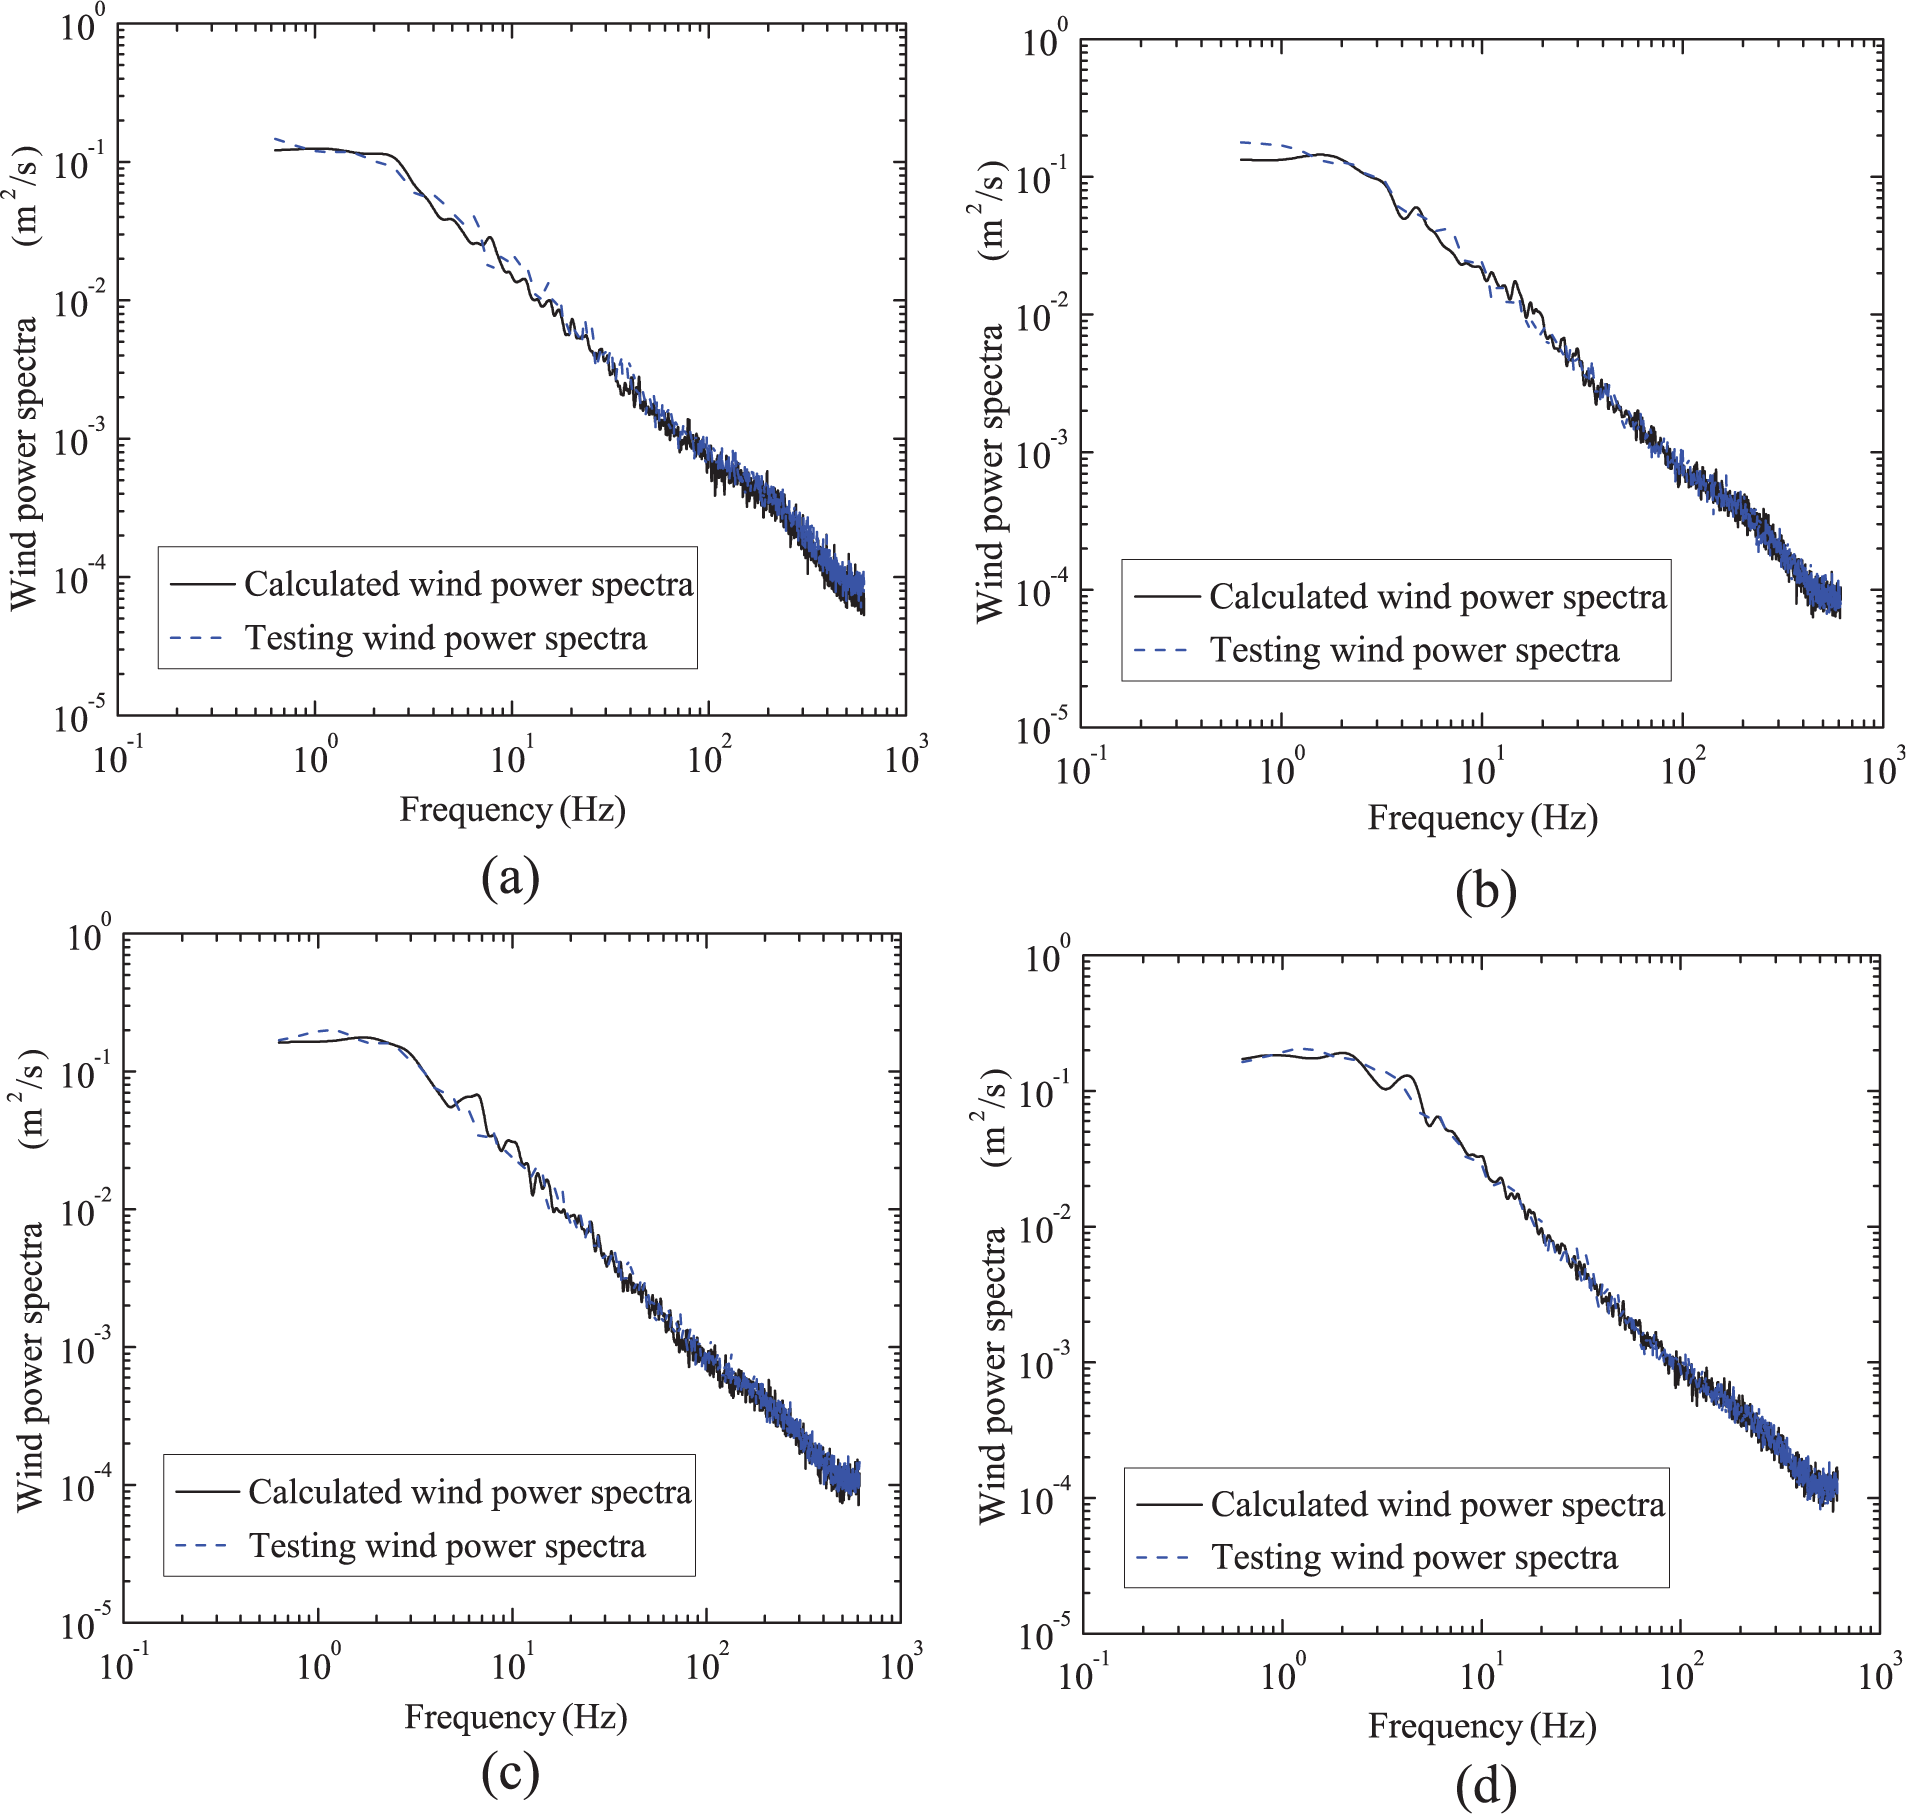
Comparison of calculated wind power spectra with the testing wind power spectra at the gorge center: (a) 0.075 m, (b) 0.132 m, (c) 0.262 m, (d) 0.323 m.
Longitudinal wind power spectra at an infield gorge terrain model
Setup of wind tunnel test for the infield gorge terrain model
The objective of this wind tunnel test is to investigate the wind characteristics over an infield V-shaped deep-cutting gorge where a long-span bridge straddles, and the V-shaped deep-cutting gorge is shown in Figure 12. The wind tunnel test was conducted in a large-scale XNJD-3 wind tunnel at Southwest Jiaotong University, China. The test section of the wind tunnel is 22.5 m in width, 4.5 m in height, and 36.0 m in length. Considering the width of the XNJD-3 wind tunnel, the rolling terrain around the deep-cutting gorge and the bridge site, and the convenience of investigating the wind characteristics over the gorge terrain from different oncoming wind directions, the terrain model was centered on the bridge site, with a diameter of 15.0 m and the scale ratio of 1/1000. The terrain model was made of KT Board which is composed mainly of polystyrene and with 10-mm steps according to the mapped contour lines in order to simulate the surface roughness appropriately, as shown in Figure 13(a). Similar to the simplified model, another transition section from the wind tunnel floor to the edge top of the terrain model was established around the terrain model to make the oncoming wind flow over the edge of the terrain model smoothly and reasonably. The whole terrain model results in a blockage ratio of about 6% of the wind tunnel test section. Furthermore, the blockage ratio could be much smaller when the oncoming wind flows along the river course direction, and this is due to the low-relief terrain along the river course. Therefore, the influences of the blockage ratio in this study can be neglected.
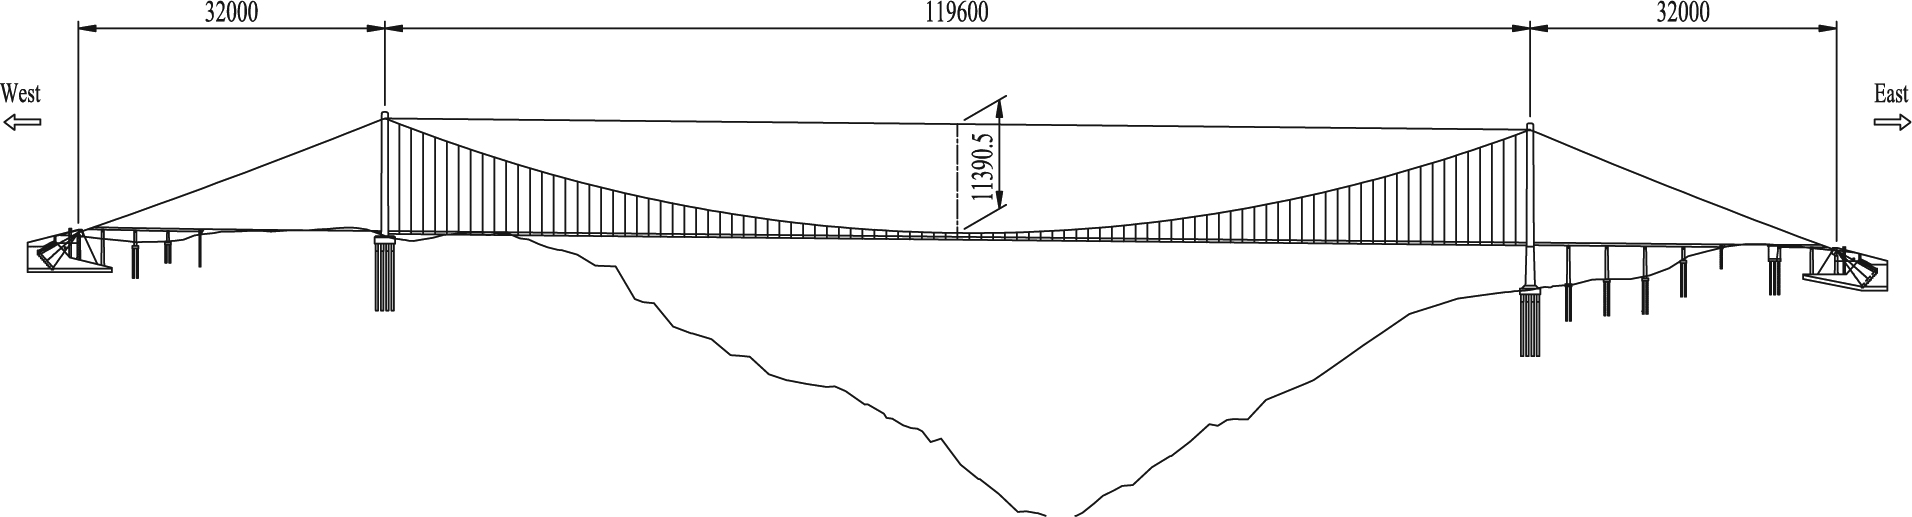
General arrangement of long-span bridge and the V-shaped deep-cutting gorge (in cm).
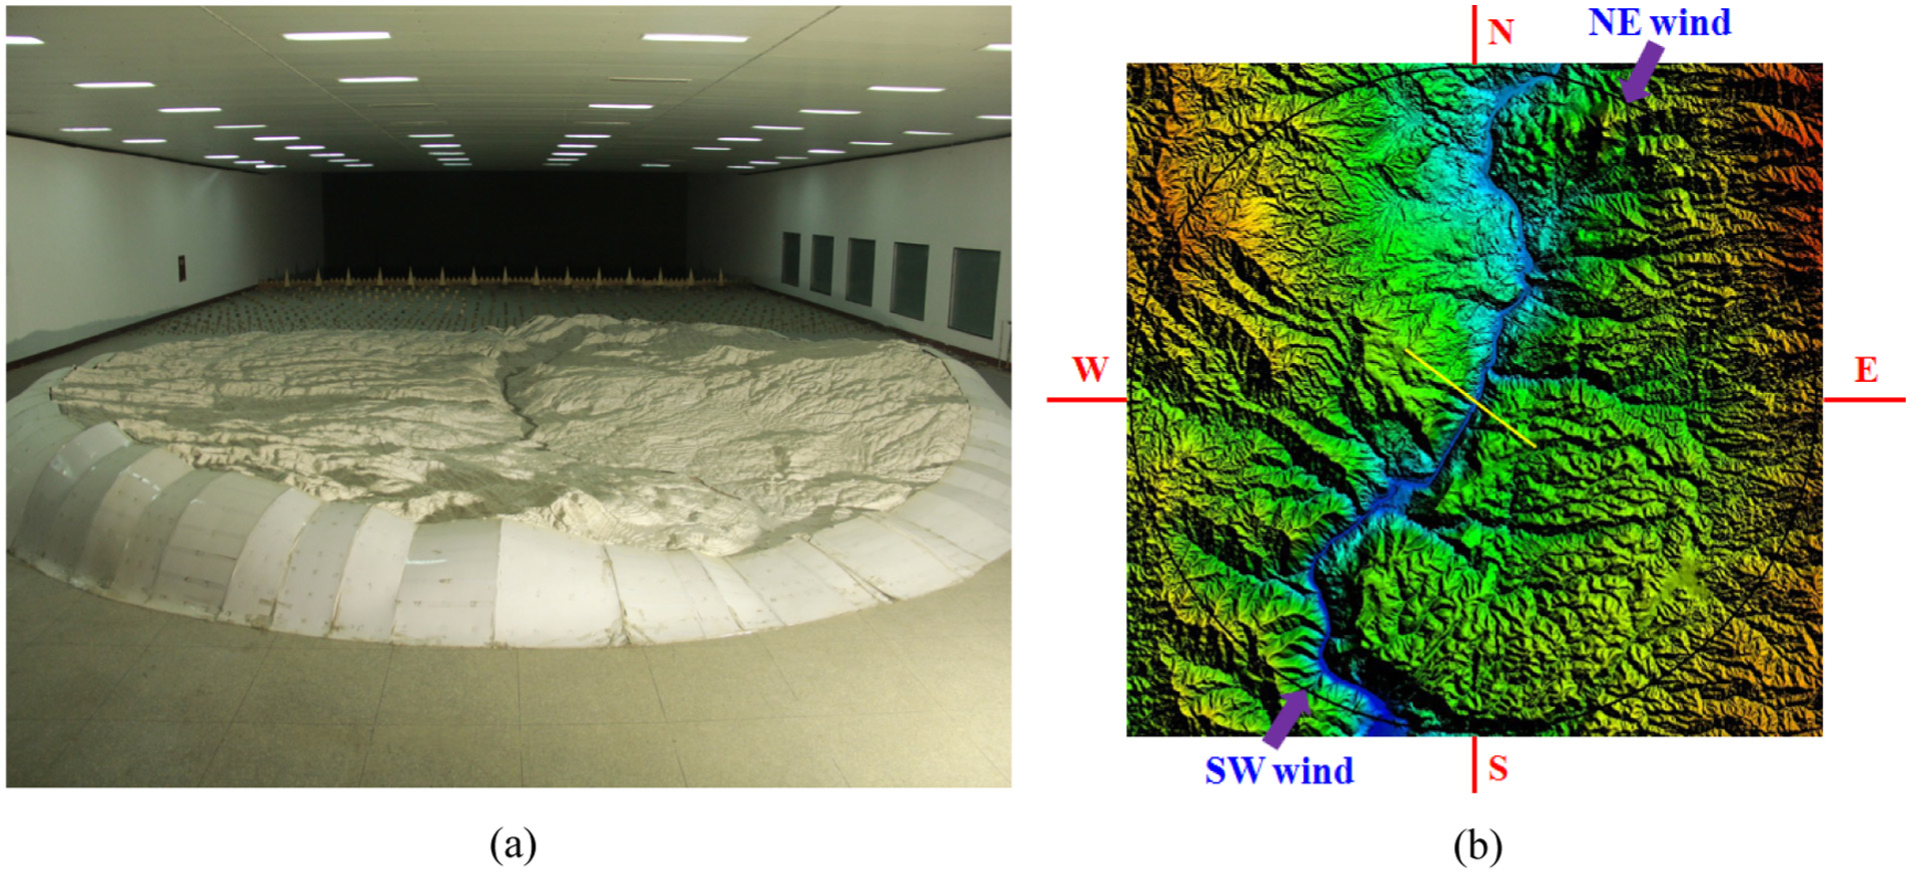
Deep-cutting gorge terrain around the bridge site: (a) the whole terrain model in the wind tunnel and (b) terrain feature of the terrain model.
Figure 13(b) shows the terrain feature of the terrain model where the yellow line segment in the middle refers to the location of the bridge, the red parts refer to the terrain with higher elevations, and the blue parts refer to the terrain with lower elevations. It can be seen from Figure 13(b) that the terrain on the north of the bridge site is relatively flat, the length of the partial gorge on the north of the bridge site is relatively short, and the side slopes of this partial gorge are relatively gentle. However, the partial gorge on the south of the bridge site is relatively long and straight, and the side slopes of this partial gorge are very steep. In addition, the terrain on the two sides of the gorge is very steep and rough, especially for the terrain on the south-west of the bridge site. In a word, the terrain on the south-west of the bridge site is much higher, steeper, and rougher than that on the north-east of the bridge site.
In the wind tunnel tests, Cobra probes were used to measure the wind velocity over the bridge site. The sampling frequency was 1250 Hz, and the sampling time was about 120 s for each measurement position. Because the terrain around the bridge site and the deep-cutting gorge is very rugged, the surface roughness of the terrain and the oncoming wind field belong to type IV according to the Chinese specification (CCCC Highway Consultants CO., Ltd., 2004). As such, the commonly used passive method of the combination of spires and floor roughness arrays was used to simulate the oncoming wind field using a scale of 1/1000. The simulated wind speed profile with the power law exponent of 0.29 agreed well with the target profile which is represented by the power law exponent of 0.30. Also, the simulated turbulence intensity profile and the longitudinal wind power spectra at the height of the bridge main beam generally agreed well with the corresponding target values, as shown in Figure 14. Therefore, the simulated oncoming wind filed was generally in accordance with the specification.
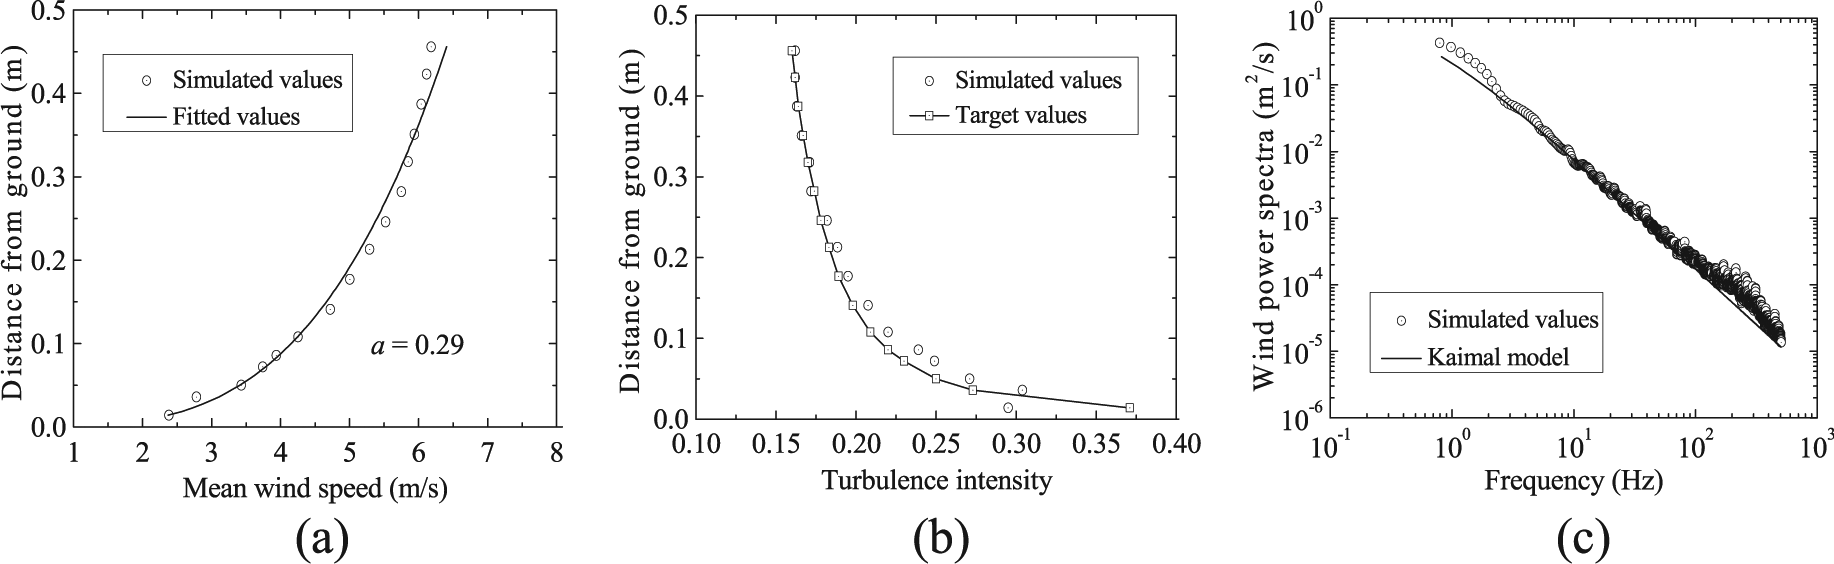
Simulated oncoming wind field compared with the target values required by the specification: (a) wind speed profile, (b) turbulence intensity profile, and (c) wind spectra at the height of the bridge main beam.
To investigate the characteristics of the wind power spectra for this infield gorge terrain model, eight horizontal points with an interval about 0.6 m (or 600 m for the full-scale value) were set along the gorge and the heights of vertical measurement positions for each horizontal point range from 0.132 to 0.702 m according to the terrain feature of the deep-cutting gorge near the bridge site. The chosen points from the south-west (SW) to the north-east (NE) are named as z1–z8, respectively, where points z1 and z2 are located in the southern open ground, points z3–z5 are located in the deep-cutting gorge, and points z6–z8 are located in the northerly open ground, as shown in Figure 15. Based on the feature of this deep-cutting gorge terrain and its similarity to the simplified gorge terrain as shown in Figure 2, points z1 and z2, which are located out of the deep-cutting gorge, can be regarded as the oncoming wind positions for points z3–z5 when the oncoming wind direction is from the south-west and parallel to the river course near the deep-cutting gorge (denoted by SW wind in Figure 13(b)). Similarly, points z6–z8 can also be regarded as the oncoming wind positions for points z4 and z5 when the oncoming wind direction is from the north-east and parallel to the river course near the deep-cutting gorge (denoted by NE wind in Figure 13(b)). In this specific case, since the partial gorge terrain in the south-west region is more like the regular gorge than that in the north-east region, the characteristics of the wind power spectra in the deep-cutting gorge with the SW wind are mainly analyzed. Specifically, the characteristics of the wind power spectra at points z2 and z4 with the SW wind are studied in detail due to their representative positions, as shown in Figure 15. Therefore, point z2 can be regarded as the oncoming wind position for the points in the gorge, and point z4 can be regarded as the gorge center. In this regard, the following discussions focus on the comparisons of the characteristics of the wind power spectra at points z2 and z4 with the simulated oncoming wind as shown in Figure 14.
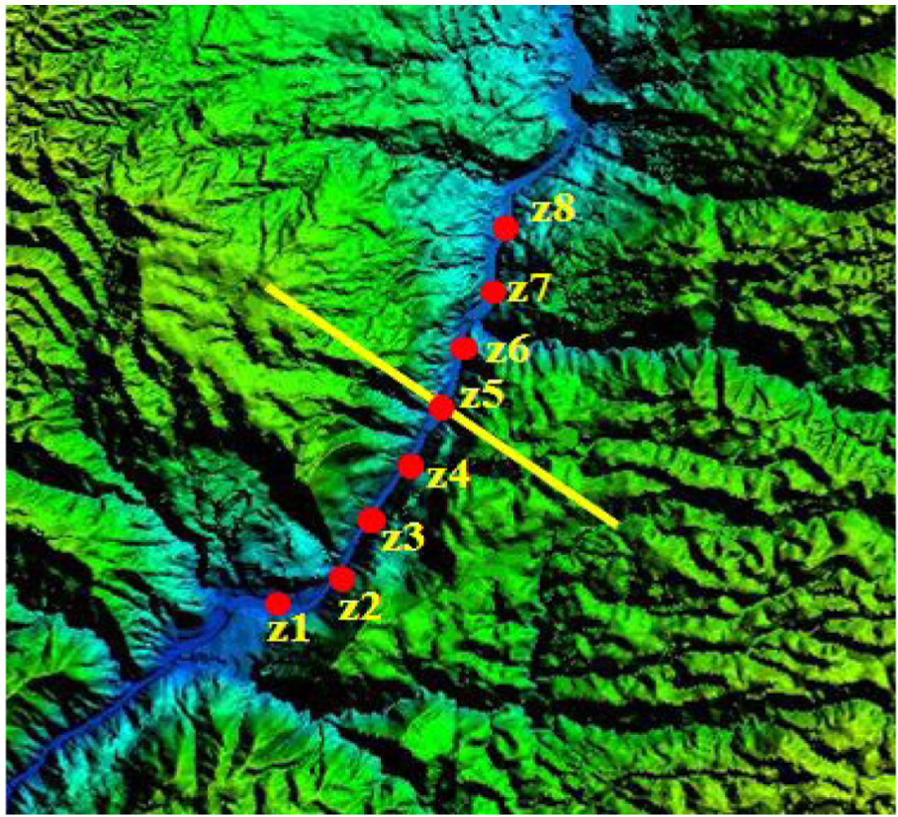
Eight points set along the gorge.
Characteristics of the longitudinal wind power spectra at the infield gorge terrain model
The longitudinal wind power spectra values at points z2 and z4 and the oncoming wind with several typical measurement positions moving away from the ground are shown in Figure 16. By comparing the wind power spectra values between points z2 and z4, it can be seen that the power spectra values in the low-frequency range at point z4 are always smaller than those at point z2. However, the power spectra values in the high-frequency range for these two points are relatively close to each other for all the measurement positions. By comparing the wind power spectra values between point z4 and the oncoming wind, it can be seen that the differences of the power spectra values between point z4 and the oncoming wind are very similar to those between points z4 and z2. Obviously, both the variations of the power spectra values between points z4 and z2 and between point z4 and the oncoming wind are similar to those for the simplified gorge terrain as discussed in section “Characteristics of the longitudinal wind power spectra at the simplified gorge terrain model.”

Comparison of wind power spectra among point z2, point z4, and oncoming wind: (a) 0.141 m, (b) 0.282 m, (c) 0.351 m, and (d) 0.492 m from the ground.
In addition, it can be seen from Figure 16(a) and (b) that the power spectra values in the middle frequency range (in the range of about 3–60 Hz) at point z2 are larger than those at point z4, while these power spectra values at point z4 are very close to those of the oncoming wind. The different variations of the partial power spectra values as discussed above are explained next. Since the terrain in the south-west region is very rough and complex and the river course from the terrain boundary to points z1 and z2 are very winding, as shown in Figures 13(b) and 15, the large eddies of the oncoming wind at these positions will be easily distorted and broken into small eddies (Hu, 2013). As such, the components and characteristics of the eddies are very different from those of the prescribed oncoming wind. As a result, the power spectra values in the low-frequency range will decrease, and the power spectra values in the middle frequency range will probably increase when compared with those of the prescribed oncoming wind. When the oncoming wind reaches points z1 and z2, though located in the open ground (shown in Figure 15), the components and characteristics of the eddies in the turbulent flow cannot restore themselves back to those of the prescribed oncoming wind in time. When the turbulent flow passes point z3 and reaches point z4, the turbulent flow has less influences by the blocking effect because the river course is relatively long and straight here. Although the large eddies of the turbulent flow will keep on breaking into small eddies due to the existence of the gorge terrain, the small eddies will restore to a state where no obstacles have evident effect, such that this state is similar to the prescribed oncoming wind state. As a result, the power spectra values in the middle frequency range at point z4 are closer to those of the oncoming wind, and the power spectra values in the middle frequency range at point z2 are different from those of point z4 and the oncoming wind. However, it should be noted that with the measurement positions moving away from the ground, the rolling terrain will have smaller effects on the characteristics of the turbulent flow at points z2 and z4. In such circumstances, the wind characteristics at points z2 and z4 mainly depend on the oncoming wind. Therefore, the whole power spectra values at points z2 and z4 are relatively close to each other. Especially, the power spectra values in the middle frequency range at points z2 and z4 are also close to those of the oncoming wind, as shown in Figure 16(c) and (d). The differences of power spectra values in the low-frequency range is mainly due to the fact that the large eddies break into small eddies during the process of the wind flowing over the rolling terrain, and they hardly restore themselves back to the prescribed state in time (Panofsky et al., 1982).
From the above analysis, to validate the applicability of the method by equations (12) and (15) for calculating the power spectra values for the infield gorge terrain model, the power spectra values at point z4 and the oncoming wind are chosen to study and compare. According to equations (12) and (15), the calculated wind power spectra at point z4 with typical measurement positions are shown in Figure 17, together with the corresponding wind tunnel test results. Here, the value of fc is also equal to 0.3, and the values of nc for each measurement position are also determined in the same way as those in the simplified gorge terrain. It can be seen from Figure 17 that the calculated wind power spectra are very close to the testing wind power spectra, indicating that the proposed calculation method by equations (12) and (15) is also applicable for calculating the wind power spectra values for the typical infield gorge terrain model. Therefore, it can be concluded that the simple practical calculation method by equations (12) and (15) is valid for the similar gorge terrains which are V-shaped, and the wind power spectra values at the gorge center can be calculated according to the wind power spectra of the oncoming wind and the mean square deviation ratio. Here, it should be emphasized that obtaining the wind power spectra values at the gorge center only requires the statistic value of the turbulent flow such as the value of the mean square deviation (or the values of mean wind speed and turbulence intensity). The time histories of the turbulent flow in the gorge terrain are not indispensable for applying this method. Considering the routine CFD numerical simulation method with a steady or unsteady turbulent flow can also obtain the values of mean wind speed and the turbulence intensity with a high accuracy (Cao et al., 2012; Hu et al., 2013, 2016) as discussed in section “Introduction.” The wind power spectra values at the gorge center could be obtained by the routine CFD method with relatively very low cost and very high efficiency. Therefore, using the proposed methodology, directly simulating the wind power spectra with huge grid number in the computational domain can be avoided.
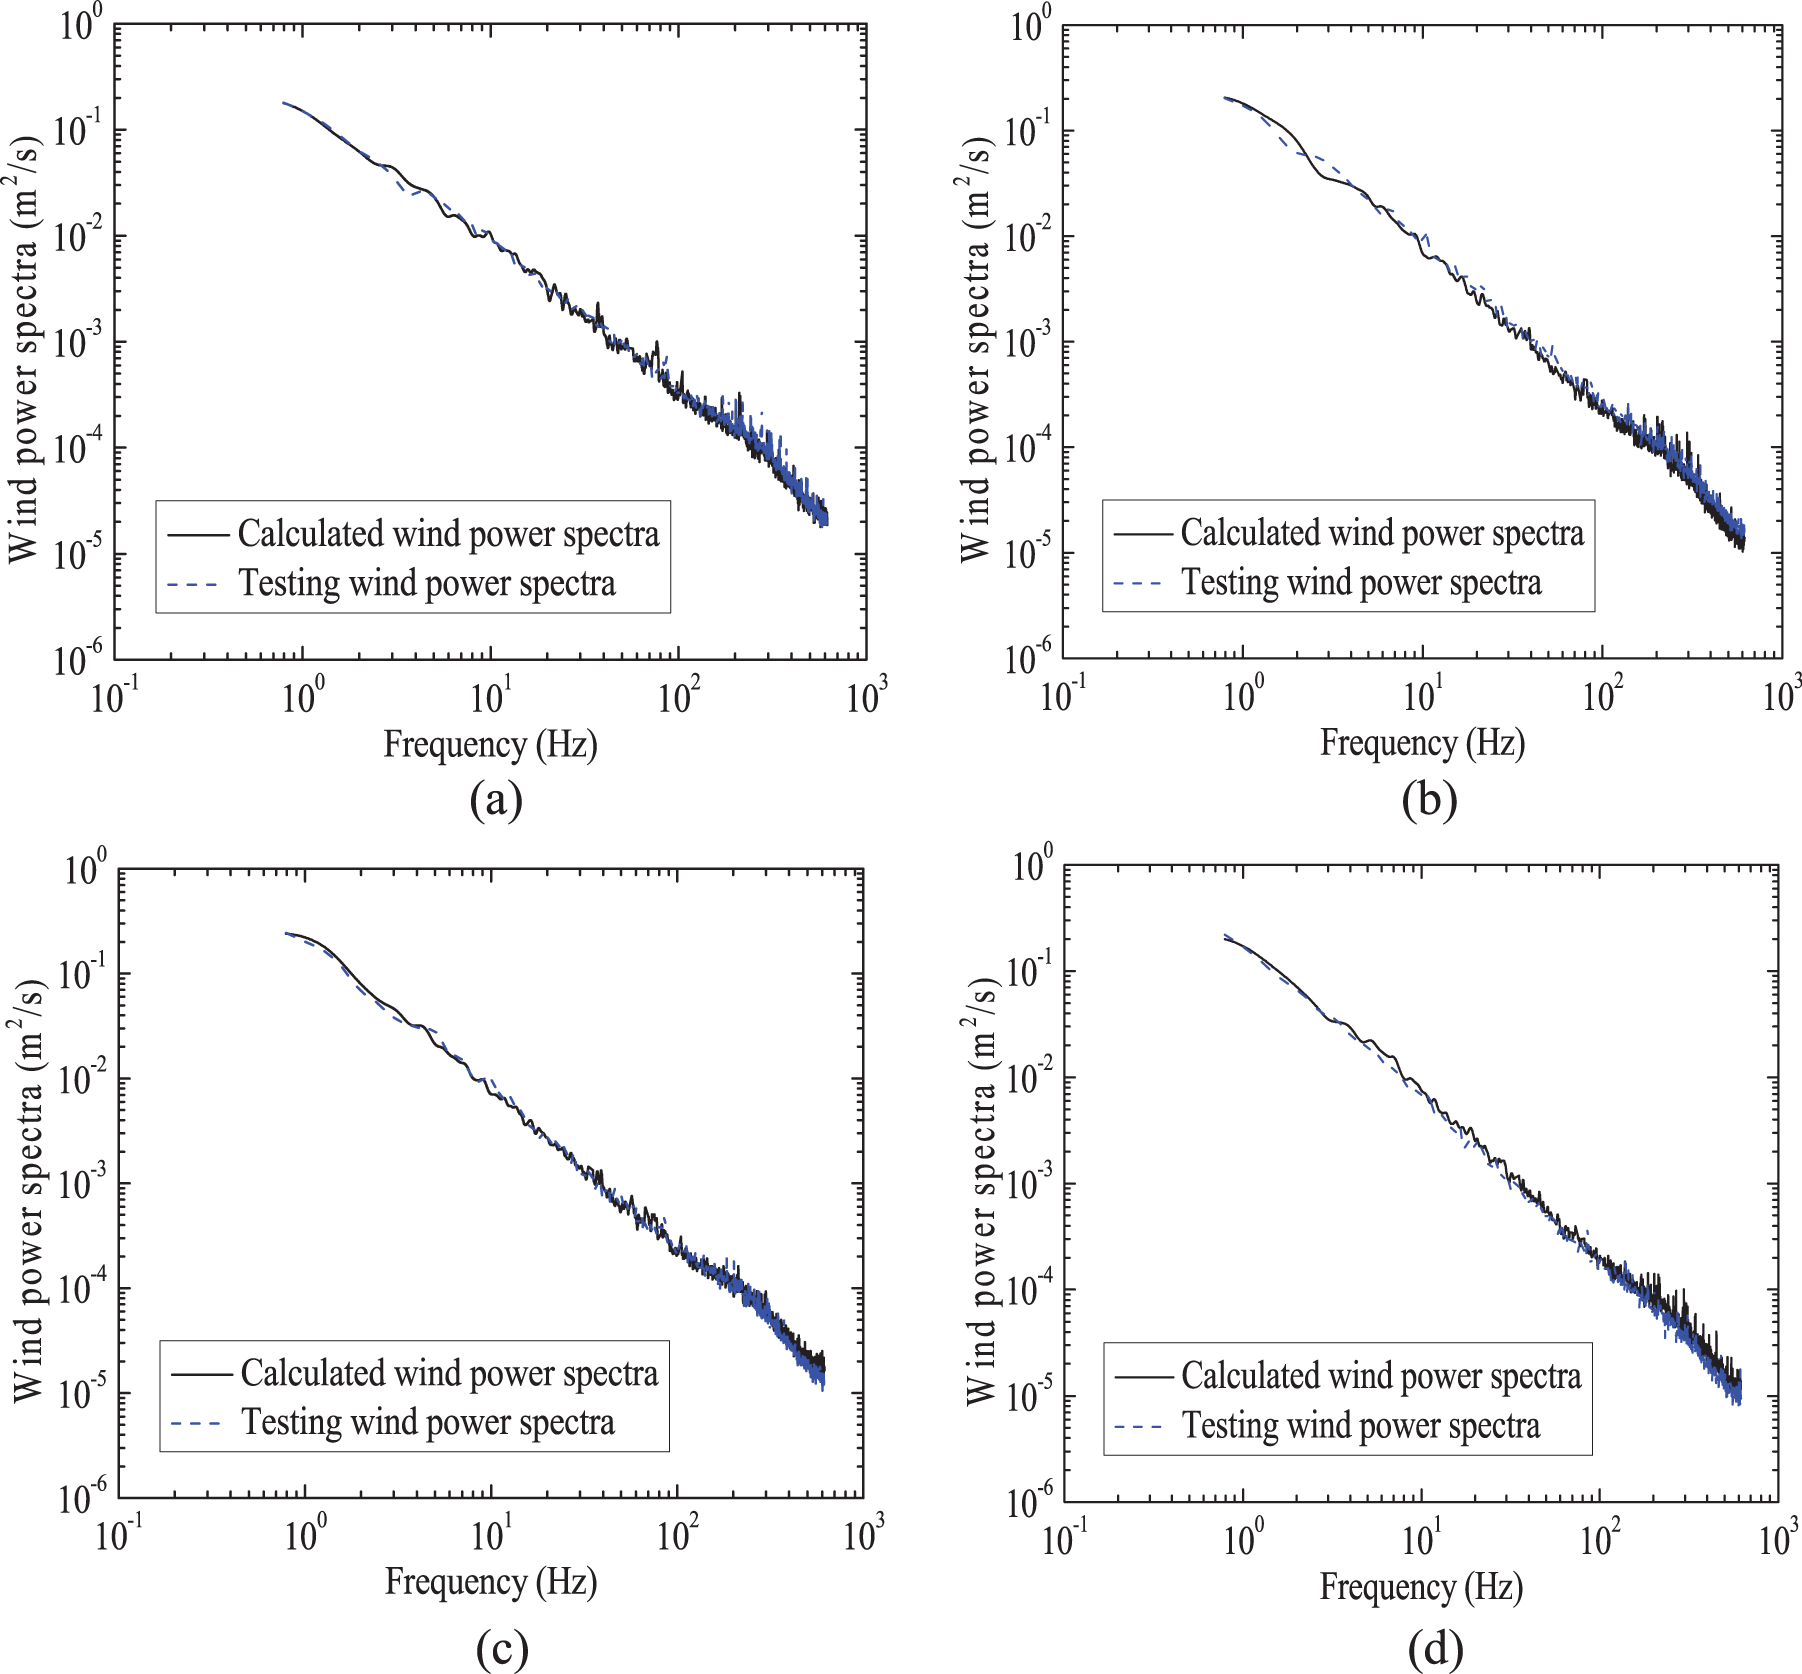
Comparison of calculated wind power spectra with the testing wind power spectra with several typical measurement positions moving from the ground: (a) 0.141 m, (b) 0.282 m, (c) 0.351 m, and (d) 0.492 m from the ground.
Conclusion
To investigate the fundamental characteristics of the longitudinal wind power spectra for representative gorge terrain models and to find a simple method to determine the values of the wind power spectra, a simplified V-shaped gorge terrain model and an infield deep-cutting gorge terrain model were introduced for the wind tunnel tests, and the characteristics of the longitudinal wind power spectra at these two gorge terrain models were analyzed. The main conclusions are summarized as follows:
For both the simplified V-shaped gorge terrain and the infield deep-cutting gorge terrain, the power spectra values in the low-frequency range become closer to those of the oncoming wind with the measurement positions moving away from the ground, while good agreements are always found in the high-frequency range for all the specified measurement positions.
Based on the relationship of wind power spectra values between the simplified V-shaped gorge center and the oncoming wind, a simple and practical calculation method which can directly calculate the power spectra values at the gorge center was proposed. More importantly, this method was also proven to be effective and applicable for the infield V-shaped deep-cutting gorge terrain. It is expected that this calculation method is also applicable for similar V-shaped gorge terrains in the engineering practices.
The proposed calculation method needs the minimum statistic value (refer to the mean square deviation) of the turbulent flow but not necessarily the time history of the turbulent flow at the gorge center. Since the statistic values of the turbulent flow can be obtained by the routine CFD method with high accuracy, the wind power spectra values at the gorge center could be obtained by the CFD method with relatively very low cost and very high efficiency. Therefore, through the proposed method, directly simulating the wind power spectra with huge grid number in the computational domain can be avoided, which provides a great convenience for the engineering applications.
Footnotes
Declaration of Conflicting Interests
The author(s) declared no potential conflicts of interest with respect to the research, authorship, and/or publication of this article.
Funding
The author(s) disclosed receipt of the following financial support for the research, authorship, and/or publication of this article: This work was financially supported by the National Natural Science Foundation of China under grant numbers NNSF-51408496 and 90915006, and it was also financially supported by the National Basic Research Program of China under grant numbers 2015CB057706 and 2015CB057701.