
Abstract
Performing forced vibration tests on full-scale structures is the most reliable way of determining the relevant modal parameters in structural dynamics, such as modal frequencies, mode shapes, modal damping, and modal masses. This study describes the modal identification of a double-level curved cable-stayed bridge with separate deck systems for pedestrians and vehicles via forced vibration tests. The steady-state structural responses to sinusoidal excitations produced by an electrodynamic shaker are recorded under varying excitation frequencies, and the frequency response functions are established. The measured frequency response functions are curve fitted to estimate the modal parameters. The numerical simulation of frequency response function–based modal parameter identification of an elastically multi-supported continuous beam structure is carried out, and the emphasis has been placed on the evaluation of the effect of an additional shaker mass, excitation frequency step and range, multi-mode vibration, and noise on identification results. Finally, the modal parameters for the first lateral mode of a double-level curved cable-stayed bridge are identified by forced vibration experiments, and the results are compared with those from ambient vibration tests and free vibration tests. The effect of the unmeasured wind excitation on identification is discussed. It is shown that the effect of ambient vibration is minor for wind velocity of 3–5 m/s. The damping ratios identified by forced and free vibration tests are comparable, while those from ambient vibration are subject to large variations. The modal mass obtained from forced vibration tests is in good agreement with finite element prediction, which provides design basis for mass-type dampers.
Introduction
The human-induced vibration and serviceability problem of lively footbridges have received wide attentions since the well-known example of the London Millennium Bridge (Dallard et al., 2001; Ingolfsson et al., 2012; Racic et al., 2009; Ricciardelli and Pizzimenti, 2007; Živanović et al., 2005). Increasing strength of new structural materials and longer span of new footbridges, accompanied by aesthetics requirements for greater slenderness, are now resulting in light and slender footbridges that are more sensitive to dynamic excitations. Thus, prediction of the responses of lively footbridges to dynamic loadings induced by walking pedestrians has become an indispensable ingredient for dynamic design of footbridges, which requires knowledge of the modal parameters of major importance, such as modal frequency, mode shape, modal damping, and modal mass. The information on the modal parameters is also crucial to development and implementation of effective vibration control for footbridges.
Performing actual vibration tests on full-scale structures is the most reliable way of determining the relevant modal parameters in structural dynamics, such as modal frequencies, mode shapes, modal damping, and modal masses. Dynamic tests for modal identification of full-scale structures can be generally classified according to the following three types: (1) ambient vibration tests, (2) free vibration tests, and (3) forced vibration tests. Ambient vibration tests based on measurement of small vibrations induced by actions of winds and vehicles provide an economical and convenient way to identify the modal parameters since the equipment required during tests is only for data acquisition. Under the condition of Gaussian stationary excitation, the modal parameters may be identified using output-only modal identification procedures, such as peak-picking method, frequency domain decomposition (Brincker et al., 2000), the natural excitation technique (James et al., 1995), complex modal indication function (Ni et al., 2005), random decrement method (Wang et al., 2014; Wu et al., 2012), and stochastic subspace identification (SSI; Van Overschee and De Moor, 1996). In free vibration tests, free oscillations are obtained by a large impulse or suddenly releasing the structure from an initial disturbance, and natural frequencies and modal damping ratios for target modes can be identified by least square method or covariance-driven stochastic subspace identification (SSI-COV) method (Magalhães et al., 2010). Both ambient and free vibration tests have been widely used in the modal parameter identification of footbridges (Bayraktar et al., 2009; Caetano et al., 2010a; Gentile and Gallino, 2008). Free vibration tests are usually performed under much more well-controlled conditions than ambient vibration tests and therefore provide improved results of the modal parameters in particular damping ratios. However, both methods cannot provide the information on modal mass, which is an important parameter for predicting the human-induced vibration and designing the mass-type dampers for vibration control.
In forced vibration tests, the steady-state structural responses subject to mechanical exciters are recorded under varying excitation frequencies, and the frequency response functions (FRFs) are established. In general, modal identification using forced vibration tests is a mature and standard technology in mechanical and aerospace engineering. However, it is rarely been used for engineering structures due to the requirement of heavy mechanical exciters, such as electrodynamic shaker. In the context of lightweight footbridges, it is practicable for forced vibration tests to identify the modal parameters (Caetano et al., 2010b; Dallard et al., 2001; Reynders et al., 2010; Živanović et al., 2006).
The Mianyang Bridge is a double-level curved cable-stayed bridge with a central span of 200 m and separate deck systems for pedestrians and vehicles. Due to large span of the pedestrian deck, it is prone to human-induced vibrations in the lateral direction at relatively low pedestrian density. To implement structural vibration control based on the tuned mass dampers (TMDs), accurate estimation of the modal parameters for the lateral modes is essential. This study describes modal parameter identification of the Mianyang First Bridge based on measurement of FRFs by forced vibration experiments. The classical FRF-based method of extracting the modal parameters is briefly presented to introduce the definition and procedure used in the study. The frequency responses between a reference point of steady-state harmonic excitation and a number of response measurement points are collected and then fitted to single-mode or multi-mode FRF by least square method to estimate the modal parameters. The accuracy of FRF-based modal identification is explored through numerical examples of an elastically multi-supported continuous beam with various exciter mass, excitation frequency step and range, multi-mode vibration, and noise. Finally, the modal parameters for the first lateral mode of the Mianyang First Bridge are identified based on forced vibration experiments, and the identification results are compared with those from ambient and free vibration tests.
Theoretical background
Modal identification using forced vibration tests is a mature and widely used technique in mechanical engineering and aerospace engineering (Ewins, 2000). The theoretical background of the FRF-based modal identification is briefly described for completeness.
FRF of dynamic systems
The equation of motion for an n-degree-of-freedom (DOF) viscous-damped linear system can be described as

where
The response of the system can be expressed in the frequency domain as

where H(ω) = [K + iωC − ω2M]−1.
Assuming that a harmonic force Fk(ω) is applied at the kth DOF and the response of the jth DOF is Xj(ω), the receptance FRF relating to the displacement response and input harmonic force is given as follows (Ewins, 2000)
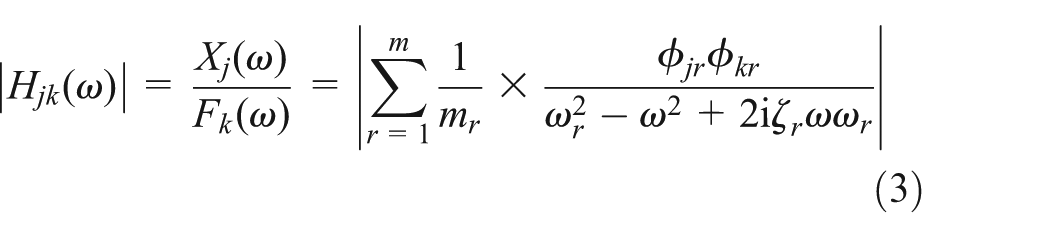
or
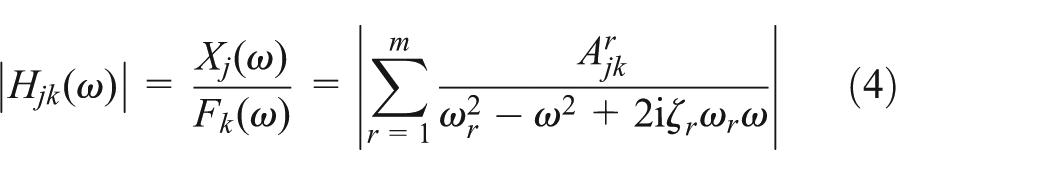
where ωr, φr, and ζr are the undamped frequency, mode shape, and modal damping ratio for the rth mode, respectively; mr = φrT
Dynamic tests using electrodynamic shakers
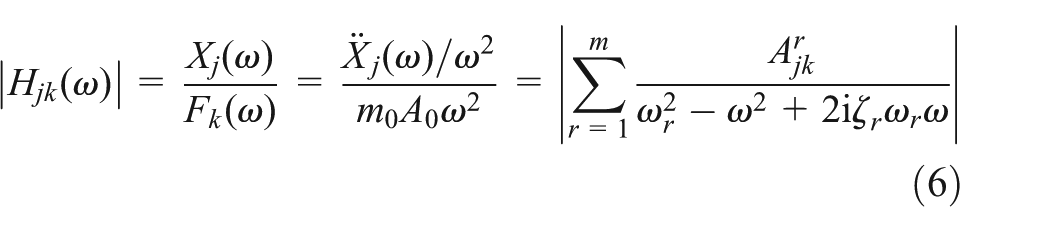
Some kind of shakers is necessary to generate the desired excitation forces when performing forced vibration tests. The electrodynamic shaker is employed in this study. The sinusoidal excitation force at the kth DOF generated by the electrodynamic shaker equals to the inertial force of the moving mass, which can be expressed in frequency domain as follows

where m0 (kg) and A0 (m) are the moving mass of the shaker and vibration amplitude of the moving mass, respectively; ω (rad/s) is the excitation frequency.
The recorded response is usually the structural acceleration at the jth DOF. So the frequency response amplitude function of receptance FRF is given as
The acceleration of the moving mass of the shaker is relative to the structure, so the motion equation of the coupled shaker–structure system can be written as
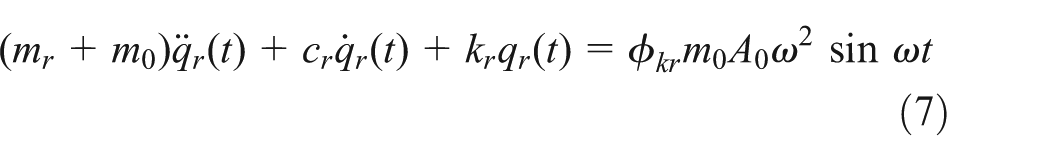
From equation (7), it is seen that the mass of the shaker can influence the dynamic properties of the structure under test. In practice, m0 is far less than mr, for example, Caetano et al. (2010b), m0 = 1200 kg and mr = 165,880 kg. Hence, the mass of the shaker has a small effect on the modal parameter identification.
Modal parameter estimation based on FRFs
The modal parameters are identified by curve fitting of equation (4) to the measured FRFs by nonlinear least square method. First, the steady-state structural responses to sinusoidal force produced by electrodynamic shaker are recorded under varying excitation frequencies, and the recorded input and structural responses are processed to establish the FRFs of the structure. Then, the measured FRFs are employed to identify the modal parameters based on nonlinear curve fitting.
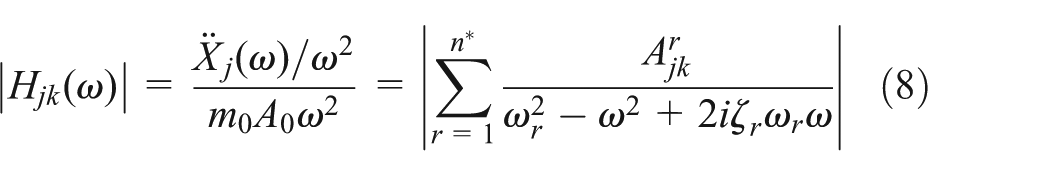
In practice, the frequency bandwidth of excitation is limited, that is, ω ∈ [ωa, ωb]. In this bandwidth, n* resonant responses are investigated, indicating that n* natural frequencies locate in this bandwidth. To reduce the unknown parameters, equation (6) is simplified to equation (8), in which only n* modes are superposed
The mode shape can also be estimated by placing N accelerometers at different DOFs including the DOF of exciting, and N modal constants

The phases of φr will be 0° or 180° for lightly damped structures or proportional damping cases, which can be easily obtained by comparing the sign of the response at kth DOF with that at jth DOF at the same time when the excitation frequency is nearest to the resonant frequency.
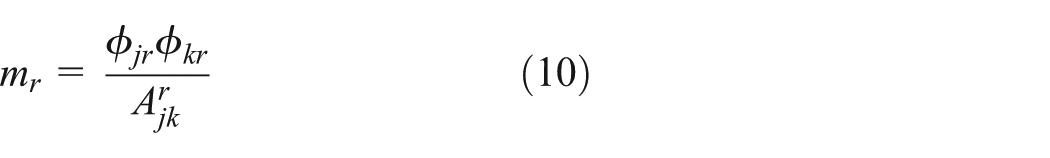
After obtaining the mode shapes, the modal mass can be estimated by the following equation
Numerical simulation
In this section, several numerical simulations are performed to demonstrate and verify the FRF-based method with emphasis placed on studying the effects of additional shaker mass, the excitation frequency step and range, multi-mode vibration, and noise.
Elastically multi-supported continuous beam
An elastically multi-supported beam, which has the characteristics of sinusoidal-type mode shapes and closely spaced frequencies for the first several modes, is designed, as shown in Figure 1. The beam spans 10 m and is supported by a total of 19 elastic springs evenly distributed along the span with the same stiffness of 60 N/m. The use of elastic springs is intended to simulate the closely spaced modal frequencies possibly encountered in real cable-supported or suspension bridge structures. The girder is made of a steel rectangular cross section with width of 0.2 m and depth of 0.004 m. The material properties are as follows: Young’s modulus E = 2.06 × 10¹¹ Pa and density ρ = 7850 kg/m3.
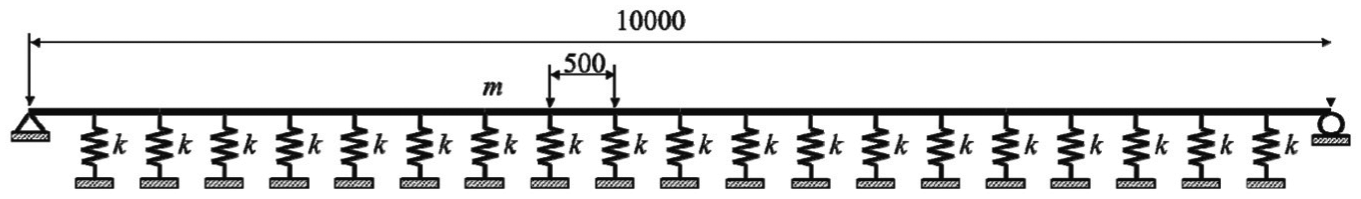
Elastically multi-supported continuous beam (mm).
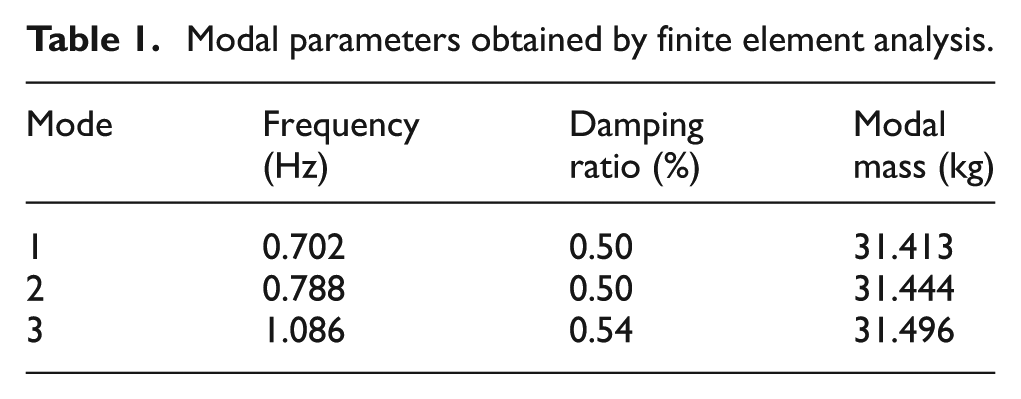
The damping is modeled by Rayleigh damping. Rayleigh damping coefficients are derived by determining the first and second modal damping ratios as 0.5%. An analytical modal analysis is carried out to estimate the modal parameters, as shown in Table 1. The numerical simulations are performed by frequency domain analysis or time domain analysis. The excitation force is given as F(t) = F0 sin(ωt), where F0 is unity, that is, F0 = 1 N.
Modal parameters obtained by finite element analysis.
Shaker mass
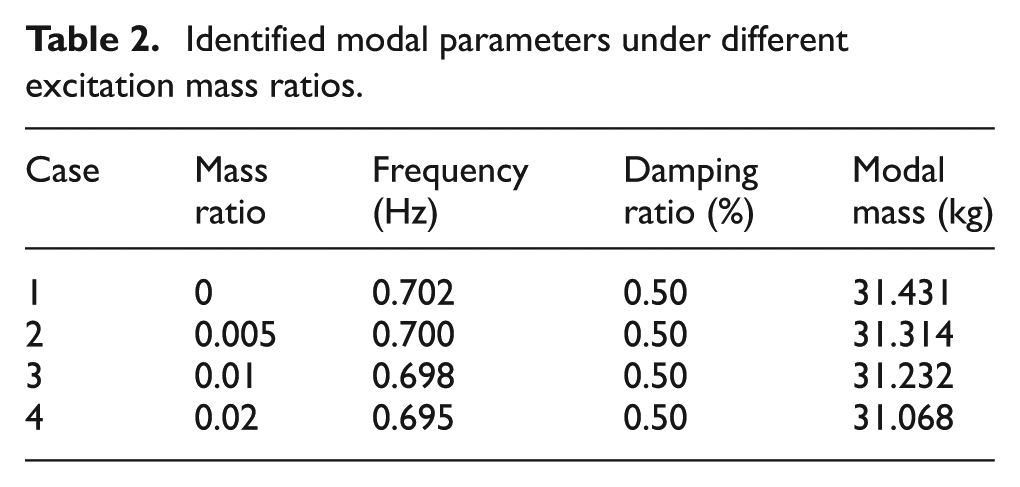
The shaker fixed on the structure has two effects: additional mass and excitation force. The additional mass induces changes in the dynamic characteristics of the structure. The shaker mass is given by mass ratio µ, where µ = m0/m1, in which m1 is the modal mass for the first mode. Harmonic response analyses, with different mass ratios, shaker fixed at the 1/2 span, exciting frequency range f ∈ [0.670, 0.730] Hz, and frequency step Δf = 0.004 Hz, are performed to obtain frequency response characteristics. Then the modal parameters are estimated by fitting frequency response characteristics to a single-mode FRF. The analytical and identified results for µ = 0 and µ = 0.01 are shown in Figure 2. The results are listed in Table 2. When µ = 0, the identified results are exactly the same as the analytical results, indicating that the FRF-based method is viable to accurately estimate the modal parameters. The accuracy of the estimated parameters degrades with the increase in mass ratio. Therefore, provided that the excitation force is sufficiently large to set the structure in vibration, a smaller mass is preferable and lead to more accurate results.
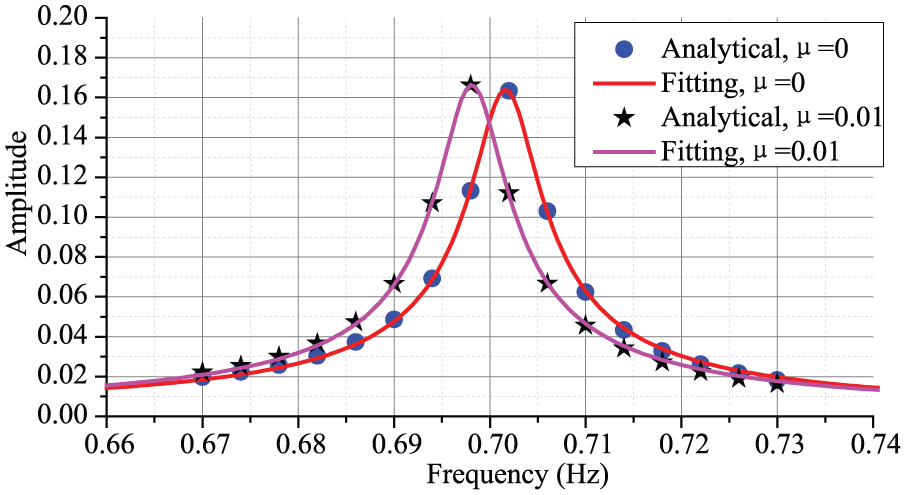
Frequency response functions for two mass ratios: µ = 0 and µ = 0.01.
Identified modal parameters under different excitation mass ratios.
Excitation frequency step and range
The minimal frequency step is limited by the design and manufacture of the exciter. For example, in Caetano et al. (2010b), the frequency step is 0.01 Hz. In theory, the smaller the frequency step, the higher the accuracy of the estimated parameters.
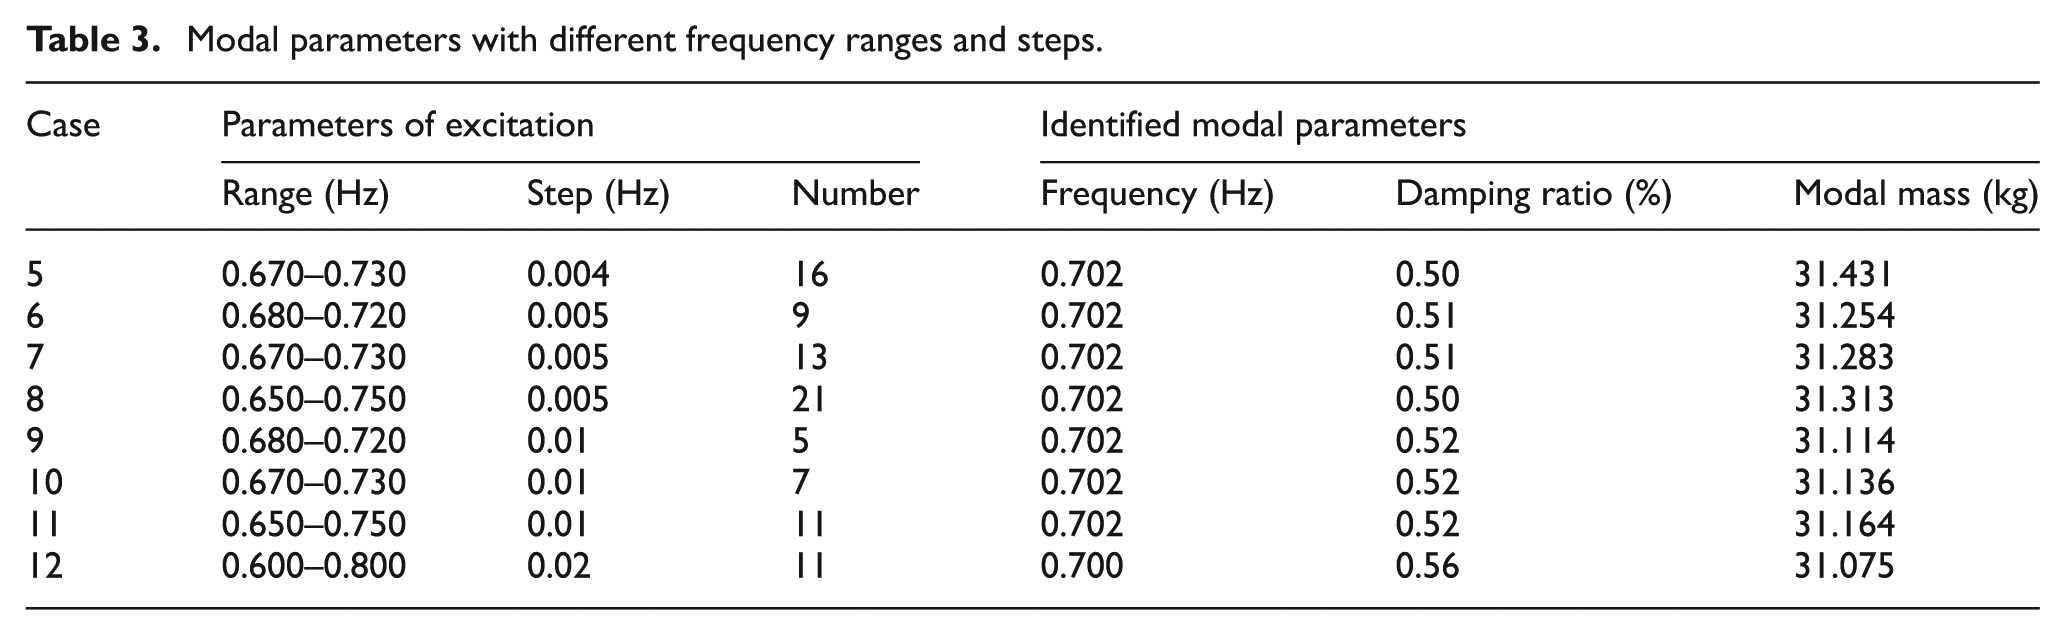
The excitation frequency step and range determine the number of the repetitive vibration exercise. Too wide range and too small step are uneconomical and time-consuming. Therefore, it is necessary to select a suitable range and step. The numerical identification results using different excitation frequency steps and ranges are shown in Table 3. It demonstrates that choosing suitable range and small step is important to obtain the modal parameters accurately.
Modal parameters with different frequency ranges and steps.
Multi-mode FRF
As shown in equation (6), the measured FRFs may be contributed by a number of modes. When the modes are sparse, the modal parameters can be estimated accurately by fitting the frequency response characteristic to a single-mode FRF. Because the displacement of the mid-span for the second mode vanishes, the first-order modal parameters are estimated accurately by fitting to single-mode FRF when the excitation force acts at the mid-span, as shown in Table 3. When the excitation force is applied at the 1/4 span, the FRF will be closely spaced frequency components. Therefore, the frequency response characteristic should be fitted to a multi-mode FRF.
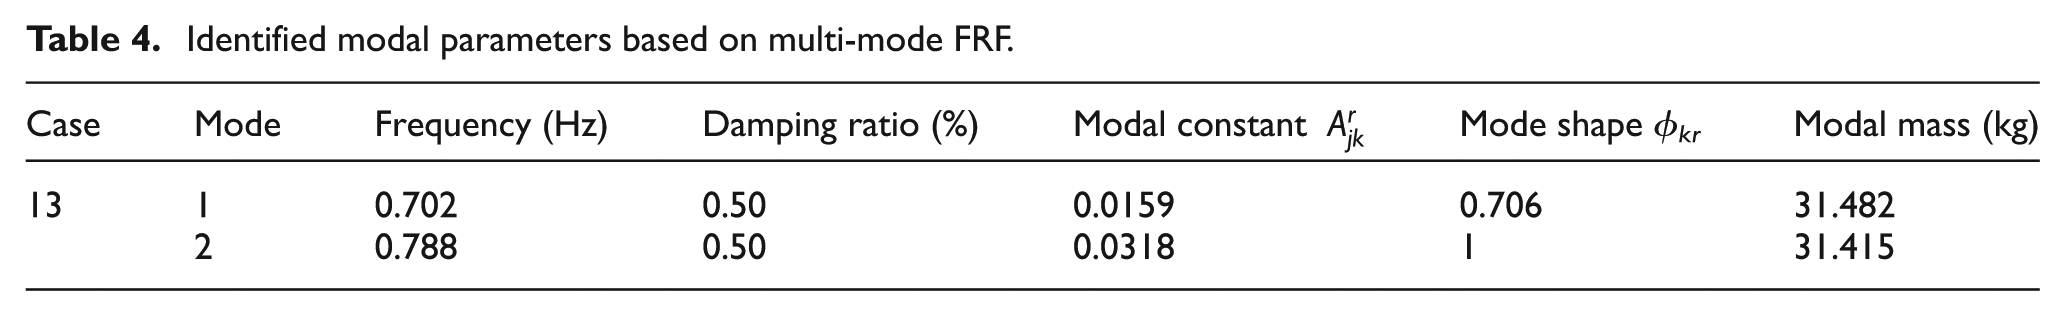
Harmonic response analyses are performed to obtain the frequency response functions by applying the sinusoidal excitation forces at the 1/4 span whose frequency range is from 0.67Hz to 0.83Hz with an increment of 0.005Hz, the results are shown in Figure 3. Then the modal parameters (Table 4) are identified by two-mode FRF. The identified mode shapes are shown in Figure 4. For multi-mode FRF, the method is remarkably accurate.
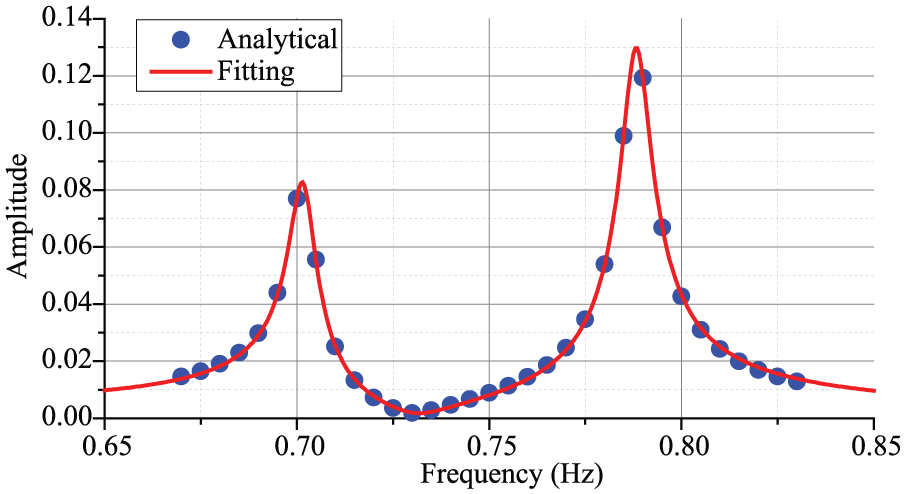
Frequency response functions with multi-mode (Hkk(ω)).
Identified modal parameters based on multi-mode FRF.
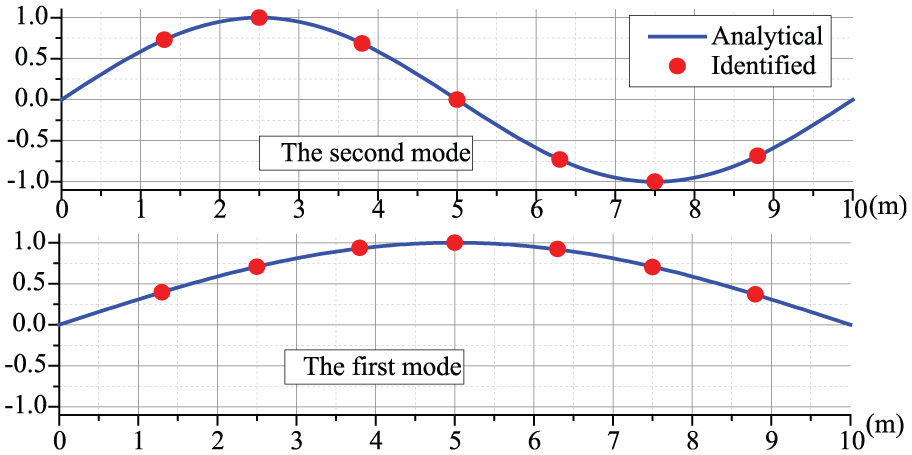
Identified mode shapes compared with the analytical results.
Effect of noise
In practice, the noise is unavoidable. In addition to the commonly encountered measurement noise, the unmeasured ambient vibration during forced vibration tests may be regarded as noise or imperfect excitation. Therefore, two types of noise are considered in simulation analysis: (1) zero-mean Gaussian white noise in excitation forces, which is simplified to act at the 1/4, 1/2, and 3/4 span, respectively and (2) zero-mean Gaussian white measurement noise, which is modeled by superposing it to the analytical response. The level of noise is defined by the noise-to-signal ratio R = σ y /σ x . For noise excitation R1, σ y and σ x are the root-mean squares of the responses induced by noise excitation and the shaker at the resonant frequency, respectively. For measurement noise R2, σ y and σ x are the root-mean squares of measurement noise and the steady-state response induced by the shaker at the resonant frequency, respectively.
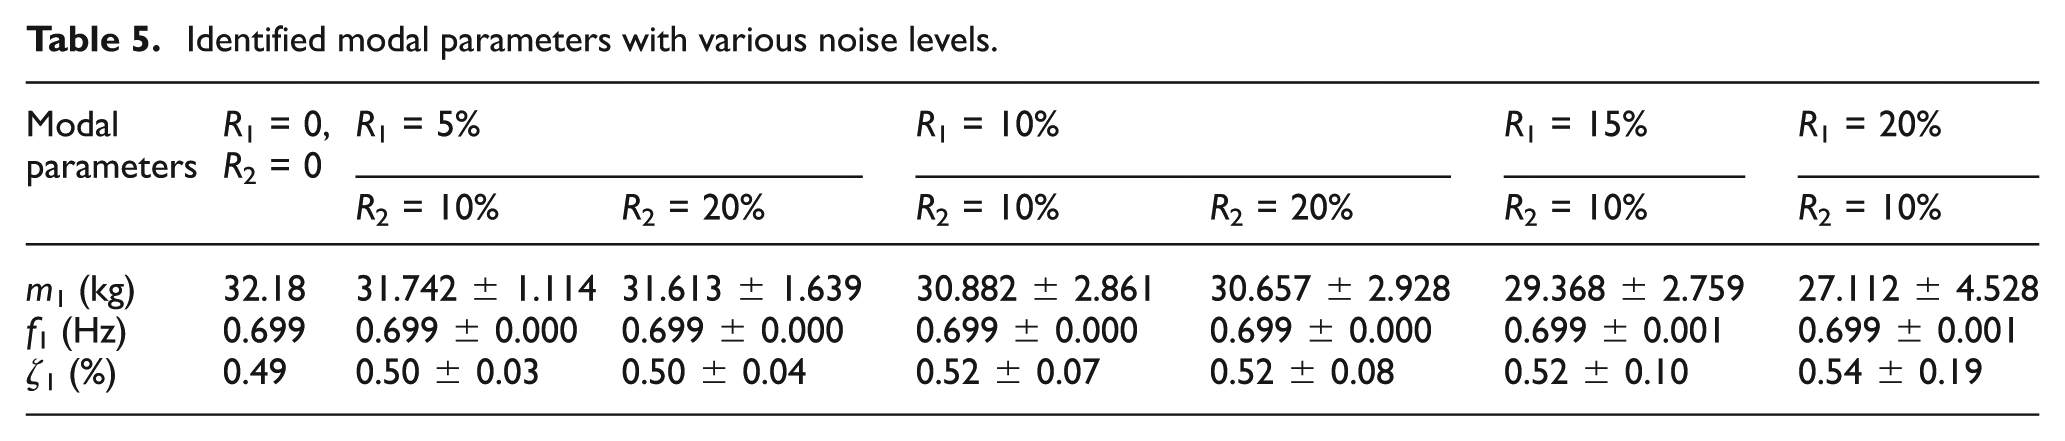
The steady response of the first 200 s, induced by excitation forces acting at the 1/2 span and noise, is analyzed. The frequency range and step are [0.670, 0.730] Hz and 0.005 Hz, respectively. The identified modal parameters are listed in Table 5. For each level of noise, 200 cases with different noise levels were conducted. The results are represented by the mean values and the distribution range with amplitude up to the standard deviation. It demonstrates that the FRF-based method is of acceptable accuracy when R1 and R2 are less than 10%. With the increase in the level of noise, the distribution range increases.
Identified modal parameters with various noise levels.
Case study
Description of the Mianyang First Bridge
The Mianyang First Bridge is located across the Fujiang River in the Chengnan New District of Mianyang, China. It is a curved cable-stayed bridge with a central span of 200 m and two side spans of 100 m, as shown in Figure 5. Figure 6 shows the view of the Mianyang First Bridge from a neighboring building. The distinctive feature of the bridge is the separate box-girder systems designed for the vehicles and pedestrians, respectively. Figure 7 illustrates the general cross sections for the roadway deck and pedestrian deck. The roadway deck carrying three lanes in each direction is a concrete box-girder with 28 m width and a central depth of 3 m; the pedestrian deck is formed by an orthotropic steel box-girder of 6 m wide and a depth of 2 m. The weight of the bridge deck including the pavement, crash barrier, and handrail is about 60 ton/m for the roadway deck and 5.0 ton/m for the pedestrian deck. The pedestrian deck is located above the roadway deck in elevation, and it roughly follows a shallow letter “S” in plan such that it goes through the roadway bridge from one side of its deck to the opposite side at the central span. The bridge girders resting atop pylons’ cross-beams and concrete piers are supported by their individual cable systems. Each inverted-Y pylon reaches 102.5 m high above its pile foundations, as given in the side view of Figure 5. The pylon is composed of a steel segment for anchorage of stay cables, a concrete segment, and a concrete–steel composite segment between them. The longitudinal viscous dampers are attached between bridge girders and cross-beams of pylons mainly for seismic purposes.
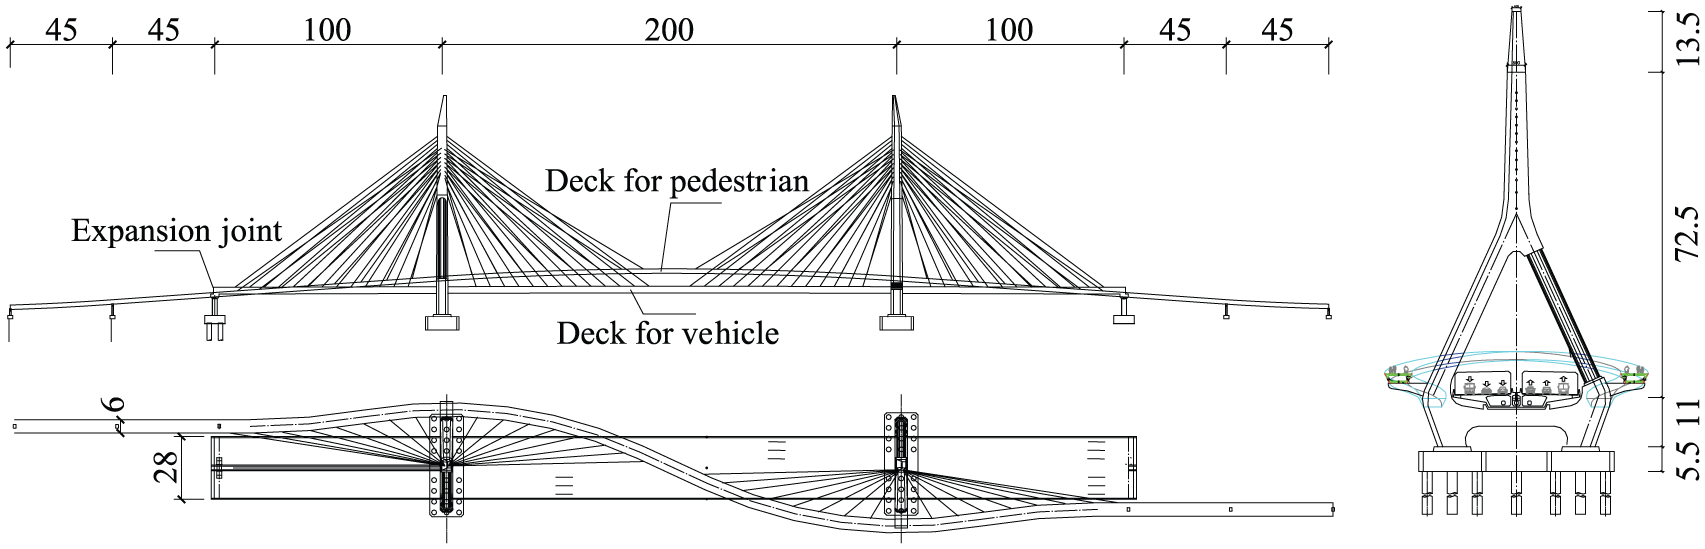
Elevation, plan, and side view of the bridge (m).

View of the Mianyang First Bridge from a neighboring building.
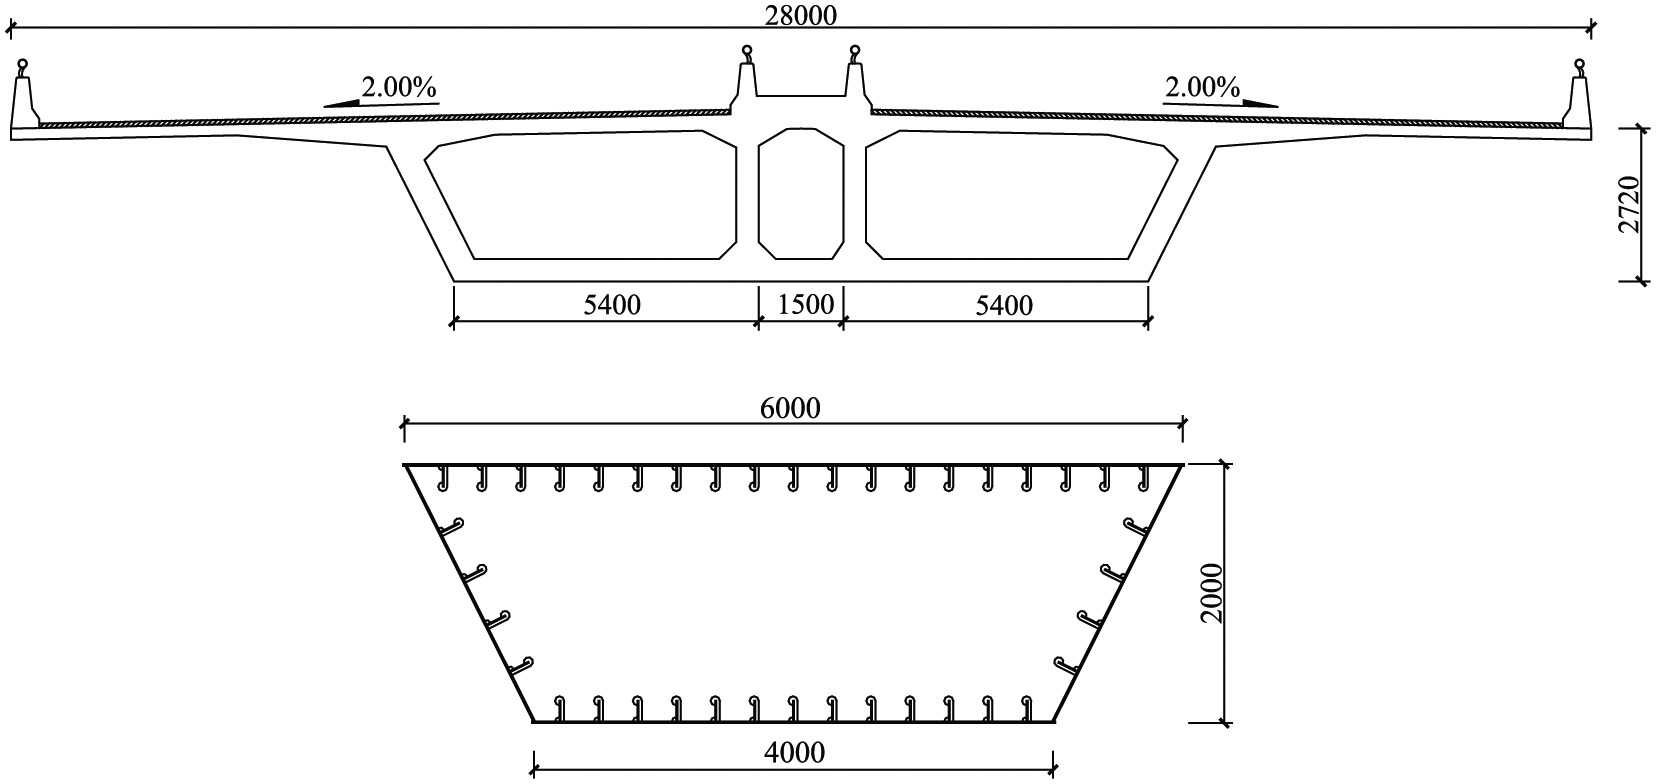
General cross sections of road deck and pedestrian deck (mm).
Due to high flexibility and curved appearance of the pedestrian deck, vibration severability has been taken into consideration at the design phase. A finite element model of the original bridge design scheme (without steel braces as will be discussed later) has been established for analyzing the human-induced vibrations. The numerical simulations show that the fundamental natural frequency for the lateral mode is only 0.60 Hz, which implies that the pedestrian deck may experience the synchronization of lateral excitation as found in the London Millennium Bridge (Dallard et al., 2001). Additionally, there are seven vertical modes whose natural frequencies fall in the forcing frequency of pedestrian dynamic loads. Field dynamic tests on the full-scale bridge confirm that the synchronization of lateral excitation occurs when the central span is occupied with a walking pedestrian density of 0.125 person per square meter, which is considerably less than the design value, 1.0 person per square meter. (Wen et al., 2016). After a comparison with vibration control scheme using only damping systems, a hybrid control strategy of stiffness upgrading and damping enhancement is used for the present bridge. The lateral and vertical stiffness of the pedestrian deck is strengthened by three pairs of steel braces linking the roadway deck and pedestrian deck at central span and both side spans. Then, the eddy current TMDs will be used to control the lively modes for the bridge with the steel braces. The layout of steel braces and TMDs is illustrated in Figure 8. Figure 9 shows the prototype of the vertical brace and the oblique brace at the central span. The use of the steel braces is intended to reduce the number of lively modes of the original bridge, therefore reducing the cost of structural vibration control system.
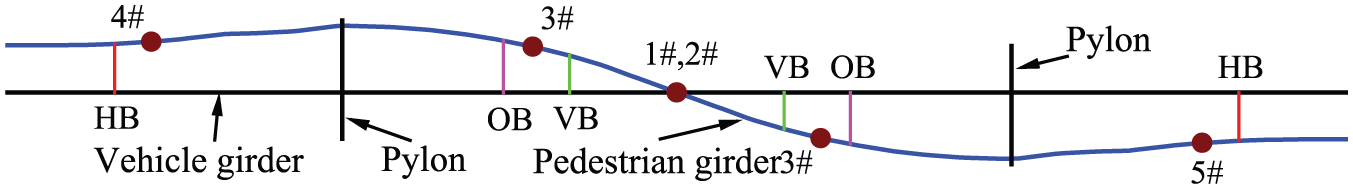
Layout of steel braces and TMDs: (1) HB, OB, and VB donate horizontal, oblique, and vertical brace, respectively and (2) 1# to 5# present the TMDs.
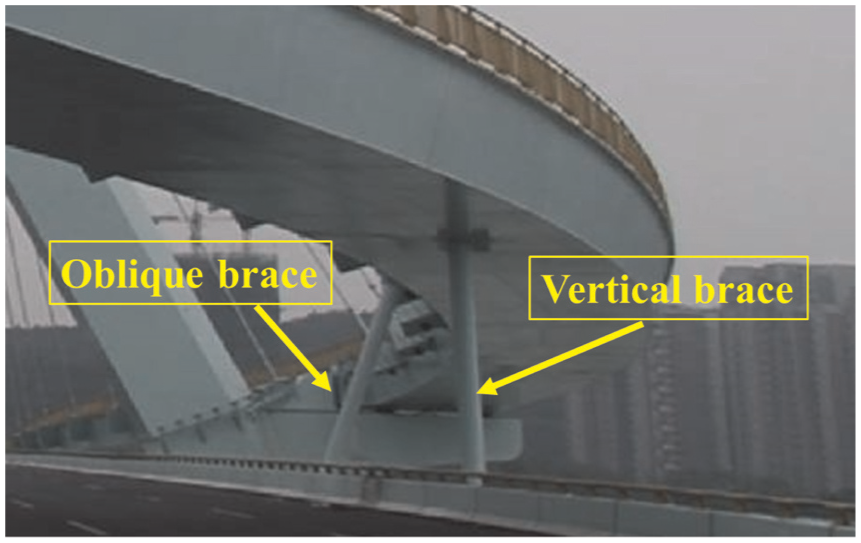
Prototype of the vertical and oblique steel braces at central span.
Finite element model of the bridge with steel braces
The lengths of steel braces are 8.65 and 9.53 m for vertical and oblique braces at central span and 7.06 m for horizontal braces at both side spans. Figure 10 shows the structural design drawings of steel braces. Each steel brace consists of a steel pipe with a diameter of 426 mm and a thickness of 10 mm and a high damping rubber pad of 80 mm thickness at both ends. The rubber pad is designed such that the connections between steel braces and girders behave like hinge, and it is also helpful to isolate the vibration of the roadway deck induced by passing traffic. The steel brace is prestressed using the high-strength strands inside steel pipe to guarantee it operates in compression. The brace is modeled as a series system of steel pipe and two 80-mm-thick rubber pads for accounting for the limited axial stiffness of rubber pads. As the axial stiffness of the rubber pad is significantly less than that of steel pipe, the equivalent stiffness is predominantly determined by the rubber pad. The equivalent axial stiffness is almost the same for three steel braces with different lengths and is calculated approximately as 16.6 M N/m, which is only a fraction of the stiffness of steel pipe.
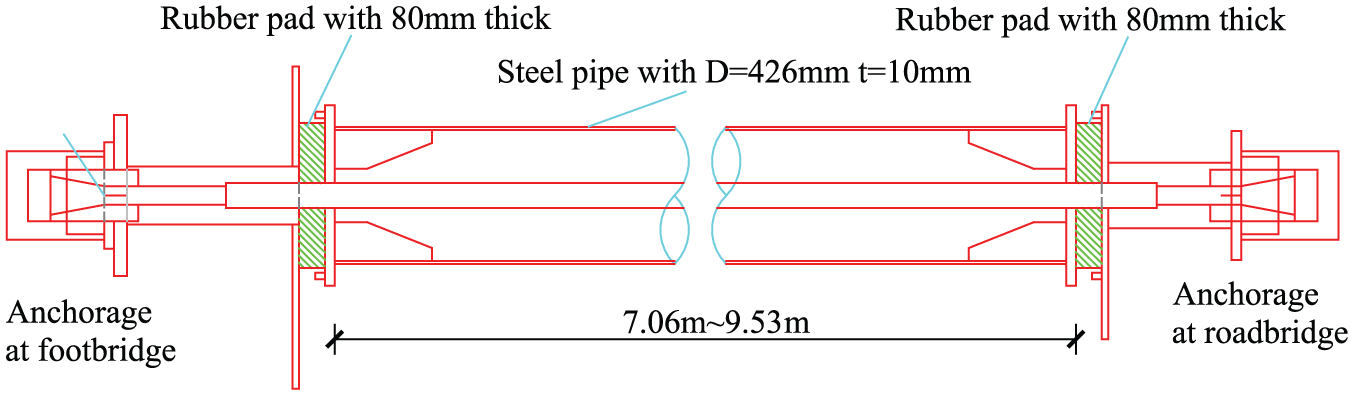
Structural design drawings of steel braces.
A spatial finite element model for the bridge with steel braces is established using the ANSYS FE package based on the design drawings for determining the modal properties. The bridge pylons and girders are modeled by the Timoshenko beam elements (BEAM44), and the stay cables are modeled by two-node cable elements (LINK8). The mass of handrail and pavement on the decks are considered in finite element modeling (MASS21), and their stiffness is considered negligibly small. The steel braces are modeled by the truss elements with the equivalent axial stiffness. Figure 11 shows the finite element model which consists of 646 elements and 469 nodes. The natural frequency and unity-scaling modal mass for the first lateral mode are 0.735 Hz and 470 ton, respectively, and the associated mode shape is shown in Figure 12. The natural frequency for the second lateral mode is well above 1.2 Hz and is not sensitive to human-induced vibrations.
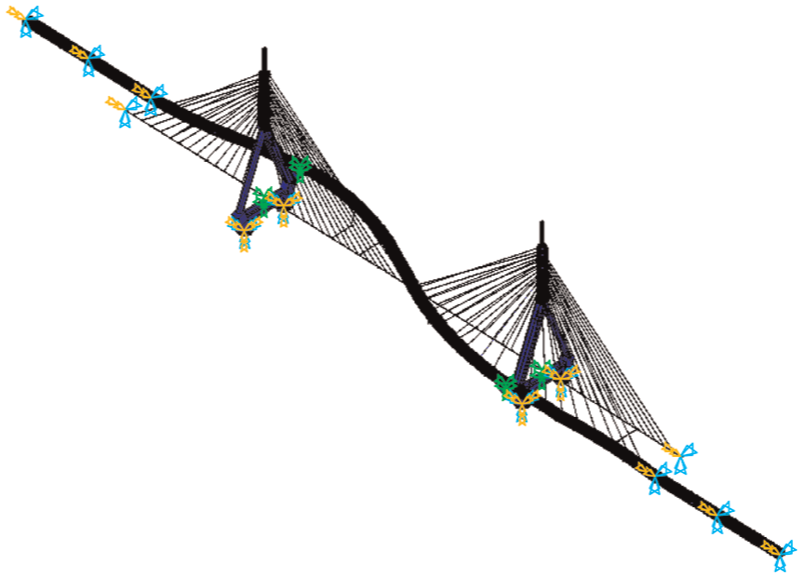
Finite element model of the bridge with steel braces.
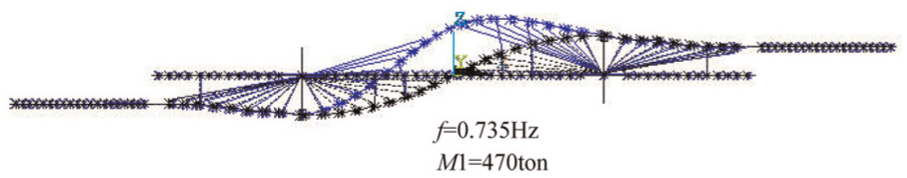
The first lateral mode of the bridge with steel brace.
Wind-excited ambient vibration and aerodynamic damping
A series of dynamic tests are carried out to identify the modal parameters of the bridge for fine tuning of TMDs as well as to evaluate the lateral and vertical vibration responses to different pedestrian group streams. The latter tests are described in detail by Wen et al. (2016). The dynamic tests for modal identification include ambient vibration test, free vibration test, and most importantly forced vibration test.
As the bridge has not been open to traffic and pedestrian during the dynamic tests, natural wind therefore becomes the main excitation source for ambient vibration. Due to the lightweight pedestrian deck, a question at the first glance is whether the wind could produce the obvious aerodynamic damping and therefore alter the total damping. Based on the force measurement results on the section model of the pedestrian deck, this can be approximately assessed with the quasi-steady theory (Scanlan and Simiu, 1996). For deck with constant depth of cross section of the pedestrian deck, the aerodynamic damping factor is given by
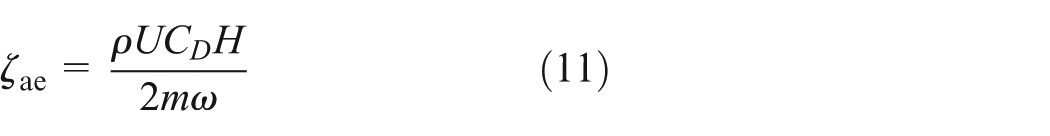
where the numerator is the aerodynamic damping coefficient, U is the mean wind velocity, CD is the drag coefficient of the pedestrian deck measured in the wind tunnel, H is the depth of pedestrian deck cross section, ρ is the air mass density, m is the mass per unit length of the pedestrian deck, and ω is the circular frequency of the mode under investigation. Figure 13 shows the 1:20 section mode of the pedestrian deck in the wind tunnel, and the measured drag coefficient in smooth flow is 1.97 at 0° wind attack angle. For a mean wind velocity of 5 m/s, the aerodynamic damping factor for the first lateral mode is evaluated as 0.05%. Therefore, it is concluded that aerodynamic damping is insignificant when the mean wind velocity is not high during ambient vibration tests. It is also implied that the variation in the measured total damping will not be significant due to the variation in incoming wind velocities.
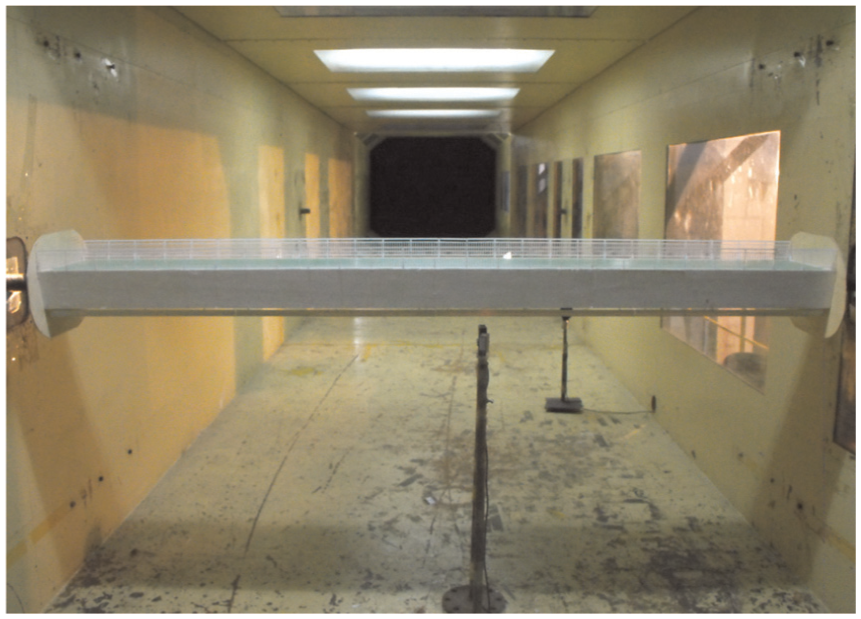
The section model of pedestrian deck in wind tunnel.
Several ambient vibration tests are also performed. The measurement acceleration responses of the pedestrian deck for the vertical and lateral directions at the middle of central span before performing forced vibration testing are shown in Figure 14. SSI is employed to identify modal frequencies and damping ratios from those ambient vibration responses. Figure 15 shows the stabilization diagraph of SSI for one typical ambient vibration data. The mean and standard deviation of damping ratio for the lateral modes are 0.76% and 0.21, respectively. The damping ratios obtained from ambient vibration tests have large variations.
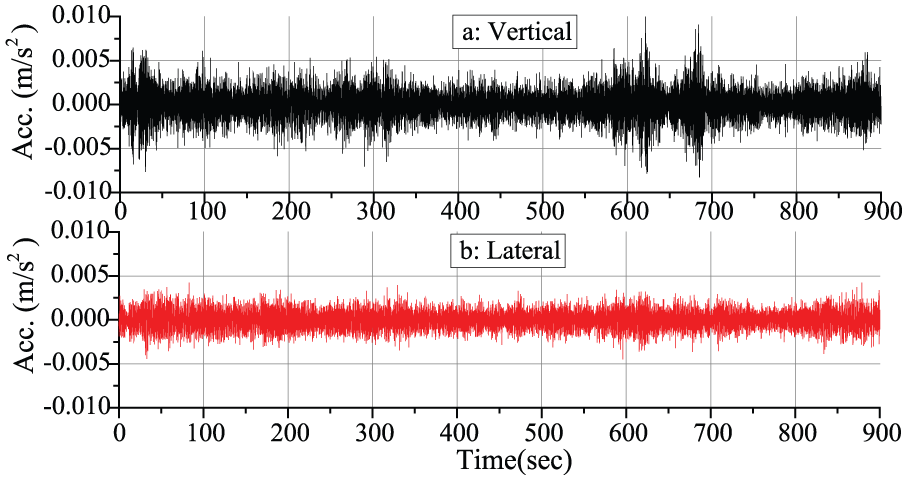
Acceleration responses of pedestrian deck at the middle of central span.
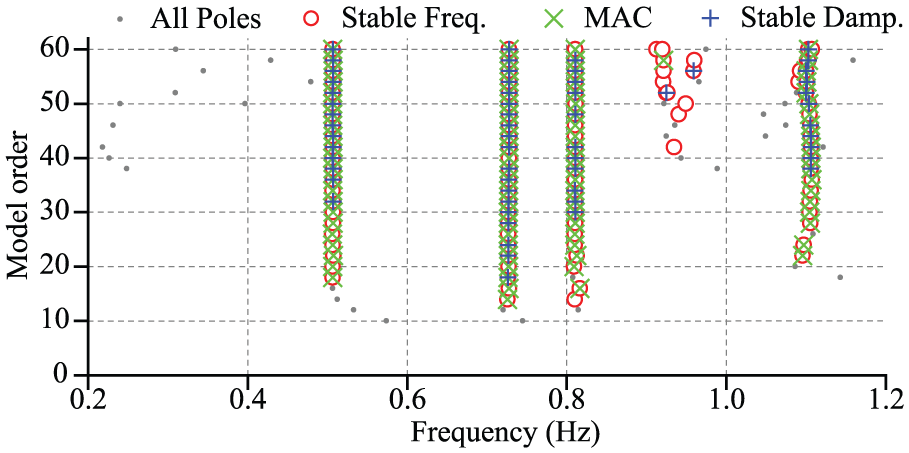
Stabilization diagram of SSI for ambient vibration responses.
FRF measurement and modal identification
Forced vibration test is carried out to establish the FRF for the first lateral modes, and the modal properties are identified by curve fitting. It is accomplished by the development of a self-made electrodynamic horizontal shaker, as shown in Figure 16. The shaker consists of a moving platform with additional mass and servomotor numerically controlled by a computer. It is capable of delivering sinusoidal force or random force, and the former is employed in this study. The excitation force equals to the product of the moving mass and its acceleration, and the moving mass includes the weight of the platform and the extra mass placed on the platform. The total moving mass is about 310 kg and the stroke is set to be 5.2 cm. The driving frequency of the shaker is automatically controlled by the computer, and it varies from 0.68 to 0.77 Hz after a first examination of ambient vibration data. The shaker is fixed on the middle of central span of the pedestrian deck where the displacement is the largest for the first later mode. DH610 transducers suitable for measurement of the low-frequency acceleration are used to record the mid-span lateral acceleration response of the pedestrian deck. Due to the curved pedestrian deck, it is worthy of noting that both the shaker and DH610 lateral transducer are oriented in perpendicular to the roadway deck, which is consistent to the global coordinate system used in the finite element model. Figure 17 shows data acquisition system and the transducers on the pedestrian deck.
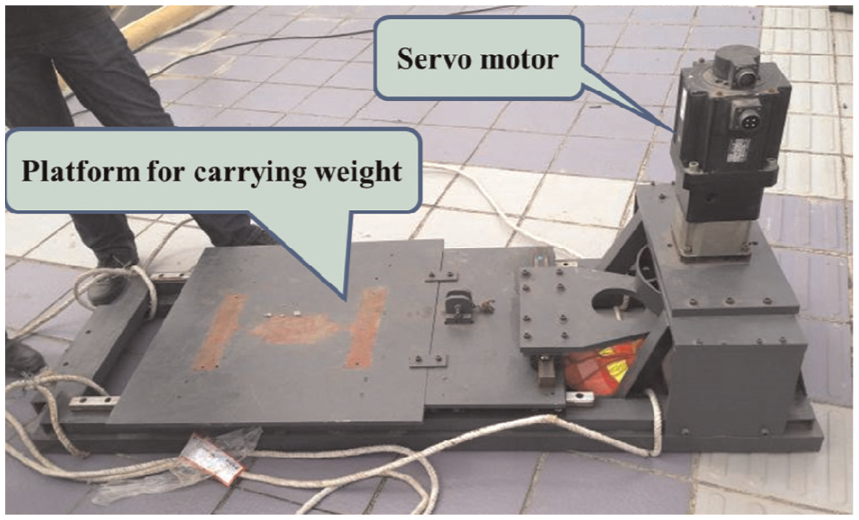
The horizontal vibration electrodynamic shaker.
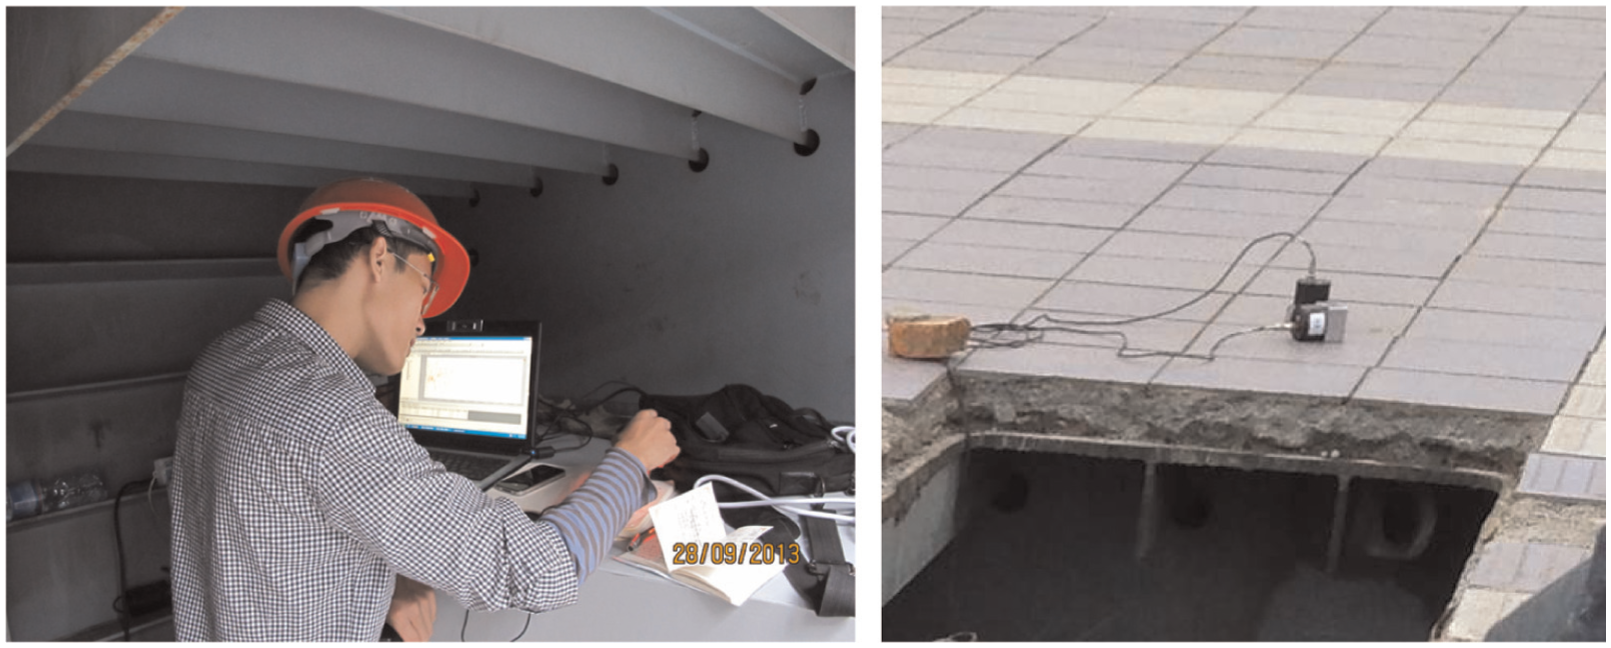
Data acquisition system and transducers on pedestrian deck.
The excitation frequency of the horizontal shaker varies from 0.68 to 0.77 Hz. The steady-state acceleration responses induced by different excitation frequencies and their power spectral densities are shown in Figure 18. There is a remarkable peak at each power spectral density (PSD) plot, and the frequency of the peak is the same as the excitation frequency rather than the natural frequency of the footbridge. Moreover, there are small peaks concentrated at integral multiples of the excitation frequency. The higher order harmonics present in the acceleration responses are due to nonlinear excitation force output from the shaker which is induced by harmonic distortion in sinusoidal signal generator. Therefore, the following procedure is used to obtain the FRFs: (1) the raw measurement data are processed using band-pass filters with the frequency range of 0.5–0.9 Hz and Hilbert transform, (2) the standard deviations of the processed data of integer number of cycles are estimated and the peak amplitudes of the accelerations are given by multiplying the standard deviation by a factor of
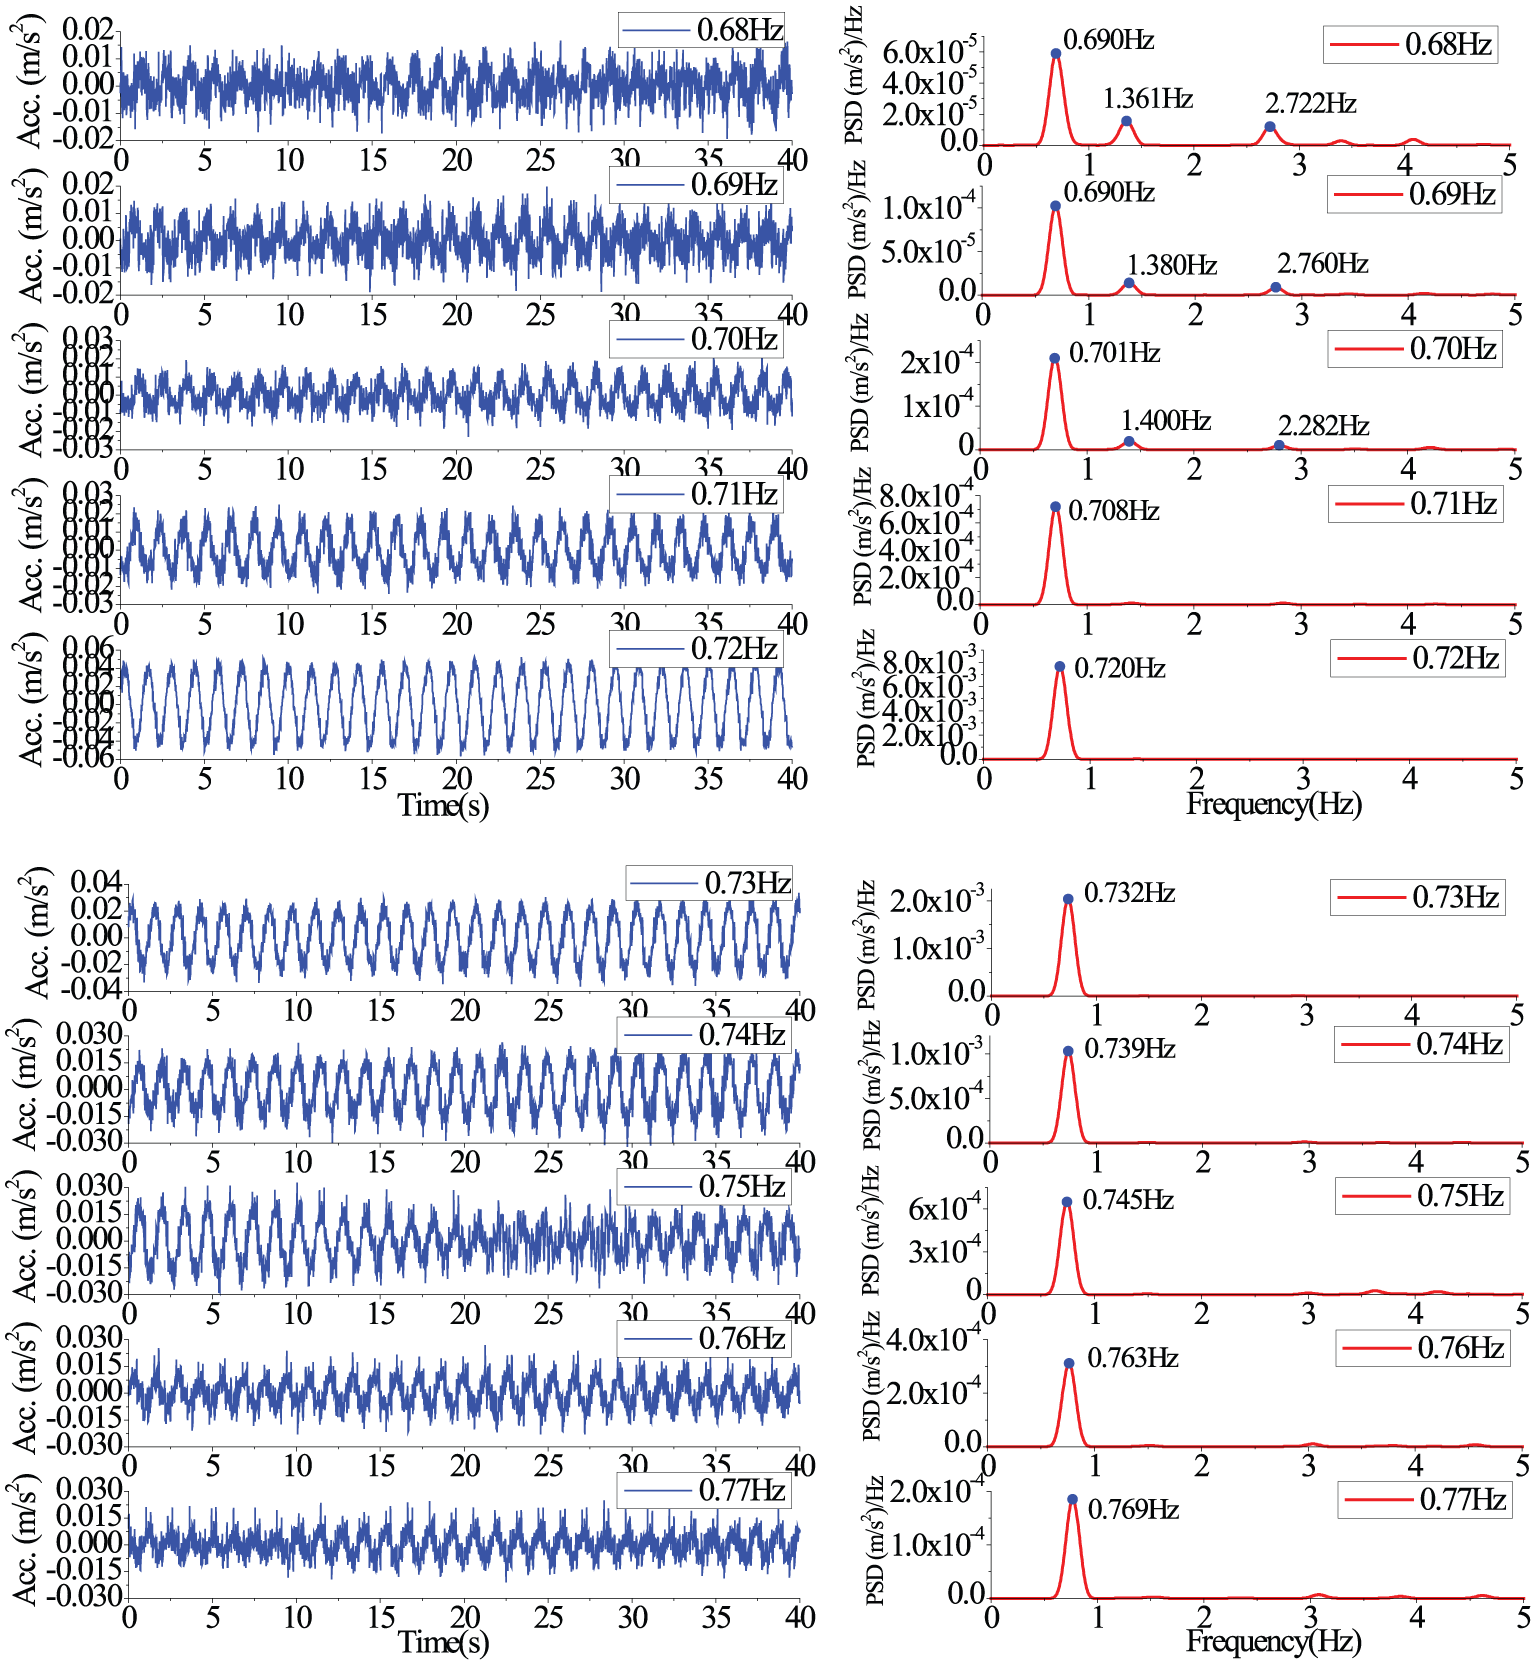
The steady-state responses and their power spectral densities.
Peak accelerations and displacements under different excitation frequencies.
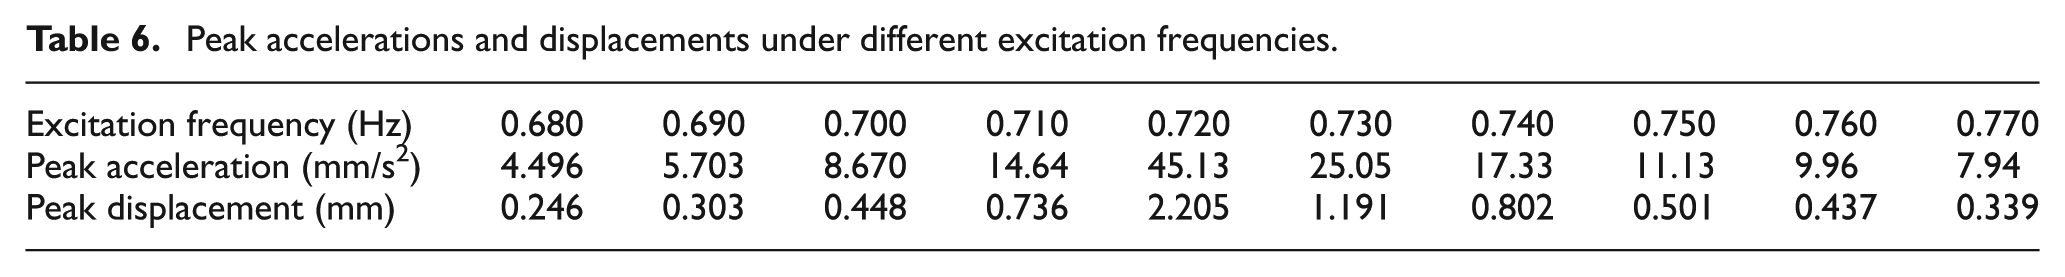
Figure 19 shows the FRF obtained from forced vibration experiments and its curve fitting based on the receptance FRFs. The natural frequency and the damping ratio for the first lateral modes are 0.723 Hz and 0.63%, respectively. The modal mass based on unity-scaled mode shape is 519 ton. As a comparison, the modal mass computed from finite element model is 513 ton for the footbridge with TMDs as extra weight. It is seen that the experimentally estimated modal mass from forced vibration tests is in good agreement with that from finite element prediction. The estimated modal mass for the lateral mode provides an improved design of TMDs, allowing for an accurate frequency tune of mass dampers.
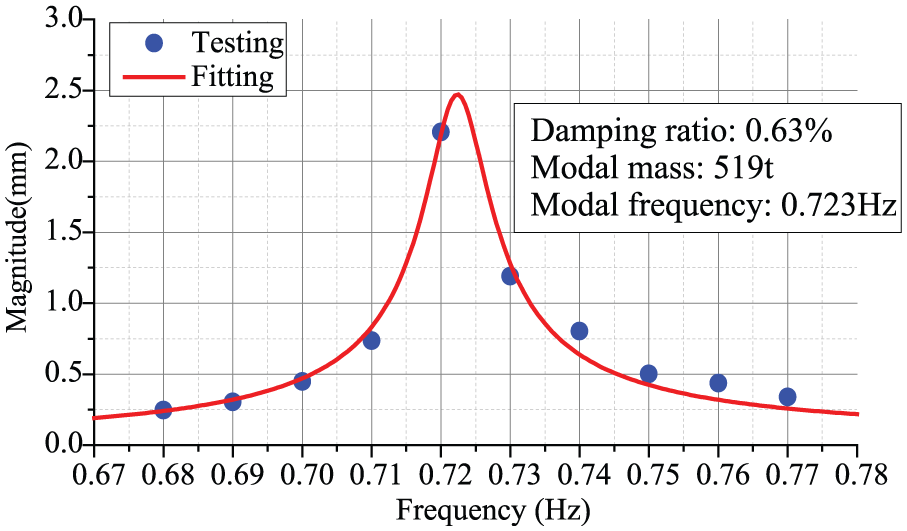
Frequency response functions.
During field forced vibration testing, the wind velocity is somewhere between 3 and 5 m/s, and the ratio of noise to signal is about 8% and less than 10%, which is calculated by the root-mean square of ambient vibration before forced vibration testing to that of forced vibration with excitation frequency of 0.72 Hz. It is believed that the effect of unmeasured wind excitation is not significant.
Comparison with ambient vibration and free vibration tests
The identification results from forced vibration tests are compared with those obtained from free vibration tests and ambient vibration tests. The modal frequency and damping ratio for the first lateral mode are estimated by least square method from free vibration tests and are identified by SSI from ambient vibration tests. The acceleration time history of free decay vibration is shown in Figure 20.
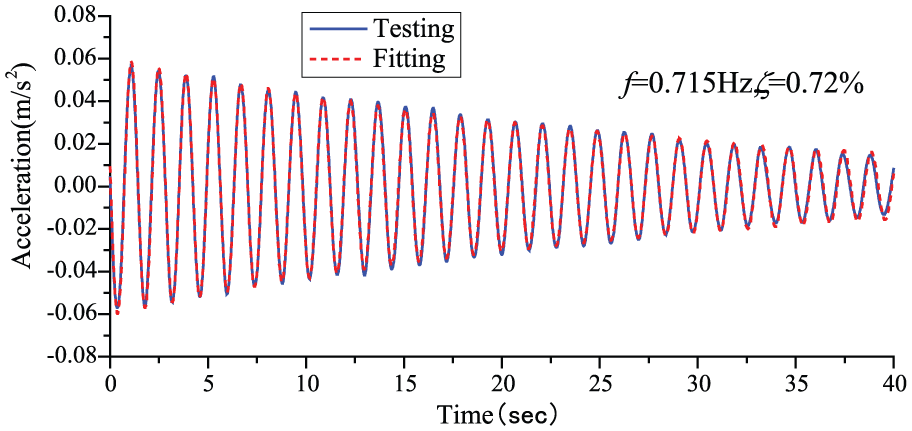
Free decay vibration of the first lateral mode.
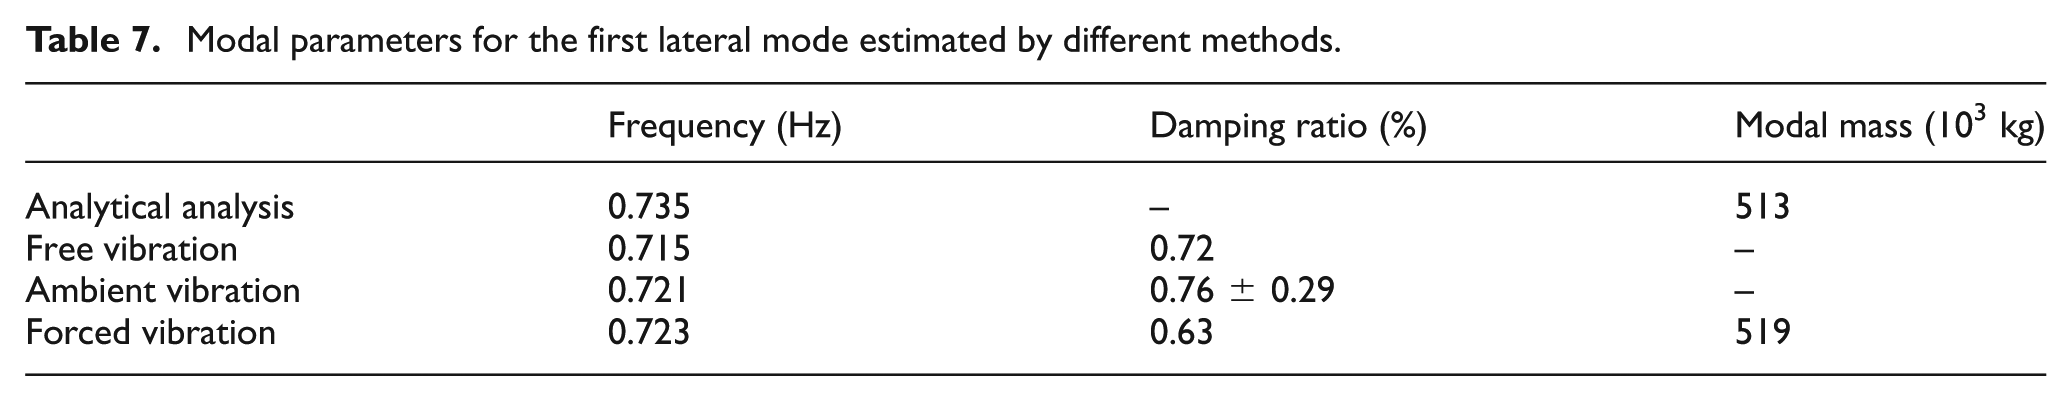
In those tests, the maximum vibration amplitudes of the footbridge are variable. The dynamic characteristics of the footbridge are of nonlinear relating to vibration amplitude. As a consequence, the modal frequencies and damping ratios estimated by these three methods are of slight difference (Table 7). The modal mass estimated by forced vibration test is identical to the modal mass predicted by analytical modal analysis. The result is helpful to predict human-induced vibration and design TMD optional parameters.
Modal parameters for the first lateral mode estimated by different methods.
Conclusion
An FRF-based method is implemented to modal parameter identification of a curved double-level cable-stayed bridge. The purpose is to identify the modal parameters, especially the modal mass, for predicting and suppressing the potential human-induced vibrations. The results from the simulation analyses show that (1) a small shaker mass leads to a more accurate result; (2) choosing suitable frequency range and small step of excitation force is important to obtain the modal parameters accurately; (3) the FRF-based method is of acceptable accuracy for modal identification when the noise-to-signal ratio is less than 10%.
The FRF-based method is used for a lively footbridge to estimate the modal parameters. The estimated modal mass allows for an accurate frequency tune of mass dampers.
Footnotes
Acknowledgements
The collaboration of the Bureau of Municipal and Rural Construction of Mianyang, in particular, Dr Xiao-xian Kang, is of special mention.
Declaration of Conflicting Interests
The author(s) declared no potential conflicts of interest with respect to the research, authorship, and/or publication of this article.
Funding
The author(s) disclosed receipt of the following financial support for the research, authorship, and/or publication of this article: This study was supported by the National Science Foundation of China (nos 51278189, 51422806, 91215302).