



Abstract
A nonlinear finite element method model for masonry infilled reinforced concrete frames was used to conduct a parametric study on the effects of reinforced concrete frame—masonry infill interface stiffness, aspect ratio of infill panels, pre-compression of frame, and the effect of different opening locations on performance of such frames. The used finite element method model was capable of detecting interface failure/separation between frame and infill besides computing forces and displacements in the frame and the masonry infill. Experimentally determined masonry infill panel material properties as well as interface stiffness values for different types of masonry infill blocks, interface locations, and field practices were used in the finite element method model. It was found that an increase in interface stiffness around all sides of the infilled frame was required for any positive impact on frame performance. Increasing the aspect ratio resulted in an increase in stiffness of infilled frame. However, increasing the pre-compression load did not affect frame lateral displacement for lateral load up to 40 kN. Afterward, it showed a decrease in 8%–37% for various levels of pre-compression. Openings in the infill reduced the infilled frame stiffness only when these were located in the path of the diagonal compression strut.
Keywords
Introduction
Infill masonry wall panels are used as internal partitions or external curtain walls within concrete and steel frames. Generally, these infill panels are treated as non-structural elements. However, when masonry infills are considered to interact with their surrounding frames, lateral stiffness and lateral load capacity of the frame increase considerably (Asteris, 2008; Stavridis and Shing, 2012). Experimental studies have shown that behavior of an infilled frame is heavily influenced by interaction of the infill with its bounding frame (Al-Chaar et al., 2002; Dias, 2007; Kakaletsis and Karayannis, 2008; Mehrabi and Shing, 1997, 2003; Shing et al., 1994). The Gap between infill and surrounding frame was found to be the most important parameter affecting the infill-frame behavior and unless this gap was not closed, the masonry infill contributed poorly to the lateral in-plane behavior of the frame (Moretti, 2015; Schmidt, 1989). Apart from the experimental investigations, a number of different analytical models (micro- and macro-models) have been developed to evaluate the infilled structures. Macro-models, first proposed by Smith (1966), use the idea of equivalent strut at the compressed diagonal. There are many empirical approaches to determine the effective width of a single equivalent strut (Goutam and Sudhir, 2008; Kakaletsis and Karayannis, 2008; Raghavendra et al., 2014) or multi-struts (Asteris et al., 2011; Lavanya et al., 2015; Moretti, 2015; Zybaczynski, 2014). The second class of analytical models, generically named as micro-models, relies on complex analysis using the finite element method (FEM) investigated by several researchers starting with Mallick and Garg (1971), Liauw (1972), Page (1978), Lotfi (1992), Shing et al. (1994), Riddington and Naom (1993), Stavridis and Shing (2008, 2012), Al-Chaar and Mehrabi (2008), Koutromanos et al. (2011), Syed et al. (2012), Kadid et al. (2013), and Pavone (2014). These models allow to better represent the interaction between masonry and frames, to take into account the local effects and to identify various modes of failure. Openings for door and windows in the masonry infill influence lateral load capacity. Mallick and Garg (1971), Dawe and Seah (1989), Aly et al. (2000), and Mohammadi and Nikfar (2013) experimentally investigated the effect of positions of openings on the lateral stiffness of infilled frames. Analytical studies on the effect of opening was conducted using macro-model (Albanesi et al., 2004), micro-model (Achyutha et al., 1986; Nwofor and Chinwah, 2012; Nwofor and Ephraim, 2014), and FEM models (Eshghi and Pourazin, 2009; Noorfard and Marefat, 2009).
In this study, a parametric study was carried out on a one-bay, one-story reinforced concrete (RC) frame with masonry infill under in-plane loading using two-dimensional (2D) nonlinear FEM model. Focus of the study was to investigate the performance of infilled masonry frames due to variation in (1) the interface stiffness between masonry panels and building frame elements, (2) aspect ratio (L/H) of infilled panel, (3) level of pre-compression, and (4) panels with different sizes and locations of opening. Use of a 2D FEM model was warranted in the study based on the work of Naom (1992), who compared the stress distribution in brick piers subjected to a uniformly distributed load using 2D plane stress and three-dimensional (3D) linear elastic finite element analyses. He found that both analyses produced similar in-plane and shear stress distributions.
The FEM model used in this study was capable of finding the frame displacement, lateral stiffness of the infill-frame, maximum bending moment in the top beam, and principle compressive stress at the loaded corner of the infill panel. Additionally, it was capable of predicting whether the interface between frame and infill was in contact, separated or slipping to simulate the possible detachment between the frame and the infill. In the FEM model, the infill panels were represented as smeared orthotropic elements with material properties assigned from experimental work (Essawy, 1988). The frame members were prismatic plane bending elements, while the interface elements were modified rectangular friction element that used stiffness values from experimental study of Hammoudah (1998).
FEM model used in the study
Basis of the analytical model
Awida (1988) developed a FEM model based on the work of King and Pandey (1978) for the analysis of infilled frames under lateral load. This model can calculate the internal forces and deformations of framed structures, taking into account the stiffness of the infill panel and the interface condition between the frame and the infill. In the FEM model of Awida (1988), the infill-frame was represented by three different types of finite elements: (1) the frame element, (2) the infill element, and (3) the interface friction element. Typical finite element idealization of the infilled frame is shown in Figure 1. A brief description of the structural behavior of the different types of the elements is given in the following:
The frame members were modeled as standard prismatic plane bending elements having 3 degrees of freedom (DOFs) at each node as shown in Figure 2(a). The stiffness matrix of this element is well known and is available in matrix structural analysis textbooks.
The infill panel elements were similar to that of Riddington and Smith (1977). These were idealized by isotropic, four-node, rectangular plane stress elements having 2 DOFs at each node as depicted in Figure 2(c).
The interface between frame and infill panel was represented by rectangular friction elements. The friction element had 3 DOFs at its nodes connected to the frame element and 2 DOFs at the nodes connected to the infill element as shown in Figure 2(b). The friction element takes into account the moments produced at the neutral axis of the frame element by shear at the interface. It was assumed that both normal and tangential displacements vary linearly along the length of the element. Stiffness matrix of the friction element depends on frame-infill interface properties.
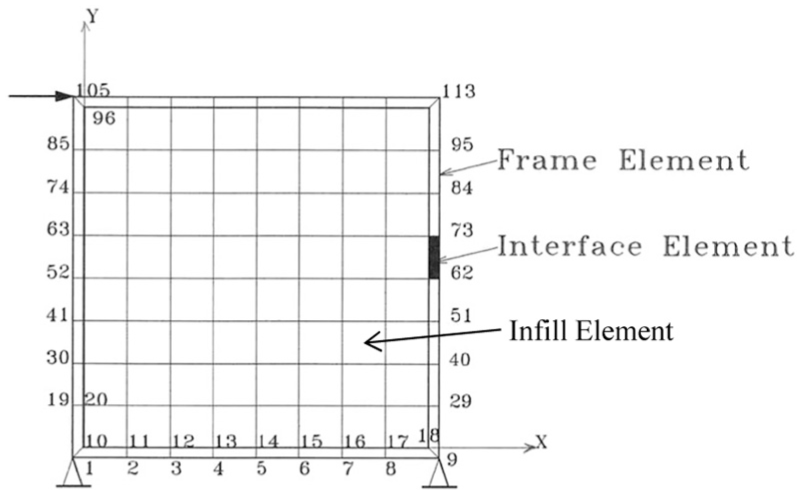
Typical FE idealization of the infilled frame.
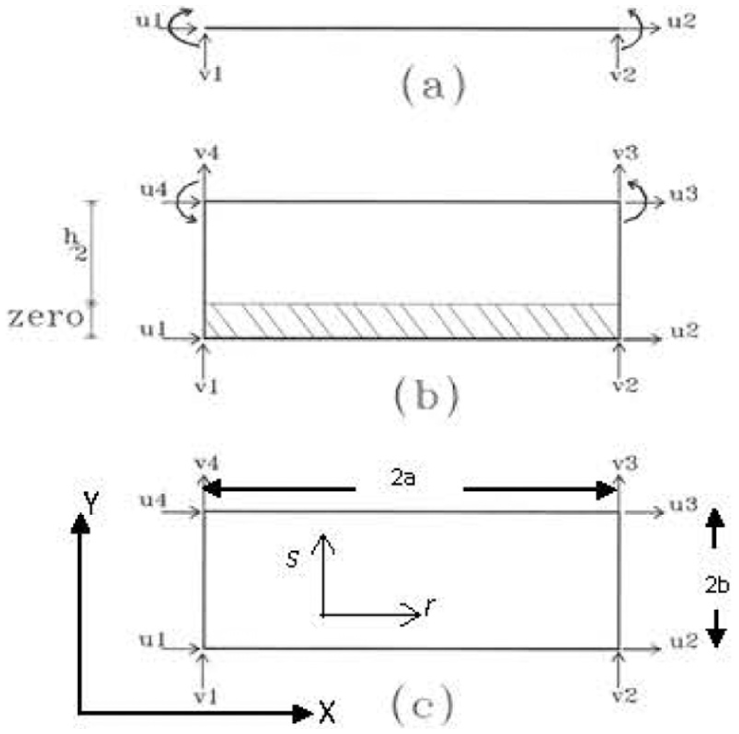
Elements used in the FEM model: (a) frame element, (b) interface element, and (c) infill element.
Refinement to the Awida model for orthotropic behavior
Major shortcoming of FEM model of Awida (1988) was that it did not consider uneven distribution of mortar joints in both directions of the infill plane, which made the infill panel acting as an isotropic material. In order to overcome this shortcoming, four equivalent elastic constants were required to be evaluated to represent the infill panel including two moduli of elasticity in the two principal material directions Ex and Ey, shear modulus, and Poisson’s ratio. To account for this change from isotropic to orthotropic panel, the stiffness matrix of the panel finite element was re-formulated.
The stiffness matrix of the four-node rectangular infilled element with 8 DOF per element in the global x-, y-axes and non-dimensional local r-, s-axes, as shown in Figure 2(c), is given as (Krishnamoorthy, 1995)

where dA = a b dr ds; h is thickness of the infill element; a is half the element length; b is half the element width; B is the strain matrix and is given as (Krishnamoorthy, 1995)

[D] is the matrix relating stresses to strains for orthotropic plane stress condition and is given as (Zienkiewicz and Taylor, 1975)

where n is the ratio between the two moduli of elasticity (E1/E2); E1 and E2 are the moduli of elasticity in the x-and y-directions, respectively; υ2 is Poisson’s ratio in the y-direction; G2 is the shear modulus of the material and m = G2/E2.
Equation (1) was evaluated in two steps. The first step was to multiply [B]T[D][B] and the second step was to integrate with respect to s and r over the range (−1 → 1) for each element. This operation yielded elements of the stiffness matrix [k] of the 2D orthotropic infill element, which are listed in Appendix 1.
Different values of interface stiffness at different interface locations were catered for by adding three loops in the computer program to accept three stiffness readings for each panel instead of one reading. Afterward, these values were arranged in the stiffness matrix as required.
FEM analysis procedure for interface conditions
Separation, slip, and frictional loss at the interface of frame and infill were detected and implemented by the following iterative procedure:
Initial analysis was carried out assuming full contact at the interface.
Axial force in the interface elements, Figure 2(b), was checked for tension. Any interface element with tensile force was delinked.
In the remaining length of contact, a check was made against occurrence of slip by computing the ratio of shear force to axial force and comparing it with the allowable coefficient of friction (taken as 0.6 per King and Pandey (1978)). If the ratio exceeded the allowed value, slip at the interface was allowed by introducing a structural hinge at the other end of the short link element connecting the bounding frame element.
At the same time, frictional forces equal to the coefficient of friction times the axial force were introduced at both the hinged nodes of the link elements but in the opposite directions.
The analysis was run again and checked for further separation and slip.
The iteration continued until no separation and slip occured and a stable configuration was obtained.
Geometric and material properties of frame and infill
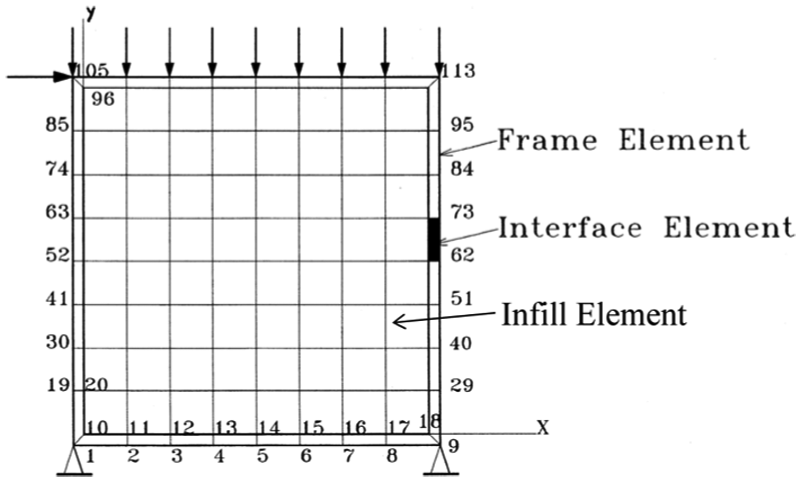
Examples of rectangular infilled frames presented herein were selected such that their dimensions and properties were within practical limits. The masonry infilled frame, as depicted in Figure 3, consisted of RC members of height (H) equal to 4.5 m and span (L) with one of the following four values: 2.5, 4.5, 6.5, or 8.5 m. Thus, the corresponding aspect ratio (L/H) for the clear infill panel varied between 0.5 and 2.0.

The investigated frame.
The frame had a square cross section of 0.25×0.25 m for beams and columns. The ratio between moment of inertia of the girder (Ib) and moment of inertia of the column (Ic) was chosen equal to one. Moment of inertia values were calculated for the gross concrete cross section ignoring the effect of reinforcing steel as well as cracking.
The analysis by the FEM is applicable to any type of end conditions. However, pinned ends were chosen as supports for the studied in-filled frames as shown in Figure 3.
The infill used in this investigation was solid block masonry which was assumed to be an orthotropic material. A total of 15 cases were investigated in this study. This included cases with different aspect ratios, different level of pre-compression load on the frame, and different opening size and locations.
The moduli of elasticity and Poisson’s ratio for masonry units were taken from test results on masonry units (Essawy, 1988). These constants were reported for concrete blocks as Eb = 19,660 MPa and υ = 0.3, where subscript “b” refers to “block.” The shear modulus was taken as: Gb = Eb/2 (1+υ) = 7561 MPa
For the composite material consisting of masonry units and mortar, the following values were adopted for the FEM models of the study (Essawy, 1988):
Ex=0.84 Eb=16,514 MPa (parallel to the bed joints);
Ey=0.59 Eb=11,600 MPa (normal to the bed joints);
Gxy=0.79Gb=5959MPa (shear modulus of elasticity);
υ = 0.2 (Poisson’s ratio).
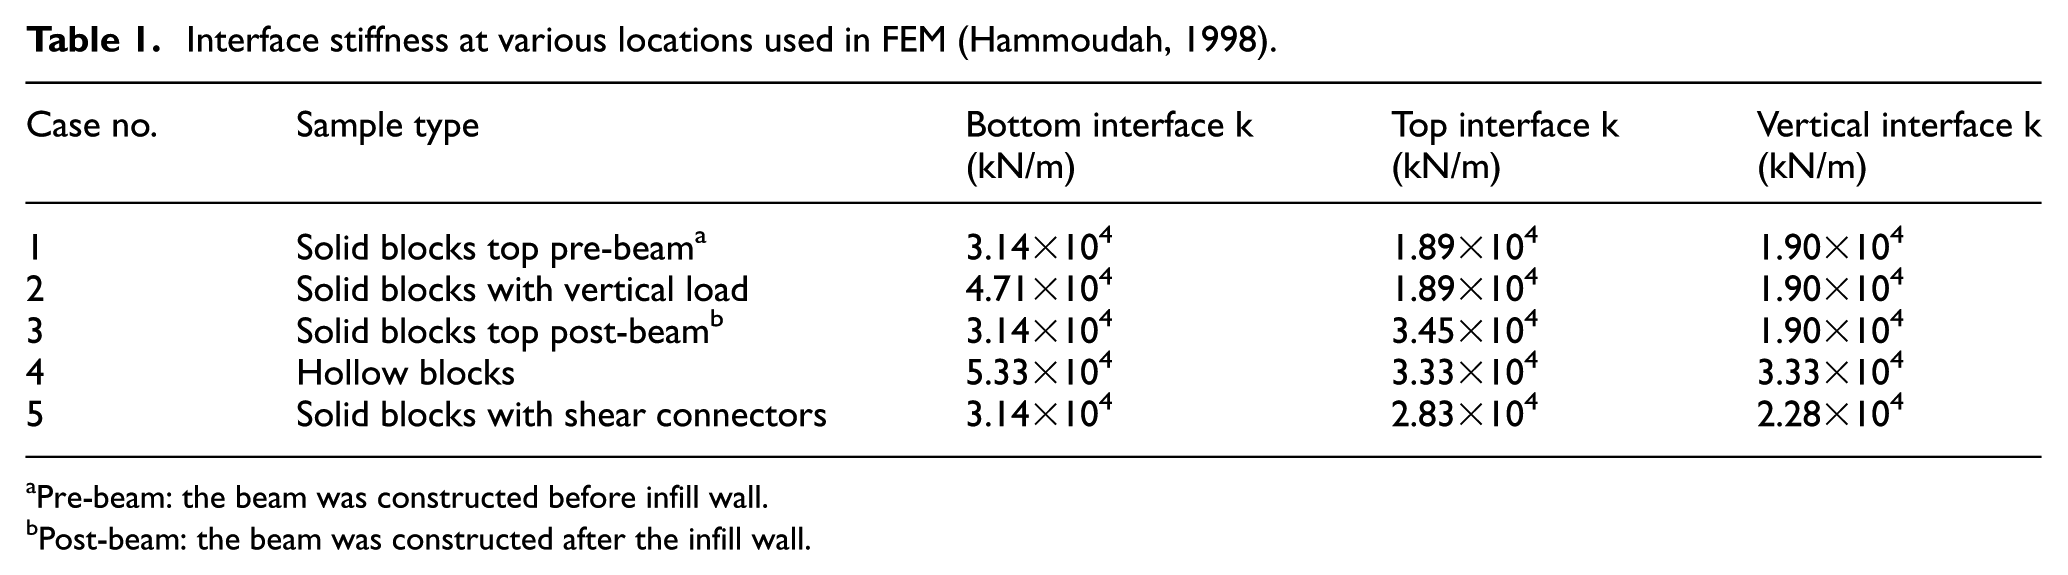
Interface normal stiffness (kn) for solid infill panel was taken equal to 2.1×10¹⁰ kN/m (Essawy, 1988), while the value of the interface shear stiffness (ks) was 0.314×10⁵ kN/m for bottom interface, 0.189×10⁵ kN/m for top pre-beam, and 0.19×10⁵ kN/m for vertical interfaces (Hammoudah, 1998).
Parametric study
This study examined the following parameters which affect the lateral load performance of rectangular masonry infilled frame:
Variation in interface stiffness due to different types of infill (solid and hollow concrete block masonry) and construction practices ((a) pre-beam in which RC frame is built first and then the infill wall, (b) post-beam in which top beam of the frame is built on the formwork of infill wall, and (c) use of metallic shear connectors between infill and RC frame elements on top and sides). Refer to Hammoudah (1998) for details;
Solid panel with different aspect ratios (L/H);
Solid square panels with different levels of pre-compression;
Solid square panels with and without openings.
All studied cases or conditions were subjected to 80 kN concentrated lateral load applied incrementally at the top left corner of the frame. For each investigated case, the following items were noted:
Lateral frame displacement under the loaded point (Δ);
Lateral stiffness of the frame (k) with infill;
Maximum bending moment in frame top beam (M);
Principle compressive stress at the loaded corner of the infill panel (σ);
Failure propagation.
Effect of interface stiffness variation
Hammoudah (1998) experimentally determined the interface stiffness for various types of blocks and construction practices and the values are listed in Table 1. These values were used to investigate the failure pattern of a single square frame as depicted in Figure 3 for incrementally applied lateral load.
Interface stiffness at various locations used in FEM (Hammoudah, 1998).
Pre-beam: the beam was constructed before infill wall.
Post-beam: the beam was constructed after the infill wall.
Failure propagation pattern
Figure 4 shows the typical failure propagation example at the interfaces during the first three steps of incremental loading for Case 1. Slippage of the infill segment occurred at mid-span of all sides in the first step. Then in the second load increment, it transferred to separation at the top side first and finally, in the third increment, all sides were separated and full contact was only at the two corners of the diagonal strut.

Failure propagation at interface for different loading stages for square panel.
Load–displacement behavior
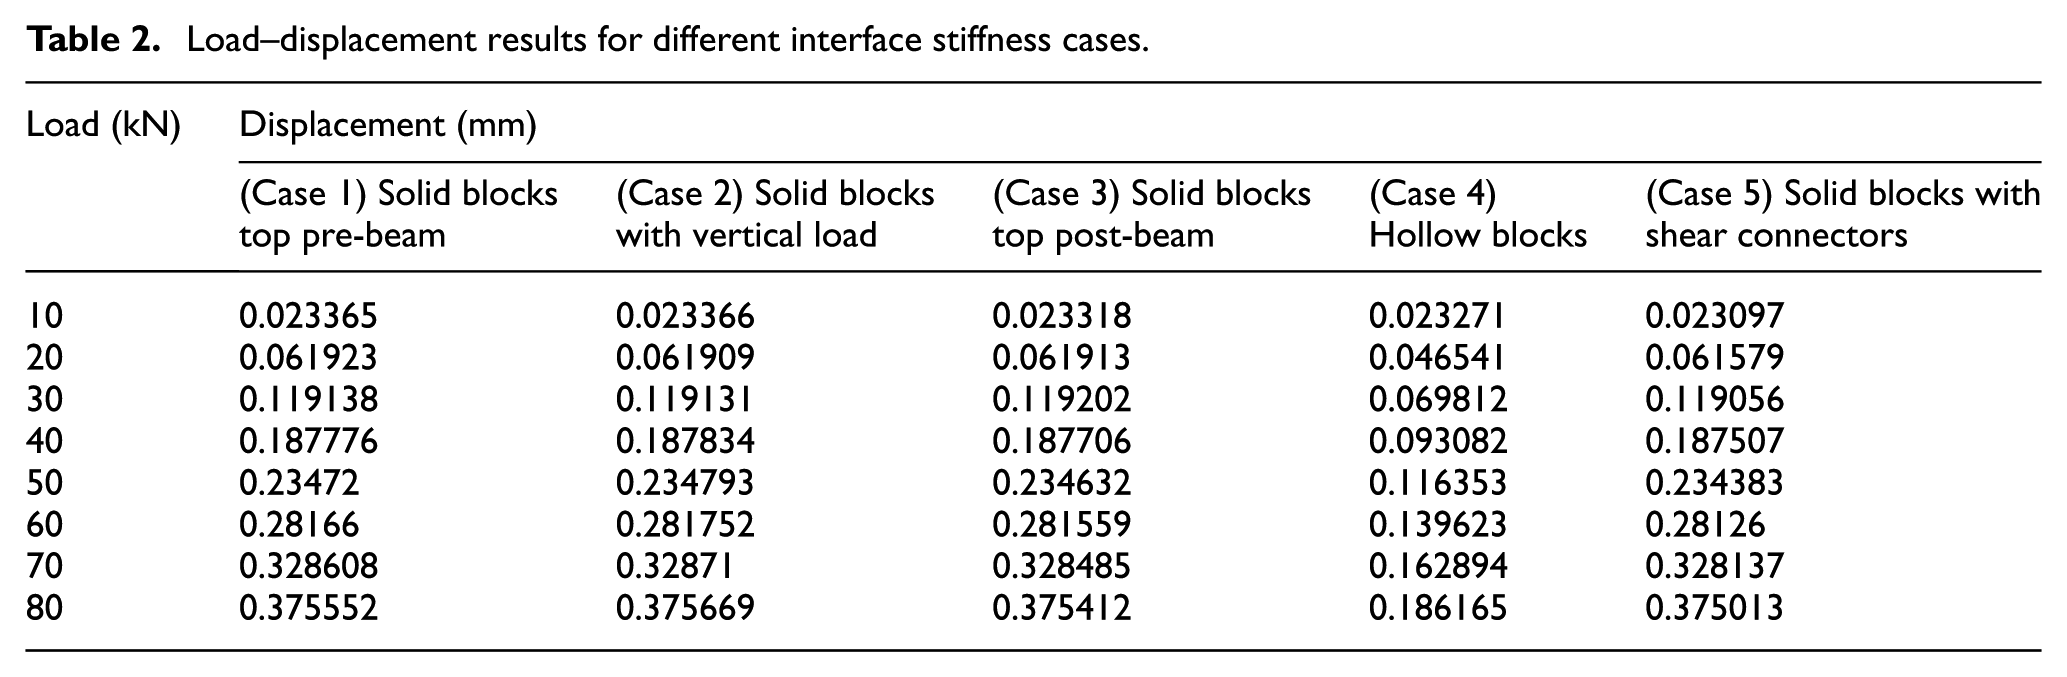
Table 2 presents the load–displacement relationship of all interface stiffness cases. It is observed that displacement values for all cases are nearly the same except for Case 4 (hollow blocks). The reason for this phenomenon is most likely due to the variable increase in interface stiffness at different locations as compared to Case 1. Increase in interface stiffness for various cases is depicted in Figure 5. Cases 2 and 3 had no increase in the vertical interface stiffness and had increase in interface stiffness at the bottom (Case 2) and top interfaces (Case 3) only. Case 4 (hollow blocks) had considerable increase in interface stiffness on all four sides, while in Case 5 (solid block with shear connectors), there is no increase in bottom interface stiffness.
Load–displacement results for different interface stiffness cases.
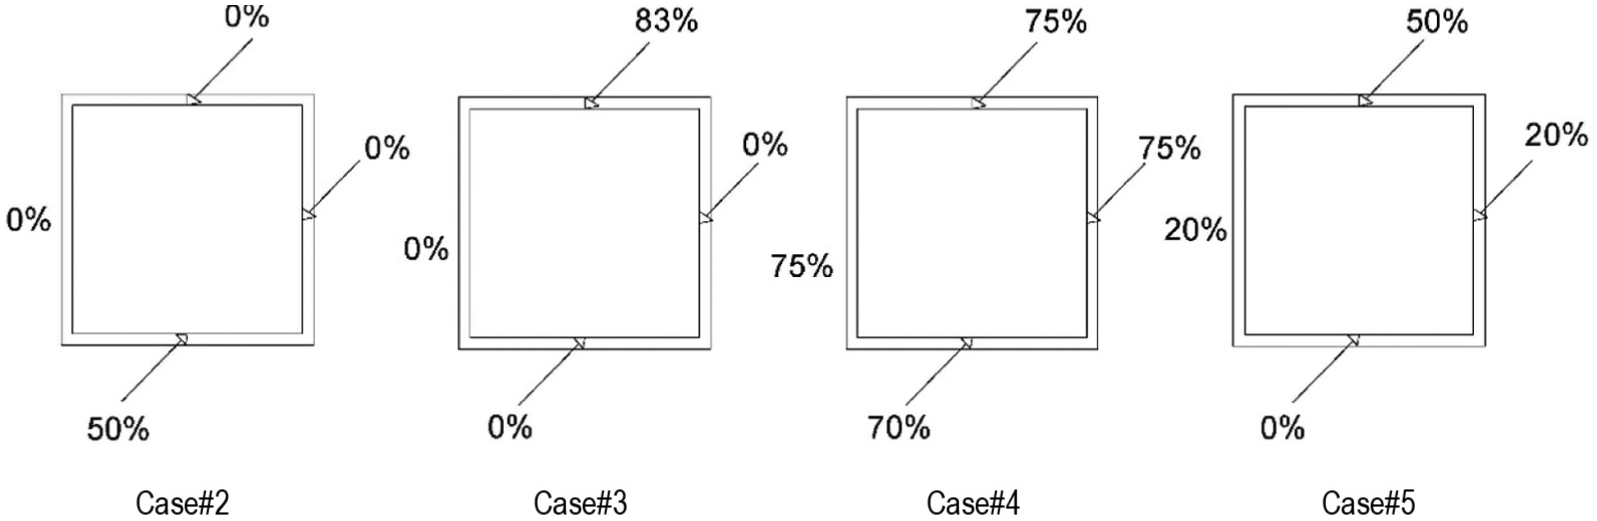
Percentage increase in interface stiffness as compared to Case 1.
Resisting shear couples can only form if interface stiffness is nearly equal on all four sides of the frame. The resisting couples will not form if even a single surface has a low stiffness value. It is observed that only the hollow blocks (Case 4) fulfill this criterion and consequently, in this case, lateral displacement values were lower than other cases due to the formation of additional resisting couple. On the other hand, for Cases 2, 3, and 5, there is at least one side that had 0% increase in interface stiffness as compared to Case 1 and consequently, the additional resisting couple failed to form and there was no change in lateral displacement compared to Case 1. Interface stiffness for the hollow block samples (Case 4) is higher than other cases as the bed mortar rises inside the hollow cavity and acts as shear plugs, resulting in increased interface stiffness.
Effect of different interface cases on other parameters
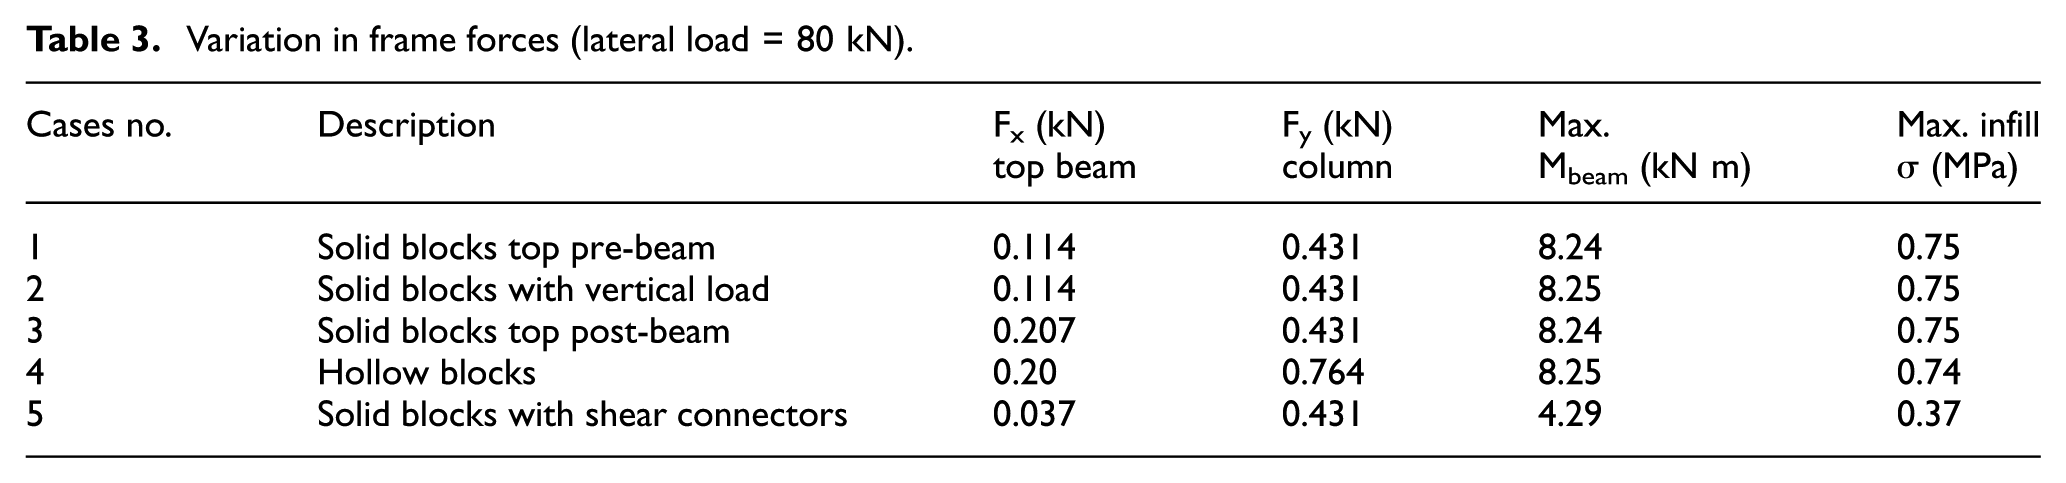
Table 3 shows the effect of different stiffness cases on maximum normal force in the top beam (Fx), maximum normal force in the column (Fy), maximum moment in top frame beam (M), and maximum stress in the infill panel at the loaded corner (σ). The following observations are made:
Increasing the bottom interface stiffness by 33.3% using a compression vertical load (Case 2) did not affect any of the results.
Increasing the stiffness of the top interface by 83% using the post-beam technique (Case 3) increased top beam normal force by 45%, while the frame moment and the infill panel stress were not affected.
Using hollow blocks (Case 4) resulted an increase in normal forces in beam and column at the loaded corner by 43%, while the frame moment and the infill panel stress were not affected. Figure 6 presents changes in the normal force for both the top beam and the vertical column for the cases of solid and hollow blocks. Figure 7 shows the load–displacement curves for both frames with hollow and solid blocks infill, and the lateral stiffness was found to be 4.2972×10⁵ and 2.1301×10⁵ kN/m, respectively, with an increase in 50.4% for the frame with hollow blocks. This would lead to the conclusion that hollow blocks with their ability to lock the mortar are the most effective in increasing the frame stiffness.
Using shear connectors at the top and vertical interface decreased the normal force in the top beam by 67%, the frame moment by 48%, and the infill panel stress by 50%.
Variation in frame forces (lateral load = 80 kN).
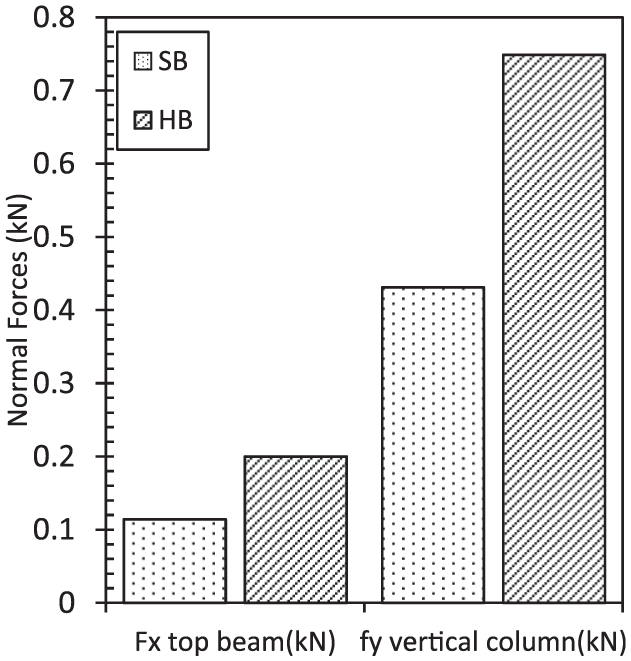
Change in normal forces between solid pre-beam and hollow blocks.
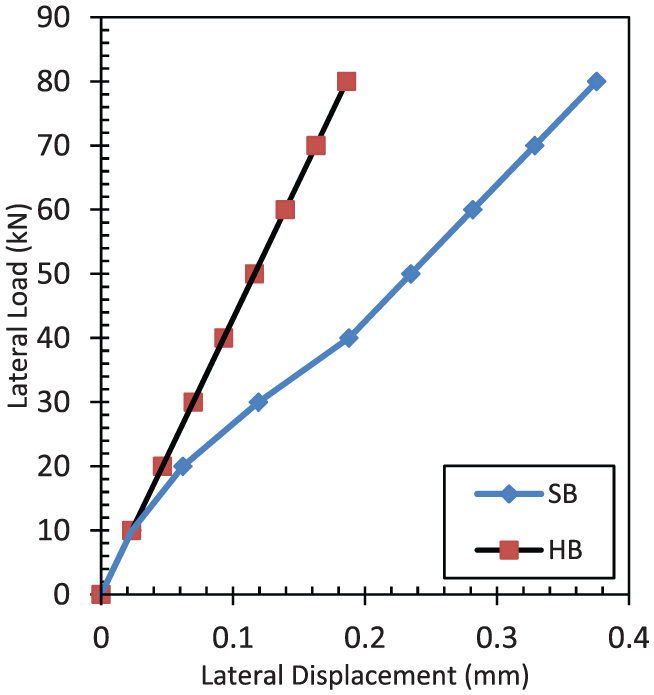
The load–displacement curves for solid pre-beam and hollow blocks.
Effect of aspect ratio on performance parameters of infill-frames
Performance parameters (load–displacement relationship, failure propagation pattern, and internal forces) of a group of rectangular infill-frames with different aspect ratios, as depicted in Figure 8, were investigated in this study. The frame, infill, and interface properties are the same as for Case 1 of Table 1.
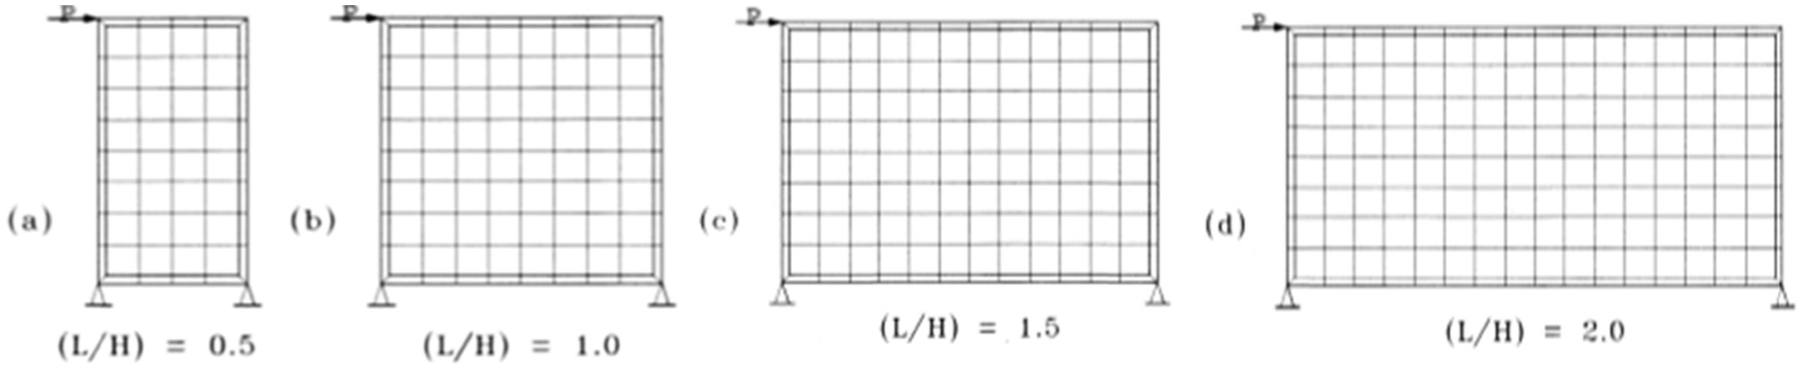
Investigated frames with aspect ratios (a) L/H = 0.5, (b) L/H = 1.0, (c) L/H = 1.5 and (d) L/H = 2.0.
Lateral load–displacement behavior
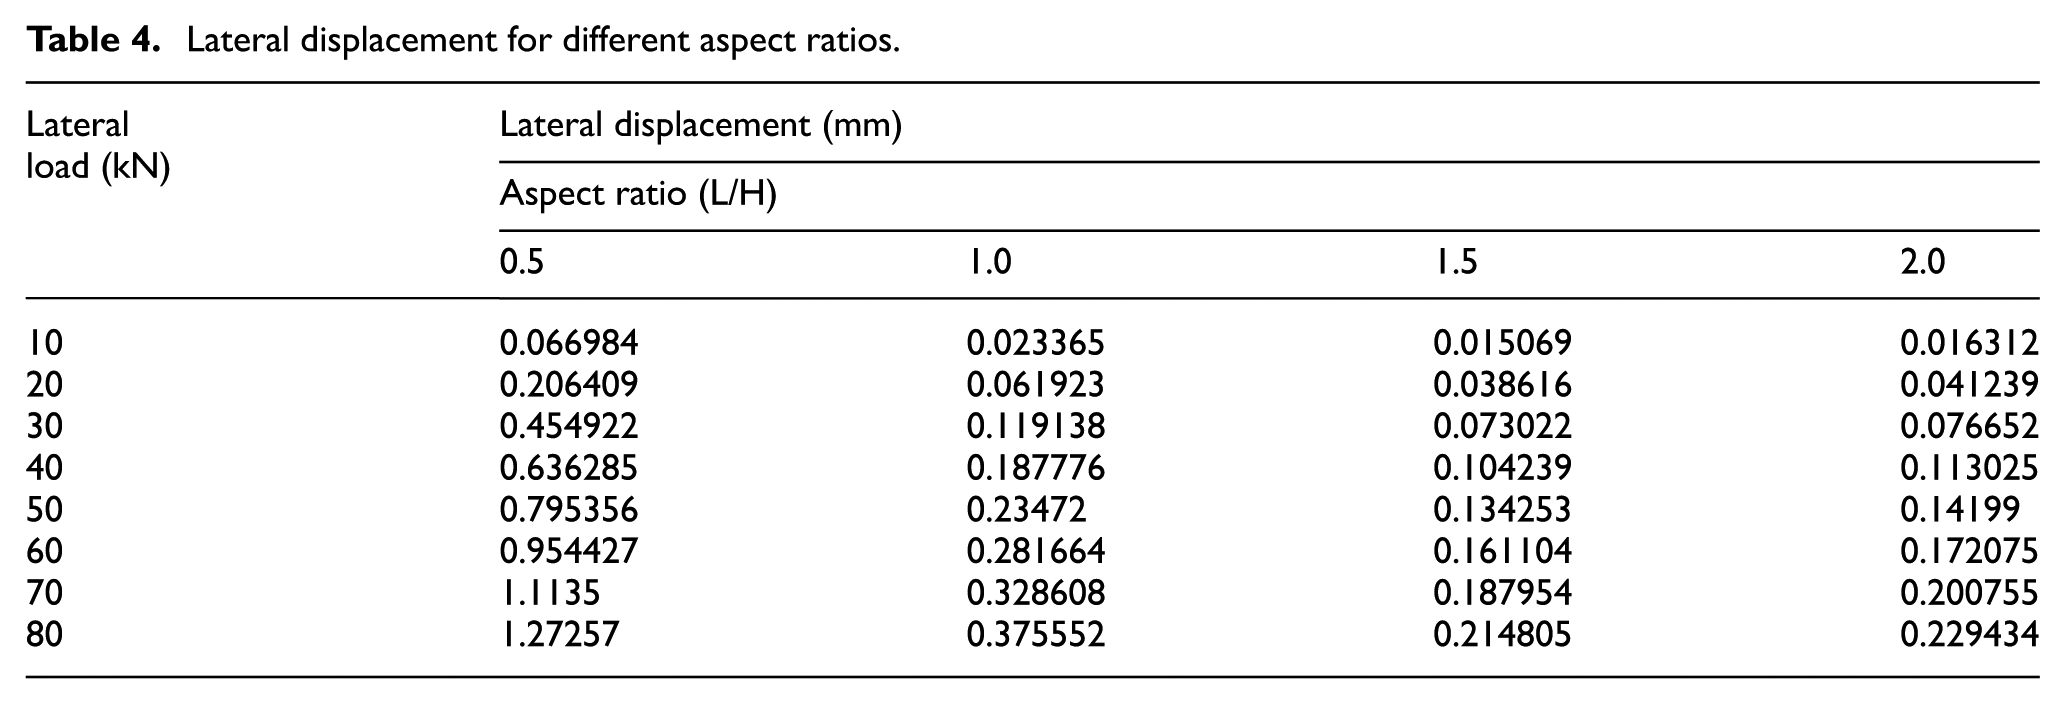
Table 4 presents the lateral displacements at different load stages with respect to the considered aspect ratios. Figure 9 shows the load–displacement curves for all cases. As shown, the smaller the aspect ratio, the bigger the displacement specially for the aspect ratio 0.5 which has a 70% more displacement as compared to aspect ratio 1.0.
Lateral displacement for different aspect ratios.
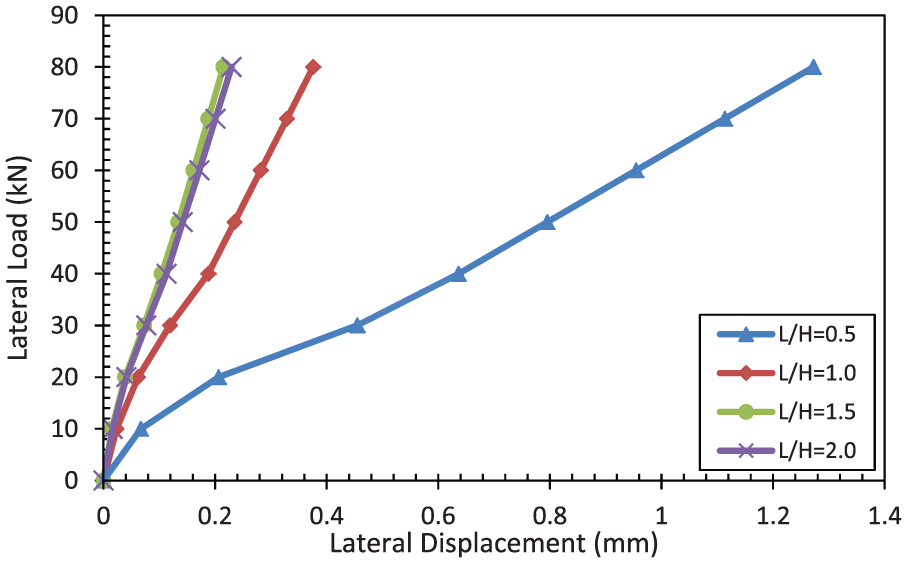
Load–displacement curves for frames with different aspect ratios.
Failure propagation pattern
Failure propagation in the interface at different loading stages for two cases of aspect ratios are shown in Figure 10. From these figures, it can be noted that the interface failures started in the column interface for aspect ratio 0.5; on the contrary, it started in the beam interface for aspect ratios 1.5 and 2.0. Finally, the failure propagation of the frame for aspect ratio 1.0 happened exactly as explained in Figure 4 where the failure started at the center of all frame elements simultaneously in the first load step and stabilized in the third step of loading for aspect ratios 0.5 and 1.0. On the other hand, it stabilized in the fourth step of loading for aspect ratios 1.5 and 2.0.
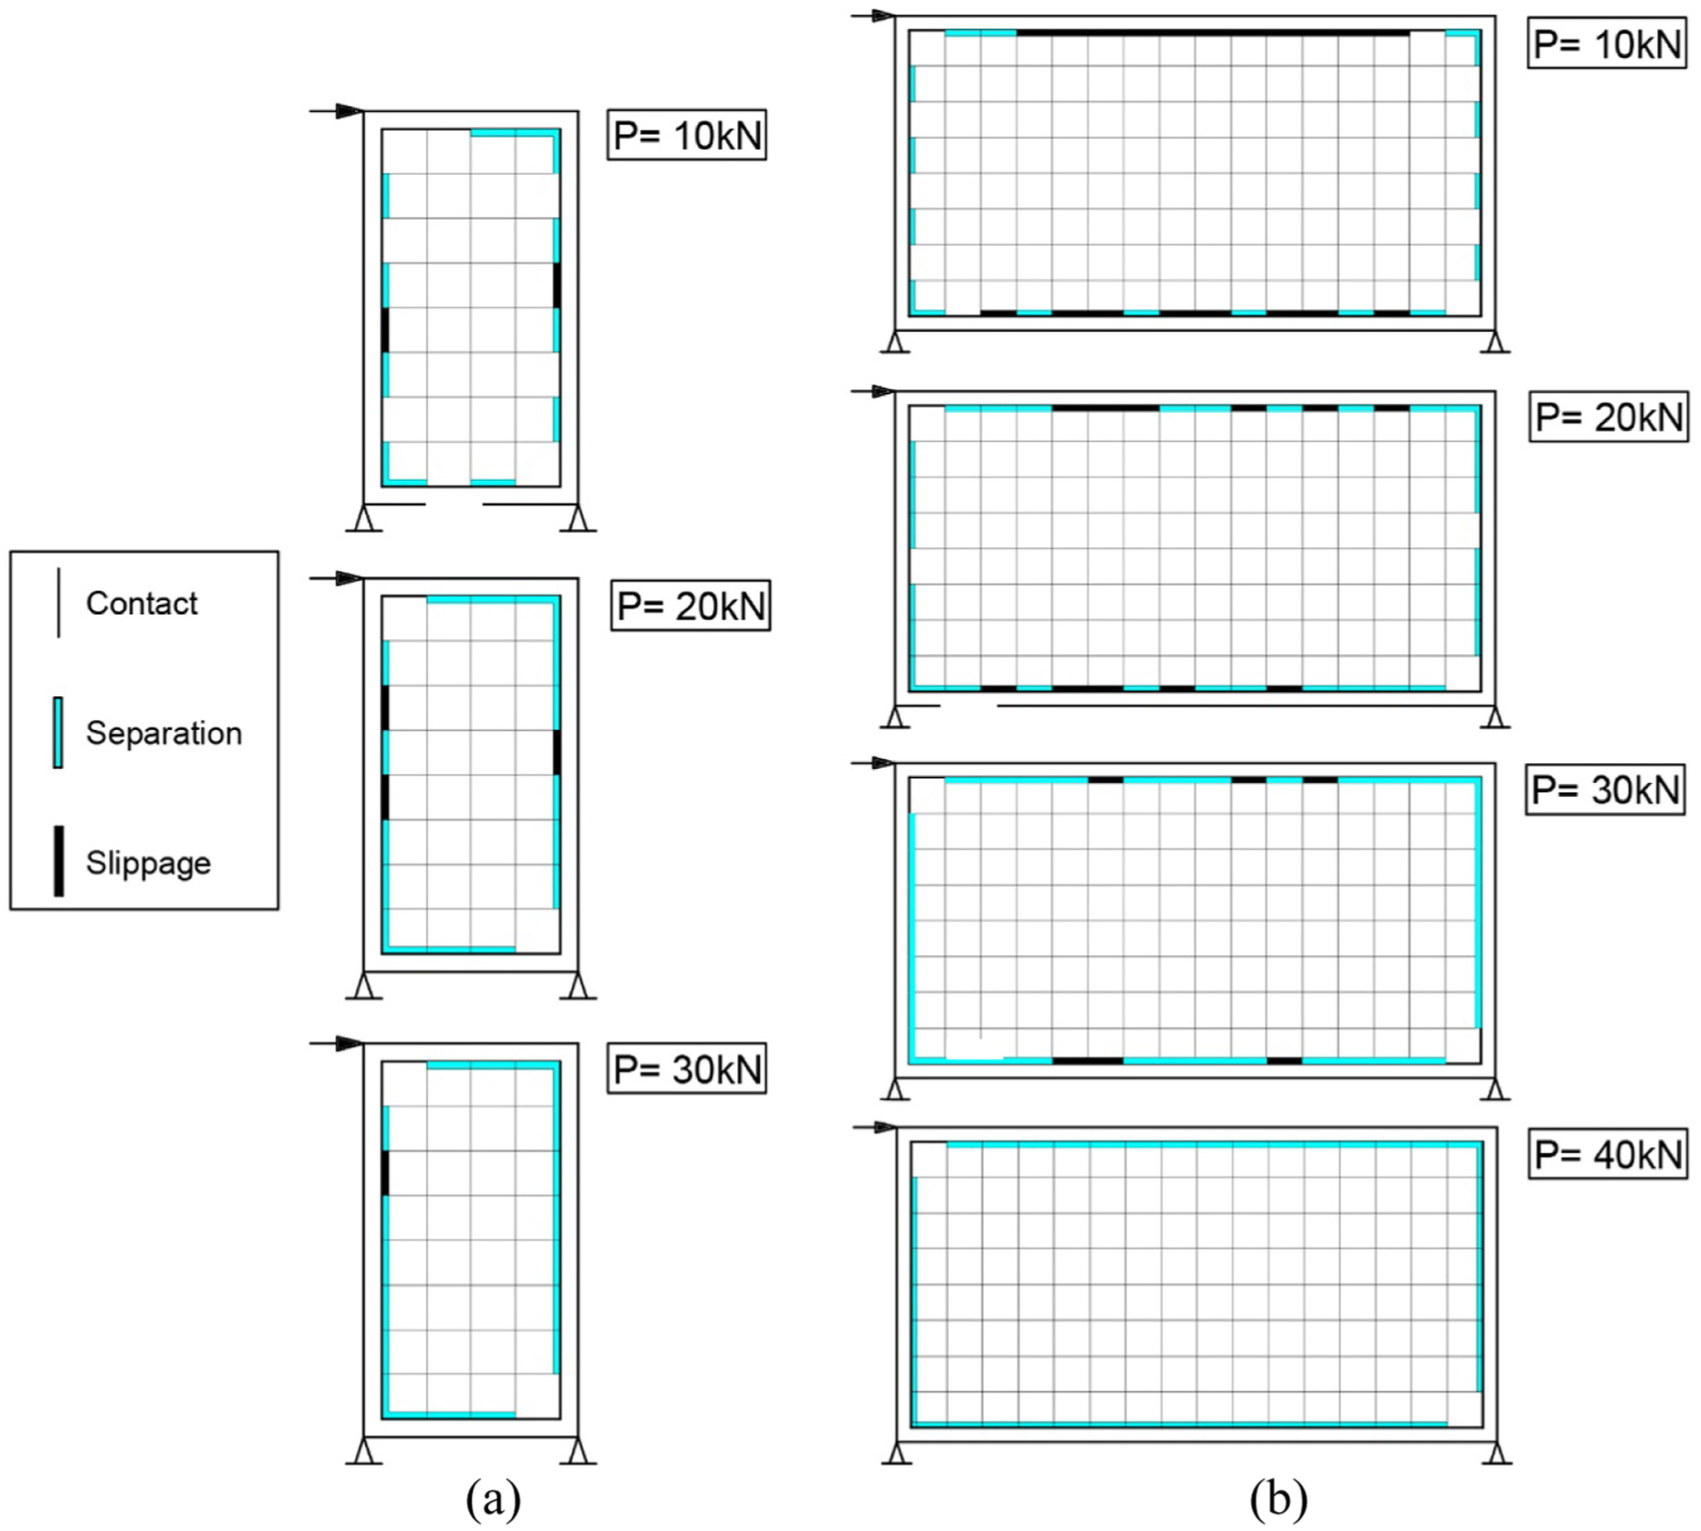
Failure propagation in interfaces at different loading stages for infill-frame with (a) L/H = 0.5 and (b) L/H = 2.0.
Effect of aspect ratio on other parameters
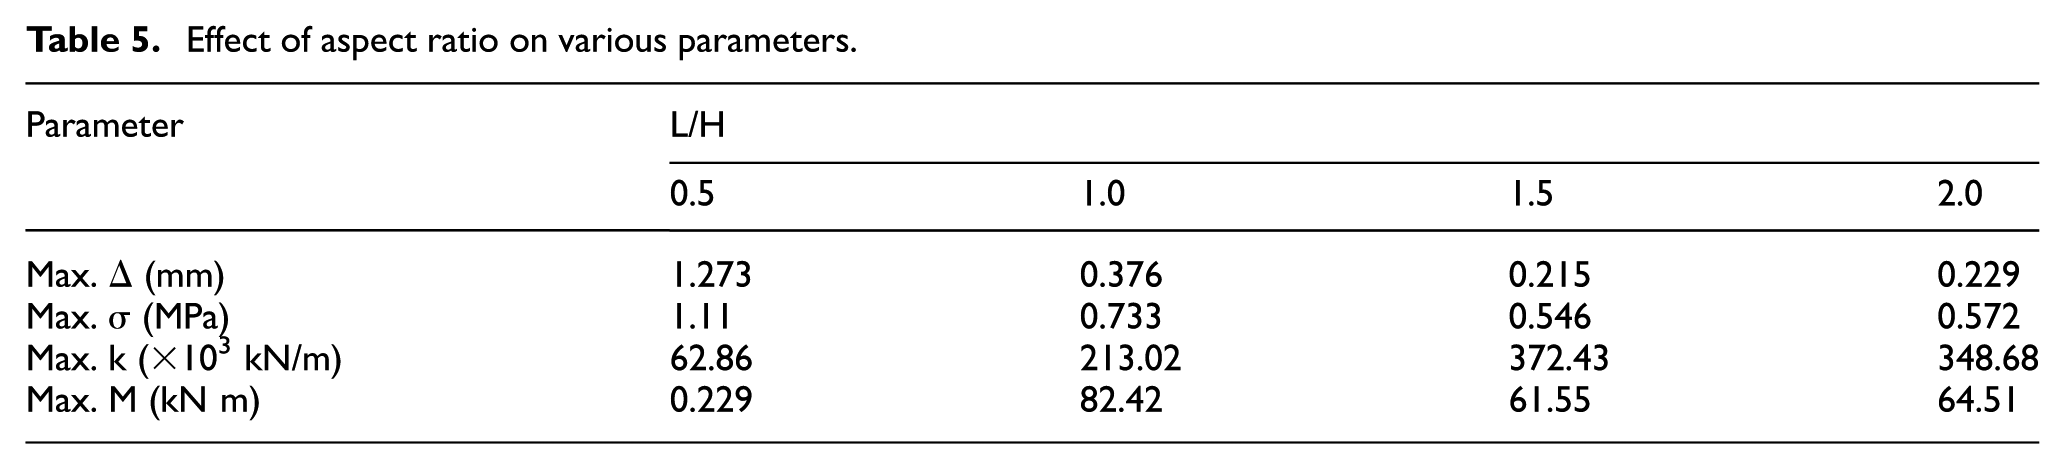
Table 5 presents the maximum lateral displacement (Δ), stress (σ), stiffness (k), and moment (M) at the final load stage for different aspect ratios. The results are displayed in Figures 11 and 12. The following observations are made:
Maximum displacement decreased as the aspect ratio increased up to 1.5. However, for aspect ratio of 2, displacement increased by 6% as compared to aspect ratio of 1.5.
Stress decreased as the aspect ratio increased up to aspect ratio of 1.5. However, for an aspect ratio of 2, the stresses recorded a 4.5% increase over the 1.5 aspect ratio case.
Stiffness increased as the aspect ratio increased up to 1.5. However, for an aspect ratio of 2, the stiffness registered a 6.4% decrease over that of 1.5.
Moment decreased as the aspect ratio increased up to 1.5. However, for an aspect ratio of 2, the moment indicated a small increase over that of 1.5.
Effect of aspect ratio on various parameters.
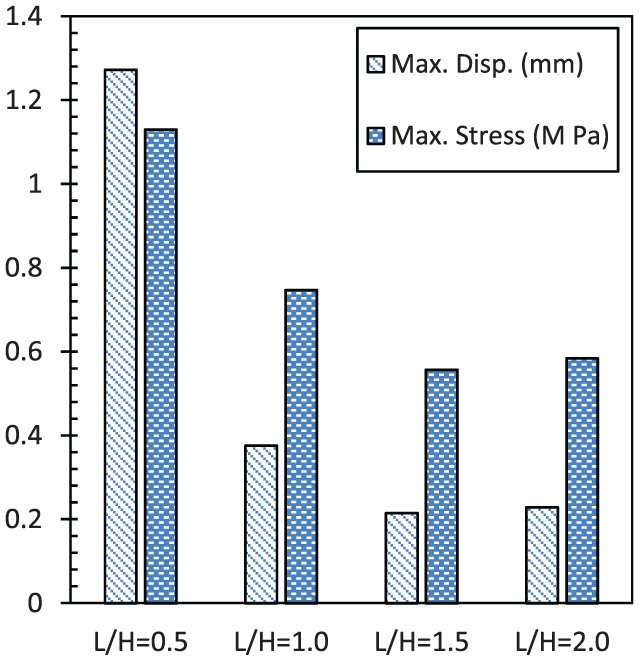
Effect aspect ratio on displacement and infill stress.
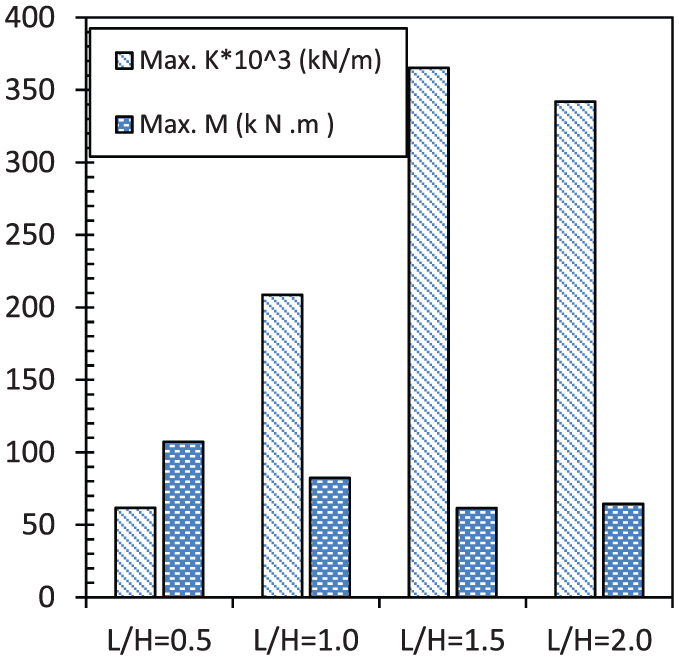
Effect of changing aspect ratio on displacement and infill stress frame lateral stiffness and frame moment.
Effect of vertical compression load on square panel
Results of infilled frames with different levels of vertical compression, as depicted in Figure 13, are reported in this section. The vertical compression loads uniformly distributed on the top beam were chosen to be 5, 7.5, 15, and 25 kN/m, in addition to the lateral load applied incrementally on the frame. The results were compared with analysis cases without vertical compression load. The frame, infill, and interface properties are the same as for Case 2 in Table 1.
Infill-frame with vertical compression load.
Lateral load–displacement behavior
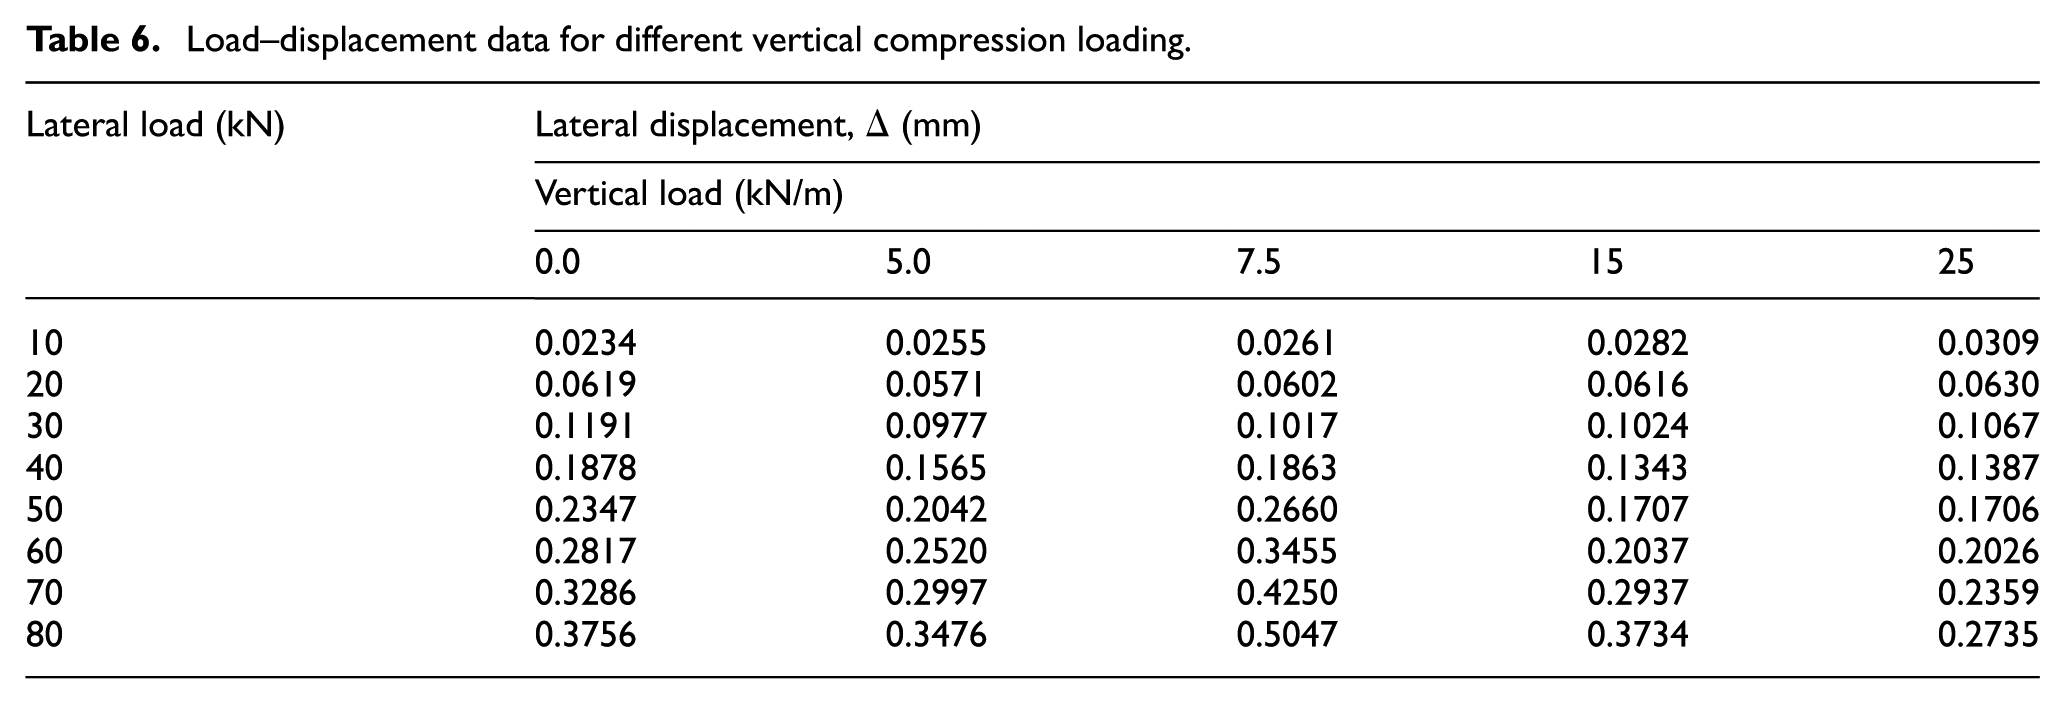
Lateral load–displacement data and curves are presented in Table 6 and Figure 14. For all cases with different vertical loading, the displacement was equal during the first three loading stages. Then, the displacement increased rapidly for the 7.5 kN/m vertical load with an increase in 25% more than the displacement of the frame with no vertical load.
Load–displacement data for different vertical compression loading.
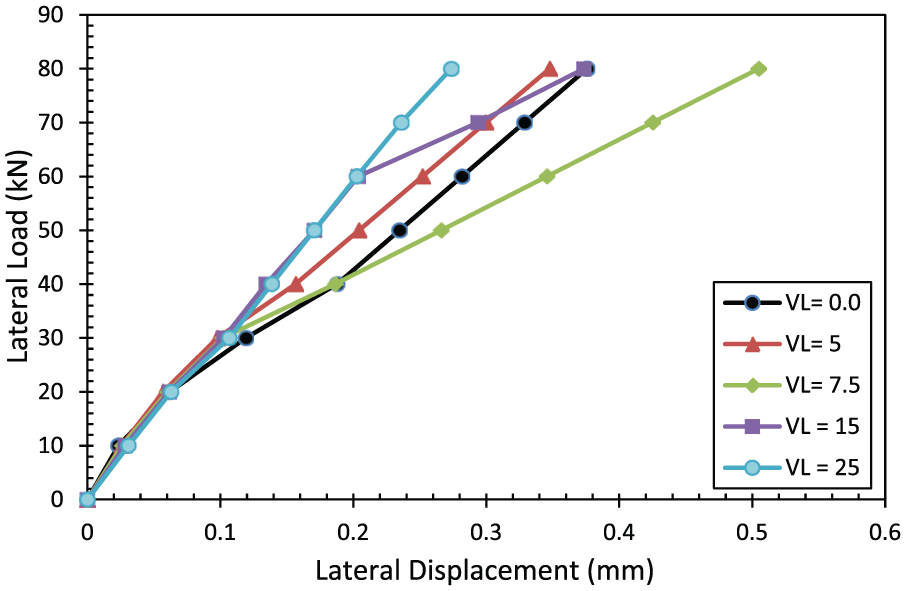
Load–displacement curves for different vertical compression loads.
Adding vertical load to the frame decreased the displacement in most cases, except for the critical load of 7.5 kN/m for which the displacement increased. This could be attributed to the fact that the bending moment due to the lateral load was more than the bending moment produced by the vertical load at beam–column joint where lateral load was applied.
Failure propagation pattern
For all cases, similar failure propagation took place, which showed that the failure started with slippage and separation in all sides except for the top one which remained in contact with the frame for most of the length. All the failure propagations were similar and one of these propagations is shown in Figure 15.
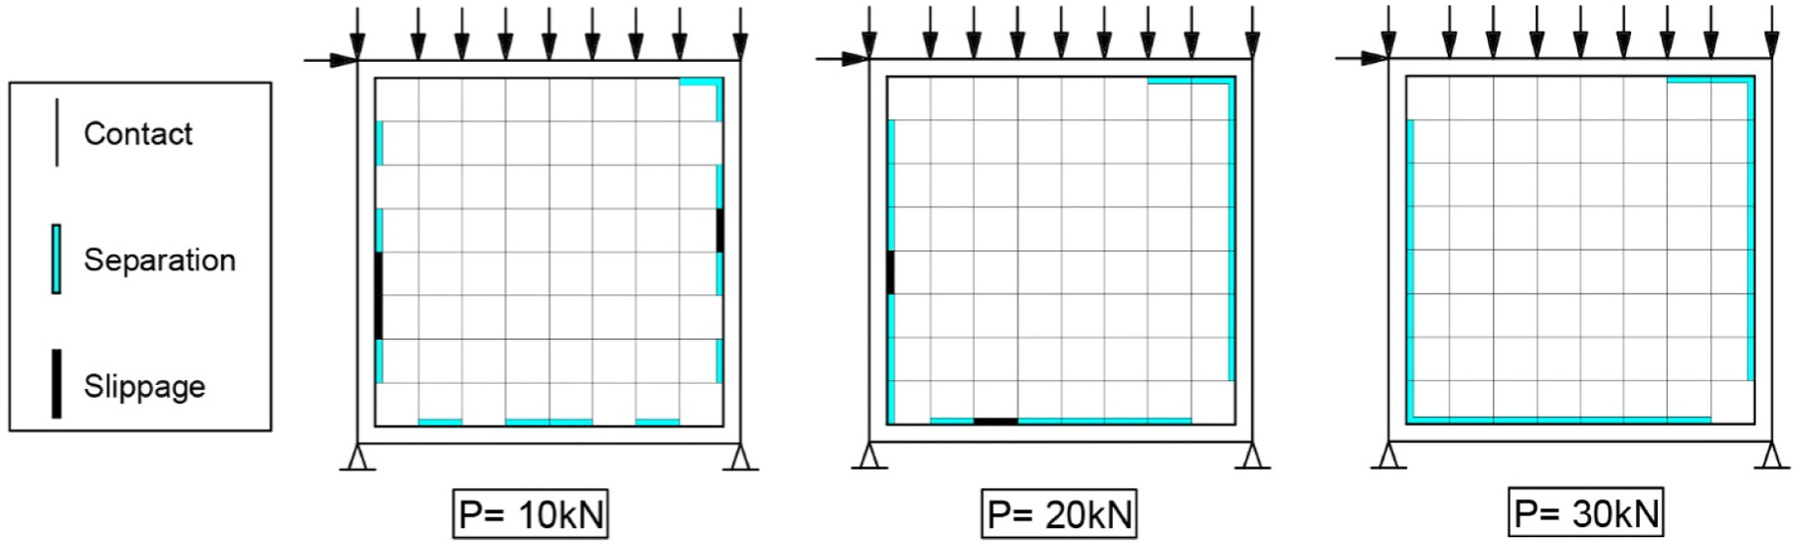
Failure propagation in interfaces at different lateral load stages for square infill-frame with vertical compression loading.
Effect of different vertical loads on other parameters
The effect of variation in vertical load on maximum displacement (Δ), stiffness (k), stress (σ), and moment (M) is shown in Table 7, Figures 16 and 17 for lateral load of 80 kN. As noted, lateral displacement and moment increased by 25.6% and 62% respectively for the case with 7.5 kN/m vertical load. The stress decreased as the vertical load increased, except at 25 kN/m the stress increased by 5.5% from the previous case. This because the bending moment due to the lateral load was more than the bending moment produced by the vertical load at beam–column joint where lateral load was applied.
Effect of vertical load on various parameters (lateral load = 80 kN).
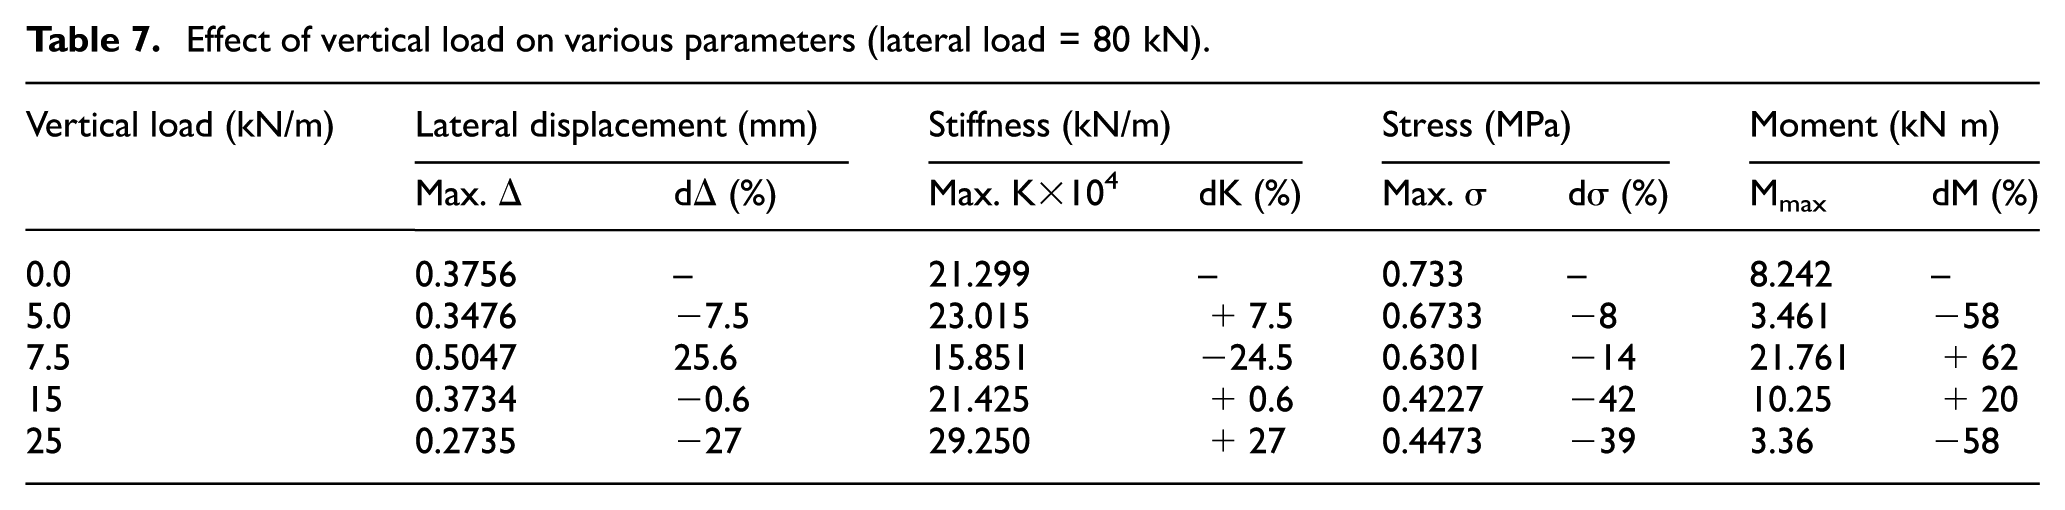
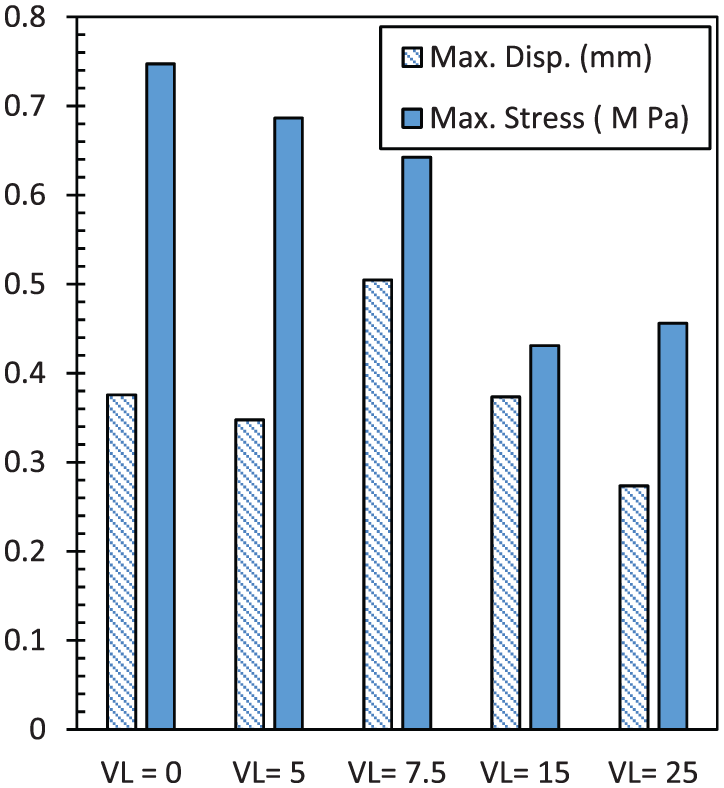
Effect of vertical load on frame displacement and infill stress.
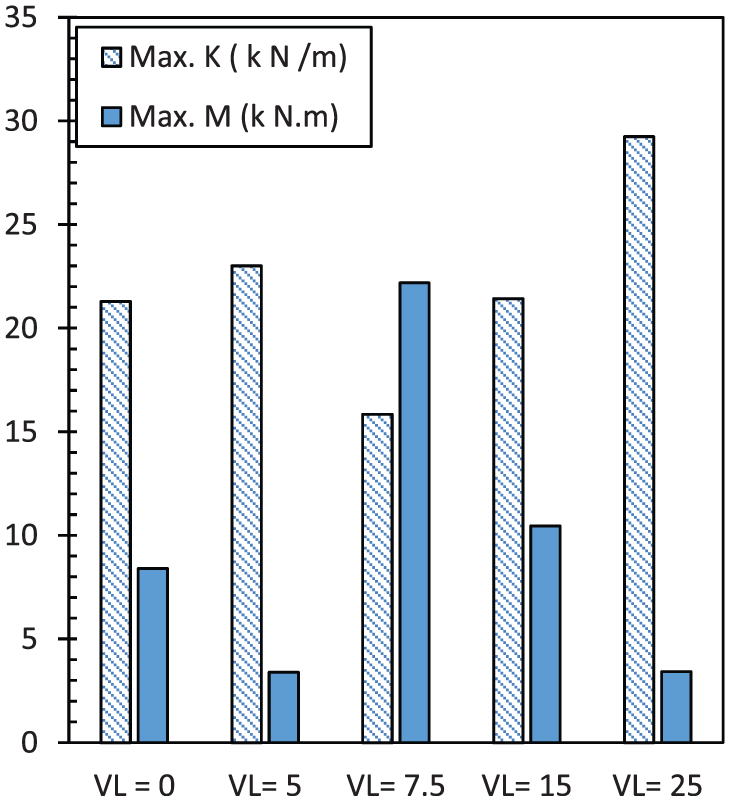
Change in frame lateral stiffness and frame moment as a function of vertical load.
Square panels with and without openings
A group of square infilled frames with different locations of door and window opening were studied in this section, as depicted in Figures 18 and 19, respectively. The frame, infill, and interface properties are the same as for Case 1 in Table 1.
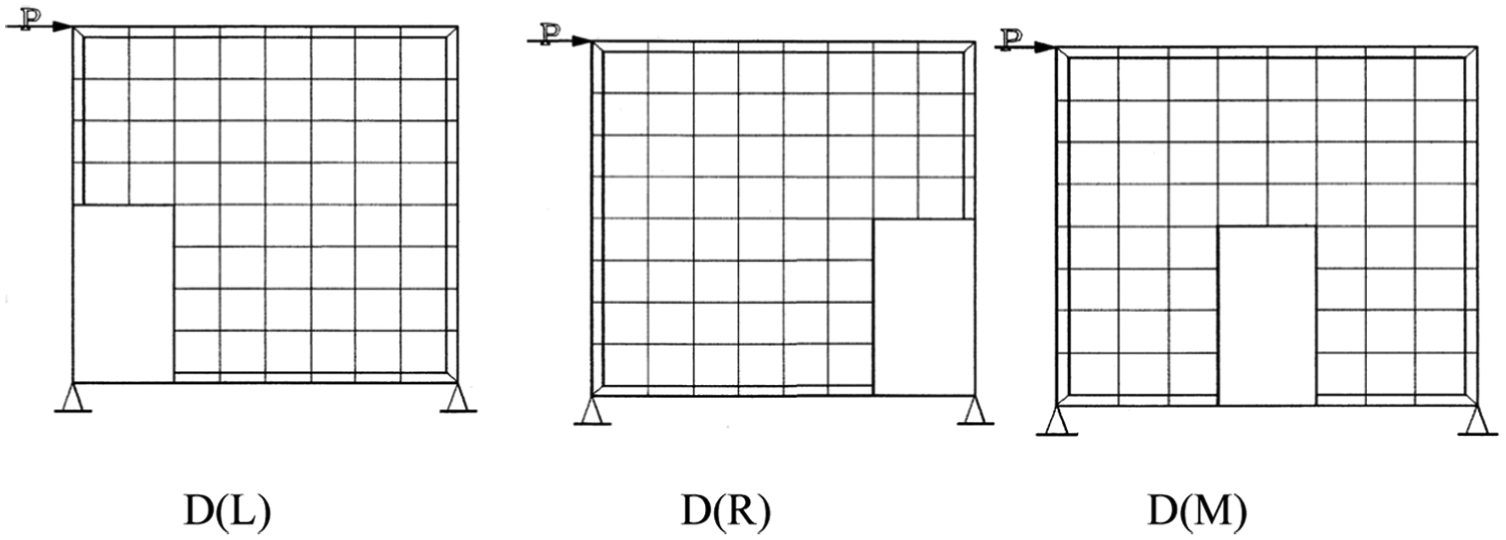
Infill-frames with different locations of doors opening.
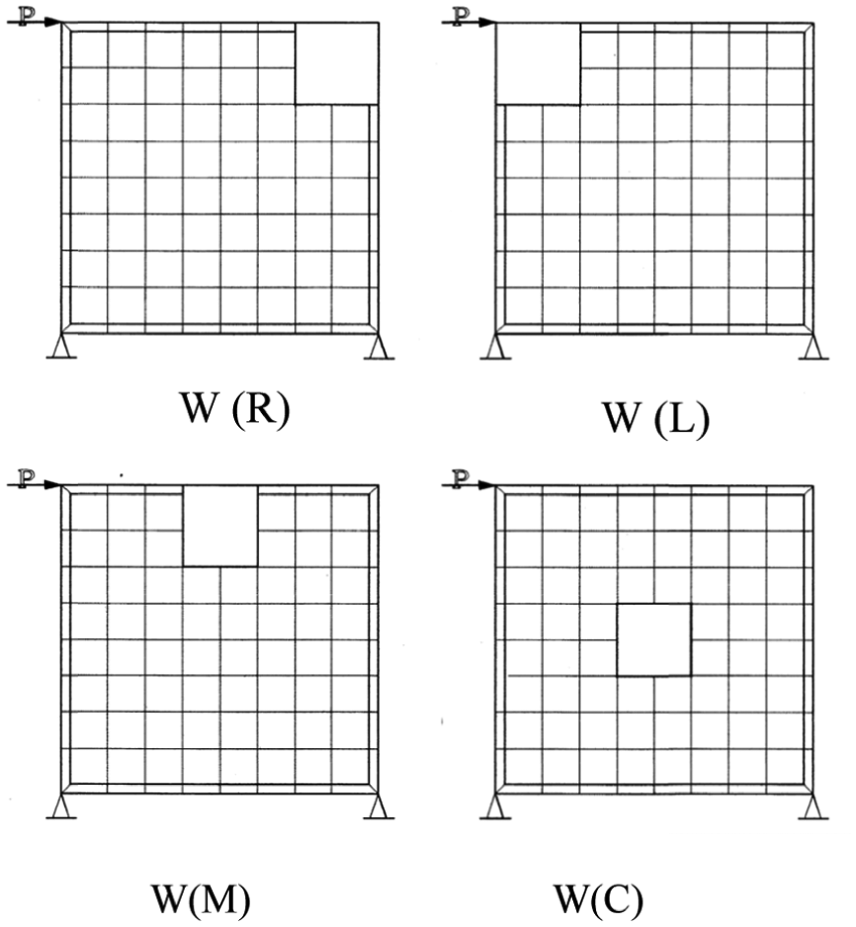
Infill-frames with different locations of windows opening.
Lateral load–displacement behavior
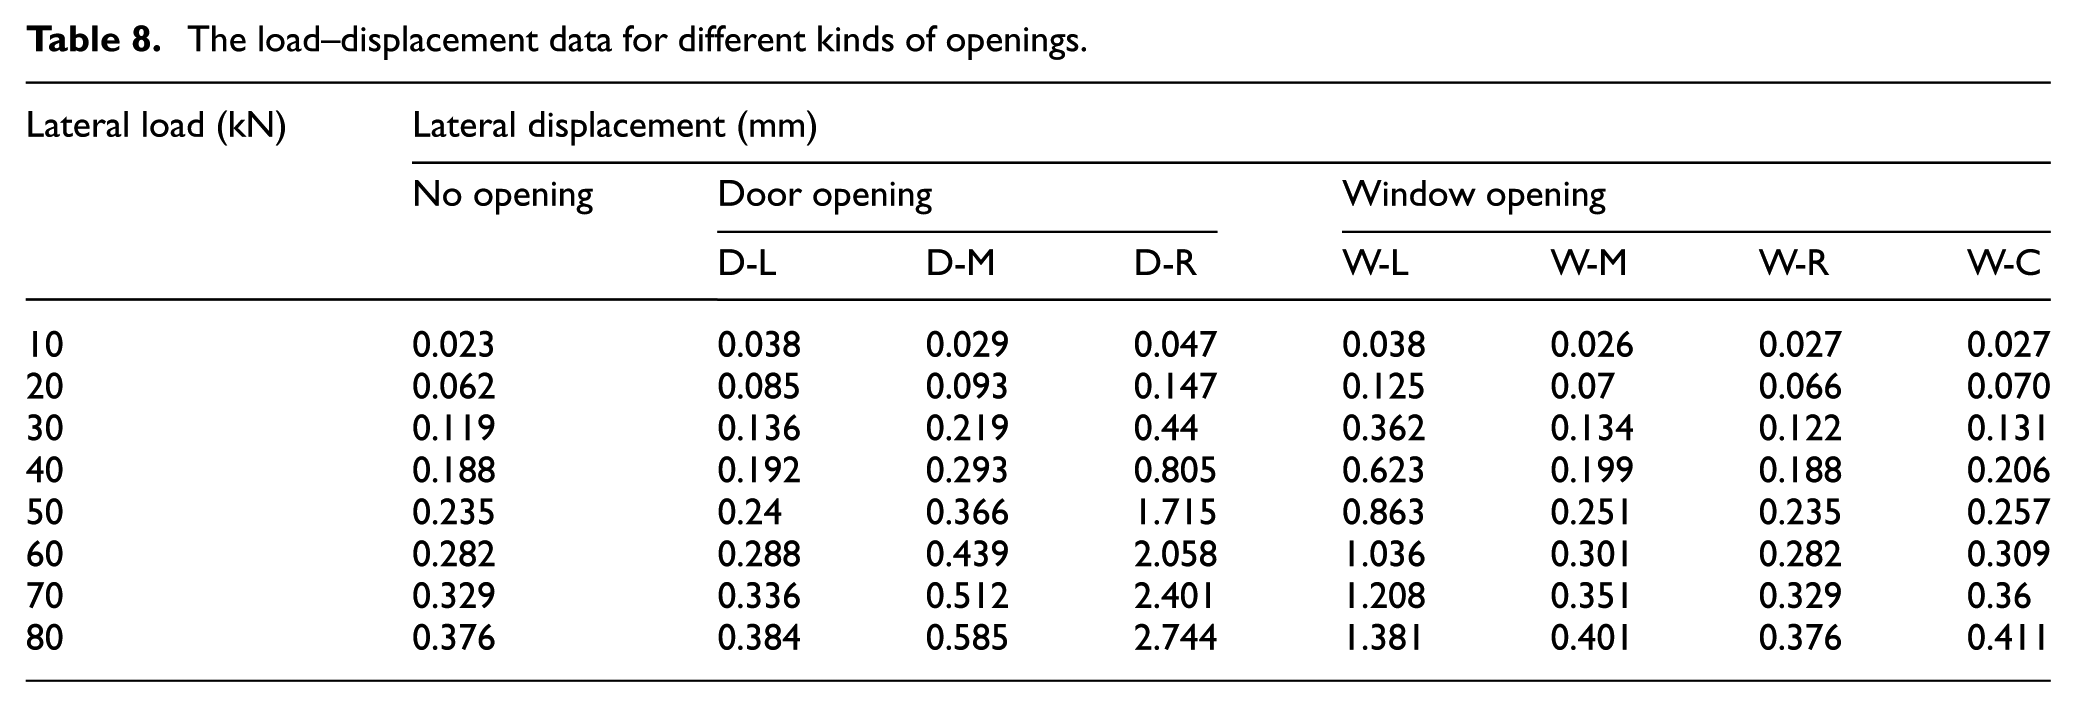
Table 8 presents the load–displacement data for all cases. Figures 20 and 21 present the load–displacement curves for different door and window locations, respectively. Figures 20 and 21 show that the maximum displacement occurred when the opening door or window was located in the load path of the diagonal compression strut.
The load–displacement data for different kinds of openings.
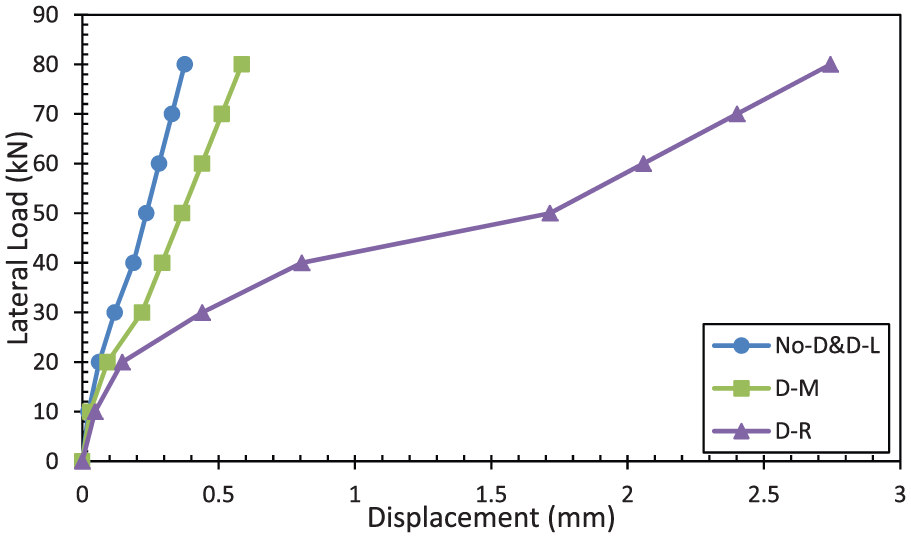
Load displacement curves for different door locations.

Load displacement curves for different window locations.
Failure propagation pattern
The Failure propagations in the interfaces at different loading stages for the most critical door and window locations are shown in Figure 22, where the opening is located in the direction of the load strut. The failure mode did not change after the third step of loading for all opening locations.
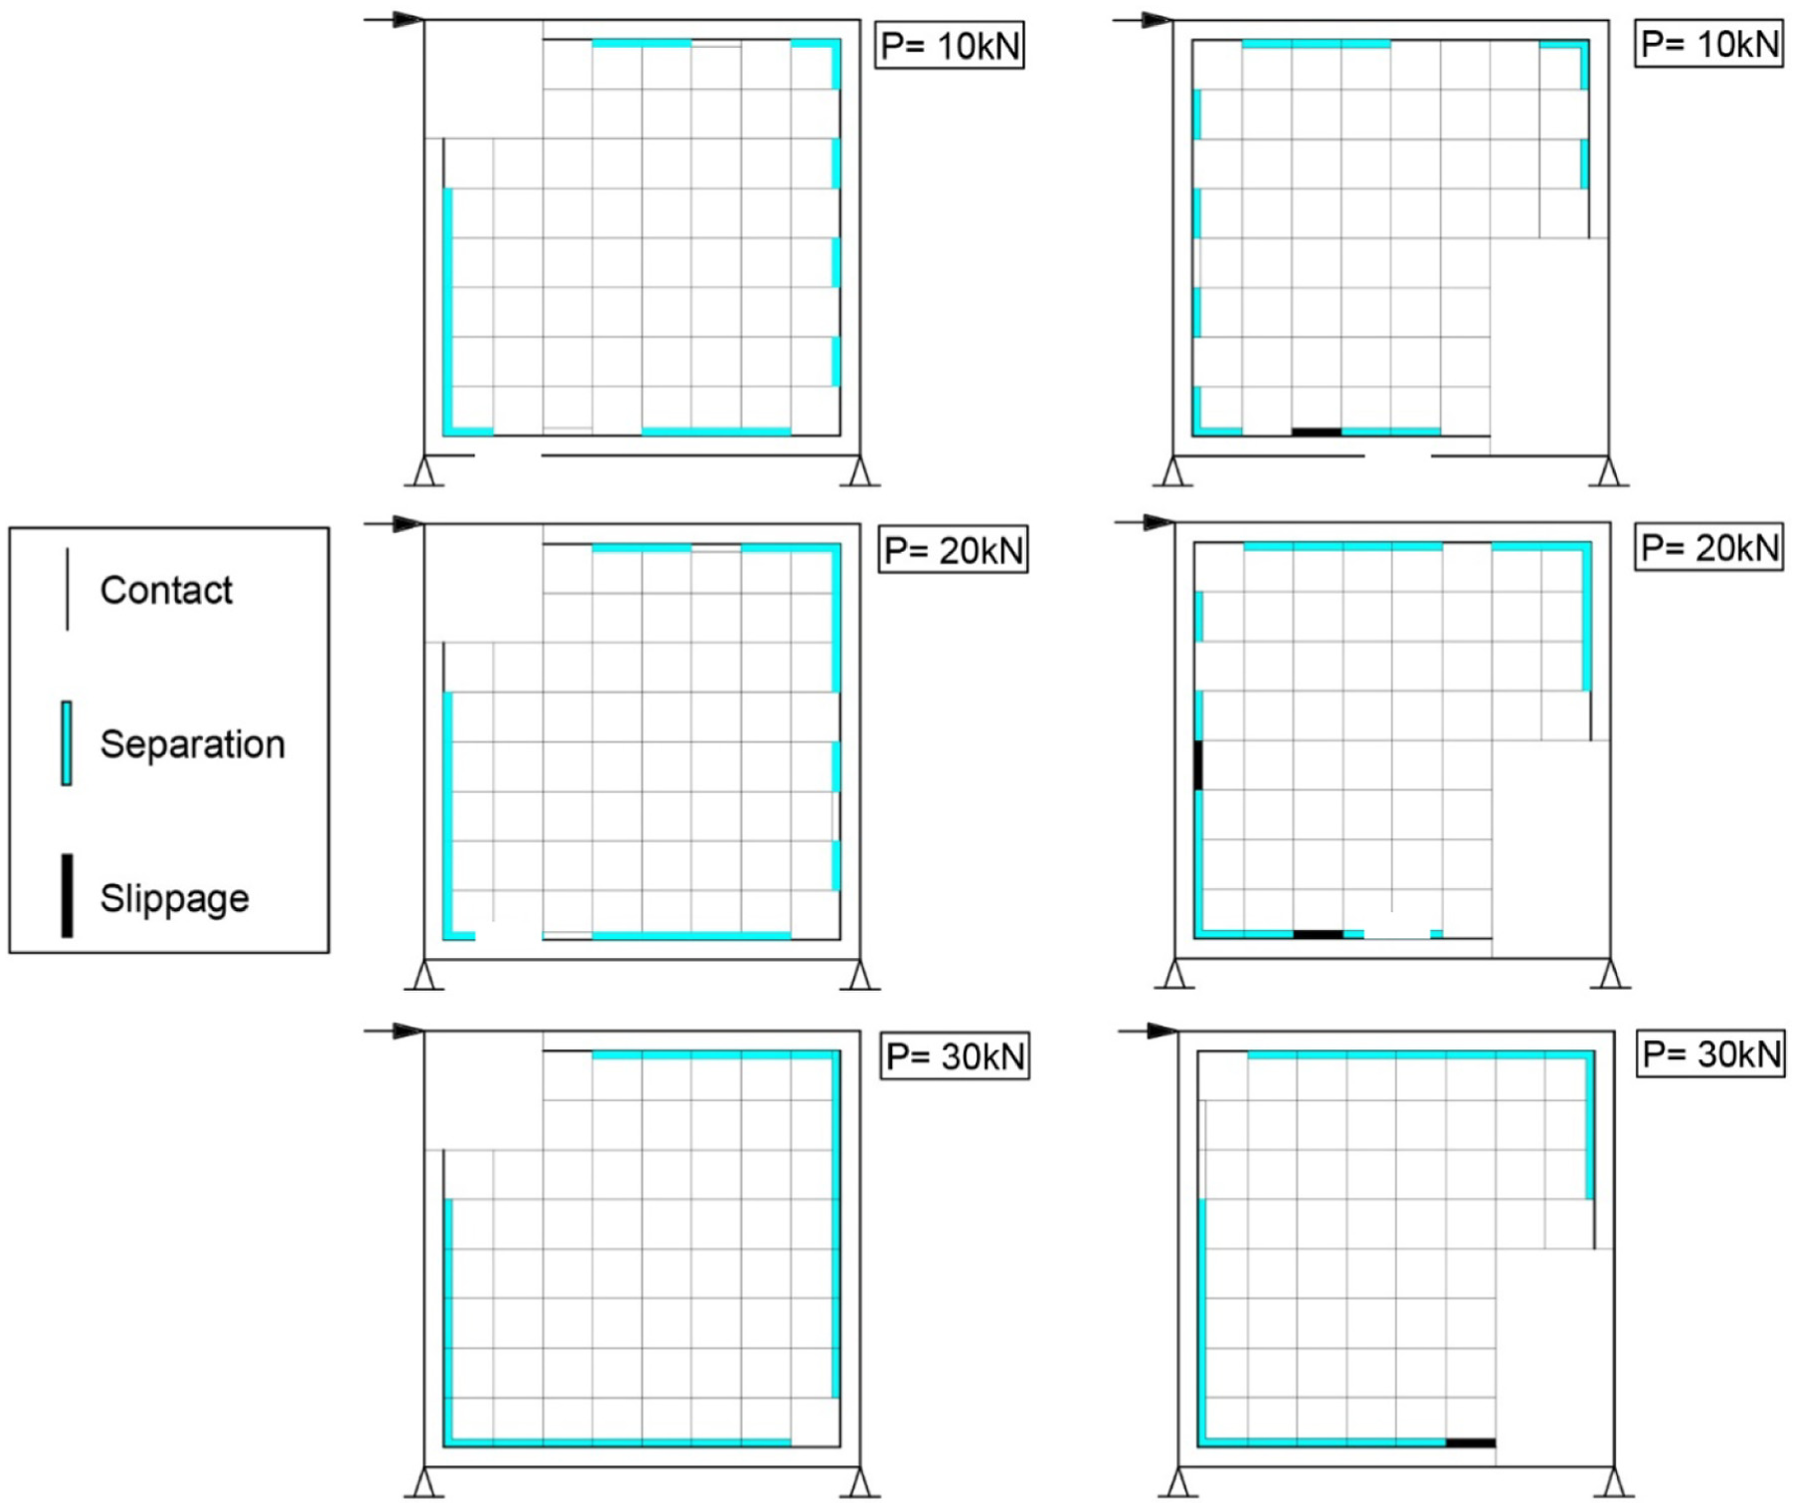
Failure propagation in interfaces at different loading stages for square infill-frame with right door opening and left window opening.
Effect of door locations on other parameters
The effect of changing the door location on maximum displacement (Δ), stress (σ), stiffness (k), and moment (M) are shown in Table 9. Figure 23 displays the stiffness and the moment results.
Effect of different door locations on various parameters (lateral load = 80 kN).

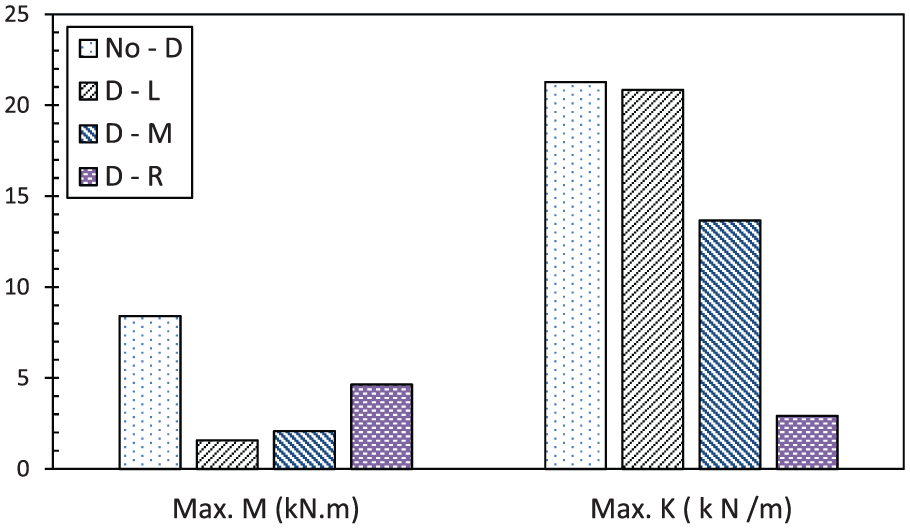
The change of the frame moment and lateral stiffness versus the door location.
As observed from the above-mentioned results, when the door opening was located in the left side of the panel, it did not affect the infilled frame displacement or lateral stiffness and it decreased the moment of the frame. However, moving the door to the center of the panel caused a slight increase in lateral displacement and infill panel stress, while it slightly decreased infill stiffness and frame moment. This was due to the interference of the door with the load path of the diagonal compression strut. Finally, the major effect appears when the door is located in the direction of the load strut opposite to the loaded corner. In this case, the displacement and the infill stress increased by 86.3% and 14.3%, respectively, as compared to the solid panel case. Conversely, the frame moment and lateral stiffness registered a drop of 44.7% and 86.3%, respectively.
Effect of window location on other parameters
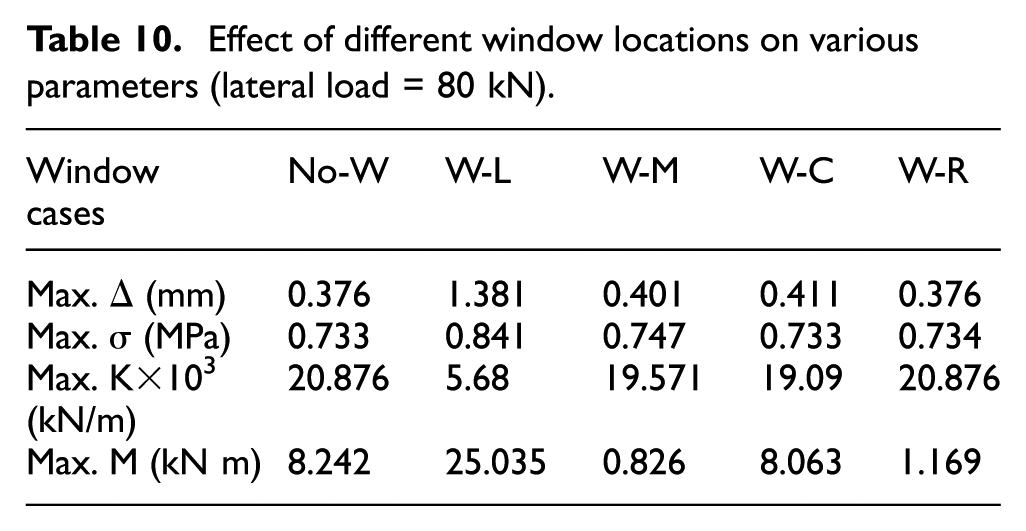
The effect of changing the window location on maximum displacement (Δ), panel stress (σ), infill-frame stiffness (k) and top beam moment (M) are shown in Table 10. Figure 24 displays the stiffness and the moment results.
Effect of different window locations on various parameters (lateral load = 80 kN).

The change of the frame moment and lateral stiffness versus the window location.
As observed from the results, when the window was located on the right side, which was opposite to the load side or in the center of the panel, it did not affect the infilled frame displacement, lateral stiffness, stress in the infill panel, or moment of the frame. However, moving the window to the top center of the panel slightly decreased the frame lateral stiffness and decreased the frame moment by 90%. Finally, the major effect was noted when the window was located in the direction of the compression strut under the loaded point (Case W-L). For this case, frame displacement and moment increased by 73% and 67% respectively as compared to the solid panel case, while frame lateral stiffness decreases by 72.7% and infill stress increased by 12.8%.
Conclusions
Masonry infill-frame subjected to lateral load was analyzed with different parameters which can affect the infilled frame behavior. The used FEM model was capable of incorporating interface stiffness values obtained from experiments for different interface locations as well as considering an orthotropic infill panel system. From the analysis results, the following conclusions are drawn:
The results presented in this article are based on experimental values of interface stiffness as well as experimental orthotropic properties of the infill panels in a nonlinear FEM formulation. Therefore, the presented results are close to actual practice.
The results presented in this article pointed out to the fact that improving interface stiffness on one or two sides of the frame (using shear connectors or different construction technique) is not effective in improving the stiffness and displacement of the infilled frame. Interface stiffness needs to be improved equally along all four sides of the frame to improve the displacement and stiffness behavior of the infilled frame.
Using shear connectors at the top and vertical interface resulted in a decrease in the normal forces in the top beam, the frame moment, and the infill panel stress.
Increasing the aspect ratio decreased the displacement of the frame, the moment in the frame members, and the stress in the corner infill element under the applied load. However, it increased the lateral stiffness of the frame.
The optimum aspect ratio for the masonry panel was observed to be 1.5 as lateral stiffness increased until this aspect ratio and started to decrease afterwards.
Adding vertical load to the frame decreased the displacement in most cases after a lateral load of 40 kN. Before this load, there was no effect of vertical load on frame displacement.
Adding an opening in the infill affected lateral displacement, moment, and lateral stiffness of the frame, as well as changed the infill stress. This happened only if the opening interfered with the diagonal compression strut area.
Footnotes
Appendix 1
Elements of the stiffness matrix [k] of 2D orthotropic infill element based on equation (1) for the upper triangle are listed below. Elements in the lower triangle are symmetric to the upper triangle.
Additionally, C = (h E2/24 a b E4) is a multiplier for the [k] matrix,
Declaration of Conflicting Interests
The author(s) declared no potential conflicts of interest with respect to the research, authorship, and/or publication of this article.
Funding
The author(s) received no financial support for the research, authorship, and/or publication of this article.