
Abstract
Tests on steel reinforced concrete beams made with fibre-reinforced concrete have shown many benefits over reinforced concrete beams made with conventional concrete, such as increased strengths and ductilities and reduced deflections and crack widths. There has been much empirical research on quantifying the tensile and compressive fibre-reinforced concrete material properties in particular those subsequent to tensile flexural cracking or sliding of compression wedges. However, it is quite difficult to incorporate these material properties in strain-based approaches as they cannot cope with the rigid body movements of cracking or sliding directly. In this article, a segmental displacement–based approach is described that can both incorporate all the measured material test results directly and also explain the fundamental mechanics that governs the flexural behaviour of reinforced concrete beams made with fibre-reinforced concrete. The approach is generic in that it can cope with any type, geometry and strength of fibre-reinforced concrete and any shape or size of beam. The approach is described in a form suitable for the development of a numerical model and is illustrated via comparison to a published test result.
Keywords
Introduction
Fibres make a major contribution to the behaviour of reinforced concrete (RC) beams by bridging flexural cracks or sliding planes as illustrated in Figure 1(a).Fibres that bridge flexural cracks provide a concrete tensile force in addition to that from the reinforcement bridging the crack. Hence, they can enhance the flexural capacity (Schumacher, 2006) and reduce deflections and crack widths (Schumacher, 2006; Stang and Aarre, 1992) at serviceability. Fibres that bridge sliding planes allow for stable sliding which increases the ductility of the beam that is its ability to rotate and absorb energy.
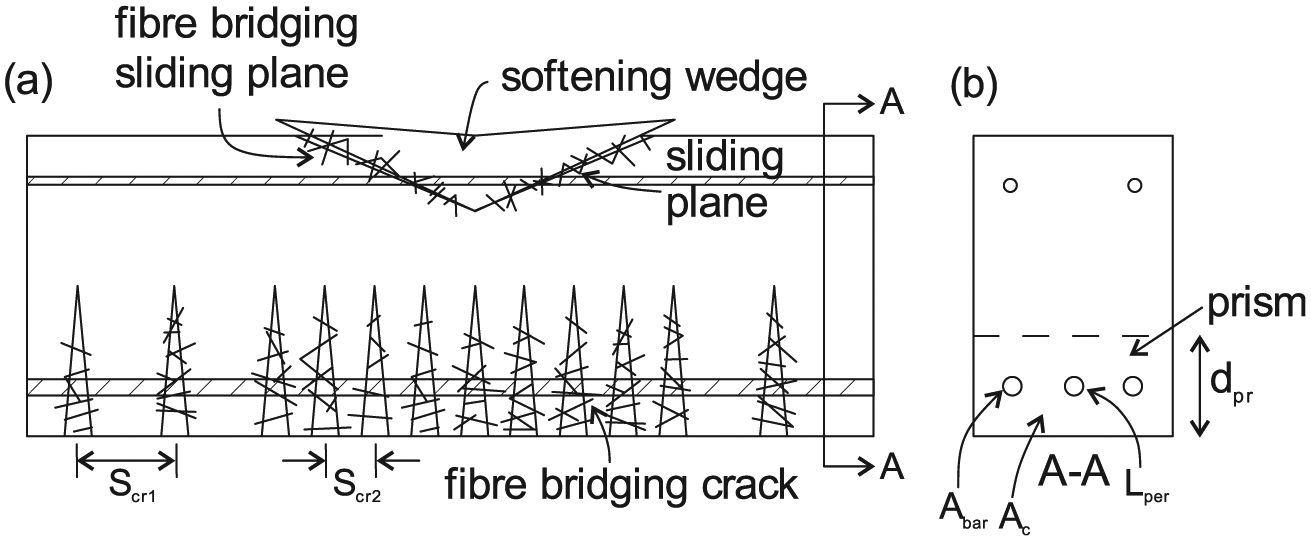
(a) RC beam with fibre concrete and (b) beam cross section.
There has been much experimental work on quantifying the effect of fibres on the local tensile behaviour after flexural cracking. In particular with regard to the stress across the crack induced by the fibres σfib, that is the longitudinal force in the fibre per square millimetre of concrete or effective concrete stress across a crack.This fibre stress σfib has been found to depend on the type of fibre, that is the material; the quantity, length, size and shape; as well as on the crack width wcr that the fibres bridge (Wille et al., 2014). There has also been much experimental work on quantifying the effect of fibres on the compressive behaviour in particular with regard to concrete softening where the fibres bridge the sliding planes (Bencardino et al., 2008; Nataraja et al., 1999). These tensile and compressive localised behaviours across cracks and sliding planes will be referred to in this article as partial-interaction (PI) material properties as they are associated with rigid body movements and slip between the fibre and the adjacent concrete.
A commonly used analysis for quantifying the flexural behaviour of RC beams is the strain-based moment/curvature (M/χ) approach in which all the deformations must be allowed for in terms of material strains. Because of this requirement, the PI material properties associated with fibre bridging of cracks and sliding planes cannot be directly applied. Instead, they are converted to pseudo strains which are often determined empirically (Oehlers et al., 2014a). Being empirical, these effective or pseudo properties can only be used within the bounds of the tests from which they were derived and consequently are of limited use and application. In contrast, a displacement-based moment/rotation (M/θ) approach (Oehlers et al., 2014b; Visintin et al., 2012a) can directly incorporate the PI material properties, that is without the need for pseudo approximations, and this is the subject of this article.
A PI M/θ segmental analysis will be used to quantify and explain the fundamental mechanisms that govern the behaviour of RC beams made with fibre-reinforced concrete (FRC). The major advantage of this approach is that it uses the PI tensile and compressive material properties directly. Hence, there is in theory no bounds to the application. The localised tension stiffening mechanics of FRC in tension is first developed followed by the localised shear-sliding mechanics for FRC in compression. These localised properties are then incorporated into a numerical segmental analysis that can explain and quantify the flexural behaviour of FRC RC beams at all load levels including the formation of hinges. Application of the numerical approach is shown via comparison to beam tests performed by Schumacher (2006).
Fibre concrete tensile material properties
Consider a direct tension test on FRC as in Figure 2(a) in which the total deformation D is measured over a gauge length Ldef. If the FRC has small amounts of fibre, then a single crack of width wcr will form as in Figure 2(a) after which the applied load will reduce and this is referred to as a strain softening material. Alternatively, for large amounts of fibre, micro cracks will first form as in Figure 2(b) and the applied load can be increased until a single crack stars opening after which the load reduces and this material is referred to as strain hardening (Wille et al., 2014).
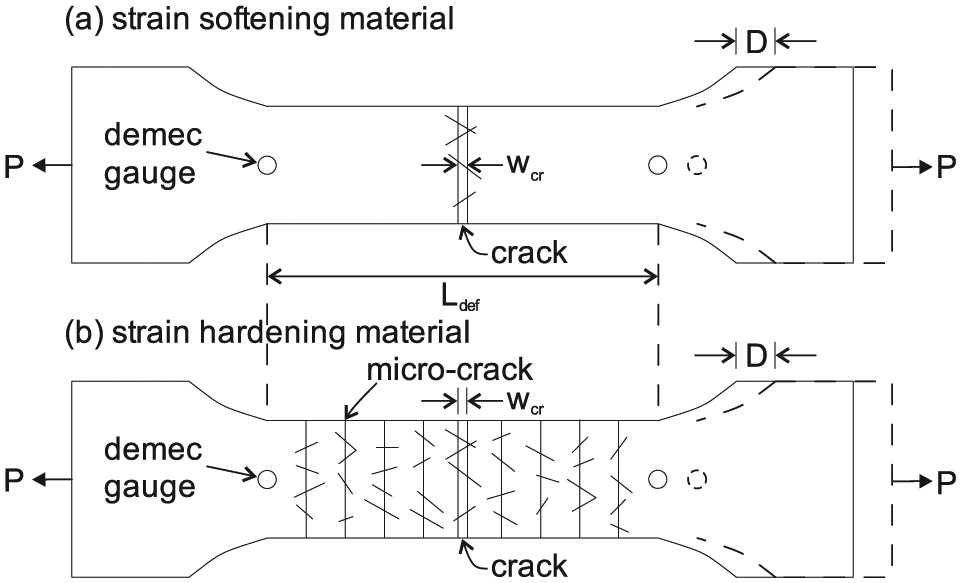
Direct tension test: (a) strain softening material and (b) strain hardening material.
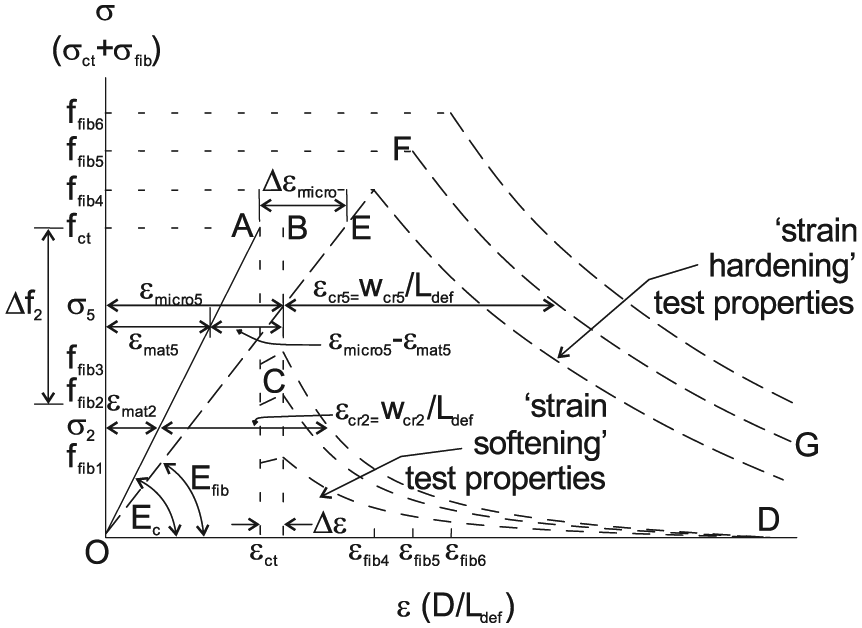
Typical results from these tests when under displacement control are shown schematically in Figure 3: where the stress in the ordinate is the applied force P in Figure 2 divided by the cross-sectional area Ac within the gauge length Ldef; and the total longitudinal deformation D over the gauge length, which can comprise of both material deformations and crack widening, divided by Ldef is the mean strain in the abscissa in Figure 3.
Tensile stress/strain from test.
Let us first consider the behaviour of a strain softening material in which there are low amounts of fibre as measured in the specimen in Figure 2(a). A typical result is idealised as the variation O-A-B-C-D in Figure 3. On initial loading, the σ/ε response follows the path O-A which depends purely on the concrete material modulus Ec which is shown as constant but does not have to be. At Point A, the specimen fractures at a stress fct and strain εct. The widening of the crack is resisted by the strains in the fibres that bridge the crack and also by friction or interlock between the aggregate which can be referred to cumulatively as crack bridging (Li et al., 1993). A deformation is required to strain the fibres to reach equilibrium and this is shown as the change in strain Δε which is normally quite small (Wille et al., 2014) and could be ignored. This deformation ΔεLdef is associated with a step change in the strength Δf2 after which the stress reduces along the path C-D as the crack widens and the fibres slip and pull out.
Consider the properties at stress level σ2 in Figure 3. Prior to cracking, the stress is a material stress σmat. However, after cracking, the stress is a material stress within the uncracked region and a fibre stress σfib within the crack. The strain εmat2 is the material strain. In contrast, the change of strain after cracking εcr2 is an effective strain due to the crack widening in Figure 2(a) that is wcr2/Ldef as shown in Figure 3. Hence, from test results processed as in Figure 3 can be derived the variation of the fibre stress σfib with half crack width as shown in Figure 4. The results have been plotted in terms of the half crack width wcr/2 because the reinforcement slips relative to each crack face by Δ that is wcr/2 which is required in the ensuing tension stiffening analyses.
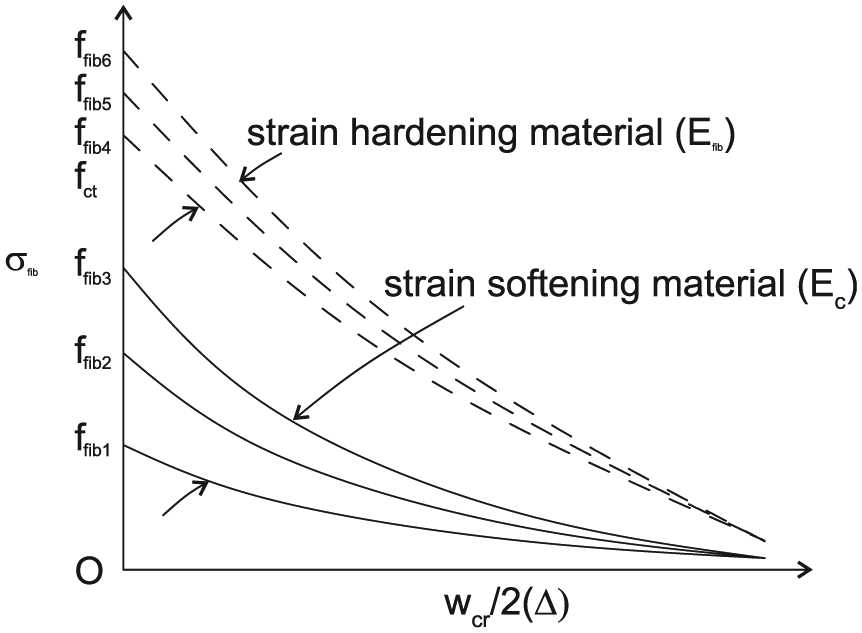
Variation of fibre stress with crack width.
Let us now consider the strain hardening response in Figure 2(b) with high amounts of fibre which follows a path such as O-A-E-F-G in Figure 3 when the test is under displacement control. On reaching the material strength fct at Point A, a single crack occurs reducing the overall stiffness and consequently the applied force. As the fibre strength ffib5 is greater than the material strength fct, on further pulling the specimen, the fibre stress σfib build up to fct to cause the next crack and so on. Hence, there is a rapid development of micro cracks along the specimen as shown in Figure 2(b). These micro cracks cause an effective increase in strain shown as Δεmicro from Points A to E in Figure 3. As the specimen is pulled further from Point E, the fibre stresses σfib increase from fct to ffib5 at Point F; this is the strain hardening component of the material. At Point F, the weakest of the micro cracks widens into a dominant crack as in Figure 2(a) after which this dominant crack widens with reduced fibre stress from Points F to G.
Micro cracking can be quantified through mechanics (Li et al., 2001). However, a simple and direct approach that does not compromise the mechanics is to incorporate micro cracking using and effective moduli that is Efib in Figure 3. Hence, at stress level σ5, εmicro5 is the strain of the micro cracked specimen in Figure 2(b) which is not an approximation as it allows for both strains in the fibre at micro cracks and strains in the concrete. Furthermore, although not required in the analysis, εmat5 is the strain within the uncracked material such that (εmicro5–εmat5)Ldef is the total width of micro cracks within Ldef in Figure 2(b). Finally, at σ5, εcr5 is equal to the dominant crack width wcr5 divided by Ldef. Hence, the relationship between σfib and wcr/2 in Figure 4 can also be extracted from strain hardening materials.
Fibre concrete tension stiffening mechanism
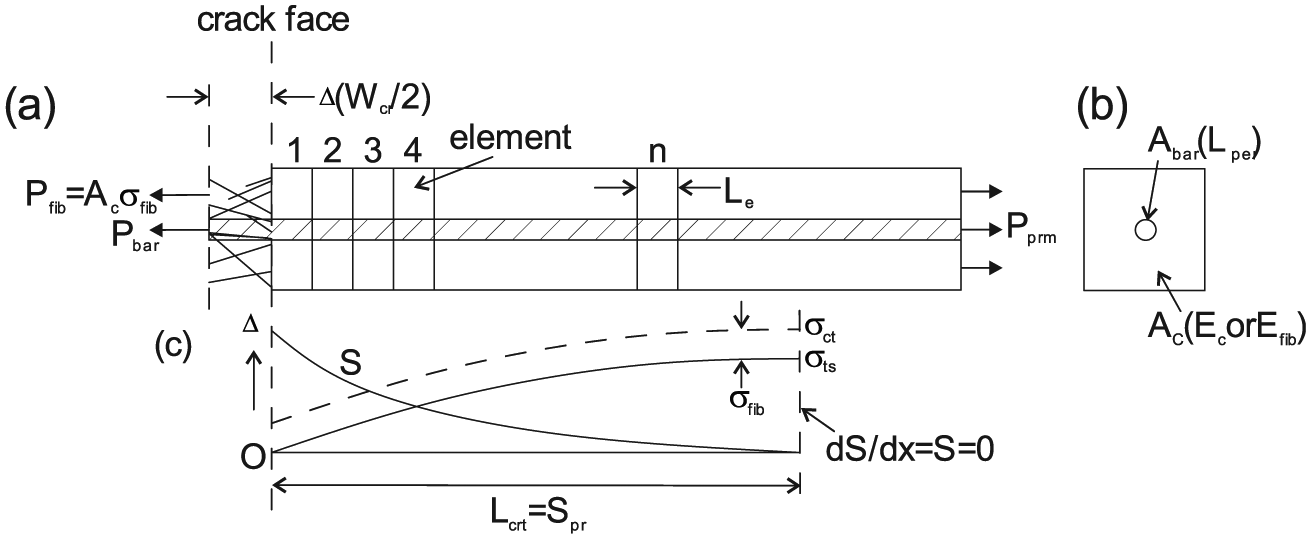
The interaction in the flexurally cracked region in Figure 1(a) between the reinforcing bars and the adjacent concrete and fibres can be quantified through tension stiffening mechanics. This tension region is idealised as the symmetrical prism (Knight et al., 2013) in Figure 1(b) of depth dpr in which the total concrete area is Ac, area of all the reinforcement in the prism Abar and the sum of the perimeter lengths for all the reinforcing bars that comprise Abar is Lper. Closed-form solutions (Haskett et al., 2009; Muhamad et al., 2012) and numerical solutions (Haskett et al., 2008; Visintin et al., 2012a, 2012b) are available to quantify the behaviour of prisms with concrete without fibres which includes not only short-term effects but also the time-dependent effects of creep and shrinkage (Knight et al., 2013; Visintin et al., 2013). This article deals with the effect of fibres and will not deal with time effects which can be easily included if desired (Visintin et al., 2013).
Single crack tension stiffening
Having extracted the σfib/Δ PI material properties as in Figure 4, they can now be included directly in the PI tension stiffening mechanism. The tension stiffening prism in Figure 5(b) will have a concrete modulus of Ec when dealing with strain softening fibre concrete or Efib when dealing with strain hardening fibre concrete. The initially uncracked prism in Figure 5(a) is subjected to an axial tensile force Pprm shown on the right-hand side which causes the initial crack on the left-hand side of the prism. Once the initial crack has formed, the longitudinal force in the prism Pprm comprises of that in the reinforcement Pbar and that in the fibre Pfib which is Acσfib.
Single crack tension stiffening mechanism: (a) tension stiffening prism (b) cross section.
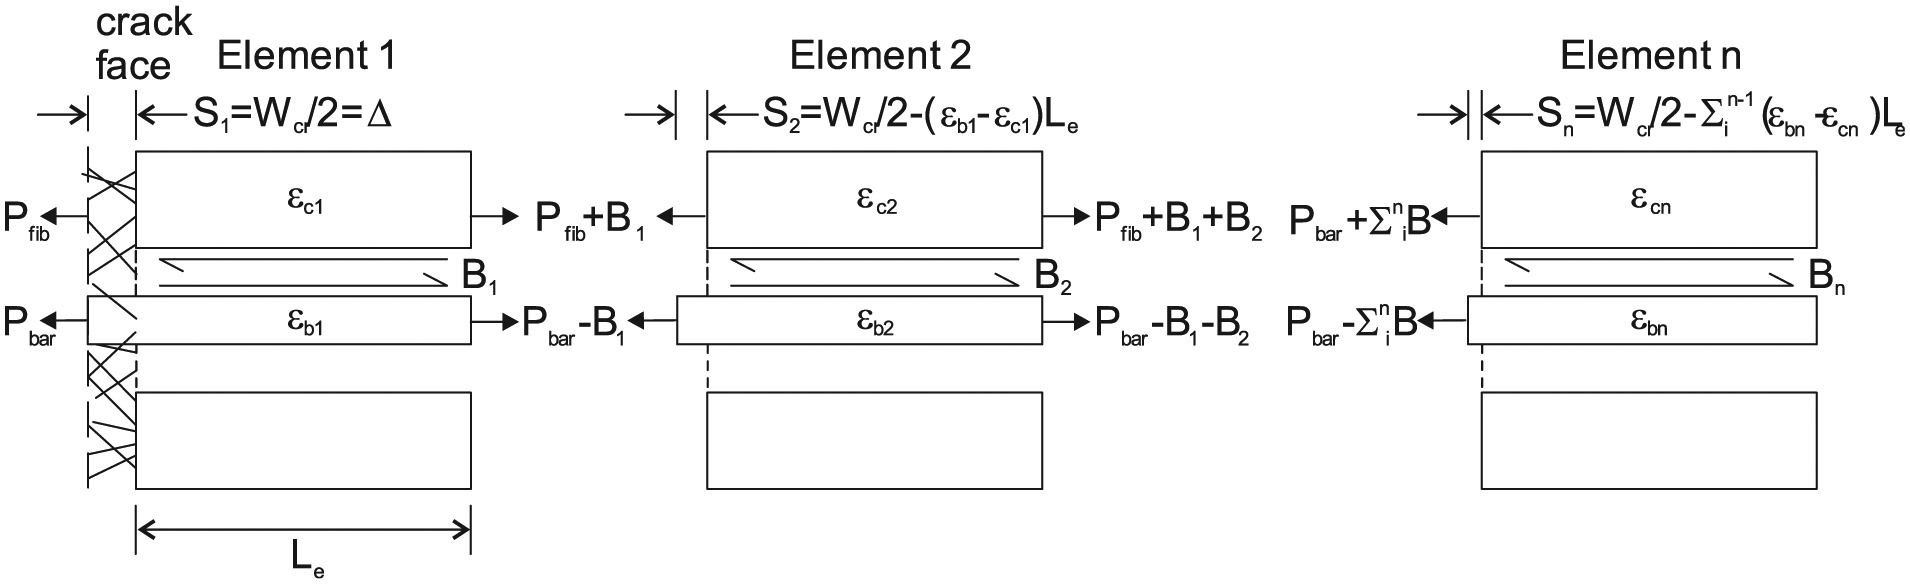
The distribution of the total axial force Pprm between Pbar and Pfib in Figure 5(a) can be determined from a numerical tension stiffening analysis. The prism is sliced into very small elements of length Le so that their average properties can be taken; the elements are numbered from the crack face as shown in Figure 5(a) and again for Elements 1, 2 and n in Figure 6.
Tension stiffening numerical analysis.
Consider the numerical analysis in Figure 6 under displacement control. In this case, a slip at the crack face S1 in Figure 6 is imposed; this is also half the crack width that is wcr/2 as shown. As S1 is known, the shear stress for this slip τ1 can be derived from the bond–slip (τ/δ) material properties (fib, 2012; Harajli et al., 1995) so that the bond force B1 in Element 1 is τ1LeLper. The force in the bar at the crack face Pbar is guessed or estimated and it is a question of iterating for known boundary conditions to find the exact value. The bond force B1 reduces the tensile force in the bar to Pbar – B1 and increases the tensile force in the concrete to Pfib + B1 as shown on the right-hand side of Element 1. The bar strain εb1 is the mean tensile strain in the bar due to the forces Pbar and Pbar – B1 and from which can be derived the mean stress σbt1. Similarly, εc1 is the mean tensile strain in the concrete and consequently the mean concrete stress σct1. The slip–strain in Element 1 (ds/dx)1 is εb1 – εc1.
The forces on the left of Element 2 in Figure 6 are those on the right of the preceding Element 1. The slip S2 is the slip in the preceding Element 1 less the product of the slip–strain in Element 1 times the length of the element Le that is S2 is wcr/2 – (εb1 – εc1)Le as shown. For this slip S2, the bond force B2 can be determined and the analysis proceeds as with the first element. The analysis is summarised in the nth element in Figure 6. It is a question of varying Pbar until a specific boundary condition is reached which for the prism in Figure 5(a) is that the slip–strain, ds/dx, and slip, S, tend to zero at the same point as shown in Figure 5(c). It is worth noting that at the crack face in Figure 6, Pbar increases with the slip at the crack face Δ whereas from Figure 4 Pfib reduces with Δ.
A tension stiffening analysis of the single crack tension stiffening mechanism in Figure 5(a) gives the critical length Lcrt in Figure 5(c) within which there is partial interaction. This is also the length over which the tensile stress in the concrete σct reaches its maximum and, therefore, the position at which a primary crack would occur that is the primary crack spacing is Spr which equals Lcrt.
The tensile stress in the concrete due to bond σts in Figure 5(c) varies from zero at the crack face to a maximum at Spr from the crack face. Superimposed on this stress distribution is the initial fibre stress σfib which gives concrete stress σct. When σct at Spr equals the concrete tensile strength fct, a primary crack will occur. Hence, the tension stiffening analysis will give the force in the prism to cause primary cracks Pprm-pr.
The tension stiffening analysis in Figure 5(a) can also be used to determine the maximum bond force which is also the maximum force in the bar that depends on the material bond–slip properties τ/δ and is not limited by the tensile capacity of the prism due to a crack closure mechanism (Oehlers et al., 2015). This is referred to as the intermediate crack (IC) debonding resistance PIC. Tension stiffening mechanics shows that this occurs when the slip at the crack face Δ reaches the bond–slip capacity δmax (fib, 2012; Harajli et al., 1995). Hence, the prism force at which IC debonding of the reinforcement occurs Pprm-IC is equal to the IC debonding resistance of the reinforcement PIC plus the fibre force at the slip δmax that is Pfib(δmax). This is an upper limit to the prism force. The other upper limit is the yield strength Pyld or fracture strength of the reinforcement Pfr whichever is the lower.
Multi-crack tension stiffening
Where and when primary cracks are formed in Figure 5 at Pprm-pr, segments are formed between cracks at a spacing Spr as shown in Figure 7(a). The tension stiffening prism is now of a finite length Spr and is also symmetrically loaded as shown. Hence, the slip at mid-length Spr/2 is zero through symmetry. The tension stiffening analyses in Figure 6 can also be applied to this multi-crack case using the new boundary condition that is the slip S is zero at the mid-length at Spr/2 from the ends.
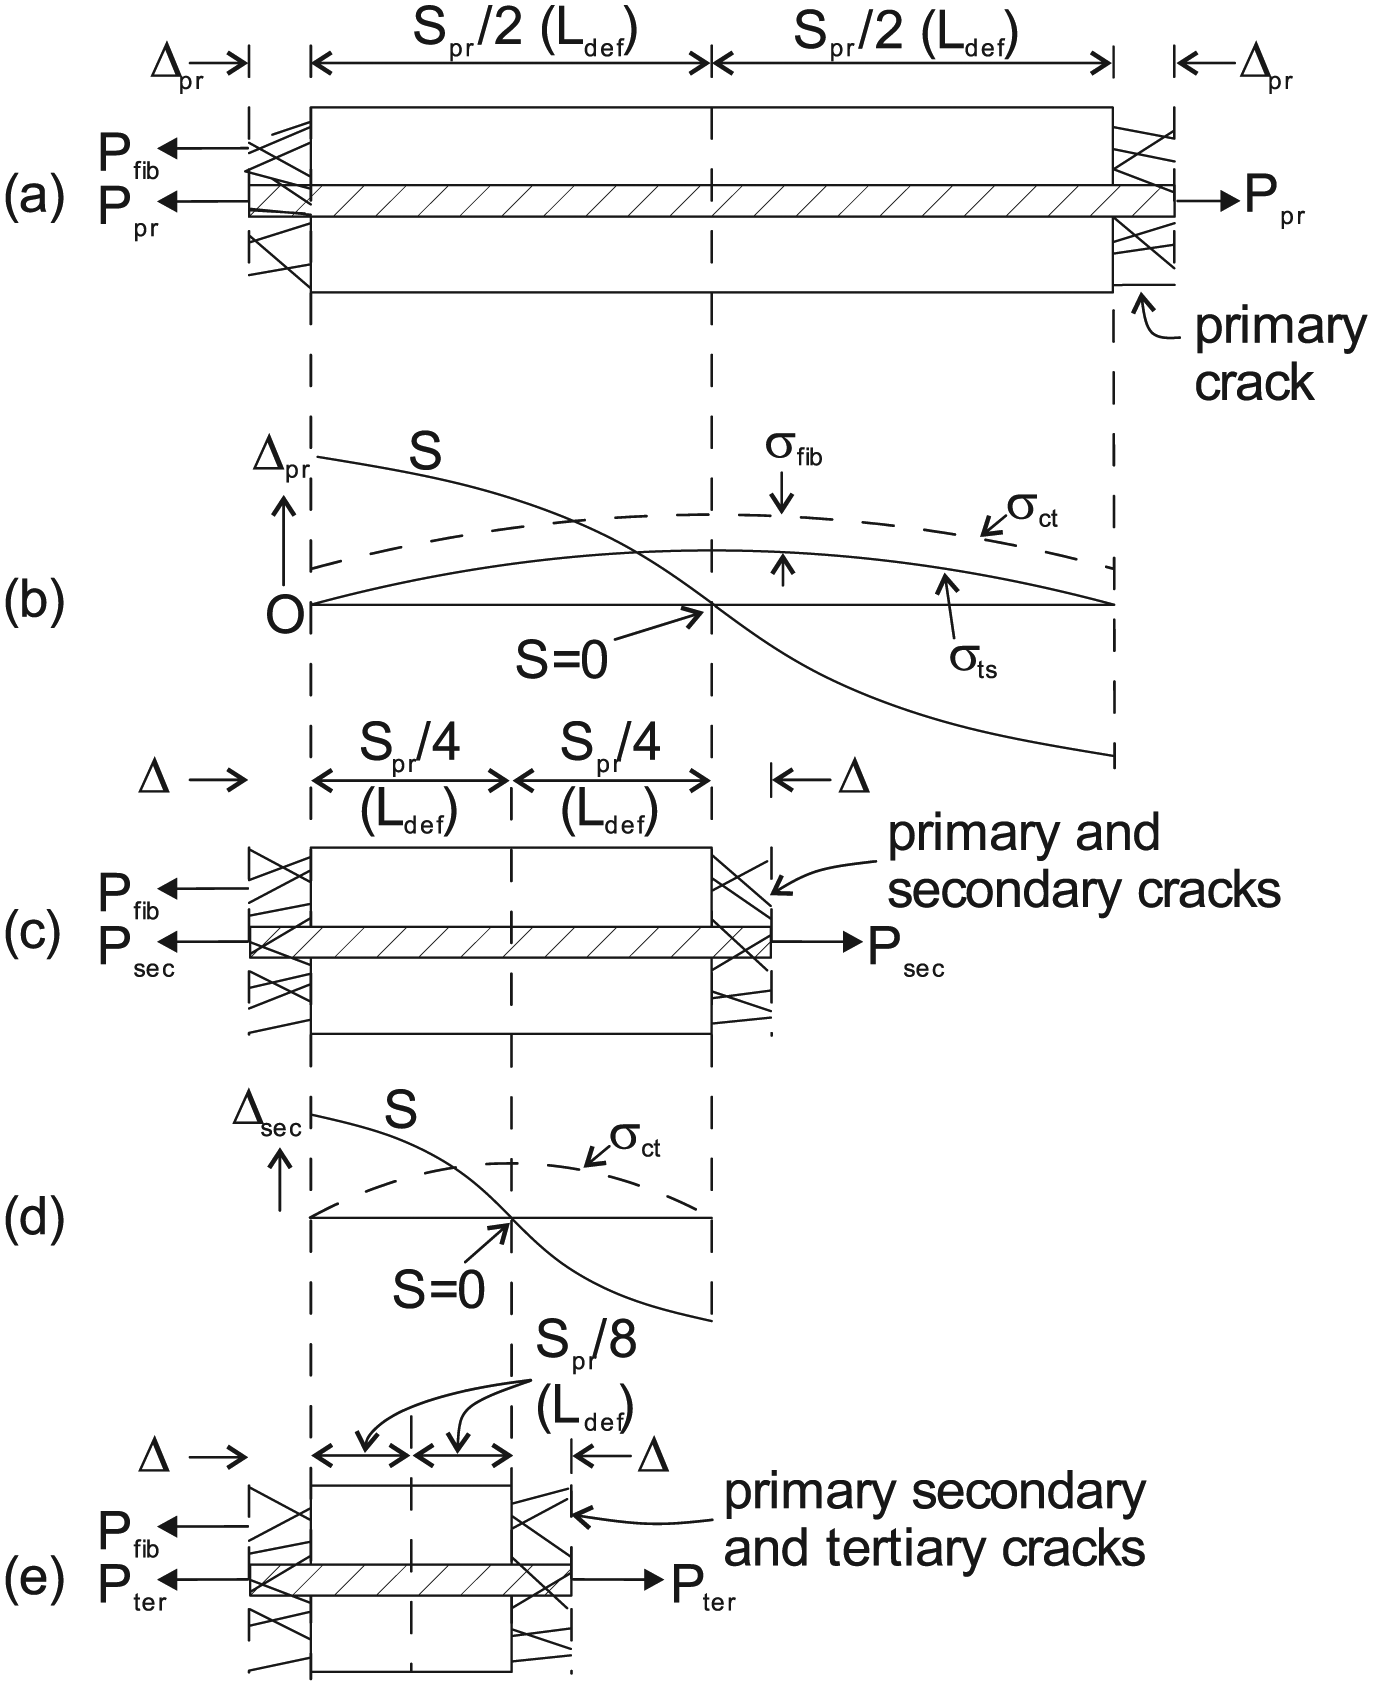
Multi-crack tension stiffening mechanism: (a) prism with primary cracks. (b) distribution of reinforcement stress and slip for (a). (c) prism with primary and secondary cracks. (d) distribution of reinforcement stress and slip for (c). (e) prism with primary, secondary and tertiary cracks.
The tension stiffening analysis can be used to quantify the relationship at the crack faces in Figure 7(a) between Pprm that is the sum of Ppr and Pfib, and Δpr. This will be referred to as the crack opening stiffness (COS) and when only primary cracks exist COSpr. The maximum concrete stress occurs at mid-length of the prism as in Figure 7(b). Hence, the tension stiffening analysis will also give the prism force to cause secondary cracks Pprm-sec should the bond strength be large enough; where secondary cracks exist the crack spacing is now Scr/2. It can be seen in Figure 7(b) that the fibre stress σfib supplements that due to tension stiffening σts so that beams with fibre concrete are more likely to crack which is the case (Wille et al., 2014).
Should secondary cracks occur, the crack spacing is now of length Spr/2 as in Figure 7(c) and (d) from which can be derived: the COS with secondary cracks COSsec and the prism force to cause tertiary cracks Pprm-ter. Should tertiary cracks occur, the crack spacing is now Spr/4 as in Figure 7(e) from which can be derived COSter and the prism force to cause quaternary cracks Pprm-qua and so on. The smaller the segment length Ldef in Figure 7, the less the bond force that can be generated to cause cracking. However, the segment length does not affect the fibre force. Hence, beams with fibre concrete will have smaller crack spacings.
Fibre concrete COS
From the analysis of the numerous segments depicted in Figure 7, can be derived the COS, that is the relationship between the total force in the prism Pprm and the slip at the crack face or half crack width Δ.
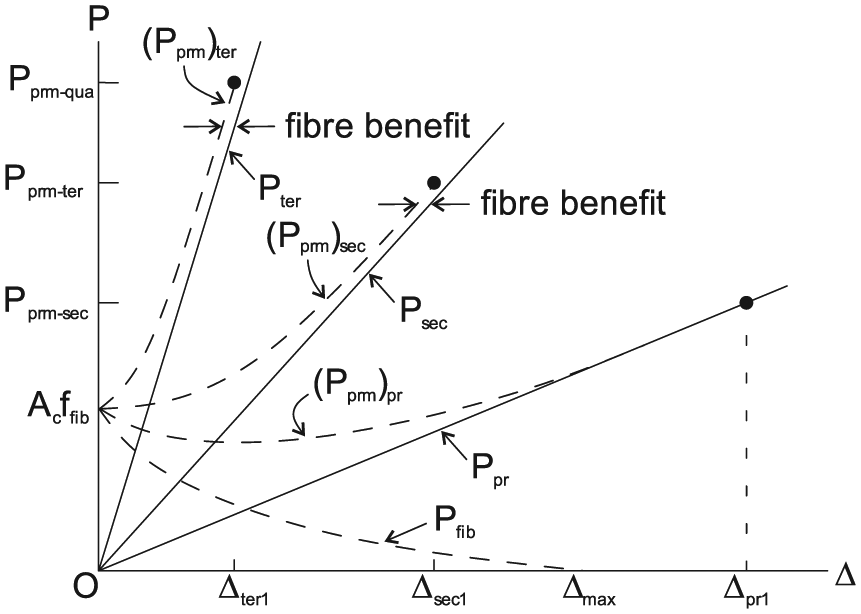
First consider a strain softening material such as O-A-B-C-D in Figure 3 from which the PI material property has been extracted as in the idealised variations in Figure 4. This is shown as the variation labelled Pfib in Figure 8 where the force is shown to tend to zero at a slip Δmax. From the tension stiffening analysis in Figure 6 applied to the multi-crack case in Figure 7(a) for primary cracks, can be extracted both the total force (Pprm)pr and the bar force Ppr for a given crack face slip Δ as in Figure 8; Ppr is shown as a linear variation just to help in the explanation. Also from the tension stiffening analysis can be extracted Pprm-sec that is the prism force to cause secondary cracks. At a given crack face slip Δ, Ppr plus Pfib equals (Pprm)pr. The difference between (Pprm)pr and Ppr is the benefit due to the fibres. Beyond Δmax, there is no fibre benefit and secondary cracks will occur at Δpr1 when Pprm-sec is reached.
COS for strain softening material.
After secondary cracks have formed, the tension stiffening analysis of Figure 7(c) with half the primary crack spacing now applies which can be used to derive in Figure 8 Psec, Pprm-sec and Pprm-ter. In this case, fibres have helped not only at low slips but also at the onset of secondary cracks. After tertiary cracking, the analysis in Figure 7(e) applies where it can be seen in Figure 8 that the effect of fibres at the onset of tertiary cracks is further increased.
The above analyses have been repeated for a strain hardening material in Figure 9. In this case, the strain hardening material properties in Figure 4 have been used as well as the effective stiffness Efib in Figure 3 to allow for micro cracking. With a strain hardening material, there is no step change such as Δf2 after cracking as shown in Figure 9. The behaviour is similar to that with softening materials. However, there is one important point worth noting. Consider the variation with tertiary cracks (Pprm)ter which immediately rises above the level Acffib. At first glance, this would suggest that the next crack occurs immediately. However, this is not the case. Consider the results at Δ1. The fibre force is P1 and this directly applies a stress P1/Ac to the concrete. In addition, the force in the bar is P2 such that the total force is P3. In contrast, P2 is not applied directly to the concrete but only part of it goes into the concrete through bond–slip; the shorter the prism that is the crack spacing the smaller the portion of Pbar that goes into the concrete that is to stress the concrete. Hence, the stress in the concrete is less than P3/Ac; when the concrete cracks again is given by Pprm-qua. There is a theoretical possibility, particularly with very small crack spacings such that the COS of the bar is very high, that cracking will occur immediately. In which case it is suggested that no new dominant cracks should be allowed to occur that is, the crack distribution should be considered to have stabilised.
COS for strain hardening material.
Fibre concrete in compression
Fibres bridging the sliding plane in the softening wedges in Figure 1(a) allow a more gradual deformation through the shear-sliding mechanism which enhances the flexural ductility of the RC beam.
Shear-sliding mechanism
The potential sliding plane in Figure 10 is subjected to a normal force N across the sliding plane which induces a normal stress σn (N/Ac) and a shear force T and consequently a shear stress τn (T/Ac). The shear force T induces a rigid body displacement S between the concrete segments on either side of the sliding plane and through aggregate interlock the segments separate by wcr.
PI shear-friction material parameters.
The relationship between σn, τn, S and wcr in Figure 10 is the PI shear-friction material property (Chen et al., 2015; Oehlers et al., 2014) which can be represented as in Figure 11. For example, for a given crack width wcr3 and confinement σn3, there is only one value of interface slip S3 and only one value of shear stress τn3 as shown.

PI shear-friction material properties.
Prior to sliding the confinement σn in Figure 10 is only due to N that is it is an active confinement. Now consider the effects of a reinforcing bar bridging the sliding plane in Figure 10. In this case, the right-hand segment in Figure 10 is shown in Figure 12 with the reinforcement. For a crack width of wcr, the reinforcement slips relative to the crack face Δ = wcr/2. This is a tension stiffening mechanism as illustrated in Figure 5 such that the tension stiffening analysis in Figure 6 can be used to quantify the COS for the single crack mechanism in Figure 5(a) (Haskett et al., 2008, 2009). Let the embedment length of the reinforcing bar Lemb be defined as the distance from the crack face to the end of the bar. There are now two boundary conditions to consider for the tension stiffening analysis in Figure 6: the full-interaction boundary condition ds/dx = S = 0 as before; and that the strain in the bar εbar at its end at Lemb is zero.
Shear-sliding mechanism.
Typical variations of the COS for a single crack analysis are illustrated in Figure 13 (Haskett et al., 2008); all of which have an upper limit of when the reinforcement yields Pyld or fractures Pfr and which are not shown. When the embedment length of the reinforcing bar Lemb is greater than Lcrt in Figure 5(a), then the IC debonding resistance PIC is reached at δmax as in O-C in Figure 13. Any further increase in crack width along C-D is accommodated by IC debonding such that the increase in the crack face slip is equal to the debonded length times the strain in the bar εIC at PIC as shown. After which as the bonded length reduces below Lcrt, the force reduces and in theory follows the path D-B (Haskett et al., 2008). When the embedment length Lemb is less than Lcrt, then the COS properties follow the path O-A-B such that the peak force at Point A is less than PIC and the only boundary condition that has to be considered is εbar = 0 at Lemb.

COS from single crack analysis.
For a given crack face slip Δ in Figure 12, the increase in the bar force ΔPbar at the crack face can be obtained from the COS properties in Figure 13. This is balanced by an increase in compression across the crack face Δσn as shown such that the resultant compressive force ΔσnAc is the same magnitude as ΔPbar and in line with ΔPbar. Hence, the shear-sliding mechanism does not change the overall equilibrium but, very importantly, does provide a passive increase to the confinement Δσn.
The importance of this passive confinement Δσn is illustrated in Figure 11. Let us assume that the confinement labelled σn1 is the active σn in Figure 12. When there is no reinforcement crossing the sliding plane, then the shear stress reduces with slip along the Path A-B in Figure 11 such that sliding causes an immediate reduction in strength. When a reinforcing bar crosses the sliding plane as in Figure 12, the shear-sliding mechanism already described can be used with the shear-friction material properties and the COS properties to quantify the increase in the passive confinement Δσn and consequently the path such as A-C in Figure 11. Additional reinforcement may cause the path to change to A-D where if yield occurs at D it would then follow D-F otherwise D-E until fracture. It can be seen that this passive confinement may increase the strength but much more importantly increases the ductility that is it can allow much greater slips without undue changes in shear force. Furthermore, for reinforcing bars bridging a sliding plane, their effect can now be quantified through PI mechanics.
Fibres crossing the sliding plane as in Figure 1(a) act as small reinforcing bars which through the shear-sliding mechanism provide passive confinement and hence increase the ductility. However, applying shear-sliding theory directly to fibre reinforcement is complex due to the random three-dimensional orientation of the fibres relative to the sliding plane and random variation of the embedment lengths relative to the sliding plane. An alternative approach is to treat the effect of the fibre passive confinement as a PI material property that can be derived through standard shear-friction tests (Haskett et al., 2010; Walraven and Reinhardt, 1981) such as that illustrated in Figure 10.
Size-dependent compressive σ/ε
It is a question of how to accommodate the wedges restrained by fibre in Figure 1(a) in a flexural analysis. Consider a compression test as in Figure 14 of length Ltest in which the total deformation under applied compressive load is D and where there are also strain gauges to measure the material deformation εmatLtest.
Compression test.
The variation of the deformation D in Figure 14 with axial stress is shown in Figure 15. On application of the load, the ascending branch O-A up to the peak strength fcc is due to the material deformation as given by the strains εmat from the strain gauges in Figure 14 that is D = εmatLdef. Within the ascending branch, micro cracking may occur to cause non-linearity but this can be assumed to be spread throughout the whole specimen and can, therefore, be considered to be part of the material behaviour or property.
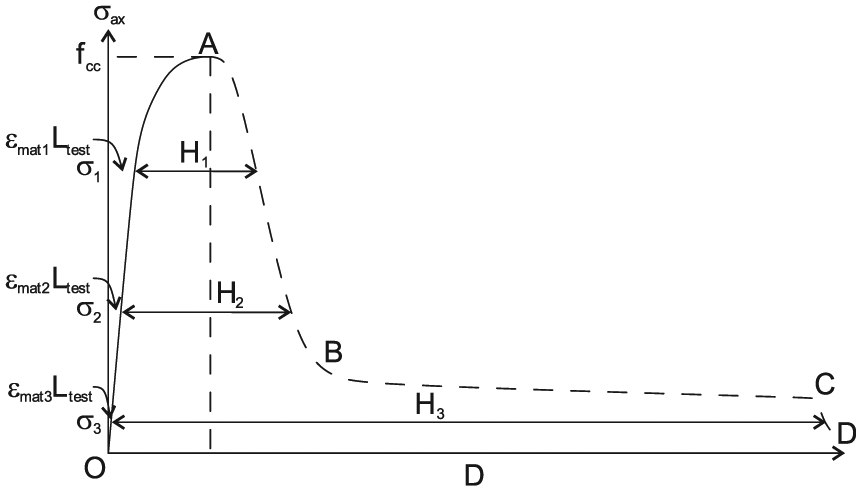
Deformation of compressive test specimen.
The single sliding plane at an angle α (Balmer, 1949; Cusson and Paultre, 1995; Van Mier and Man, 2009) in Figure 14 is formed at fcc in Figure 15, or to state it another way, the peak strength fcc occurs when a single sliding plane develops at the weakest diagonal or concrete zone. The longitudinal component of the deformation of the sliding is shown as H in Figure 14. Along the descending branch A-B-C-D in Figure 15, the deformation is now due to the material deformation εmatLtest as shown plus that due to the longitudinal component of movement along the sliding H also shown.
The axial force Pax in Figure 14 can be resolved into the normal component to the sliding plane N as shown such that the normal stress to the sliding plane σn is Pax divided by the cross-sectional area of the sliding plane, and the shear component T such that the shear stress along the sliding plane is τn. Hence, the deformation H due to sliding could be obtained from (1) the shear-friction properties of the concrete without fibres plus the COS of the fibres as given by Figure 4; or (2) the shear-friction properties of the fibre concrete should they be available; or (3) directly from the experimental compression tests as follows which is probably the more convenient approach.
Dividing the abscissa D in Figure 15 by Ltest gives the equivalent strain as in Figure 16 for the test specimen of length Ltest. If the specimen in Figure 14 was doubled in height that is Ldef = 2Ltest, then the ascending branch O-A in Figure 16 remains unchanged as this is purely a material behaviour but the equivalent strain due to sliding H would be halved (Chen et al., 2014; Visintin et al., 2014) as shown. Hence, an equivalent size-dependent σ/ε relationship can be derived from a single size test of height Ltest for any specimen size Ldef. It can be seen that this approach even allows for snap back and shows that the ductility of the descending branch reduces with deformation length. Fibre concrete tends to have a large tail B-C-D in Figure 16. Even for large deformation lengths such as Ldef1 where the descending branch A-E may experience significant snap back and consequently a significantly reduced contribution, the strains in the tail E-F can still make a large contribution and help in the ductility; this is the reason why fibres improve the ductility at the ultimate limit state.
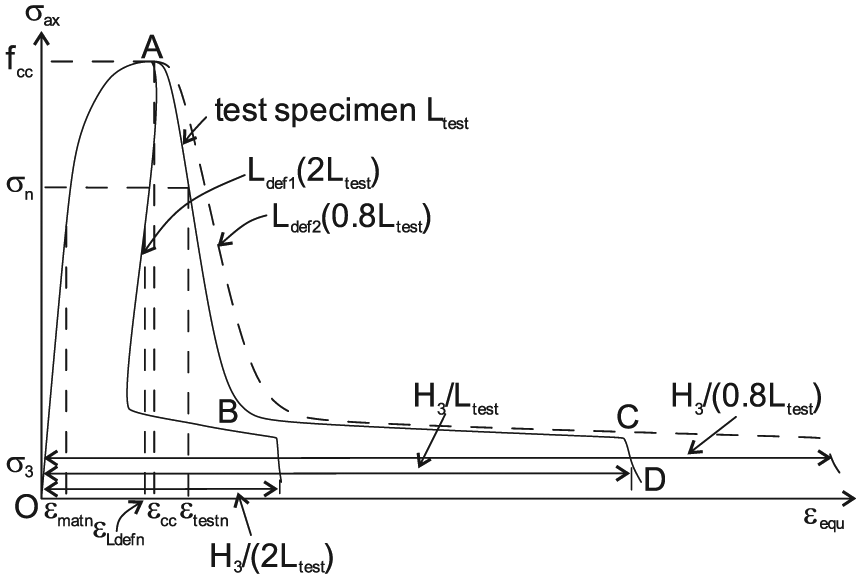
Size-dependent equivalent σ/ε.
From the transposition in the previous paragraph. For a specific nth level of axial stress (σax)n, the strain in the descending branch in Figure 16 for a specimen of length Ldef can be derived from a test of length Ltest from

where (εmat)n is the material strain at stress (σax)n and (εtest)n is the total strain from the test at stress (σax)n. Hence, the equivalent stress–strain relationship can be derived for any length of deformation length Ldef from just one specimen size Ltest (Chen et al., 2014; Visintin et al., 2014) for use in the following flexural analyses.
Segmental analysis
The PI tension stiffening behaviour and the PI softening mechanism can be incorporated directly into a segmental analysis (Visintin et al., 2012a). First consider a segment that is not in the vicinity of the softening wedges in Figure 1(a) and between adjacent flexural cracks such as those spaced at Scr1. This segment will be symmetrically loaded so that it is only necessary to consider half the segment as in Figure 17.
An Euler–Bernoulli displacement is applied to the left-hand face as in Figure 17(a) in which the rotation is θ and the depth to the neutral axis is dNA. This deformation induces a linear strain distribution over the uncracked region as in Figure 17(b). Within the uncracked region that is dNA and dun in Figure 17(a), the stresses in Figure 17(c) can be derived directly from the strain distribution in Figure 17(b) using material stiffness. The force in the concrete Pcc in Figure 17(d) depends on the ascending branch of the concrete stress–strain such as O-A in Figure 16 which is purely a material property and consequently not size dependent. In the cracked region of depth dcr in Figure 17(a) above the prism, the force due to the fibre stresses σfib varies with the crack width Δcr and can be obtained from Figure 4 which depends on whether the material is strain softening or strain hardening. Finally, the force in the prism Pprm in Figure 17(d) which depends on the half crack width Δpr in Figure 17(a) can be obtained from the COS from either Figure 8 or 9.

Segmental analysis prior to softening: (a) segment. (b) strain profile. (c) stress profile. (d) force profile.
For a given rotation θ in Figure 17(a), it is a question of varying the neutral axis until the forces in Figure 17(d) are in equilibrium. This analysis can continue until concrete softening starts when the maximum concrete stress in Figure 17(c) just reaches fcc that is the ascending branch O-A in Figure 16 is fully developed. From this analysis can be obtained the M/θ up to concrete softening. Dividing the rotation by Ldef gives the moment/curvature (M/χ), the slope of which gives the flexural rigidity. It may be worth noting that shrinkage and creep (Visintin et al., 2013) can be included in the segmental model if so required but it has not been done here.
From this analysis in Figure 16 can also be obtained the depth of the neutral axis dNA at the onset of fcc which is also the depth of the softening wedge as in Figure 18(a). The angle of the wedge (Balmer, 1949; Cusson and Paultre, 1995; Van Mier and Man, 2009) α is often taken as 26° and consequently, the length of wedge Lwdg can now be derived. Once concrete softening starts at fcc, then a wedge forms, in which case the segment length Ldef must encompass the softening wedge Lwdg as shown in Figure 18(a). The Euler–Bernoulli deformation is shown in Figure 18(b) where the total rotation is the sum of all the n crack face rotations θ encompassed within the segment. Similarly, the total deformation at the level of the reinforcement is the sum of all the n crack face slips Δ encompassed within the segment; bearing in mind, the Pprm in Figure 18(f) depends on Δ at one crack face only. Within the depth of the neutral axis dNA in Figure 18(a), the concrete stress–strain is now given by the size-dependent stress–strain in Figure 16 for the specific deformation length Ldef in Figure 18(a) which automatically allows for the wedge sliding. The rest of the analysis follows that for Figure 17.

Softening hinge.
Example of application
In order to provide an example of the application of the segmental approach, identical beams with and without fibres as tested by Schumacher (2006) have been simulated. The beams with have a total depth of 300 mm and a width of 150 mm are reinforced with 2 10 mm diameter ribbed steel bars with a yield stress of 571 MPa located at an effective depth of 270 mm.
A schematic of the concrete compressive stress–strain relationship and tensile stress crack width relationship is shown in Figure 19 where the FRC mix design was identical to that of the conventional concrete but with the addition of 60 kg/m3 of steel fibres with an aspect ratio of 80. The ascending region of the compressive stress–strain relationship of the concrete was assumed to follow the general shape defined by Hognestad (1955) with a compressive strength fcc of 51 MPa and a strain at peak stress ε0 of 0.001857 for both the conventional and FRC. The descending portion of the compressive stress–strain relationship was taken to be linear defined by an ultimate strain εu which was taken as 0.00295 for conventional concrete and 0.0041 for the FRC. The tensile cracking stress fct was taken to be 4.5 MPa, the transition crack width w0t 0.058 mm corresponding to a transition stress σt of 0.65 and the ultimate crack width wut as 7.5 mm.
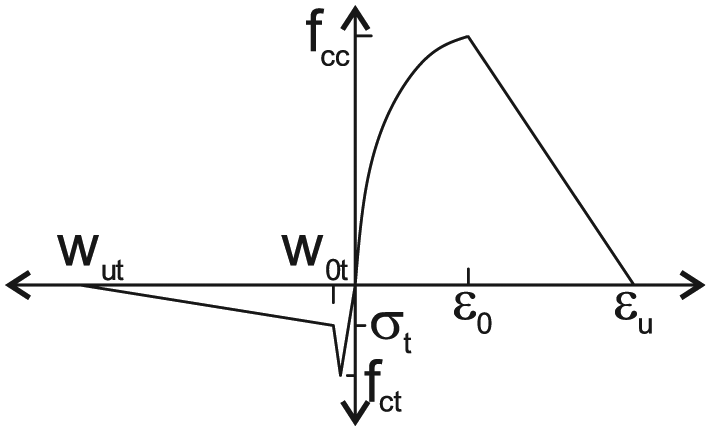
Concrete material properties for analysis.
Pull tests conducted by Schumacher (2006) on both the fibre-reinforced and conventional concrete showed no significant improvement in the local τ/δ bond properties due to fibre addition and hence for analysis the τ/δ were taken as that suggested by FIB Model code 2010 (fib, 2012).
The moment equivalent curvature relationships for both the conventional and FRC obtained using the segmental approach are shown in Figure 20. Comparing the curves for conventional and FRC, it can be seen that the addition of fibres leads to an increase in moment capacity due to the additional tensile force carried by the concrete. Furthermore, it can be seen that as rotations increase and fibres completely pull out of the crack face, the moment curvature relationship of the FRC tends to that of the conventional concrete.

Moment equivalent curvature relationships from segmental analysis.
Using the moment equivalent curvature relationships in Figure 20, a standard deflection analysis by integration analysis was undertaken in order to produce the load–deflection plots in Figure 21. Comparing the experimental and predicted results, it can be seen that the segmental approach is capable of predicting the full range of load–deflection behaviour for both conventional and FRC.
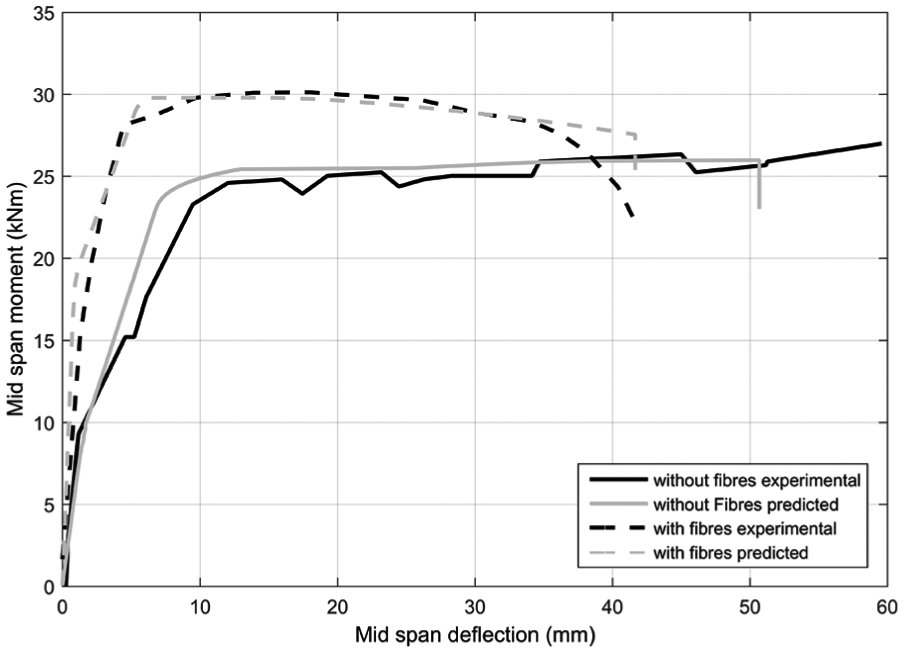
Comparison with experimental results of Schumacher (2006).
As a further example of the benefit of FRC, the moment crack width relationship for both the conventional and FRC in the serviceability loading range is shown in Figure 22. It can be seen that the addition of fibres leads to a reduction of crack width of approximately 100%, suggesting that even a minor addition of fibres can improve the serviceability behaviour of concrete.
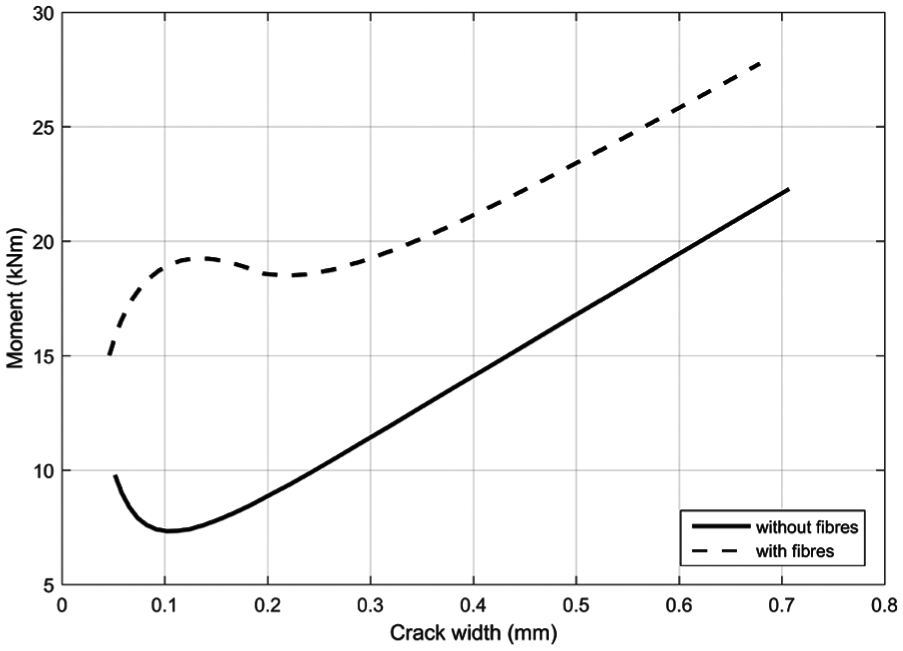
Variation in crack width prior to reinforcement yielding.
Conclusion
It is shown that the major contribution of fibres to the tension region is not in providing a tensile strength after flexural cracking as by itself the effect may be fairly insignificant depending on the volume fraction of fibres in the mix. But rather that the major contribution of fibres in tension regions is through the PI tension stiffening mechanism. This is because the fibres through tension stiffening allow the development of more and finer cracks both of which are quantifiable using the proposed approach. This in effect makes the concrete in tension more ductile and allows the tensile fibre forces within cracks to make a major contribution not only at serviceability limit but also at the ultimate limit state all of which are quantifiable through mechanics.
It is also shown that the major contribution of fibres to the compression region is through the PI shear-sliding mechanism. Through this sliding mechanism, the fibres induce passive confinement across the sliding planes of softening wedges that they bridge that allows more rotation which is also quantifiable through mechanics.
The mechanics that govern the behaviour of RC beams with FRC concrete has been described in a form suitable for a numerical model. The model can simulate all aspects of the flexural behaviour in particular the formation of discrete cracks and the softening of concrete in hinges. It is particularly useful as it allows experimentally measured fibre concrete material properties, such as the variation of fibre stress with crack width and the softening of fibre concrete, to be used directly in the displacement-based model. The fundamental mechanics of FRC RC beams and the numerical model described should help quantify the effects of different types of FRC and eventually help in the development of design rules.
Footnotes
Appendix 1
Declaration of Conflicting Interests
The author(s) declared no potential conflicts of interest with respect to the research, authorship and/or publication of this article.
Funding
The author(s) disclosed receipt of the following financial support for the research, authorship and/or publication of this article: The authors would like to acknowledge the support of the Australian Research Council ARC Discovery Project DP140103525 ‘A new generic approach for assessing blast effects on reinforced concrete members’ and the support of the Air Force Office of Scientific Research under award number FA2386-16-1-4098.