



Abstract
This article focuses on variations of local wind forces along height levels of a tall building due to an adjacent tall building with various height and breadth ratios through huge wind tunnel experiments. It deals with the characteristics of local wind forces including root mean square local wind force coefficients, non-dimensional power spectra, and root coherences along height levels of a tall building with an adjacent tall building in critical locations. It is shown that increases of over 20% in interference factors (MIFMD, RIFMD, and RIFML) for maximum mean and root mean square base overturning moment coefficients in along- and across-wind directions occur when the adjacent building is close to the principal building. Higher and wider adjacent buildings can cause not only higher mean wind loads but also higher dynamic wind loads in along- and across-wind directions, but the critical locations of an adjacent building with various height and breadth ratios are somewhat different. However, most critical locations of an adjacent building for wind-induced wind loads are within the region (X/B, Y/B) = (1.5, 0–1.5).
Keywords
Introduction
Wind loads on grouped tall buildings can be different from those on isolated buildings due to the effects (called interference effects) of adjacent tall buildings. Interference effects have been studied by many researchers over the past several decades (Bailey and Kwok, 1985; Khanduri et al., 2000; Taniike, 1992; Thepmongkorn et al., 2002; Xie and Gu, 2004, 2007; Zhao and Lam, 2008). However, previous studies have focused on structural wind loads and wind-induced responses of a tall building through high-frequency force balance (HFFB) and aeroelastic model tests. Particularly, HFFB approaches have to assume spatial distribution of wind loads because only base forces and moments are available. Although the equivalent static wind loading can be evaluated by distributing the base overturning moments to each floor, using local wind force spectra is the accurate method to analyze the dynamic response of a multi-degree-of-freedom system with non-linear or non-uniform mode shape (Lin et al., 2005). In addition, local wind force spectra along the height of a tall building due to an adjacent tall building may also differ from those of an isolated building. The interference effects on local wind forces considering wind directions from 0° to 355° have rarely been studied.
This article focuses on characteristics of local wind forces along height levels of a tall building with various locations and sizes of an adjacent tall building. Mean and root mean square (RMS) local wind force coefficients in the along- and across-wind directions, force spectra, and coherences along nine levels of a tall building with an adjacent tall building are presented and discussed.
Outline of wind tunnel test
Simulated natural wind
Wind tunnel experiments were performed in a Boundary Layer Wind Tunnel whose working section was 1.8 m high by 2.0 m wide. Figure 1 shows the condition of the approaching turbulent flow with a power law exponent of 0.27, representing an urban area based on Architectural Institute of Japan (AIJ, 2004). The mean wind velocity and the turbulence intensity at the top of the study model were UH = 8.2 m/s and IU = 20%, respectively, as shown in Figure 1(a) and (b). Power spectral density of fluctuating velocity with the turbulence length scale at the model top is represented in Figure 1(c). The turbulence scale was 268 m in full scale.
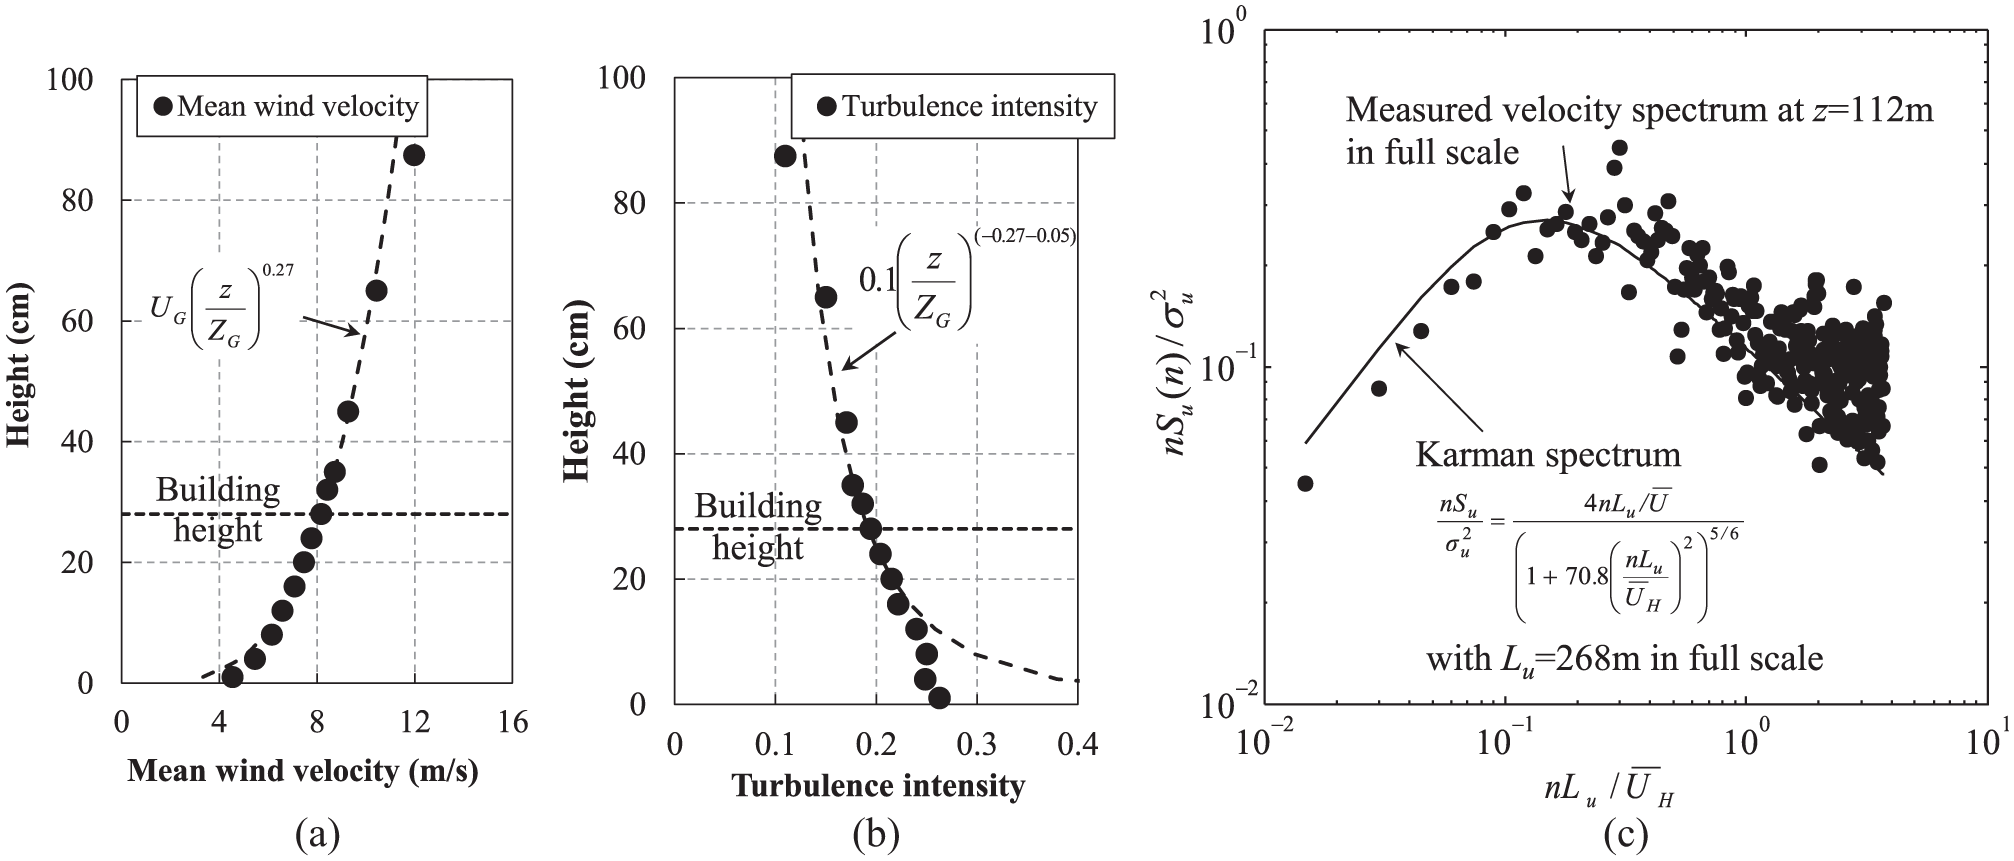
Wind profiles simulated in wind tunnel: (a) mean wind speed, (b) turbulence intensity, and (c) fluctuating velocity power spectral density.
Experimental set-up
The considered experimental model comprises two buildings: one is the pressure model (hereafter, referred to as a principal building) and the other is dummy model (hereafter, referred to as an adjacent building) as shown in Figure 2. The geometrical model scale of 1:400 was employed in this study. A total of 252 pressure taps were installed on the surface of the principal building. They were non-uniformly distributed in the vertical direction as shown in Figure 2(a). From Figure 2(b) and Table 1, adjacent buildings of various sizes were classified as height ratios (Hr = Hi/Hp) with the same cross sections as the principal building, but different heights, and breadth ratios (Br = Bi/Bp) with the same height as the principal building but different cross sections. Here, Bi and Bp were the breadths of an adjacent building and a principal building, and Hi and Hp were the heights of an adjacent building and a principal building. Figure 3 shows the coordinate system and the grid used to define the relative locations of the building and wind directions. All adjacent buildings were orientated with their on-face normal to the principal building. They were placed in various locations while the principal building is fixed at (X, Y) = (0, 0). Wind directions were varied in 5° intervals in the range from 0° to 355°. The fluctuating wind pressure data were obtained by sampling at 781 and 800 Hz in full scale for a period for an adjacent building with height ratios and breadth ratios, respectively. The overall number of test cases is 11,952.
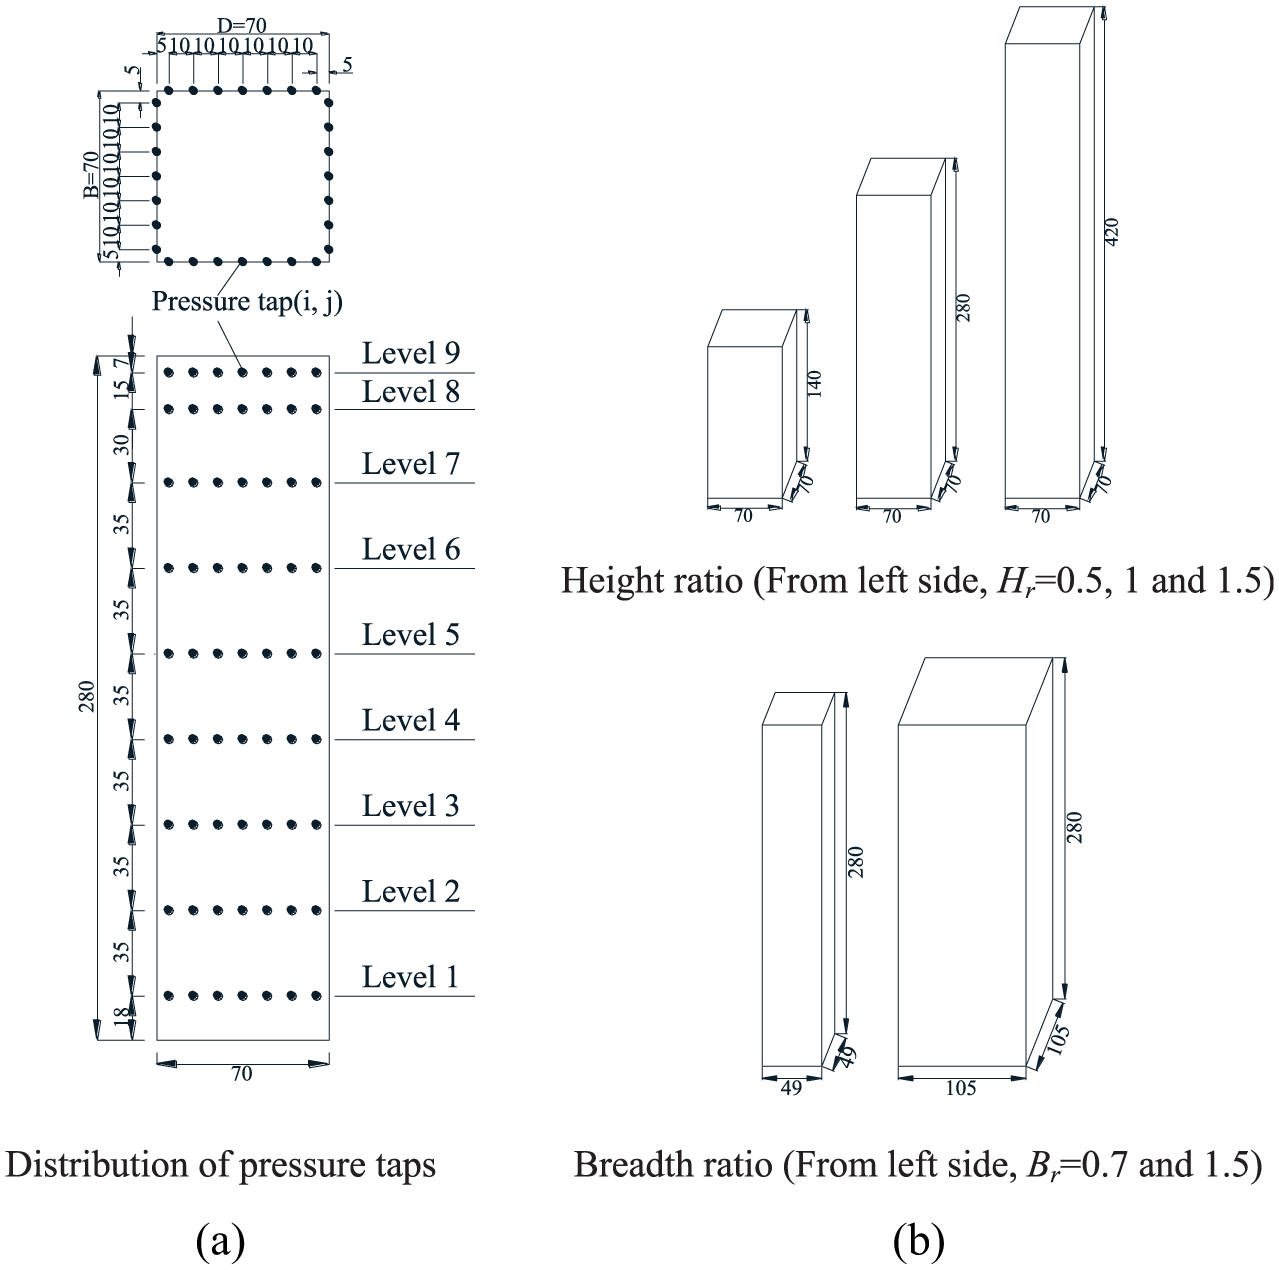
Experimental models: (a) principal building and (b) adjacent building.
Experimental models.

Bp × Dp × Hp: dimension of principal building.
Bi × Di × Hi: dimension of adjacent building.

Coordinate grids for experiment.
Results and discussion
Comparison of present data with previous results
Figure 4 shows representing local wind force and base moment coefficients. Interference effects were represented using non-dimensional interference factor terms such as the proportion of along- and across-wind forces or moments on a tall building with and without an adjacent tall building. Similarly, the interference factors were represented as the proportion of largest mean and RMS base overturning moment coefficients on the principal building with and without the adjacent tall building among all wind directions.

Representing local wind force and base moment coefficients.
Figure 5 shows interference factors for mean along-wind base overturning moment coefficients for wind direction θ = 0° in tandem arrangement. The present results are compared with those in past studies (English, 1993; Khanduri et al., 2000; Xie and Gu, 2004). In Figure 5, B, D, and H indicate the breadth, depth, and height of the principal building, respectively. X/B is the center-to-center spacing between a principal building and an adjacent building. Curve fitting to predict mean along-wind interference factor is proposed by English (1993). The formula, which is a third-order regression polynomial based on data culled from various sources, is given by equation (1)

where
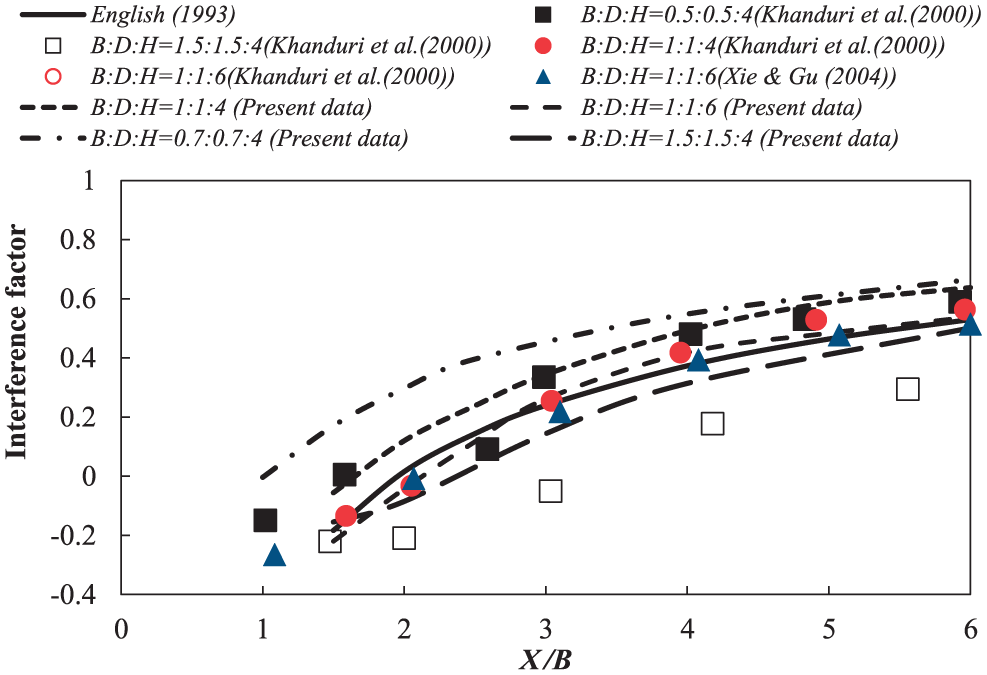
Interference factors of mean along-wind base overturning moment coefficients in tandem arrangement.
Tables 2 and 3 show maximum value of interference factors for mean and RMS base moment coefficients (MIFMD, RIFMD, RIFML, and RIFMT) and critical location of adjacent building with height ratio and breadth ratio, respectively. It should be noted that higher and wider adjacent buildings can cause not only higher mean wind loads but also higher dynamic wind loads in along- and across-wind directions when an adjacent building is placed along (X/B, Y/B) = (1.5, 0–1.5) regardless of height and breadth ratios.
Maximum value of interference factor and most critical location of adjacent building with height ratios.

Maximum value of interference factor and most critical location of adjacent building with breadth ratios.

Interference effects for local wind forces
Local force coefficients along height levels of a principal building with an adjacent building are presented and discussed in the region (X/B, Y/B) = (1–1.5, 0–1.5), in which higher along- and across-wind moment coefficients are observed (Kim et al., 2015).Figures 6 and 7 show the variation of mean along- and across-wind local force coefficients along height levels of the principal building for several locations of an adjacent building. The distribution of these coefficients is shown for a specific wind direction at which mean along- and across-wind base overturning moment coefficients become maximum. For
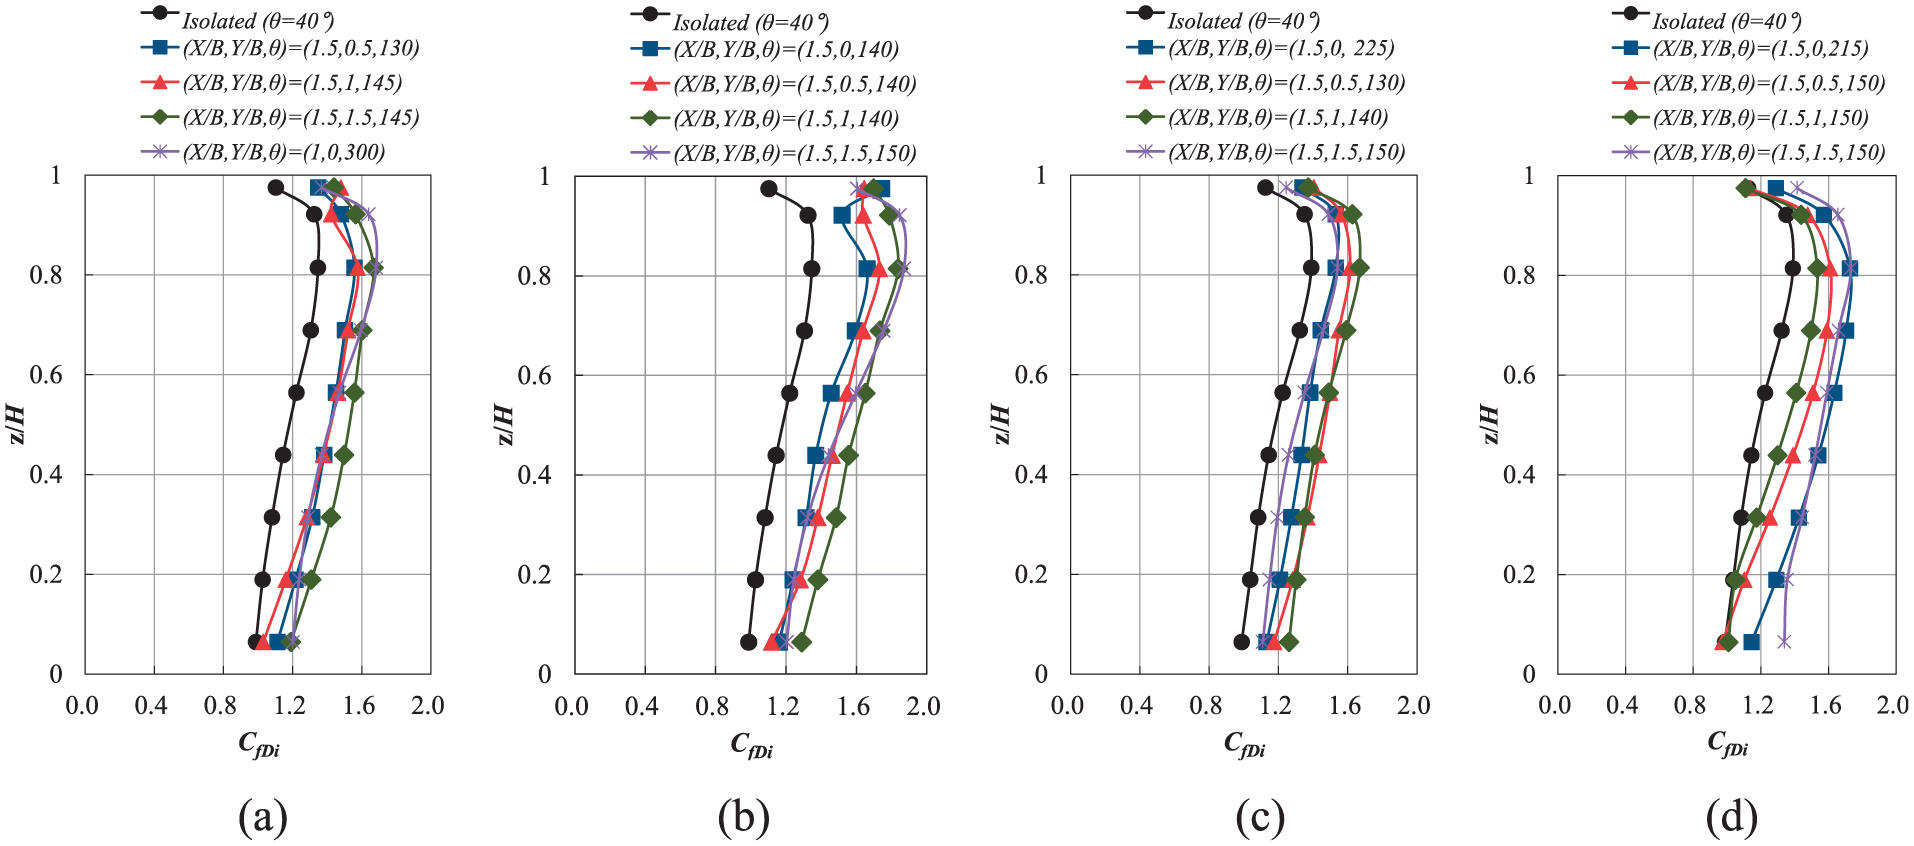
Variation of mean along-wind local force coefficients for critical location of adjacent building: (a) Hr = 1, (b) Hr = 1.5, (c) Br = 0.7, and (d) Br = 1.5.
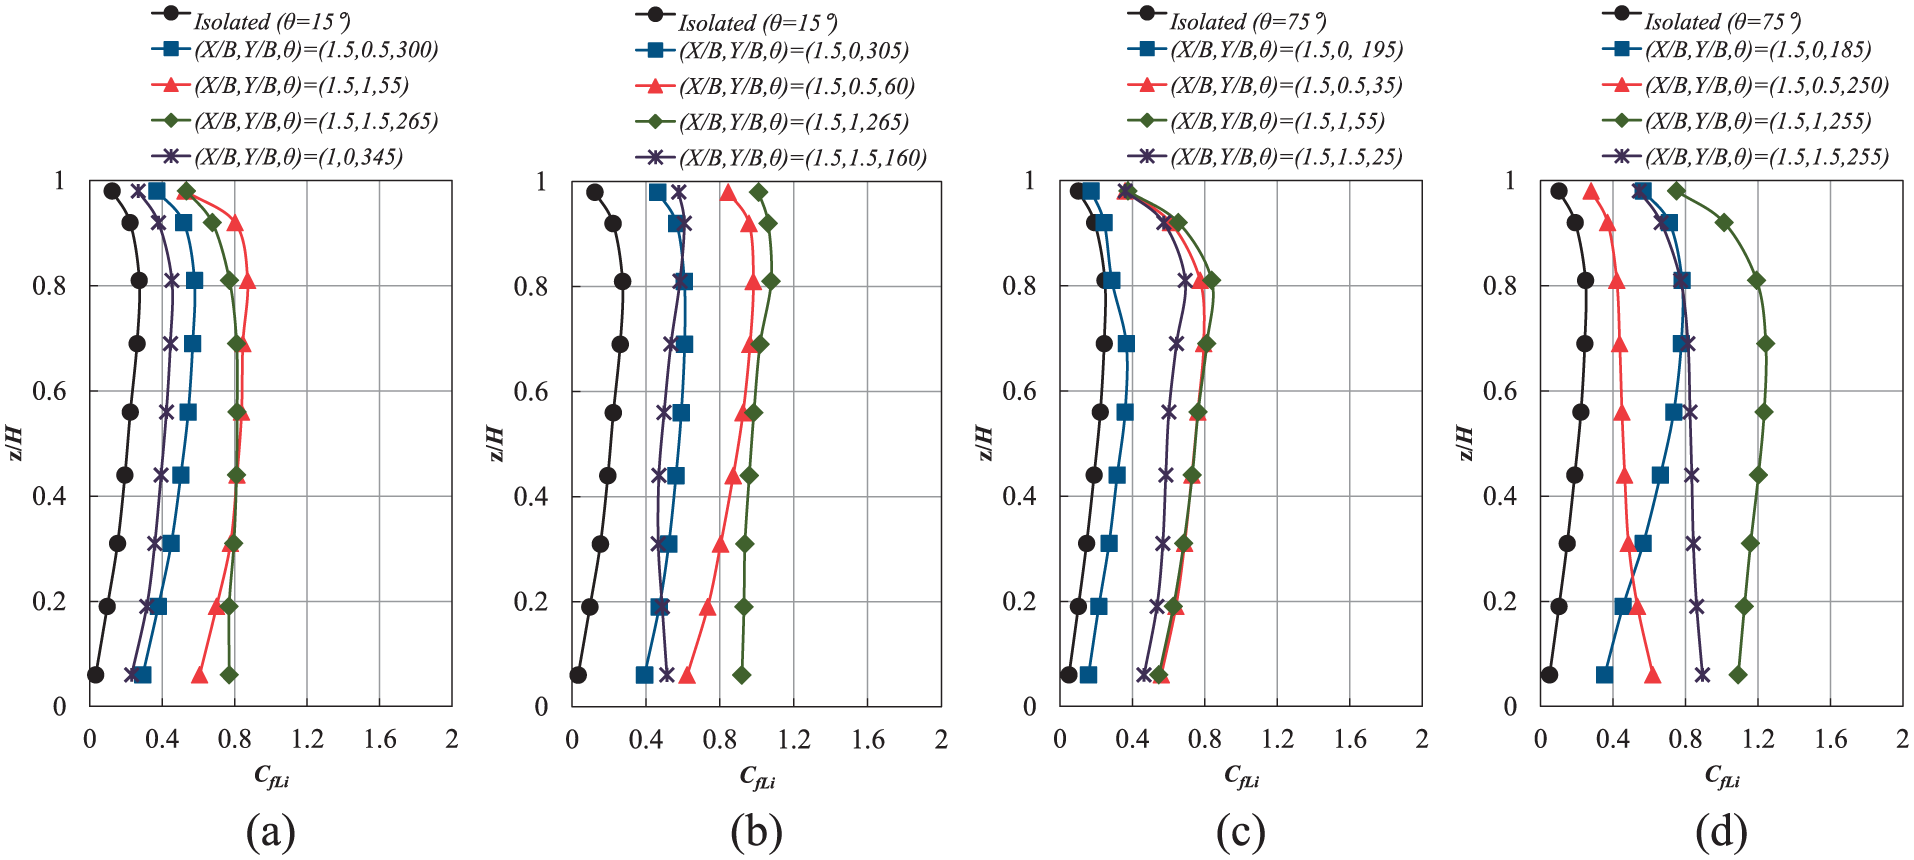
Variation of mean across-wind local force coefficients for critical location of adjacent building: (a) Hr = 1, (b) Hr = 1.5, (c) Br = 0.7, and (d) Br = 1.5.
Figures 8 and 9 show the variation of RMS along- and across-wind local force coefficients along height levels of the principal building for several locations of an adjacent building. The distribution of these coefficients is shown for a specific wind direction at which RMS along- and across-wind base overturning moment coefficients become maximum. As shown in Figure 8, increases in

Variation of RMS along-wind local force coefficients for critical location of adjacent building: (a) Hr = 1, (b) Hr = 1.5, (c) Br = 0.7, and (d) Br = 1.5.

Variation of RMS across-wind local force coefficients for critical location of adjacent building: (a) Hr = 1, (b) Hr = 1.5, (c) Br = 0.7, and (d) Br = 1.5.
Relationship between local force coefficients
Figures 10 and 11 show the relationship between maximum mean and RMS local force coefficients in along- and across-wind directions for all locations of an adjacent building. In Figures 10 and 11, the lines indicate maximum mean and RMS force coefficients on the isolated building in along- and across-wind directions, respectively. For Hr = 0.5, there was no correlation between maximum values of

Relationship between maximum mean local force coefficients in along- and across-wind directions: (a) Hr = 0.5, (b) Hr = 1, and (c) Hr = 1.5.
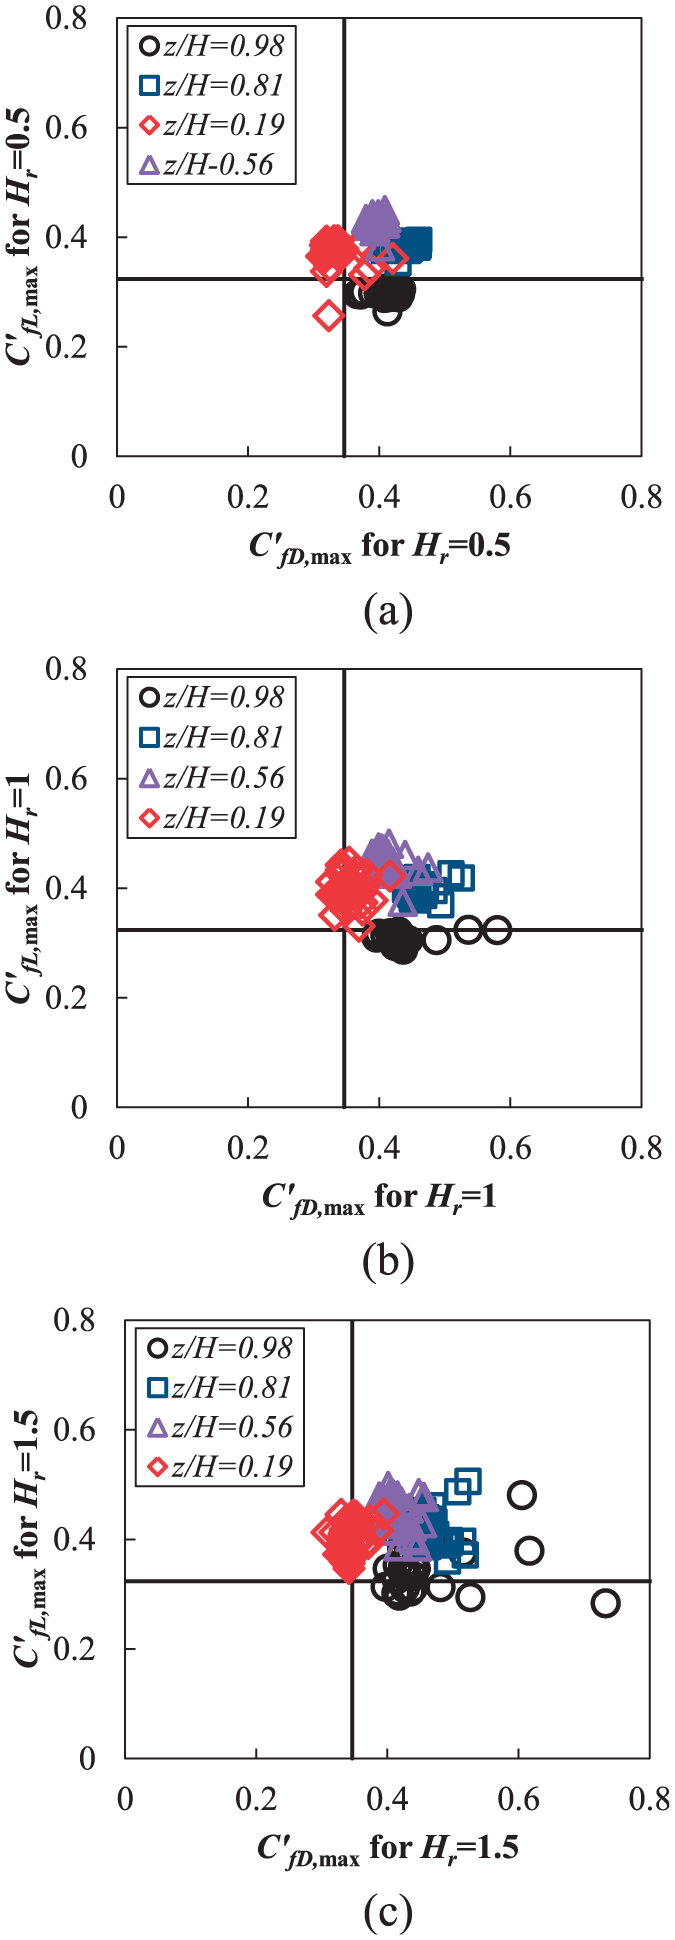
Relationship between maximum RMS local force coefficients in along- and across-wind directions: (a) Hr = 0.5, (b) Hr = 1, and (c) Hr = 1.5.
Power spectral densities of across-wind local force coefficients
Power spectral densities of across-wind local force coefficients for significant locations of an adjacent building with various height and breadth ratios are presented and discussed. Power spectral densities of across-wind local force coefficients are also obtained for nine levels (z/H = 0.06, 0.31, 0.56, 0.81, and 0.98) of a principal building with and without an adjacent building in significant locations for specified wind directions at which RMS across-wind base overturning moment becomes maximum. Figure 12 shows the power spectral densities of across-wind force coefficients along height levels of a typical square tall building (isolated building). Figures 13 and 14 show the power spectral densities of across-wind force coefficients along height levels of a principal building with an adjacent building at (X/B, Y/B) = (1.5, 1), respectively. As shown in Figure 12, sharp peaks throughout height levels are observed near a reduced frequency of about 0.1 corresponding to the vortex shedding frequency (Strouhal number), and a maximum peak occurs near the base of the building, which produces peak negative pressures. However, the vortex shedding mechanism throughout height levels of the principal building is disrupted due to an adjacent building for Hr = 1 and 1.5, and Br = 1.5, and the sharp peaks are attenuated. Furthermore, the distributions of energies change the sharp peak into a wider range of frequencies, as shown in Figures 13(b) and (c) and 14(b). This reason can be suggested that high suction at the front surface of the principal building was caused by the contracted flow enhancing the strength of vortices shedding due to the gap between two buildings. Hence, vortex shedding mechanism of contracted flow might differ from that of an isolated building, which leads to more energy with a broader band than that of an isolated building with the sharp peak. Another observation is that distribution of peak reduced frequencies along the height levels of the principal building for Br = 0.7 shows a similar trend to that of an isolated building, but peak reduced frequencies are shifted to a slightly lower frequency of about 0.067 as shown in Figure 14(a).
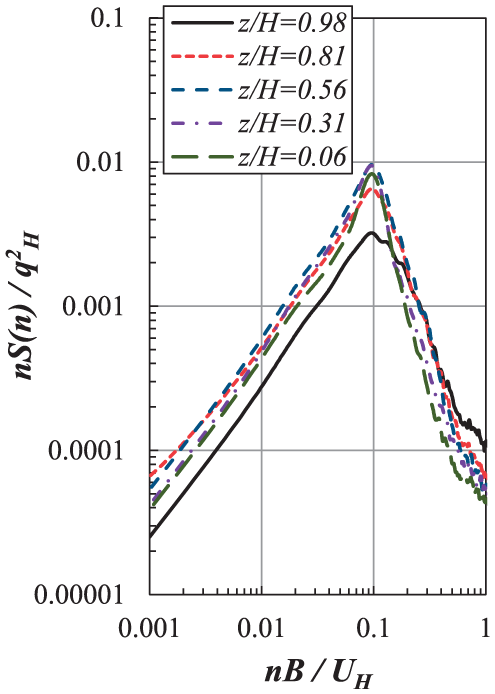
Power spectral densities of across-wind local force coefficients on isolated building for wind direction 0°
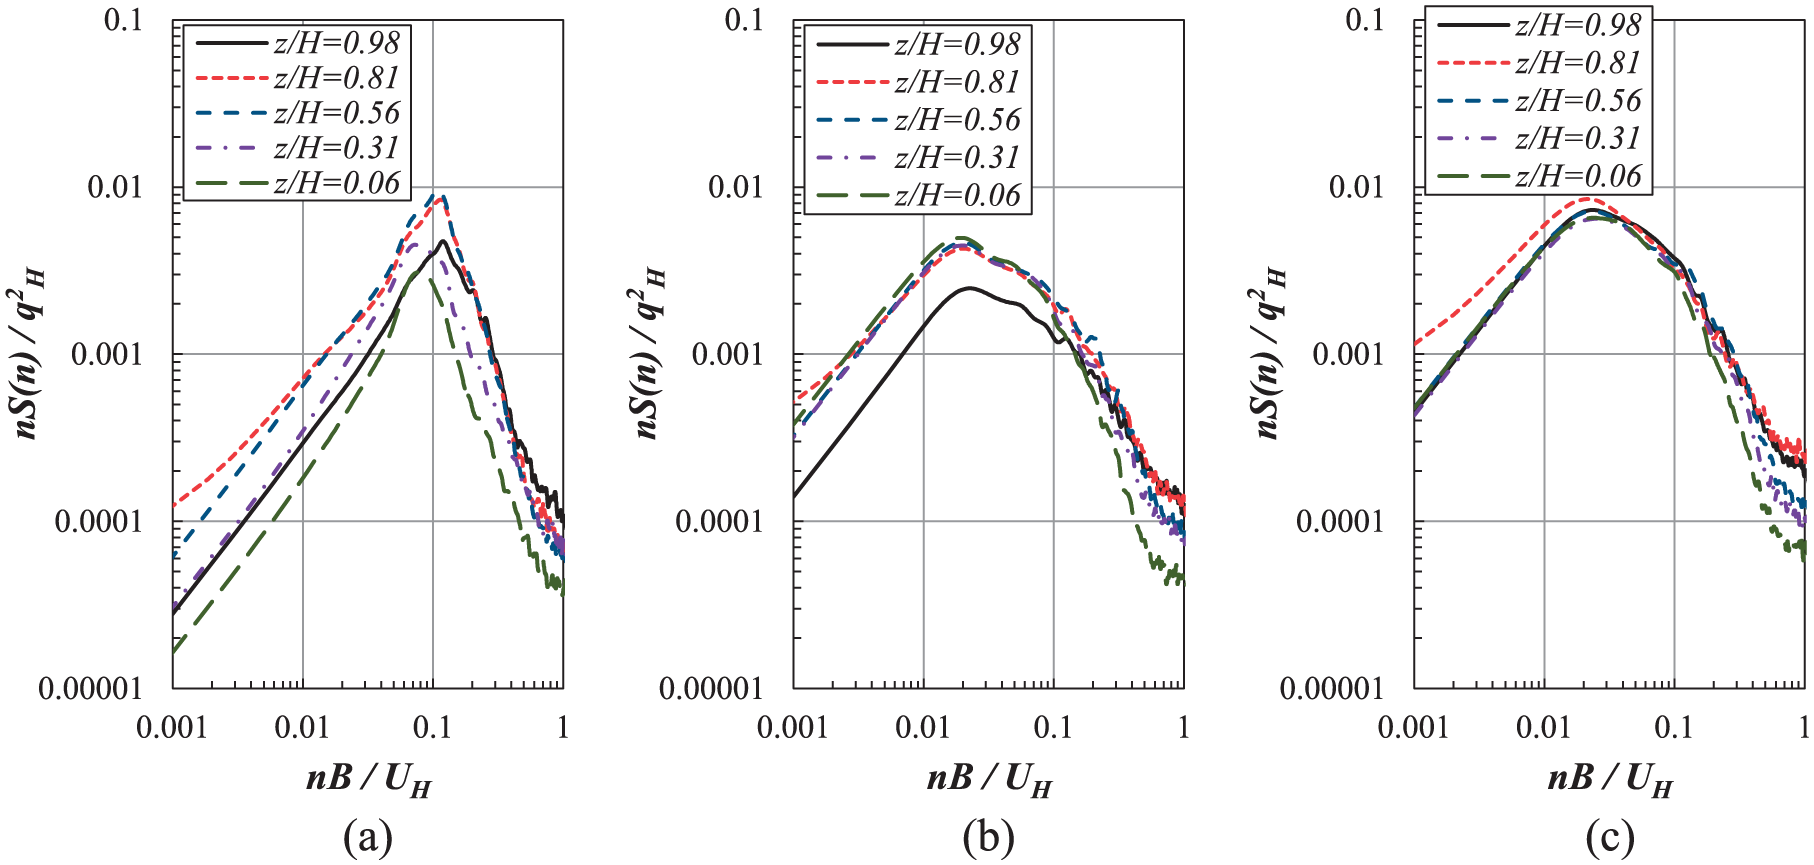
Power spectral densities of across-wind local force coefficients on principal building for height ratios at (X/B, Y/B) = (1.5, 1): (a) Hr = 0.5 (θ = 5°), (b) Hr = 1 (θ = 255°), and (c) Hr = 1.5 (θ = 255°).
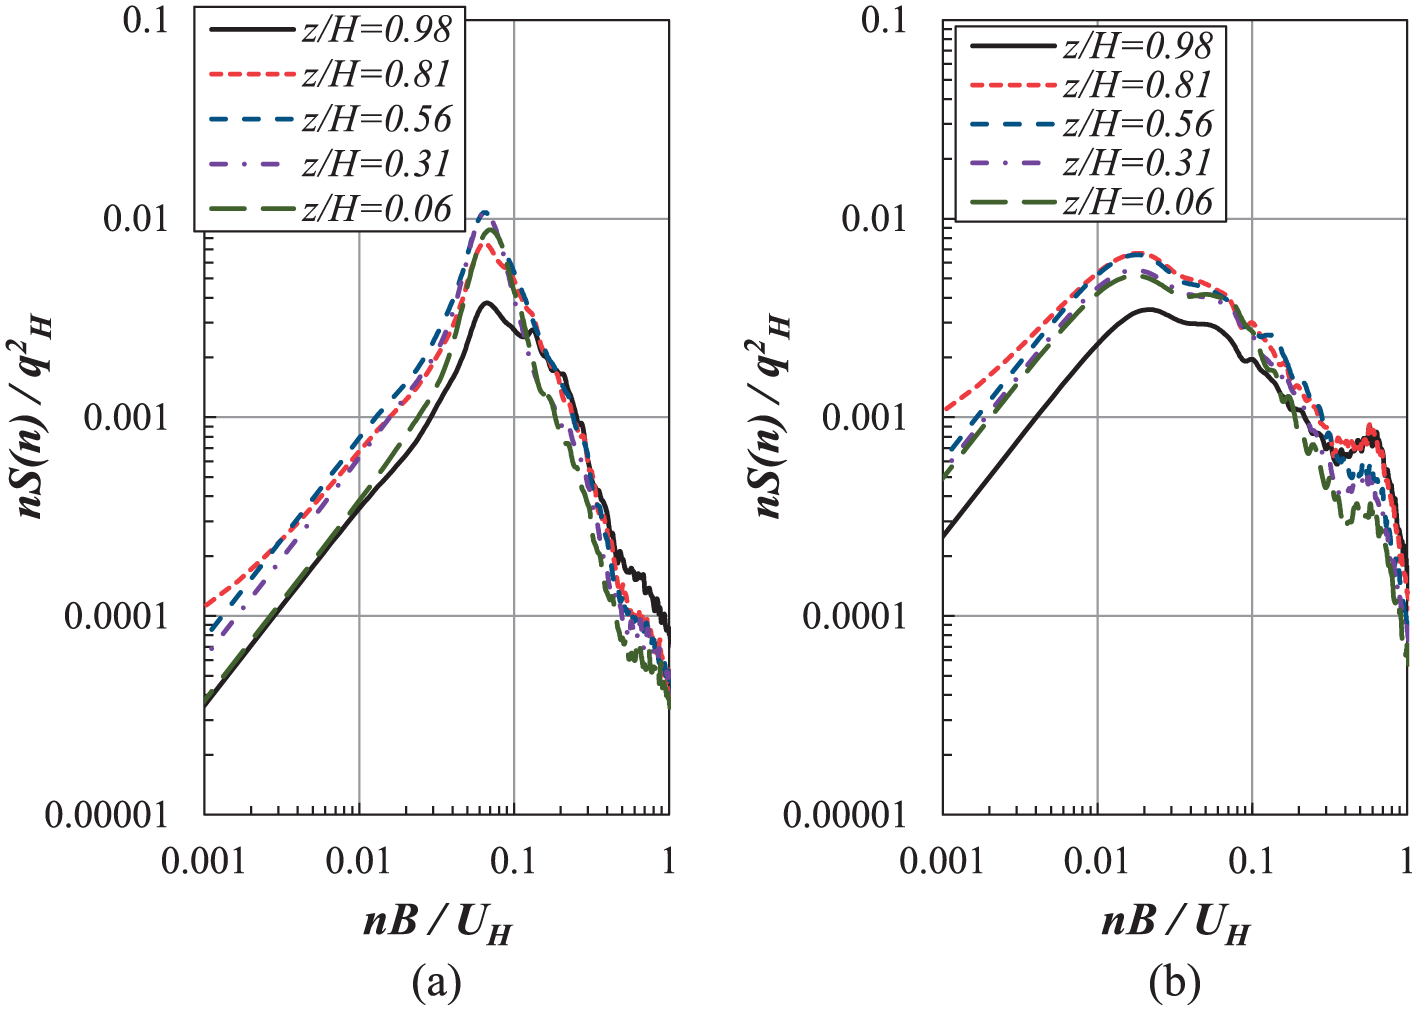
Power spectral densities of across-wind local force coefficients on principal building with breadth ratios at (X/B, Y/B) = (1.5, 1): (a) Br = 0.7 (θ = 90°) and (b) Br = 1.5 (θ = 255°).
Figures 15 and 16 show the distributions of peak reduced frequencies of across-wind local force power spectra along height levels of the principal building with and without an adjacent building. In Figure 15, the peak reduced frequencies along height levels of an isolated building are almost constant along the height levels. This means that all the vortices are shed at almost the same time throughout the height level, greatly exciting the models in the across-wind direction. However, from Figure 15(a), the peak reduced frequencies along height levels of the principal building with an adjacent building of Hr = 1 are shifted to lower frequencies, but the peak reduced frequencies are almost constant, excluding those of (X/B, Y/B) = (2, 1). It is suggested that the vortex shedding is mitigated by a mixture of shear layers separated from the top roof and corner of the principal building, and an adjacent building. Thus, the peak reduced frequencies near top of the principal building with an adjacent building at (X/B, Y/B) = (2, 1) occurred at lower frequencies. In addition, alternate vortex shedding near lower parts of the principal building occurred regularly. However, note that the location of the adjacent building depends on the height of the adjacent building. From Figure 15(b), the peak reduced frequencies along the height levels of the principal building with an adjacent building of Hr = 1.5 vary with their locations, excluding those at (X/B, Y/B) = (1.5, 0.5) and (1.5, 1). This means that the vortex shedding differs along the height levels and leads not only to an increase in background responses but also to a decrease in the resonant responses of the principal building. It can be explained by the fact that in general, resonant contribution is more dominant for a tall building because natural frequency of a tall building is very close to vortex shedding frequency (nB/U = 0.1) caused by wind. However, when an adjacent building was closely placed upstream of the principal building, the disruption of the vortex shedding mechanism of an adjacent building was clearly discernible and the energy was distributed over a wider range of frequencies as shown in Figures 13 and 14.
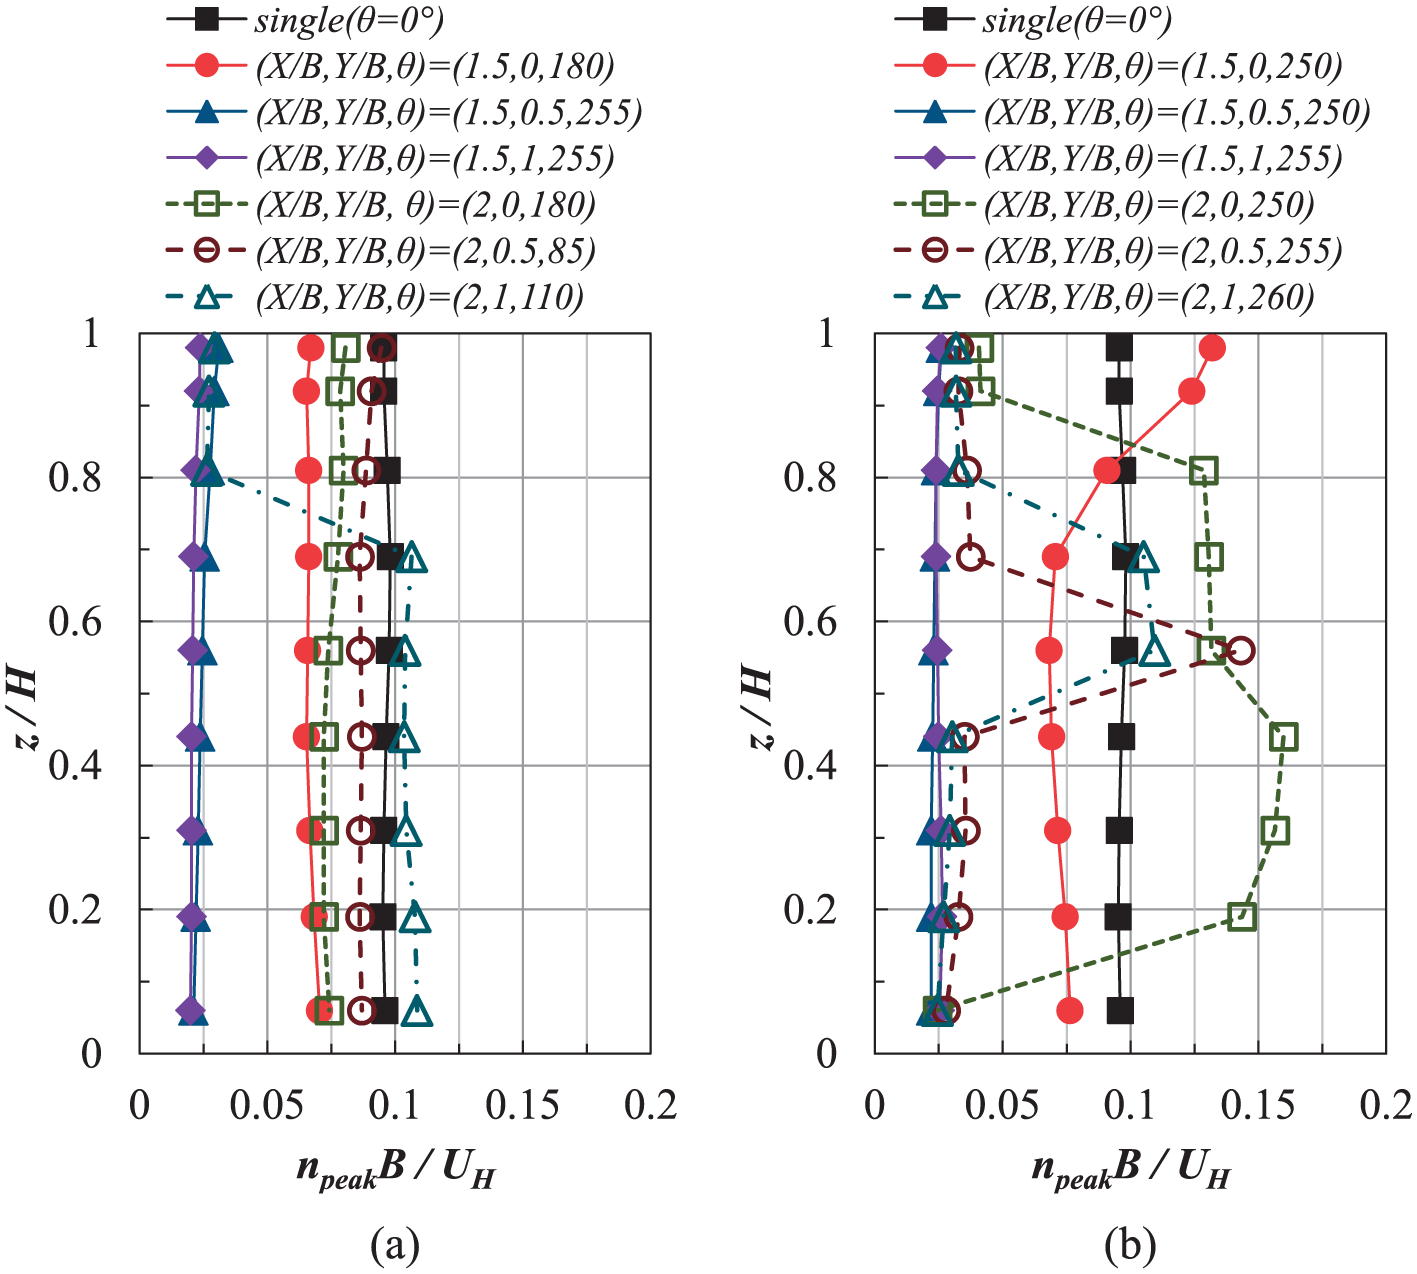
Distribution of peak reduced frequencies of across-wind local force power spectra for various locations in height ratios: (a) Hr = 1 and (b) Hr = 1.5.
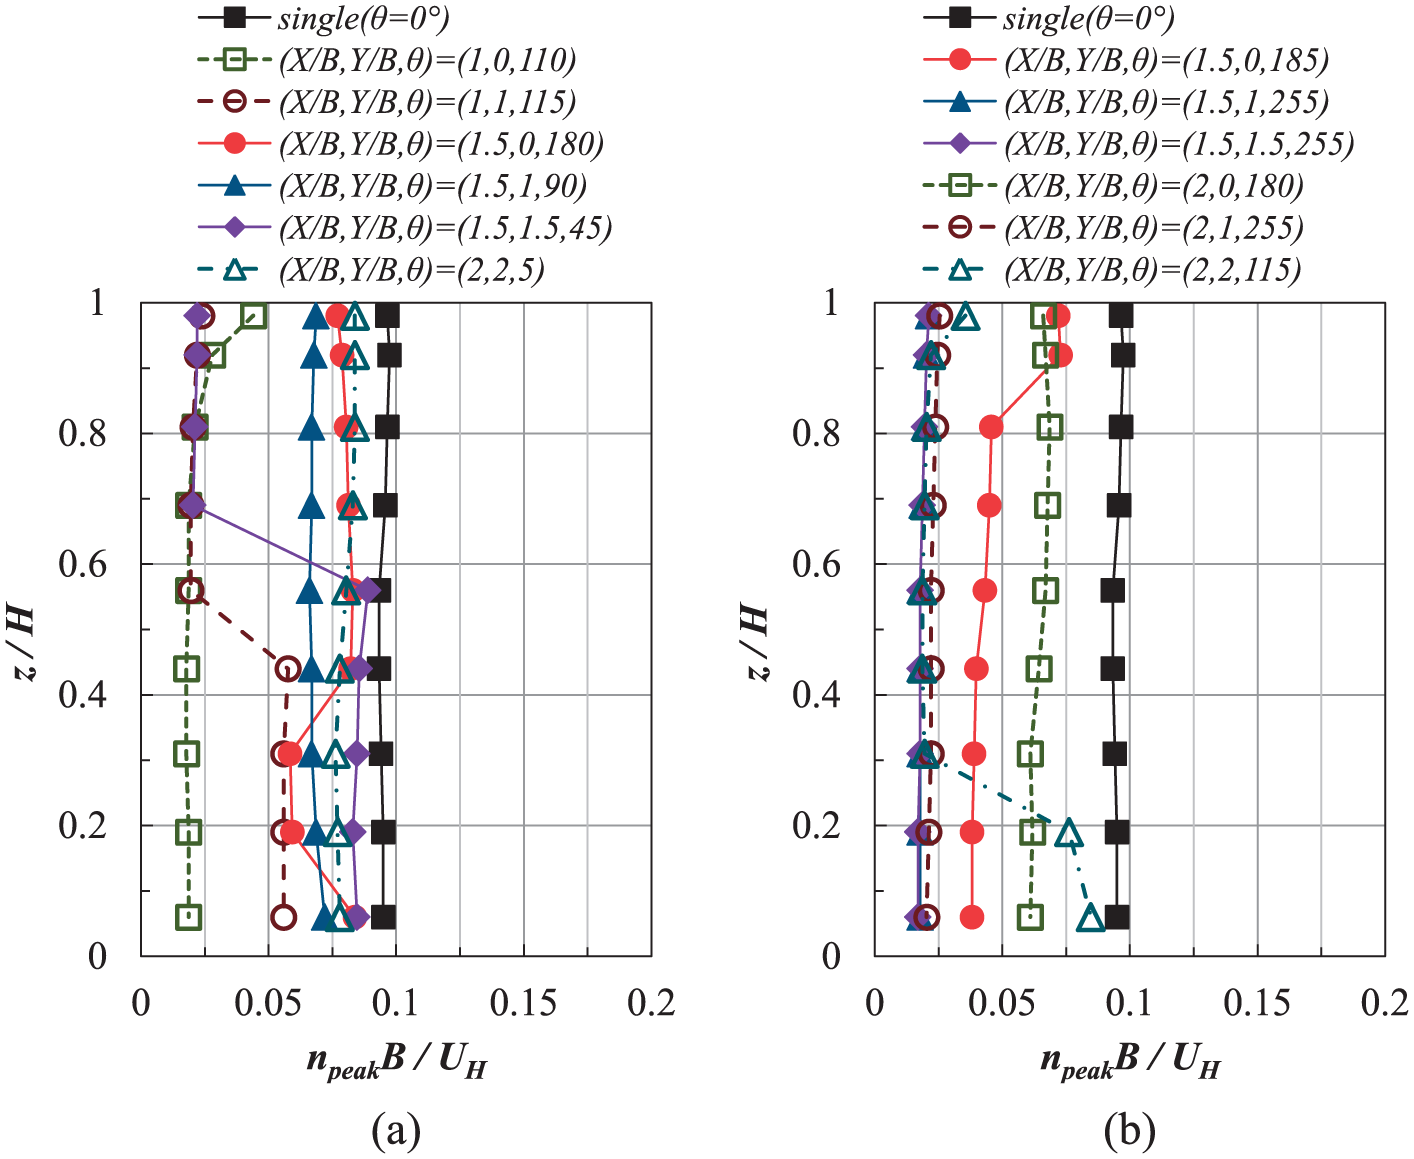
Distribution of peak reduced frequencies of across-wind local force power spectra with various locations in breadth ratios: (a) Br = 0.7 and (b) Br = 1.5.
In Figure 16, the peak reduced frequencies along height levels of the principal building with an adjacent building of Br = 0.7 and 1.5 are shifted to lower frequencies, and the peak reduced frequencies along height levels are constant excluding those of (X/B, Y/B) = (1, 1) and (1.5, 1.5) for Br = 0.7 and (X/B, Y/B) = (1.5, 0) and (2, 2) for Br = 1.5. It should be noted that a higher adjacent building is more sensitive than a wider adjacent building in across-wind local force coefficients due to interference effects.
Coherence and phase angle of across-wind local force coefficients
The frequency-dependent correlation can be described by functions known as the coherence. The coherence is a normalized magnitude of the cross-spectrum, approximately equivalent to a frequency-dependent correlation coefficient. In addition, the coherence and phase angle can be used to calculate the relevant generalized wind force of a building when considering mode shape correction. Figures 17 and 18 show the span-wise coherence function and phase angle of across-wind local force coefficients between height levels (levels 9-8, 9-5, 9-3, and 9-1) of a principal building with and without an adjacent building at significant locations of (X/B, Y/B) = (1.5, 1) for the specified wind directions at which RMS across-wind base overturning moment becomes maximum. The coherence function (referred to as coherence) can be defined by equation (2)

where
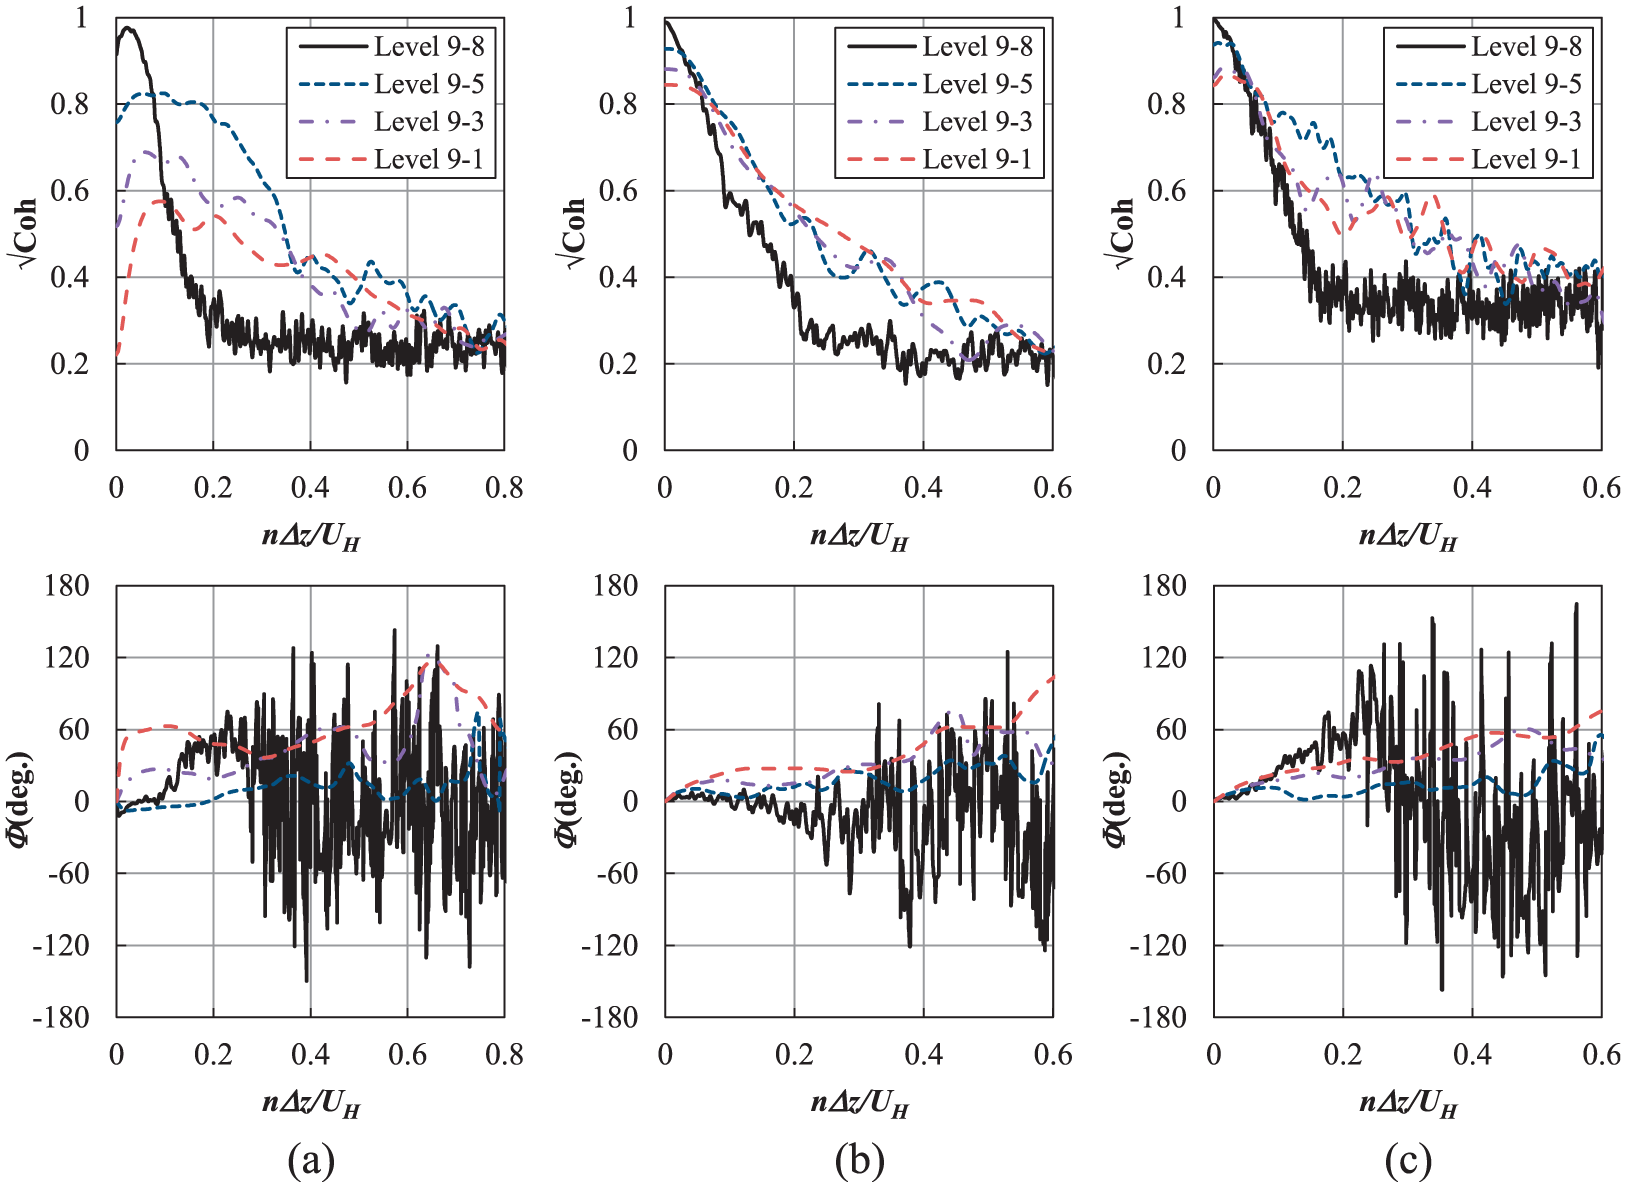
Span-wise coherence and phase angle of across-wind local force coefficients between height levels of principal building with height ratios at (X/B, Y/B) = (1.5, 1): (a) isolated, (b) Hr = 1, and (c) Hr = 1.5.
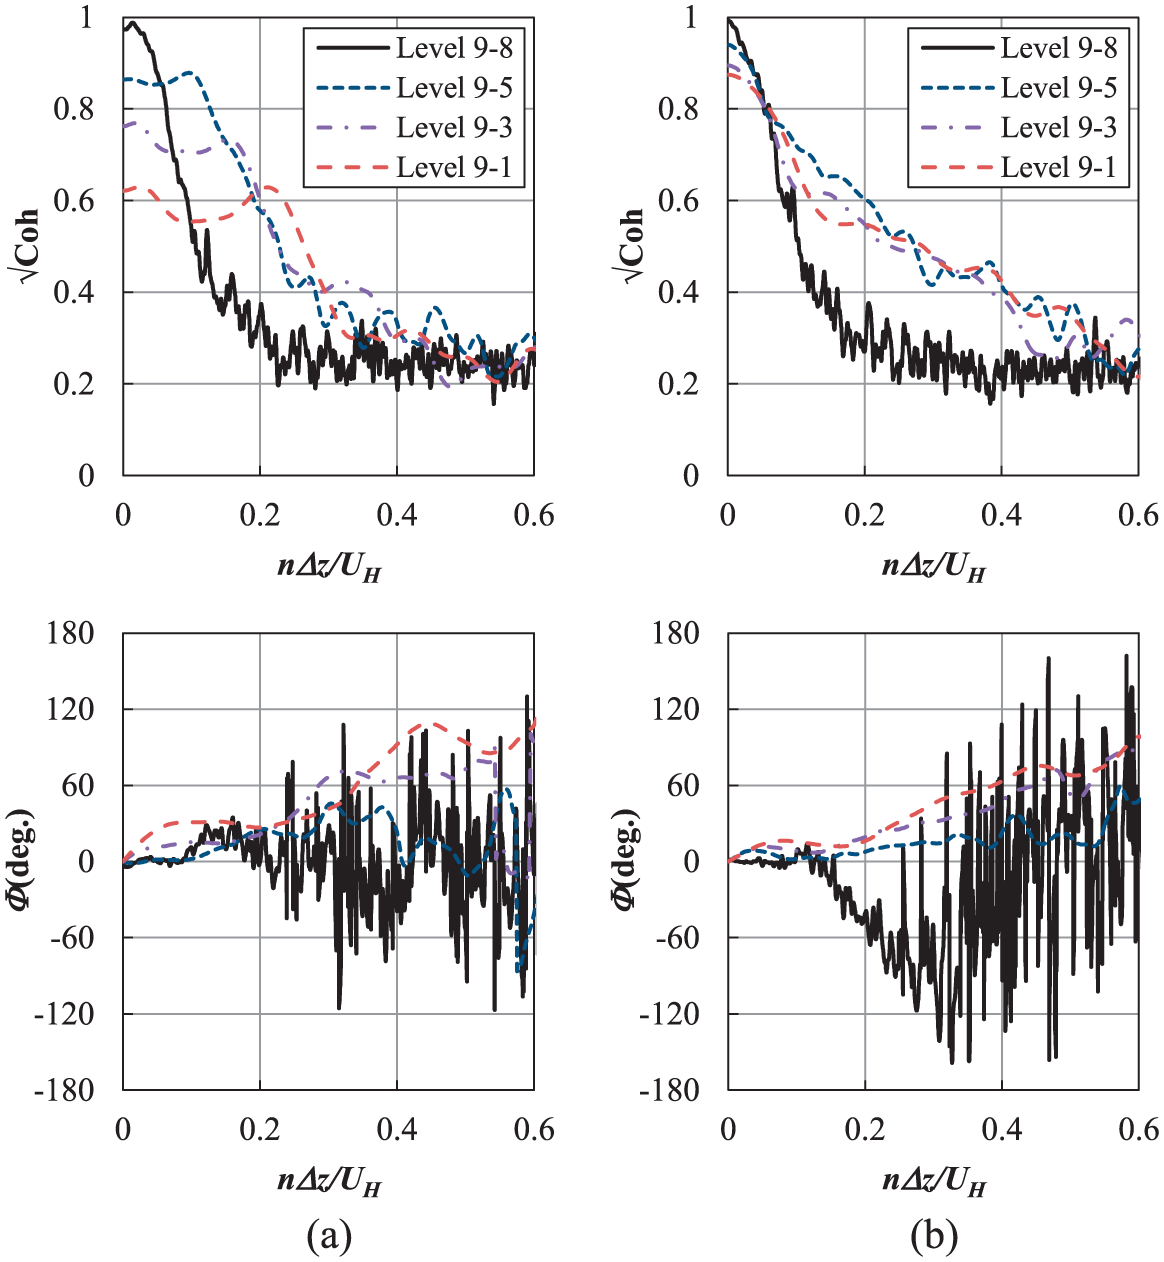
Span-wise coherence and phase angle of across-wind local force coefficients between height levels of principal building with breadth ratios at (X/B, Y/B) = (1.5, 1): (a) Br = 0.7 and (b) Br = 1.5.
The coherence over intervals (Δz) from 1 to 9 height levels is analyzed. For an isolated building, the coherence for across-wind local force has a peak band which broadens with increase in interval and still has high coherence over a high reduced frequency range of 0.41, as shown in Figure 17(a). Similar results have been reported by a previous study (Lin et al., 2005). For the phase angle for an isolated building, it is clear that the phase for across-wind local forces increases with increase in interval. A similar phenomenon was reported by Jensen (1999). However, coherences for Hr = 1 and 1.5 and Br = 1.5 decrease exponentially with increase in reduced frequency, which is a similar trend to those of along-wind local forces on an isolated building as shown in Figures 17(b) and (c) and 18(b). This result seems to be relevant to the distribution of the power spectral densities of across-wind force coefficient as discussed in section “Power spectral densities of across-wind local force coefficients.” In addition, when the reduced frequency is zero, the coherence with an adjacent building showed high correlation even for larger intervals. For example, the coherence for Br = 0.7 is 0.62 for larger intervals, since the coherence for an isolated building is less than 0.3 for larger intervals. Furthermore, an adjacent building tends to decrease its phase angle with reduced frequency. Higher and wider adjacent buildings therefore lead to a decrease in phase angles with reduced frequency.
Conclusion
The characteristics of local wind forces along height levels of a principal building with various locations and sizes (height and breadth ratios) of an adjacent building have been investigated using detailed wind tunnel experiments. The distribution of mean and RMS local wind force coefficients in along-wind and across-wind directions, force spectrum, and coherence along nine levels of a tall building with an adjacent building are presented and discussed. Based on experimental results, the following results are obtained:
Higher and wider adjacent buildings cause high mean and RMS base overturning moments and local wind forces, but the critical locations of an adjacent building with height and breadth ratios are somewhat different. However, most critical locations of an adjacent building affecting wind-induced wind loads are within the region (X/B, Y/B) = (1.5, 0–1.5).
For the relationship between maximum mean and RMS local force coefficients in along- and across-wind directions, the maximum mean along-wind force coefficients on the principal building were highly correlated with maximum mean across-wind force coefficient for Hr = 1 and 1.5. On the contrary, there was almost no correlation between maximum values of RMS along- and across-wind local force coefficients for Hr = 0.5, 1, and 1.5.
When adjacent buildings of various sizes are located at (X/B, Y/B) = (1.5, 1), the vortex shedding mechanism throughout height levels of the principal building in the across-wind direction is disrupted due to the adjacent building, and the sharp peaks are attenuated. Furthermore, the distribution of energies changes the sharp peak into a wider range of frequencies which show a similar trend to the distribution of the power spectrum of the isolated building in the along-wind direction.
Footnotes
Declaration of Conflicting Interests
The author(s) declared no potential conflicts of interest with respect to the research, authorship, and/or publication of this article.
Funding
The author(s) disclosed receipt of the following financial support for the research, authorship, and/or publication of this article: This study was funded by the Ministry of Education, Culture, Sports, Science and Technology, Japan, through the Joint Usage/Research Center of Wind Engineering, Tokyo Polytechnic University, 2013–2019, and the Ministry of Land, Infrastructure and Transport (MOLIT) of the Korea government (code 12 Technology Innovation E09) and Korea Institute of Ocean Science and Technology (PE99521). The authors gratefully acknowledge their support.