
Abstract
With the introduction of the modern rammed earth technique, a large number of modern rammed earth buildings were constructed in China Mainland. China has a vast territory, which faces the Circum-Pacific seismic belt on the east and the Eurasian seismic belt on the south; earthquake has constantly threatened the safety of people’s lives and property. Consequently, it is necessary to probe in the seismic performance of rammed earth buildings. Two un-stabilized rammed earth specimens, one un-stabilized rammed earth reinforced with geogrid sheets’ specimens, and four stabilized rammed earth specimens were built for obtaining a better insight on the behavior of un-stabilized rammed earth/stabilized rammed earth walls under cyclic in-plane loads. Testing results are discussed in terms of failure mode, shear capacity, hysteretic curve, stiffness degradation, and total energy dissipation to provide comparisons of the seismic performance between un-stabilized rammed earth and stabilized rammed earth specimens. Different failure modes indicated that the cohesion between particles and the bond strength between layers are the two key parameters for the shear capacity of rammed earth buildings. It is also demonstrated that stabilized rammed earth specimens have higher shear and energy dissipation capacity but weaker deformation capacity than un-stabilized rammed earth.
Introduction
Rammed earth (RE) has ecological advantages such as low cost and embodied energy, recyclability, renewability, sustainability, and insulation, which presents striking contrast with the widely erected concrete/steel constructions that consume higher energy and carbon footprint (Ciancio and Boulter, 2012; Ciancio et al., 2013; Matta et al., 2015; Morel et al., 2001). At present in China, there is a great amount of housing demand. Taking into consideration of the advantages above, earth has been taken as construction material, which also gets architects' attention. And it is estimated that more than a thousand modern RE buildings have been constructed in China Mainland during the past decade. Modern RE has adopted advanced construction technique and measures, which shows remarkable differences with the traditional RE as follows: (1) power pneumatic rammer is substituted for the traditional manual one to reduce the labor intensity (Naboucha et al., 2016); (2) particle size distribution (PSD) and several clay physical state indexes are used as main factors to weigh the suitability of soil for RE; (3) modern stabilization is added as binder; and (4) special aluminum alloy molds with higher recyclability have been designed and introduced. Those factors can simultaneously improve the bulk density and compressive strength of RE up to 2100 kg/m3 and 12 MPa, respectively (Jayasinghe and Kamaladasa, 2007; Venkatarama Reddy and Prasanna Kumar, 2011a), which also lead to a wider applicability of modern RE. Figure 1 shows several recently constructed modern RE buildings distributed in China Mainland.
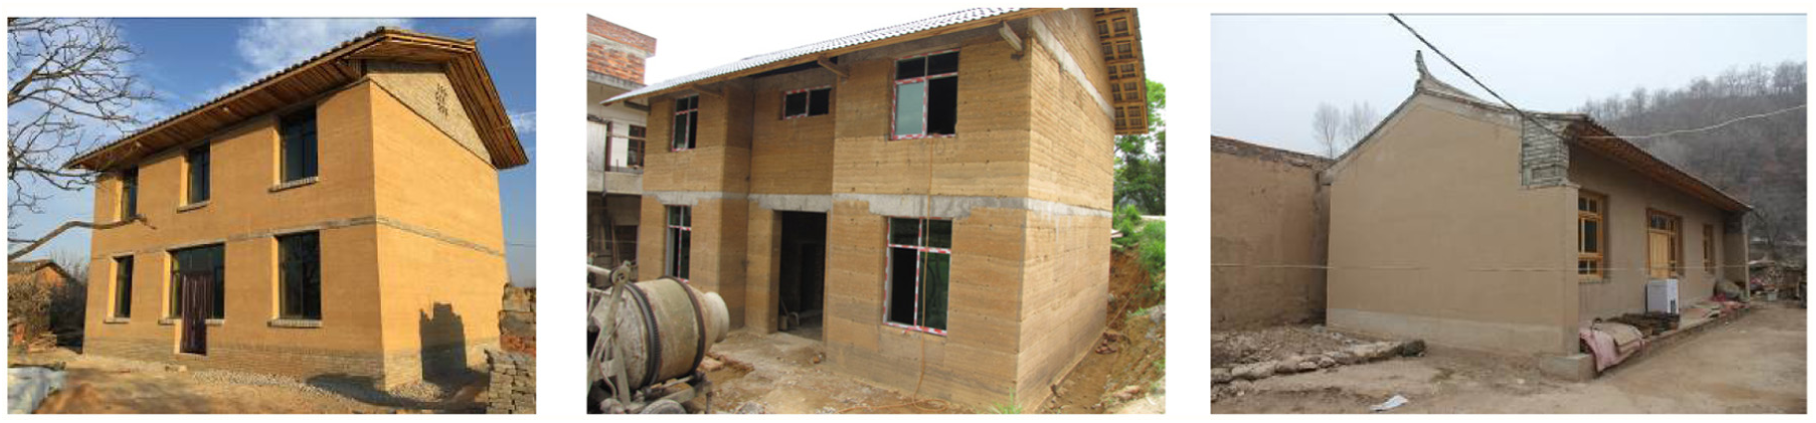
Three RE houses built in Bijie, Guizhou province; Ganzhou, Jiangxi province, and Zhangxian, Gansu province.
During the introduction of modern RE construction technique, the suitability of soil should be taken as the initial considerable element. But there is no unified criterion to evaluate the suitability of soil for RE now. In view of global distribution of RE buildings and published articles, we can find that worldwide spread soil has been used to construct RE buildings (Pacheco-Torgal and Jalali, 2012). Therefore, these existing RE buildings at construction zone are the silent entities to testify the suitability of soil. Meanwhile, in the view of geotechnical engineering, RE is a remolded process of the disturbed soil. PSD, liquid limit (LL), plastic limit (PL), and plasticity index (PI) were also taken as simple indexes to roughly weigh the suitability of soil for RE. PSD gives an indication of both the size of the particles and their relative proportions; others can weigh the clay physical state index. Suitable engineering compound of soil, silt, sand, and gravel can make the smaller particles fill the gaps between the larger particles to reach a maximum density during the ramming process, and the part of clay is regarded as binder, which approximately matches the Fuller and Thompson grading rule (Fuller and Thompson, 1907). On one hand, the adding of sand and gravel can enlarge the particle size of natural soil and mix a well-graded engineering compound with clay, silt, sand, and gravel. On the other hand, less amount of clay can achieve a limited amount of shrinkage after construction and a lower water absorption in humid environment, and these two factors are important for the strength and durability of RE buildings (Matta et al., 2015; Pacheco-Torgal and Jalali, 2012; Venkatarama Reddy and Prasanna Kumar, 2011b).
Indeed, most present use of earth is stabilized in a global scope (Carmen Jiménez Delgado and Guerrero, 2007). Relatively lower clay content of engineering compound and inherent weaker strength of soil are meant to a limited strength of RE, which leaves a large scope for stabilization to improve the bond strength between particles. In the past, RE was often stabilized by lime, which had improved strength and weathering resistance of RE (Pacheco-Torgal and Jalali, 2012). But in current China, the cost of lime is far higher than Portland cement, a substitution of common cement taken as binder and also a wise choice for the stabilized rammed earth (SRE).
Presently, domestic revival of RE buildings is mainly launched by architects, which led to a serious problem that seismic performance has not been paid sufficient attentions. And only limited efforts had been made to quantify and analyze the in-plane strength and performance of RE walls: several works (Naboucha et al., 2016) have been described to investigate static nonlinear pushover method to assess the seismic performance of RE. Masonry PT (post-tensioning) technology and externally bonded fibers’ retrofitting had been proposed for newly built and existing RE walls (Hamilton et al., 2006; Liu et al., 2015). Numerical simulation and experimental research of the in-plane behavior of RE walls had been contrastively analyzed to testify the rationality of numerical simulation parameter selections, such as interface tensile strength and the friction angle (Miccoli et al., 2016). And 10% cement SRE nonbearing wall showed the best structural performance after the comparison of cyclic behaviors of un-stabilized, stabilized RE walls, and aerated concrete walls (Arslan et al., 2017).
Based on these few global research and domestic engineering backgrounds, two un-stabilized rammed earth (URE) specimens were constructed by this modern RE technique to evaluate the earthquake damage of existing RE bearing walls; one URE specimen reinforced with horizontal geogrid sheets was aimed at improving the deformation capacity of RE specimens; and other four SRE specimens were used to predict the seismic behavior of SRE buildings. Finally, structural properties such as load/displacement-carrying capacities, stiffness degradation, and total energy dissipation of the RE walls were determined by the results of cyclic loading tests, which had been used to illustrate the seismic performance of RE buildings.
Material and experimental methods
Material preparation of specimens
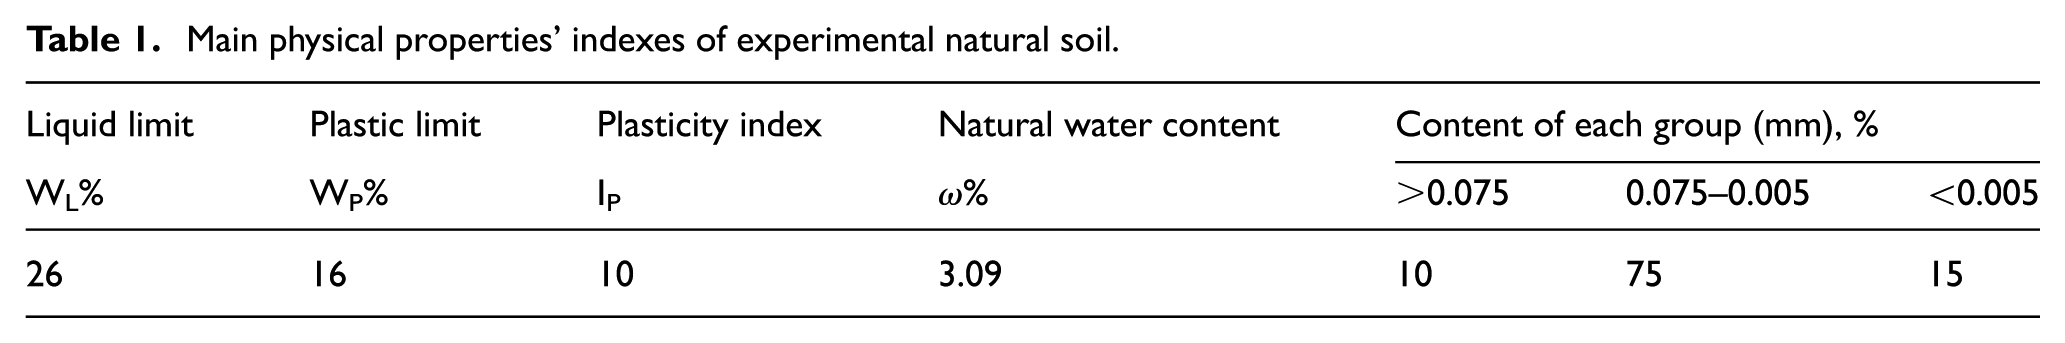
This experimental natural soil is taken from construction site of the RE house, which is to make sure a faithful representation of in situ wall material. The main physical properties’ indexes of natural soil are shown in Table 1. River sand and gravel are chosen to prepare the engineering compound. About 5%–30% (by total mass) of clay is generally recommended in literature (Burroughs, 2008; Carmen Jiménez Delgado and Guerrero, 2007). A lower content of 7.5% of clay is used in this article. Ultimately, the engineering compound consists of 50% natural soil, 20% river sand (≤5 mm), and 30% gravel (≤25 mm) by mass to construct specimens. A sieve analysis was conducted on the compound and is shown in Figure 2.
Main physical properties’ indexes of experimental natural soil.
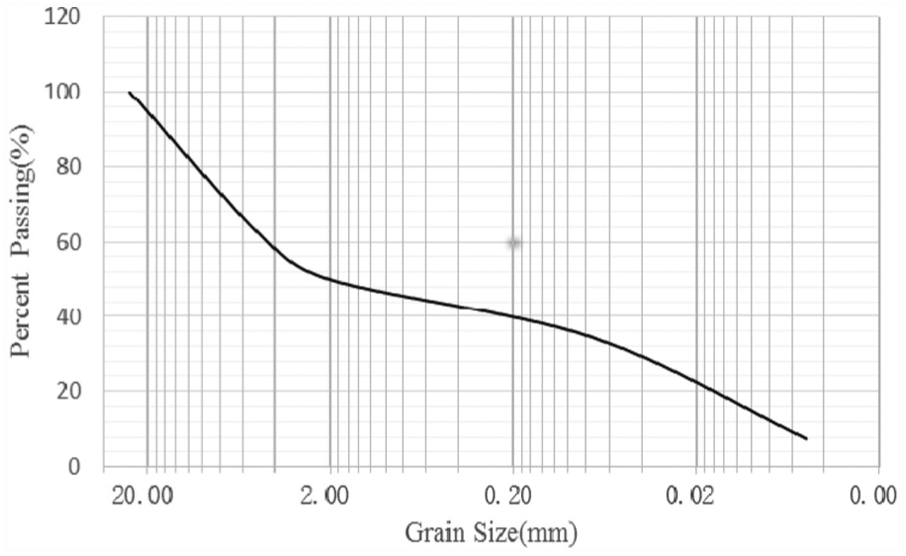
Grading curves of the artificial soils used in the experimental program.
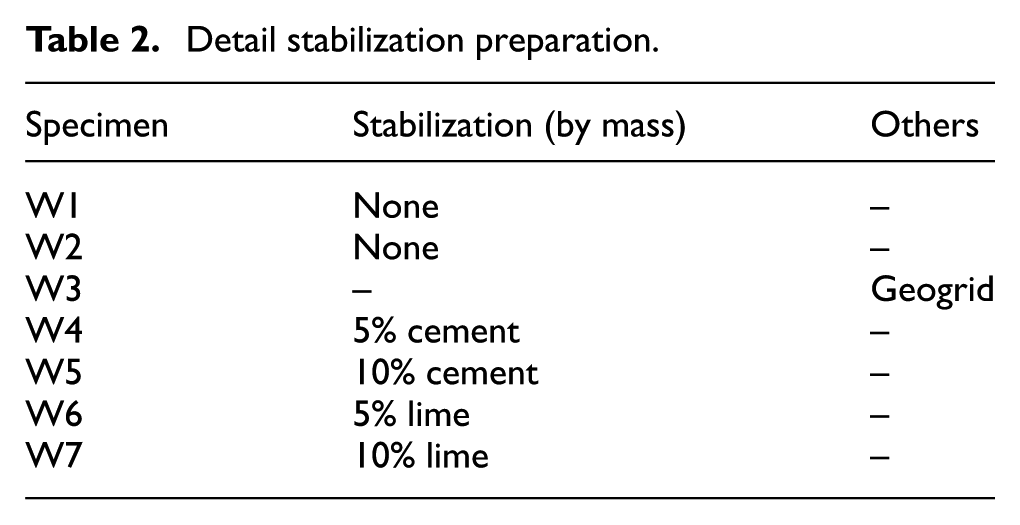
Ordinary Portland cement and common lime were used in this experimental investigation. Generally, 5%–10% cement/lime (by mass) is used as stabilization to gain higher strength and durability and to avoid loss of strength when saturated with water and erosion due to wind/rain impact (Ciancio et al., 2014; Gupta, 2014; Jayasinghe and Kamaladasa, 2007; Khadka and Shakya, 2016; Kwon et al., 2010; Narlocha et al., 2015; Tripura and Darunkumar Singh, 2015; Venkatarama Reddy and Prasanna Kumar, 2011b). About 5% and 10% of stabilization was used for stabilizing RE specimens, which also could get contrast with the stabilized efficiency of these two stabilizations.
The proportion of this engineering compound (soil, sand, and gravel) is followed by the recently constructed RE building as mentioned. And the content of cement and lime is calculated as the percentage by mass of the total dry mass of mix excluding cement and lime. After a sufficient mechanical mix, about 9% water (by mass) is added to the mix for the next3–5 min of agitation. The detailed stabilization preparation of specimens is shown in Table 2.
Detail stabilization preparation.
Description of the tested specimens and the boundary conditions
A total of seven 1/2 scaled specimens were built by a skillful builder who had constructed RE buildings. These specimens were casted on the bottom beams with dimension of 1900 mm (length) × 450 mm (height) × 350 mm (thickness). The required mass of wet compound is poured, about 15 cm thickness layer into the metal formwork. After three to four times of compacting by pneumatic rammer, each layer is compacted to 10 cm, and each specimen is composed of 12 compaction layers. Formwork was removed after the compaction process, immediately. The geogrid sheets that placed at the bed joints of masonry walls would cause a sliding failure (; Sadek and Lissel, 2013). Meanwhile, when these sheets placed at the interface between RE layers, the RE wall showed no obvious improvement in structural performance (Hamilton et al., 2006). Therefore, in this experimental research, three geogrid sheets with horizontal dimensions of 1800 mm × 240 mm were placed at the middle height of layer 3, 6, 9 in specimen W3, as shown in Figure 3(e). The natural soil was sieved through a 3-mm sieve to eliminate bigger organism and clods. The detailed procedures of construction specimens are shown in Figure 3(a) to (d). Specimens were covered with plastic membrane and stored for 6 months outside the laboratory for drying. Before testing, construction holes used to fix formworks were filled with the mixture of sodium silicate and soil, which intended to prevent the stress concentration during the loading process. After testing, the specimens showed an equilibrium moisture content in the range of 0.5%–3% by mass.
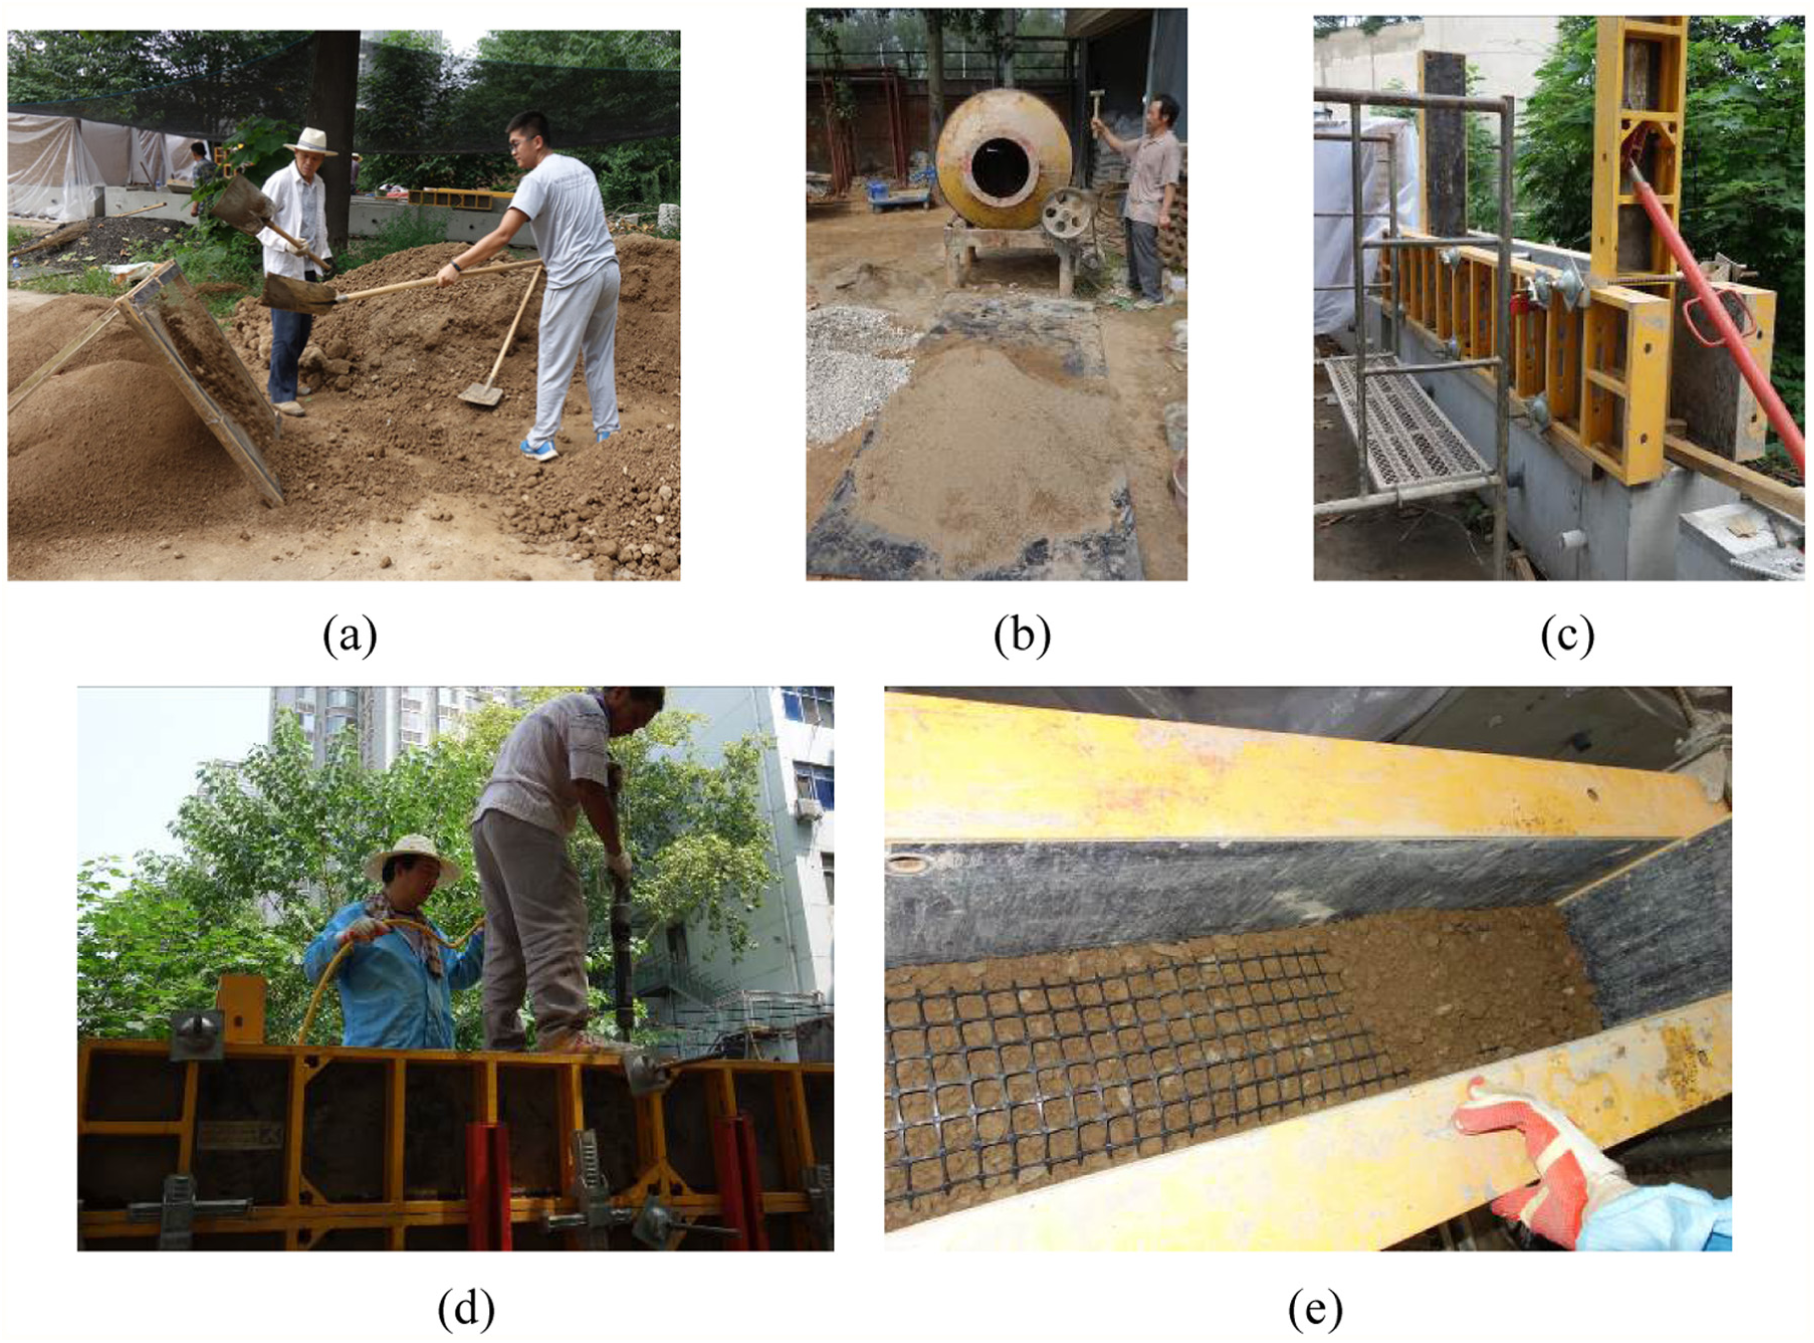
The detailed construction procedure of specimens: (a) soil screening, (b) mixing, (c) setting up of formwork, (d) compacting process, and (e) detailed layout of geogrid sheet.
In order to achieve a better integrity of the wall and beams and prevent the sliding between wall and beams during tests, the following measures were taken: (1) during the mixing, a extra 10% cement (by mass) was added into the engineering compound of the top and bottom layers of each specimen; (2) four wood blocks were placed evenly in the upper part of the top layer during the compaction process, which symmetrically left four spaces, and casted with the top concrete beam; (3) the upper surface of the bottom beam was post-installed artificially with several short rebars; and (4) as showed in figure 4, a groove with dimension of 1800 mm × 350 mm × 50 mm was left at the middle upper surface of the bottom beam during casting.
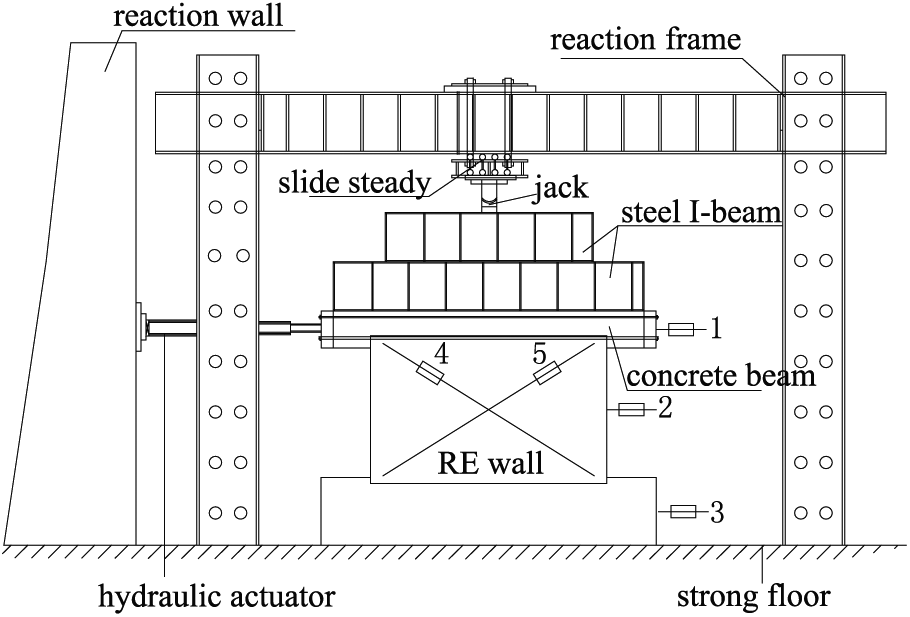
Setup and layout of instrumentations.
Instrumentation
In-plane cyclic loading tests were carried out at the Institute of Theoretical and Applied Mechanics (ITAM) in Xi’an. Two potentiometers were attached to the specimen to measure the diagonal displacements during the experiment, and three potentiometers were positioned to measure the horizontal displacement of the specimen at the top, middle, and bottom positions, respectively. The details of instrumentations’ layout are illustrated in Figure 4.
Test setup and loading system
The test setup for the in-plane cyclic loading test is shown in Figure 4. Two steel I-beams were placed on the top concrete beam to uniformly distribute the applied concentric vertical loads, and a 150 mm (height) × 250 mm (thickness) rigid concrete loading beam was casted in situ on the top of RE specimen to transfer both vertical and horizontal loads to the specimen. One end of the vertical hydraulic jack was placed on the top surface of the upper steel I-beam for applying the axial load; another end was fixed on the reaction frame with rollers to allow rotation and free horizontal movement. Each bottom beam was fixed to the strong floor by four screws. A constant vertical pressure of 0.2 MPa was to simulate the real vertical loading resisted by the ground story for the case of a two-story residential RE building.
Load–displacement hybrid loading scheme is used here. Loading-controlled scheme is applied to the horizontal loading until crack occurs. The amplitude of load was increased by 5 kN each cycle, and the amplitude of displacement was increased by 1 mm. Each level of horizontal displacement was repeated three times at the initial stage of displacement control, but reduced to two or one times afterward for a further exploration of displacement response. The horizontal loading was removed when the residual load-carrying capacity decreased or an unstable destruction phenomenon appeared.
Experimental observations and discussion
Results of tests
The un-stabilized specimens (W1, W2, W3) were cracked at the push load of 40, 50, and 65 kN, respectively, in the vicinity of the loading point. Then the loading scheme was changed to the displacement control.
When the displacement was increased to 5.5 mm, the damage of W1 was transferred to the lower part of the fourth layer with a loose surface. As shown in Figure 5(a), dilatancy of the horizontal layer zone is obvious at this stage. With the aggravation of dilatancy and spalling zone at the subsequent cyclic loading, horizontal effective shear transferring areas were largely reduced, and the vertical compression strength reduced as well. That is to say, the horizontal shear failure resulted in the loss of vertical capacity and ultimately led to a sudden brittle collapse failure as shown in Figure 5(b). The following specimens were terminated prior to complete specimen destruction to ensure safety during cyclic loading.
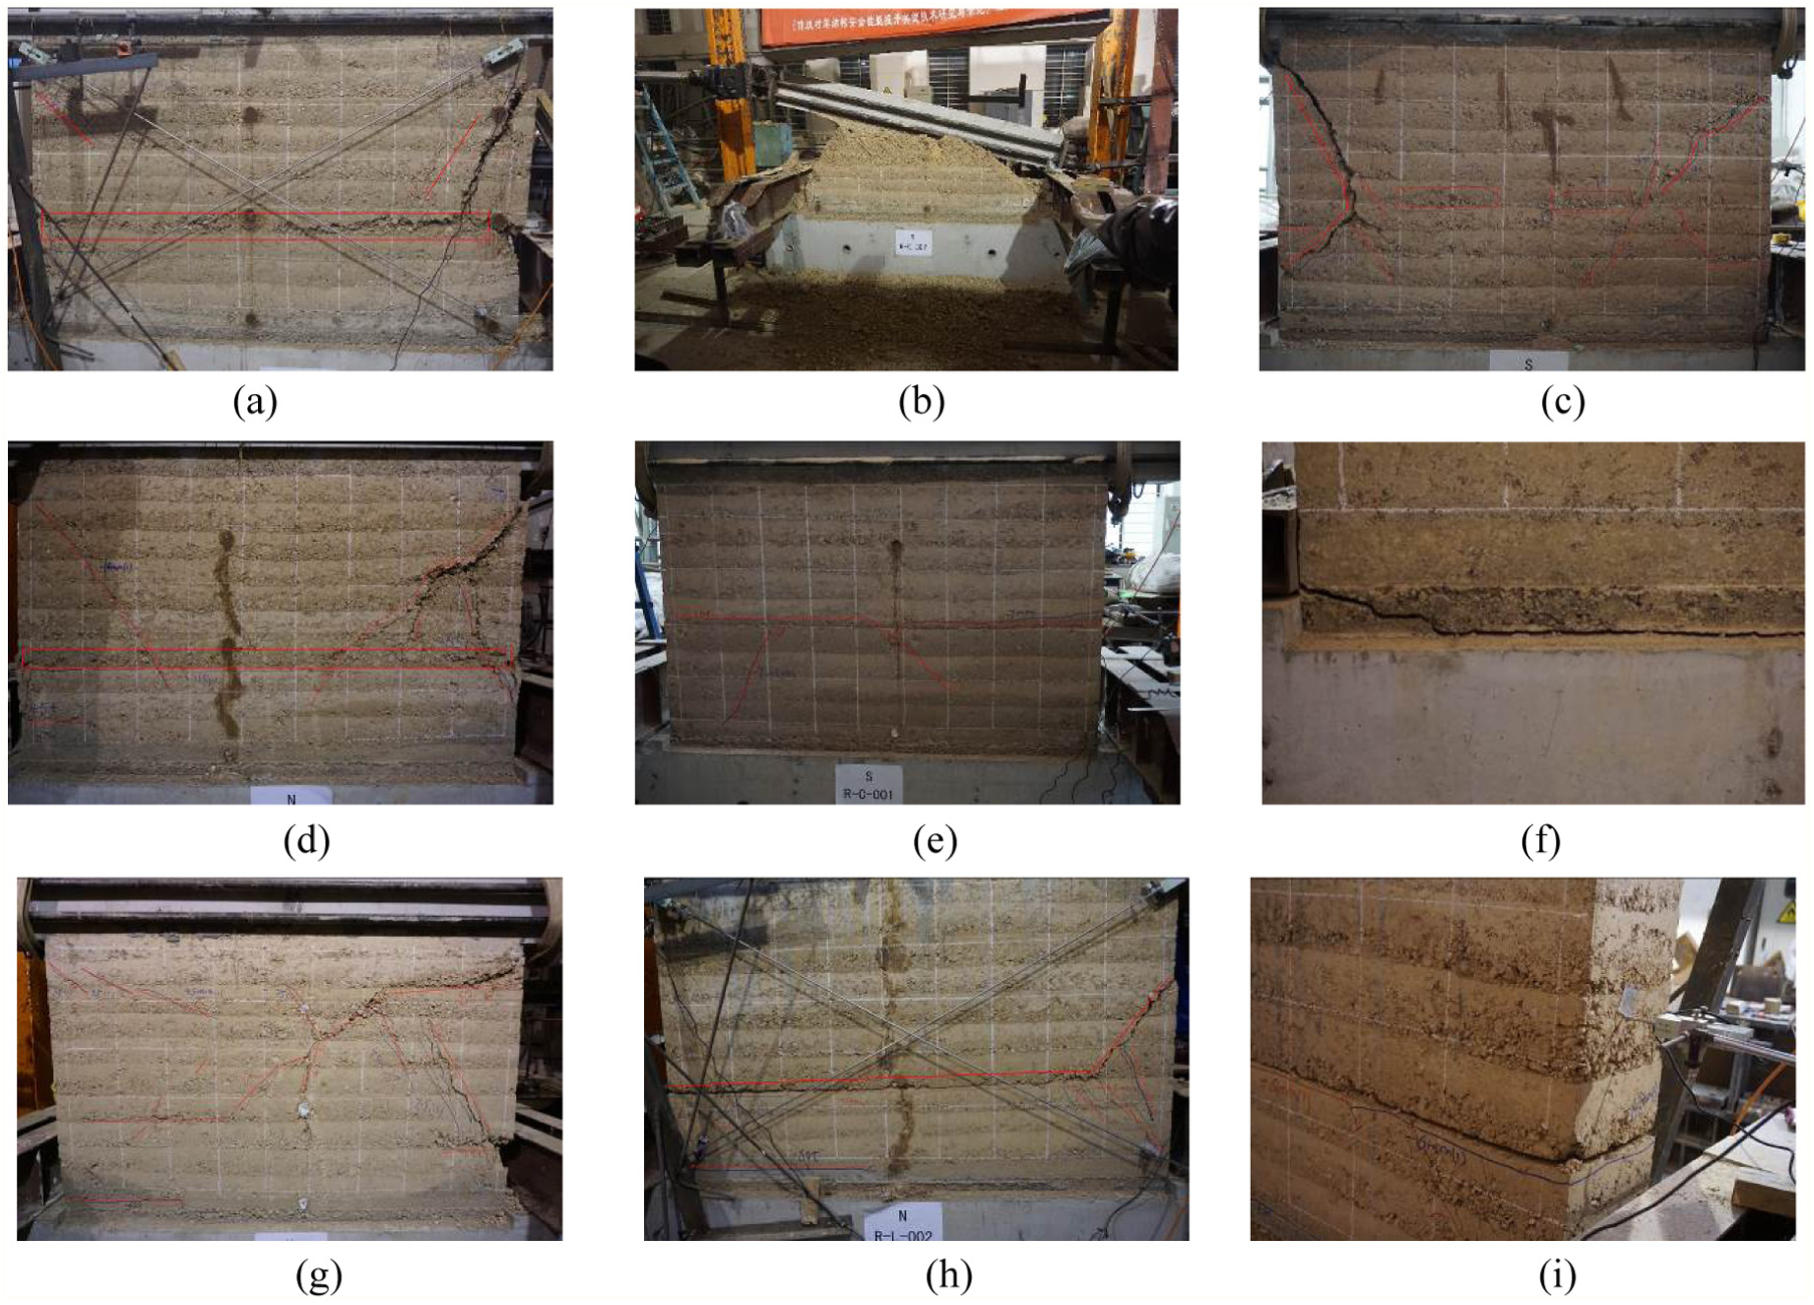
Crack distribution of specimens: (a) W1, (b) ultimate damage of W1, (c) W2, (d) W3, (e) W4, (f) W5, (g) W6, (h) W7, and (i) sliding and rocking of W7.
As the cyclic displacement was increased, cracks in W2 propagated obviously along the diagonal direction. These diagonal shear cracks were continuously expanding and widening at the initial displacement-controlled stage. When the displacement reached 6.5 mm, diagonal cracks occurred at the pull and push direction, and the maximum crack width reached almost 3 mm. Then horizontal damage gradually occurred at the lower part of the fifth layer. At this stage, owing to the remaining horizontal effective shear transferring part was continuously respond to dilatancy, an obvious degradation of residual horizontal resistance and stiffness was occurred. The ultimate crack distribution is shown in Figure 5(c).
For W3, diagonal cracks at push direction were ceased at the fourth layer in the last cycle of load-controlled stage when the load reached 65 kN, which behaved similar to W1. And the difference between these two is that the diagonal cracks at pull direction occurred at the displacement of 10 mm, which is twice as much as W1. This is due to the geogrid sheet providing RE wall with a horizontal weak constraint, which allows a larger deformation during the cyclic loading and delays the occurring of the premature crack. The ultimate damage distribution of W3 is given in Figure 5(d).
Specimen W4 shows a different displacement response at pushing and pulling directions during the cyclic loading, which may be due to unstable quality of the mixture of cement and compound. The initial short crack of W4 occurred at the interface between base and wall when the pushing load reached 80 kN. And when the cyclic load reached 100 kN, the interface between the fourth and fifth layers was entirely cracked as well. As the loading was continuing, a stable rocking failure with slightly shear sliding formed between layers at mid-height of the specimen. The intensified in-plane rocking at subsequent cyclic loading led to a local compression phenomenon, which caused diagonal cracks below the horizontal crack as given in Figure 5(e).
There was no crack in W5 after cyclic loading. When push load reached 70 kN, the crack occurred at the interface between bottom beam and wall, which was entirely formed at cyclic load of 105 kN as given in Figure 5(f). The specimen showed a constant rocking at subsequent cyclic load. That is to say, these boundary conditions and vertical load were not allowed to damage specimen W5 at the in-plane cyclic loading.
The initial crack in W6 occurred at the interface between layers 0 and 1 in the vicinity of the right bottom part of specimen, when the pull load and displacement, respectively, reached 65 kN and 3.92 mm. Diagonal cracks in the vicinity of loading point were formed at push load of 80 kN, and the upper diagonal short cracks at pulling direction were formed at a displacement of 7.5 mm during the first cycle of displacement-controlled stage. These cracks distributed at the surface of specimen had got through at subsequent cyclic loading, which ultimately showed an approximate “X” shape as given in Figure 5(g).
Specimen W7 was also initially cracked at the right bottom side between layers 0 and 1, when the pull load reached 60 kN. Similar position of initial cracks at W6 and W7 may be due to the weaker compatibility of the interface between cement and lime stabilized layers. When the displacement of the pull direction reached 4.5 mm, a diagonal crack formed at the left side of the specimen at middle height. After three times of cyclic loading at a displacement of 4.5 mm, the diagonal crack was connected to the horizontal interfacial crack between the third and fourth layers. Moreover, when the displacement reached 6 mm, the horizontal crack between the third and fourth layers was entirely formed, as shown in Figure 5(h). Specimen W7 did not show further crack development afterward, but displayed a stable shear sliding with rocking during subsequent cyclic loading, as given in Figure 5(i).
Analysis of failure mechanism
As a construction material, earth shows a weaker brittle failure characteristic, which means once the strength exceeds the limit value, crack occurs suddenly. And all these distributions of crack patterns such as diagonal cracks, horizontal dilatancy, sliding, and rocking had illustrated that the damage of RE walls was dominant by the shear failure mode.
It was observed that un-stabilized specimens did not exhibit any sliding between layers, but showed diagonal cracks or horizontal dilatancy, which indicated the weak strength of RE layers and two different crack development modes of URE specimens. The loss of horizontal resistance at push or pull direction resulted the sharply intensified damage, and it led to final failure. After the comparison of un-stabilized specimens, we could find that the shear capacity at approximate elastic stage was mainly influenced by the cohesion of engineered compound, which was corresponding with the subsequent diagonal cracks and horizontal dilatancy layer. Furthermore, with the aggravation of damage, shear capacity was gradually governed by the friction and particle interlock between particles. Geogrid sheets had not changed the failure mode of RE wall, but supplied a better deformation capacity.
With a further discussion of results obtained from un-stabilized and stabilized specimens, it is to be noted that stabilization improved the strength of RE layers, and the weak position was transformed from the binder strength between particles to the bond strength between layers. Therefore, these proportions of stabilization (cement and lime) are effective to improve the binder strength between particles, and SRE specimens exhibit different crack distribution compared with un-stabilized specimens (W1, W2).
Failure of W6 is dominated by a combination of bond strength between layers and the strength of RE layers, which is similar to the cracks of masonry walls occurring at both mortar joints and blocks. The shear capacity of these two lime stabilized specimens is higher than un-stabilized specimens but far less than the cement stabilized ones. Therefore, the stabilization effect of the same content cement and lime is quite different. And a similar shear capacity of these two lime stabilized specimens may be due to the following reasons: (1) a lower content of clay in the compound limits the interaction of lime and clay, which provides limited binder strength between particles even though much lime is added; (2) carburizing reagent of Ca(OH)2 would be a long-term process, and 5 months maintenance in the natural surrounding is not enough to reach the optimal strength. On the contrary, the bond strength of cement stabilized rammed earth (CSRE) depends on the particles’ bounds of solid matrix produced by the relatively faster cement hydration process.
Evaluation of shear and deformation capacity
With the addition of stabilization (cement and lime), the bond strength between particles had largely improved, which accordingly improved the shear capacity of SRE walls, but still offered limited displacement responses. And the brittle failure pattern of URE had not changed, either. Characteristic points and failure mode of specimens are given in Table 3. The following conclusions can be drawn:
W3 showed a similar peak load and a nearly two times corresponding peak displacement with W1 and W2, which illustrated the positive deformation capacity of RE wall reinforced with geogrid sheets.
Even though W4 and W7 exhibited similar cracks’ distribution, the peak load and the corresponding top displacement of each specimen are, respectively, 1.43, 1.23 and 0.7, 1.06 times than the mean value of W1 and W2. It indicated that these two different proportions of lime and cement can improve the shear capacity of SRE walls, but cannot supply a better corresponding deformation capacity, which are also fit with the larger stiffness and a much more sudden brittle damage feature of SRE. These two different shear capacities and similar crack distribution showed that this content of lime provided a lower bond strength between layers.
W5 had no crack after the test, but still showed 1.82 and 1.12 times of peak load and peak displacement than the mean value of W1 and W2, respectively. Comparing with W4 and W5, we could find that a twice added content of cement can improve the shear capacity up to 1.23 times, despite the real shear capacity of W4 being underestimated.
W6 almost avoided the horizontal dilatancy damage and showed a corresponding shear capacity with W7 that twice added content of lime. That is to say, this twice added content of lime is nonsense in enhancing the shear capacity of specimens.
Characteristic points of specimens.
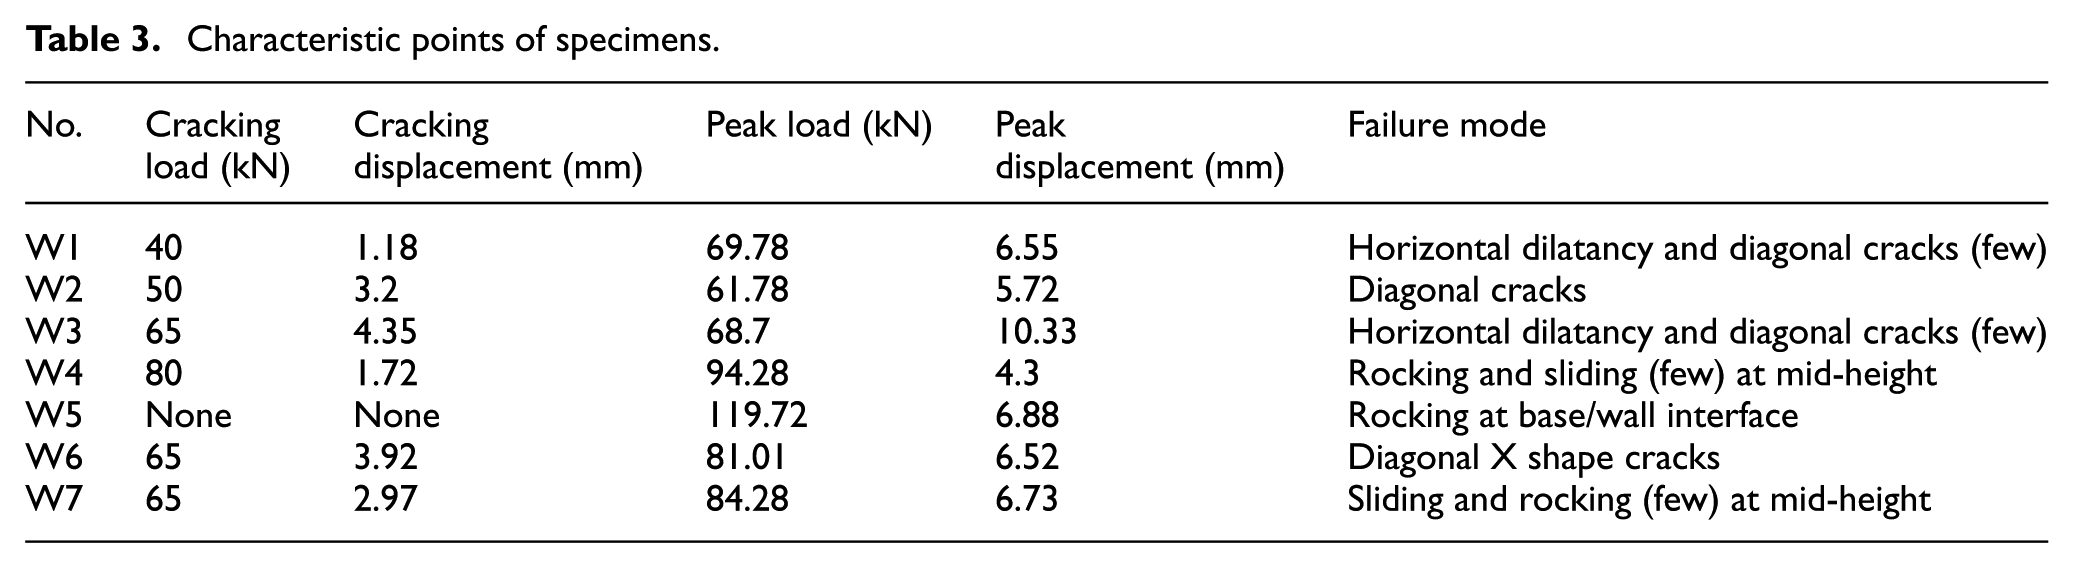
From the discussions above, we can conclude that cement is the most suitable stabilization for this proportion of soil, sand, and gravel (RE), and lime comes next.
Hysteretic behavior and envelope curves
The relationship of top displacement and horizontal force during the horizontal cyclic loading was real-time recorded to draw hysteretic responses of all the tested specimens, which are indicated in Figure 6. Different from other construction materials, RE specimens showed a continued intensifying deformation and stiffness losses even though at initial loading, and whose hysteretic curves exhibited shorter linear elastic state. Subsequently, loops were obviously opened, which was mainly due to (1) the creep deformation of soil, and the slightly rolling gravels in un-stabilized specimens were no longer coordinated with the horizontal displacement and (2) the mutual pressing and friction between particles were aggravated in stabilized specimens. Once these microcosmic deformations could not consume the energy supplied by the horizontal cyclic force, the occurring of cracks was to release the stress concentration, which also led to an increased area of the loop. After the formation of main cracks, the shear capacity was no longer improved with the increase in displacement. Slopes of load–displacement curves were obviously reduced at this stage, and residual deformations occurred during the unloading process.
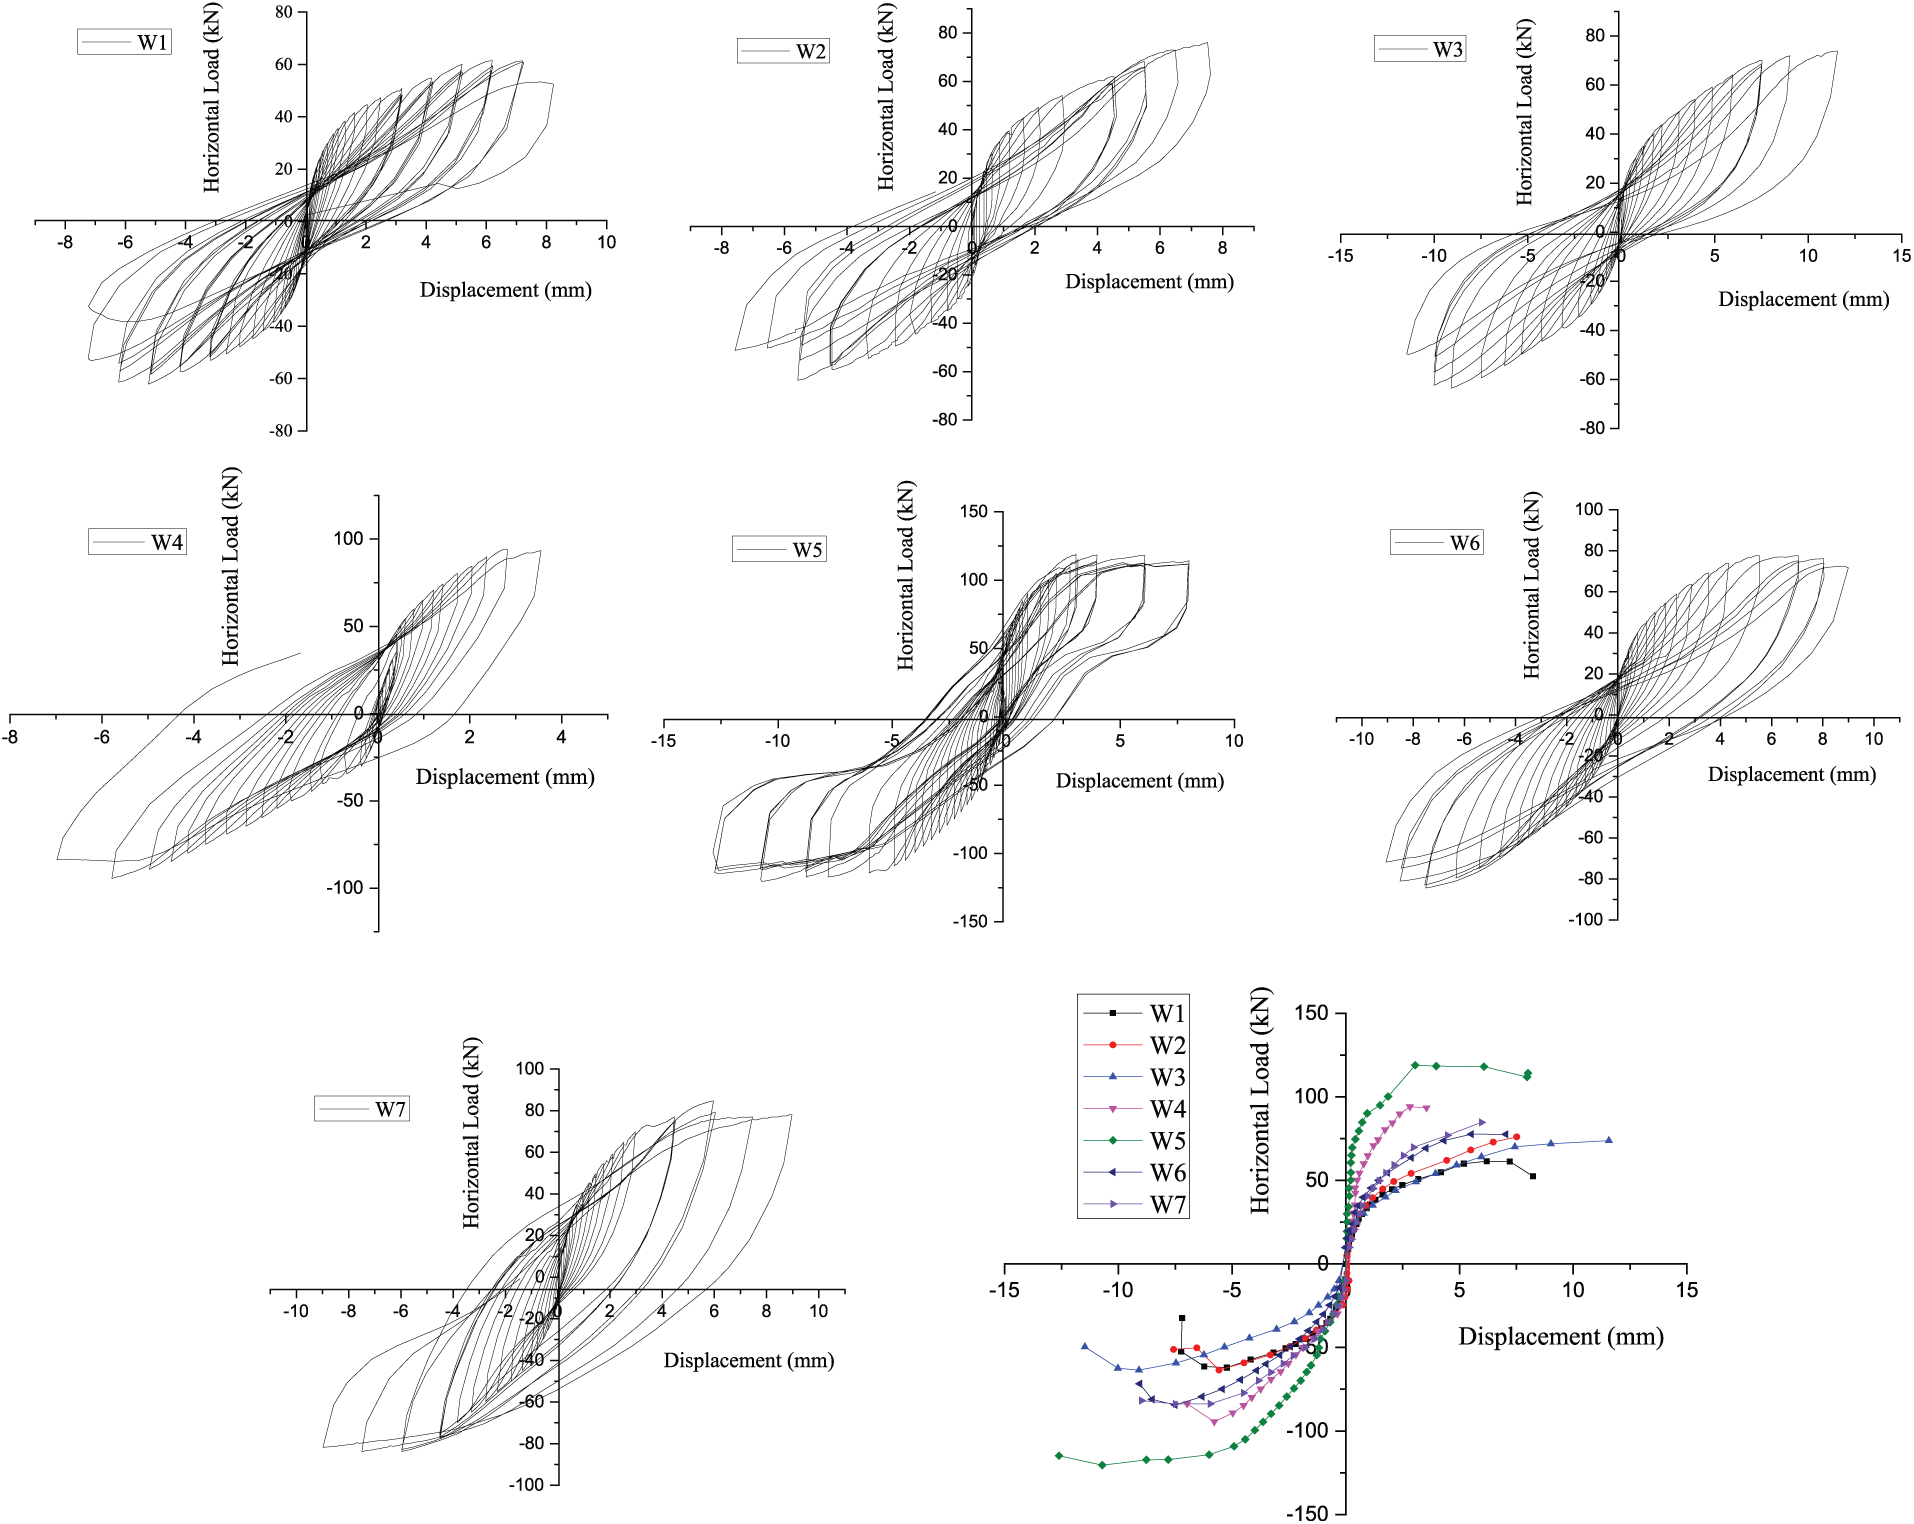
Envelope and skeleton curves.
The skeleton curve of each specimen is derived from hysteretic curve of the first cycle at each load/displacement level, as shown in Figure 6. It can be seen that each load–displacement curve experiences a rapid growth in horizontal force at initial stage and a slower increase afterward, and then reach the ultimate load with brittle failure. Because of the unbalanced damage of all specimens under cyclic loading, the curves develop unsymmetrically about the balanced axis in And because the unbalanced damage distribution had exhibited in each specimen, the curves also developed unsymmetrically at X axis, particularly in cement SRE specimens. Finally, skeleton curves of specimens indicated that
These two un-stabilized specimens (W1 and W2) showed a similar variation trend of skeleton curve, in spite of exhibiting different crack development patterns.
Specimen reinforced with geogrid sheets exhibited the maximum deformation capacity among these specimens but showed a corresponding horizontal shear capacity with un-stabilized specimens.
Skeleton curves of un-stabilized specimens were enveloped in the skeleton curves of stabilized specimens, and cement stabilized specimens had the largest range of envelope curves.
Stiffness degradation
Stiffness degradation usually occurs during the reversed cyclic loading. The first cycle of each load/displacement level has been taken to calculate secant stiffness using slopes of line drawn between each peak load of pull and push directions. The value of secant stiffness at the sixth cyclic load (30 kN) is taken as the initial secant stiffness for the reason that the creep deformation almost tended to cease or stable here. Figure 7 shows the stiffness degradation of all specimens. The initial secant stiffness values are 48.11, 42.85, 25.01, 88.25, 79.39, 43.53, and 60.56 kN/mm, respectively. The values at displacement of 3 mm are 16.04, 17.54, 13.37, 27.36, 34.08, 20.48, and 22.23 kN/mm, which show obvious decrease (almost exceed 50%) in comparison with initial secant stiffness values. These repaid decreases are mostly in pace with the formation of main cracks, and the later slower degradation is behind the peak load with obvious intensified damage.
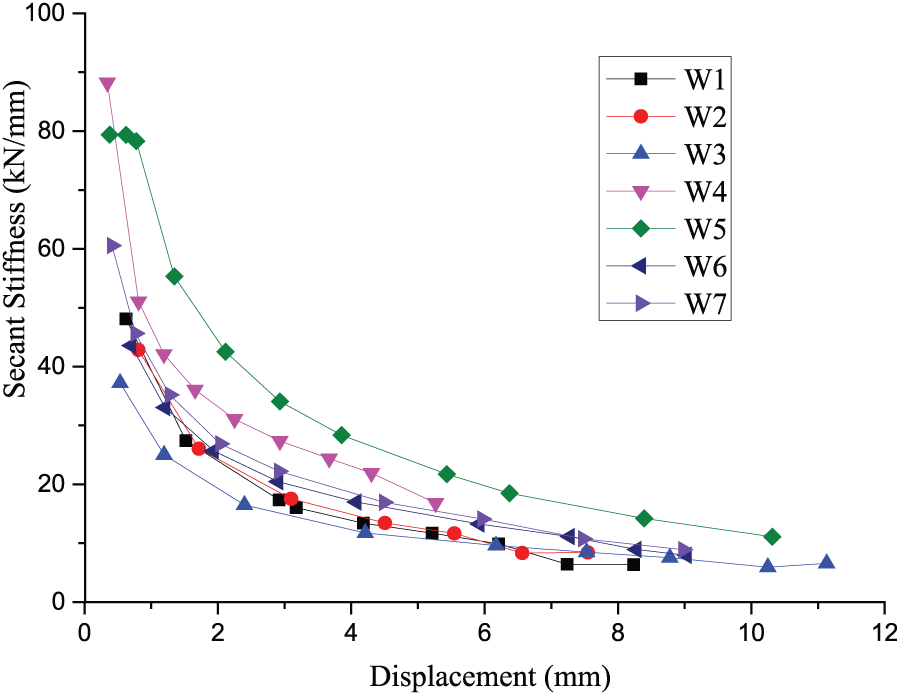
Stiffness degradation curves.
Specimens (W3, W4, W7) with lateral cyclic behavior predominantly characterized by the rocking and sliding mechanisms showed larger values of residual stiffness. A larger value of stiffness led to a more rapid decrease at the initial crack development stage. These two un-stabilized specimens showed similar lower initial stiffness values and relative stable decrease during the cyclic load, as is the case of stable crack development and brittle damage pattern. Geogrid sheet–reinforced specimen indicated the lowest stiffness value, which may be induced by the layout of geogrid sheets and the discordant deformation between geogrid sheets and RE wall. And 5% lime stabilized specimen also showed an equivalent secant stiffness between URE and SRE specimens.
Energy dissipation
As shown in Figure 8, the accumulated energy dissipation during the first cycle at each level of load/displacement is calculated quantitatively based on the hysteretic response curves. Dissipated energy is computed at each cycle by calculating the area enclosed by the loop as mentioned (Vasconcelos et al., 2013).
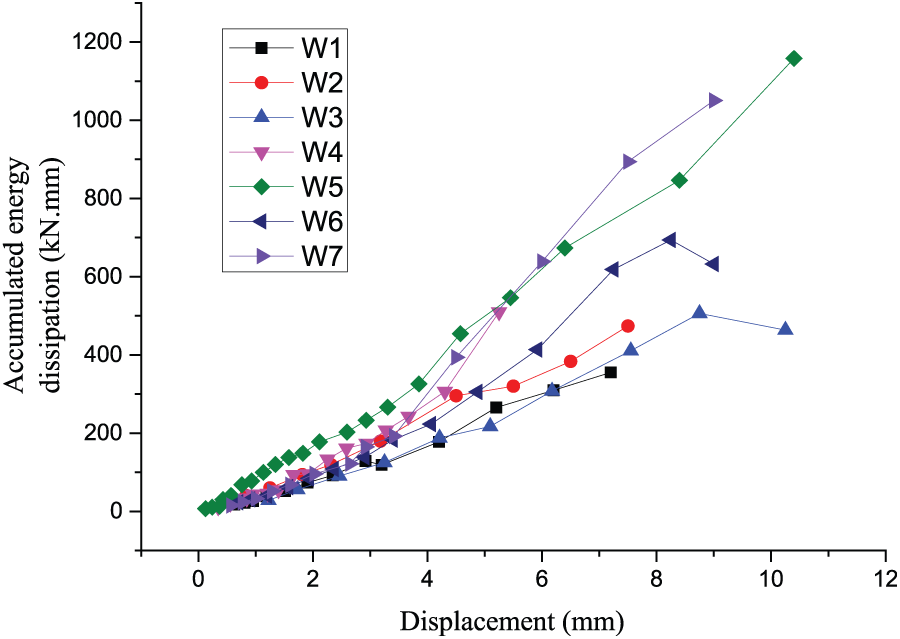
Accumulated energy dissipation.
The accumulated energy dissipation of specimens (W3, W4, W7) is always higher than others, which indicated the effectiveness of stabilization at these proportions in improving structural properties of the dissipated energy, although 5% cement SRE specimen (W3) has a few top displacement response. The energy dissipation of 5% lime SRE specimen (W6) is higher than URE specimens but lower than other cement SRE specimens after the subsequent cyclic displacement at 6 mm, which is in line with the experimental load-carrying capacity. These results once again showed that stabilization is a very important parameter for structural behavior of RE buildings.
The lower dissipated energy of URE buildings with weak displacement response has been testified as given in Figure 8. The geogrid sheet–reinforced specimen with a larger deformation capacity shows a higher cumulative dissipated energy than URE specimens, which illustrated the validity of geogrid sheets in improving the structural energy dissipation.
Conclusion
RE is a traditional environment-friendly construction entity, which has been used for thousands years in China. Earthquake disasters happened in the past warned us to pay enough attention to explore the seismic performance of RE buildings. With the update of RE technique, this research is primarily based on the laws of proportioning concrete and mixing the suitable compound for RE. In situ construction experience and experimental results showed that taking PSD and these clay physical state indexes as the main reference factors to roughly mix suitable engineering compound for constructing building was practicable and truthful. Then stabilization was added to mix the SRE and horizontal geogrid sheet–reinforced URE for improving displacement capacity of RE. As mentioned below, the strength of blocks and mortar joints is vital to the strength of masonry, which makes clear that the strength of RE layers and bond strength between layers are important to RE. Therefore, addition of stabilization is aimed at not only improving the layers’ strength but also enhancing the bond strength between layers. After these works have been done, RE specimens have been constructed to investigate the in-plane behavior during cyclic loading. The main experimental results can be shown as follows:
Boundary conditions between RE specimens and concrete beams have been testified suitable for RE specimens during the in-plane cyclic loading, even though W5 showed a rocking failure phenomenon.
The brittle vertical collapse failure phenomenon of the traditional RE buildings happened in previous earthquakes had been verified by final failure of W1, which also showed the potential risk of modern RE buildings during real earthquake. Meanwhile, the experimental results also showed that geogrid sheets could improve the deformation capacity of RE wall, and the stabilization of cement and lime had largely improved the shear capacity along with different damage developments.
The damage of un-stabilized specimens occurred at the weaker horizontal constraint position at the end and middle height of RE walls and distributed as diagonal cracks or horizontal dilatancy; damage distribution of slightly stabilized specimen (W6) combined few horizontal cracks between layers and widely distributed diagonal cracks; and only strong stabilized specimens (W4, W5, W7) showed obvious horizontal cracks between layers. That is to say, the strength of RE layer and the bond strength between layers are, respectively, deemed as the inherent defects of URE/SRE buildings.
The improvement of shear/deformation capacity, stiffness, and energy dissipation had testified the effectiveness of stabilization in RE. An improved content of cement is vital for the structural performance of CSRE walls, while a higher content of lime shows lower improvement of structural performance such as stiffness and energy dissipation when compared with CSRE walls.
All these in-plane cyclic experimental phenomena indicated that RE buildings without any seismic measures are not recommended to be constructed in seismic precautionary zones. Meanwhile, the seismic measures of confined masonry such as ring beams and constructional columns are advised to be taken.
Footnotes
Declaration of Conflicting Interests
The author(s) declared no potential conflicts of interest with respect to the research, authorship, and/or publication of this article.
Funding
The author(s) disclosed receipt of the following financial support for the research, authorship, and/or publication of this article: The authors gratefully acknowledge the funding supported by the National Science and Technology Support Program of China (Grant No. 2014BAL06B03) and Shaanxi Key Technology and Innovation Team Project (Grant No. 2014KCT-31).