
Abstract
The collapse problem of transmission tower upon strong winds was well noted in past few years. This article analyses the wind-induced collapse problem of a long-span transmission tower–line system. The member buckling effect was particularly considered. In doing so, a three-dimensional finite element model of the long-span transmission tower–line system was established in ABAQUS based on a practical project. The transmission tower and line were simulated by the frame and truss elements, respectively. The nonlinear behavior of a compressive member was simulated using the Marshall model, and the nonconvergence of numerical calculation was set to be the collapse criterion. The critical wind speed, damage position, and collapse probability were obtained from a collapse analysis of the long-span transmission tower–line system under different wind attack angles. The collapse mechanism of the long-span transmission tower–line system under a wind attack angle of 45° was investigated, and an incremental dynamic analysis was performed to evaluate the collapse-resistant capacity of the transmission tower. The study reveals that the interaction between bending moment and shear deformation is critical to the collapse of transmission tower.
Keywords
Introduction
Transmission tower–line systems, which are tall and long-span structure, are important lifeline projects. The demand for electricity continues to increase with the development of industrial technology. The energy in wind spectrum is mainly concentrated at low frequencies, and the structural frequency decreases as the height and span of a transmission line increase. Many accidental collapses of transmission tower–line systems under wind loads were reported in recent years. For example, the strong typhoon Hagupit caused 24 transmission towers to collapse in the city of Maoming in 2008; strong wind caused severe damage to the 220 kV Qinghu tower in Liaoning province in 2013; more than three transmission towers collapsed because of extremely strong winds in the city of Wuxi in 2013; and three transmission towers collapsed due to strong winds in Hubei province in 2015. The above collapse cases demonstrate that strong winds tend to cause serious damage to transmission tower–line systems, and the collapse of a transmission tower further affects the power supply and result in considerable economic losses. Therefore, studies on the collapse mechanism of transmission tower–line systems upon wind loads need to be performed to better improve the safe operation of transmission lines.
In recent years, the structural collapse problems under extreme loads draw wide attention among many researchers. Isobe and Tsuda (2003) conducted a seismic collapse analysis of reinforced concrete framed structures using the adaptively shifted integration (ASI) technique. Grierson et al. (2005) presented a progressive failure analysis procedure to evaluate the performance of a building framework after it has been damaged by unexpected abnormal loading. Shen and Zhi (2005) studied two failure mechanisms of reticular shells subjected to dynamic actions based upon nonlinear dynamic response analysis and proposed criteria for determining the failure strength and for dynamic instability in reticular shells. Kwasniewski (2010) presented a case study of the progressive collapse analysis of a multistory building and analyzed different loading configurations through nonlinear dynamic simulations. Shi et al. (2010) developed a new method for the progressive collapse analysis of reinforced concrete frames considering both a nonzero initial condition and existing damage in structural members. Naji and Irani (2012) presented a simplified analysis procedure for the progressive collapse analysis of steel structures using the load displacement and capacity curve of a fixed-end steel beam. Xue and Le (2016) investigated the probabilistic collapse behavior of reinforced concrete buildings subjected to local structural damage and used a set of coarse-scale cohesive elements to model the failure of potential damage zones in various reinforced concrete structural members. Gur and Ray-Chaudhuri (2014) performed a fragility analysis by defining the failure of a crane in terms of damage states and then generating fragility curves to determine the effect of different parameters on the failure probability of the container crane.
Due to the importance of the lifeline system, more and more attentions have been paid to the ultimate capacity of the electricity transmission system against multihazards, such as wind and earthquake. Savory et al. (2001) conducted the dynamic structural analysis to predict the tornado-induced shear failure of a power transmission tower–line system. Wang et al. (2013) investigated the seismic-induced collapse of power transmission tower–line systems by using the proposed birth-to-death element technique in ABAQUS. This method was also utilized to simulate the collapse of the system subjected to wind and multicomponents ground motions (Tian et al., 2016; Zhang et al., 2013). Beside the birth-to-death element technique, the instantaneous element removal method was also utilized to investigate the progressive collapse of power transmission towers (Asgarian et al., 2016). It was concluded that the alternative load paths had a significant influence on the progressive collapse of the towers. Fu et al. (2016) presented a fragility analysis and concept of critical collapse curve for a transmission tower subjected to the wind–rain loadings by using incremental dynamic analyses. It was found that the rain load had a great contribution to the tower collapse. In addition, the collapse of power transmission towers subjected to broken conductor loadings was investigated by Bothma (2012), and the sensitivity analysis was conducted to demonstrate the influence of the different assumptions about the residual static load and the slenderness ratio of members.
As mentioned above, many research efforts were dedicated to studying the collapse failure of electricity transmission system subjected to the multihazards, that is, wind, earthquake, wind–rain, and broken conductors. However, there are very limited references to study the collapse of transmission tower–line system considering the influence of the member buckling effect. This article aims to investigate the collapse of a long-span transmission tower–line system subjected to wind loads by using the Marshall model, which can capture the nonlinear behaviors of steel pipe. According to a practical project, a detailed three-dimensional (3D) finite model of a long-span transmission tower–line system is established in ABAQUS. The critical wind speed, damage position, collapse probability, and unfavorable wind attack angle of tower are discussed. Based on the actual wind rose diagram at the location of transmission tower, the collapse mechanism under the wind attack angle of 45° which is the direction of the highest wind frequency is analyzed in detail, and the wind-resistant capacity of the system is evaluated by the inter-segment displacement ratio (ISDR; Tian et al., 2018).
Method of collapse simulation and the collapse criterion
Marshall model
Figure 1 shows the Marshall model, which is obtained from the hysteretic curve of cyclic loading tests of a steel tube. As shown in Figure 1, the model describes the hysteretic behavior of an inelastic member with an initial imperfection and the degradation of the axial stiffness of the member after compression buckling. The envelope of the Marshall model can be divided into six segments: O-A is the linear tension segment, and the stiffness of the member is EA; A-B is the tension yielding segment, and the stiffness is γEA; O-C is the linear compression segment, and the stiffness is EA; C-D is the first post-buckling segment, and the stiffness is αEA; D-F is the second post-buckling segment, and the stiffness is βEA. Note that when the strain exceeds the point F, the member completely loses its bearing capacity. F-A is the second tension straightening segment. When unloading in the instability segment of the envelope (such as points H, I, and J), the unloading path of the member is determined by drawing a line from the unloading point on the envelope to the tension yield point (such as segments H-A, I-A, and J-K). The coefficients shown in Figure 2 are defined as follows:

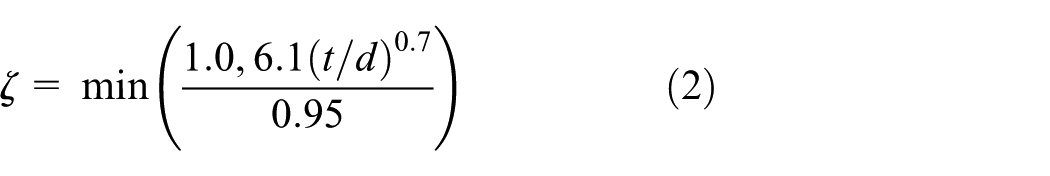
where L is the length of the steel pipe, d is the diameter of the steel pipe, and t is the thickness of the steel pipe.
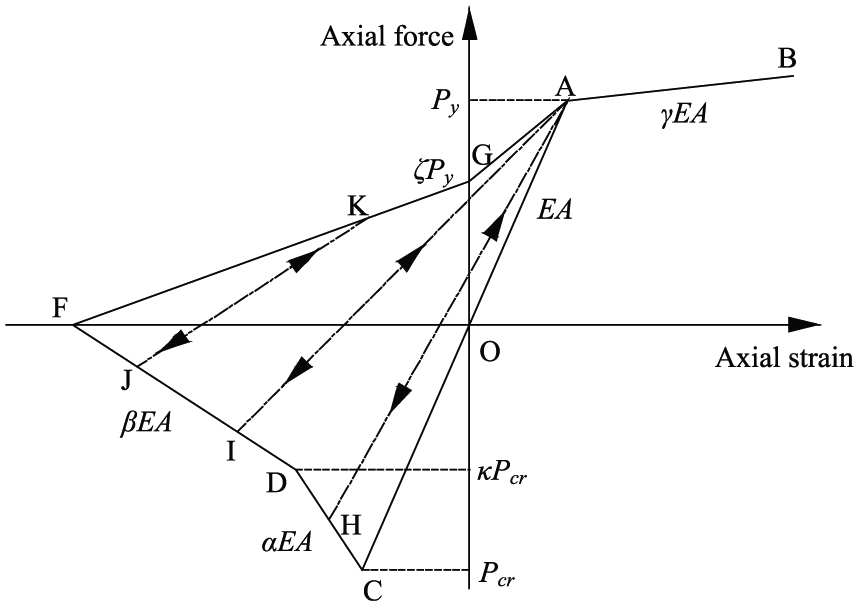
Marshall model.
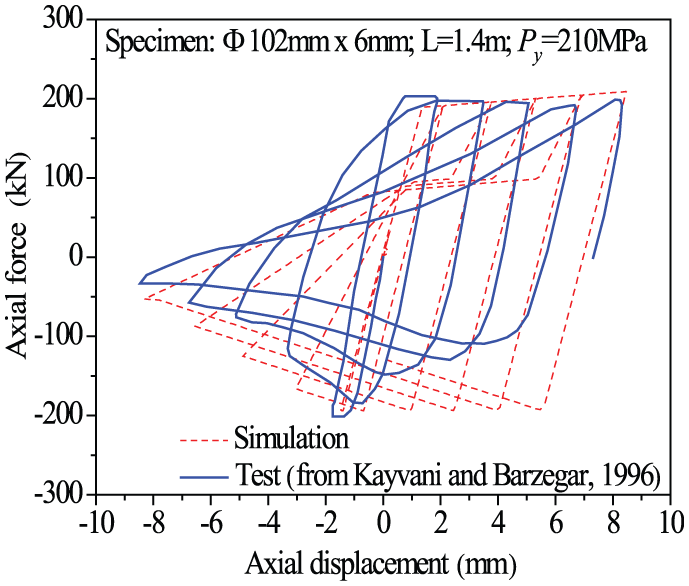
Comparison of hysteresis between curves: the test and simulation results (data from Kayvani and Barzegar, 1996).
The instability criterion for a space steel pipe recommended by the International Standardization Organization (ISO 19902; Marshall et al., 1977) is used for the frame element, and the plastic hinge model considering second-order effects and the Marshall model are used to simulate the member before and after instability, respectively. To verify the actual mechanical behavior of the frame element, a simply supported beam is simulated under axial cyclic loading, and the results are compared with the experimental results (Kayvani and Barzegar, 1996) in Figure 2. The specimen is a steel pipe with the diameter of 102 mm, the thickness of 6 mm, and the length of 1.4 m. And the yield stress of the tested steel is 210 MPa. It can be observed that the hysteresis curve based on the frame element is in good agreement with the experimental results; thus, the frame element can be used to simulate the mechanical properties of the member instability and after instability.
Previous disaster surveys indicate that instability is the main cause of the failure and collapse of transmission tower structures. To date, when the collapse of a transmission tower is simulated under wind loading, only the yield strength of the member material is considered; the effect of the buckling instability of the member is ignored. Thus, the collapse-resistant capacity of the transmission tower is overestimated. Therefore, the frame element considering the effect of buckling instability is selected to simulate the transmission tower in ABAQUS.
Collapse criterion
The collapse of a structure is initiated by an initial local failure, and then, the collapse of a part or the entire structure occurs. A reasonable failure criterion is needed to study the failure mechanism of a transmission tower under wind loading. The dynamic equation of the transmission tower–line system under wind loads can be expressed as follows

where
As the wind speed increases, the wind speed corresponding to a significant increase in the displacement at the top of transmission tower was defined as the critical wind speed based on past research (Fei et al., 2012). As reported in past research, the situation in which the iteration of the nonlinear dynamic equilibrium equations of the structure does not converge was the dynamic failure criterion based on shell structure (Qi, 2011). An iterative procedure is performed during each time increment according to the Hilber–Hughes–Taylor (HHT) method in this article. If the calculation result is convergent, the result is the response value of the structure at this moment. When the transmission tower is destroyed under wind loading, the dynamic response of the structure is divergent, and thus, the iteration of the nonlinear dynamic equations is not convergent. According to the dynamic equation (3), the left side of the equation is the structural bearing capacity, and the right side of the equation is the wind loading. The iterative equation is not convergent, and the transmission tower is destroyed because the structure cannot bear the wind load. Therefore, the situation in which the iterative equation does not converge is the collapse criterion, and the bearing capacity of the structure cannot balance the wind loading; the moment that the iteration does not converge is the time of structure collapse.
Structural model
A 220 kV electricity transmission system in Shandong province, China, is selected for this research. The entire system extends about 58.4 km and crosses the Yellow River, the fifth longest river in the world. This system was finished in 2010 and has been in operation for more than 6 years. A schematic diagram of the long-span transmission tower–line system is shown in Figure 3. The total length of the long-span transmission tower–line system is 1697 m, including two suspension-type towers, two tension-type towers, and three span transmission lines. The lengths of north, middle, and south spans are 294, 1118, and 285 m, respectively. As illustrated in Figure 4(a), a field photo of the transmission tower–line system is given. This supporting tower is designed based on the code for design of 110–750 kV overhead transmission line (GB 50545-2010, 2010), and the dimensions and member sections can be found in Figure 4(b). Besides, the tower is divided into 12 segments to calculate the wind loads in following section.
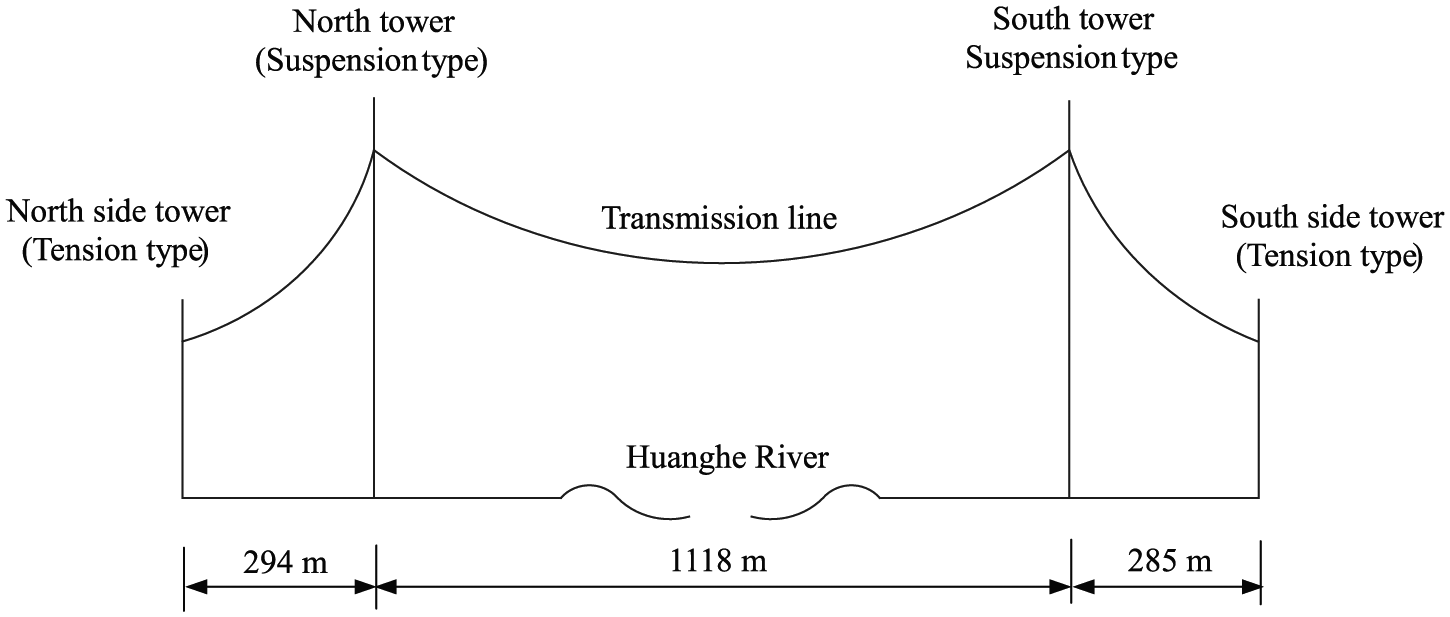
Schematic diagram of long-span transmission tower–line system.
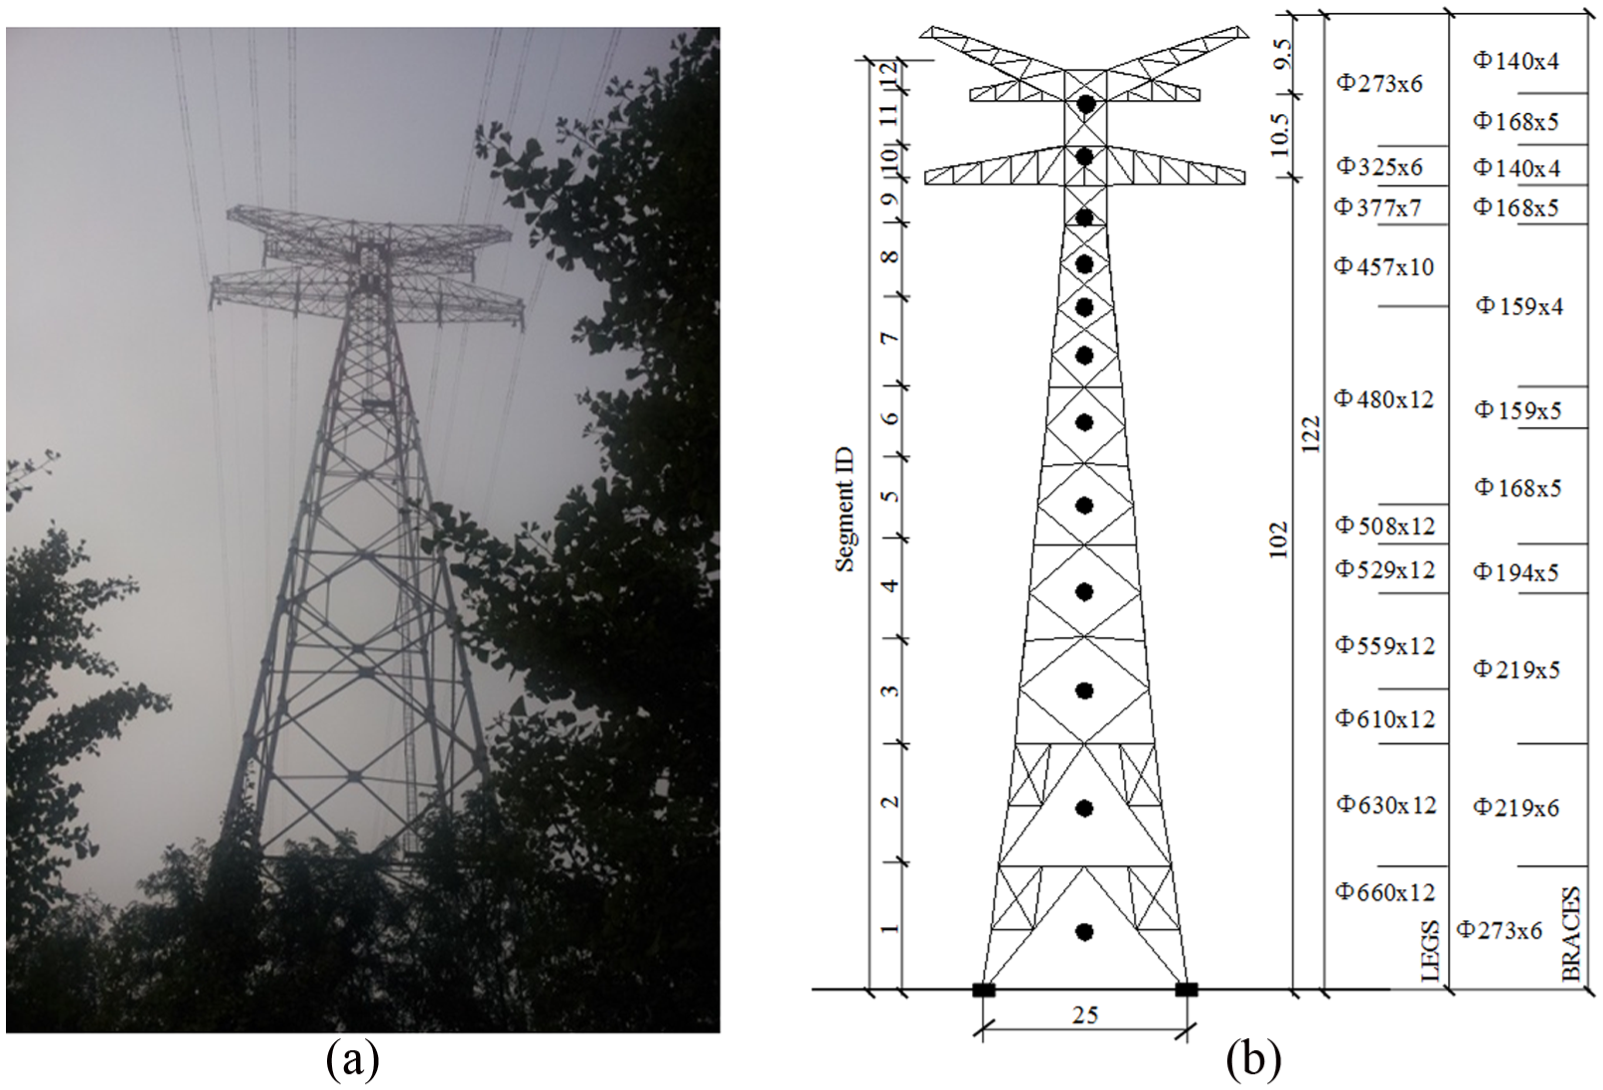
Practical graph and dimensions of suspension-type tower: (a) practical graph of suspension-type tower and (b) tower dimensions (m).
The long-span transmission tower–line system model is simulated in ABAQUS. The transmission tower is modeled by frame elements and consists of 1140 elements and 431 nodes. It has been approved that the numerical results of transmission tower according to frame element are close to the test results (Deng et al., 2001), so the frame element are selected for the simulation of transmission tower. The frequencies of the first lateral and longitudinal direction are 1.036 and 1.057 Hz, respectively. The upper two cables are ground lines, and the lower six cables are two-bundled conductor lines. The ground line and conductor line types are OPGW-180 and LHBGJ-400/95, respectively. Both the transmission line and insulators are modeled by truss element, and the elastic tension-only material property is assigned to the transmission lines. The finite element model of the long-span transmission tower–line system is shown in Figure 5. The north and south suspension-type towers are denoted as Tower 1 and Tower 2, respectively. The X, Y, and Z directions of the model refer to the transverse, longitudinal, and vertical directions of the long-span transmission tower–line system, respectively.
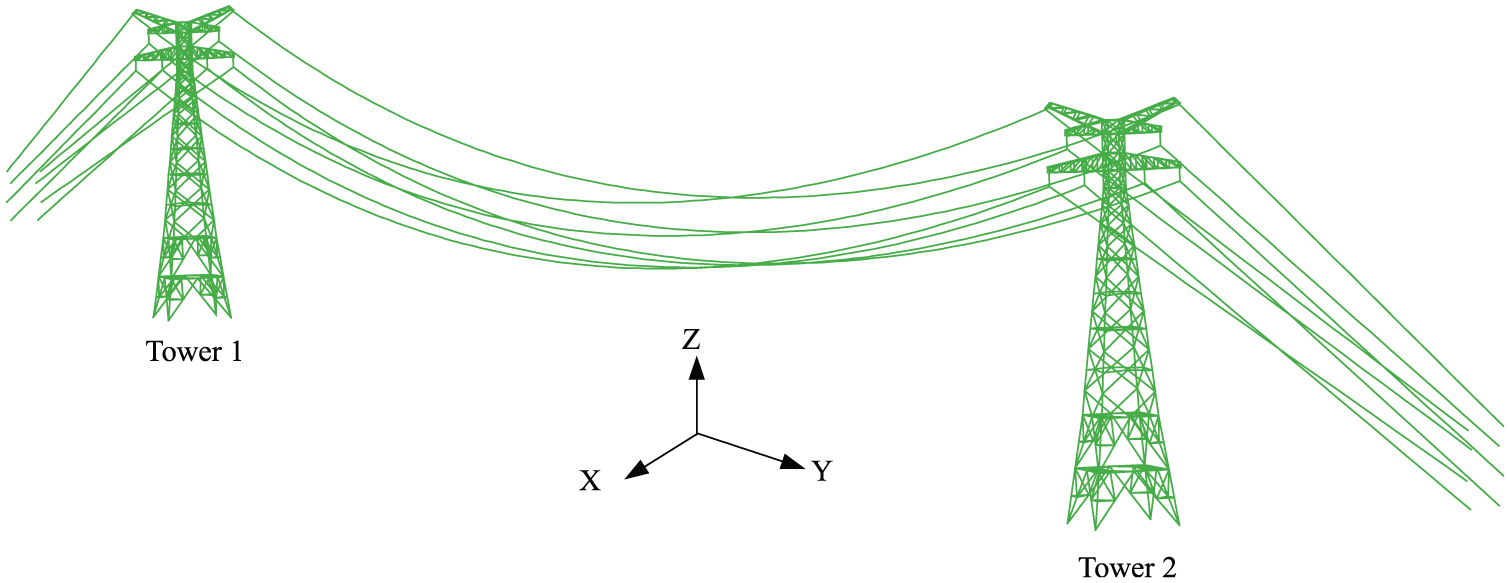
Finite element model of long-span transmission tower–line system.
Simulation of the wind load
The numerical simulation of the random process of wind speed is the basis for the time domain approach to the wind-induced response analysis of the structure. The common simulation methods mainly include spectral representation method (SRM) and white noise filtering method. A hybrid approach of space–time random field based on SRM and proper orthogonal decomposition (POD)-based interpolation is developed for simulating the above wind velocity process, and a stochastic wave-based simulation scheme for the multivariate nonstationary random process along a straight line is introduced in conjunction with either a direct summation of cosine functions or the application of a two-dimensional (2D) fast Fourier transform (FFT) by Peng et al. (2016, 2017). In this article, the random wind speed time histories of the transmission tower–line system are simulated based on the SRM (Shinozuka and Jan, 1972; Shinozuka and Yun, 1990). The average wind is calculated by the logarithmic function. Considering the characteristics of the long-span transmission tower, the Kaimal fluctuating wind power spectrum is selected for the target power spectrum (Simiu and Scanlan, 1996).
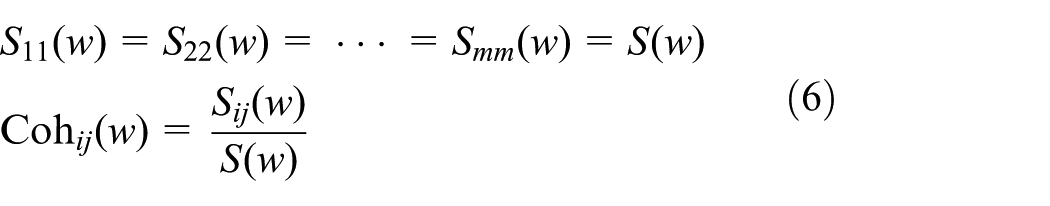
In natural wind fields, the wind speed and phase of the calculated points at different heights are different due to the unevenness turbulence. The correlation is generally expressed as a coherent function which is defined by the following equation
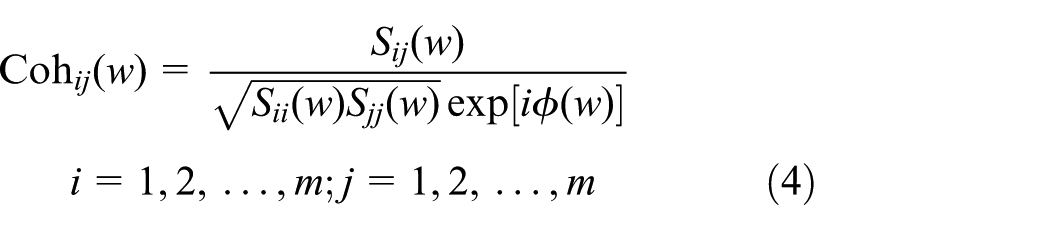
where w is the circular frequency, i and j represent calculation point in different heights,
For transmission tower structure, the vertical correlation of the calculation points is only considered because the lateral size of the structure is much smaller than the vertical size. The coherent function can be regarded as follows
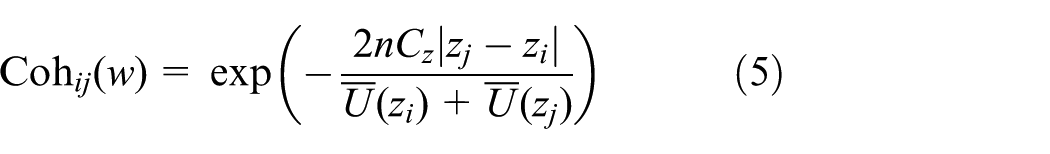
where n is the frequency, CZ is the exponential decay coefficient, zi and zj are the heights of two calculation points, and
For the transmission lines located in a flat zone, the mean wind and turbulent wind velocities of different simulation points can be assumed to be same; therefore, the coherent function can be rewritten as follows
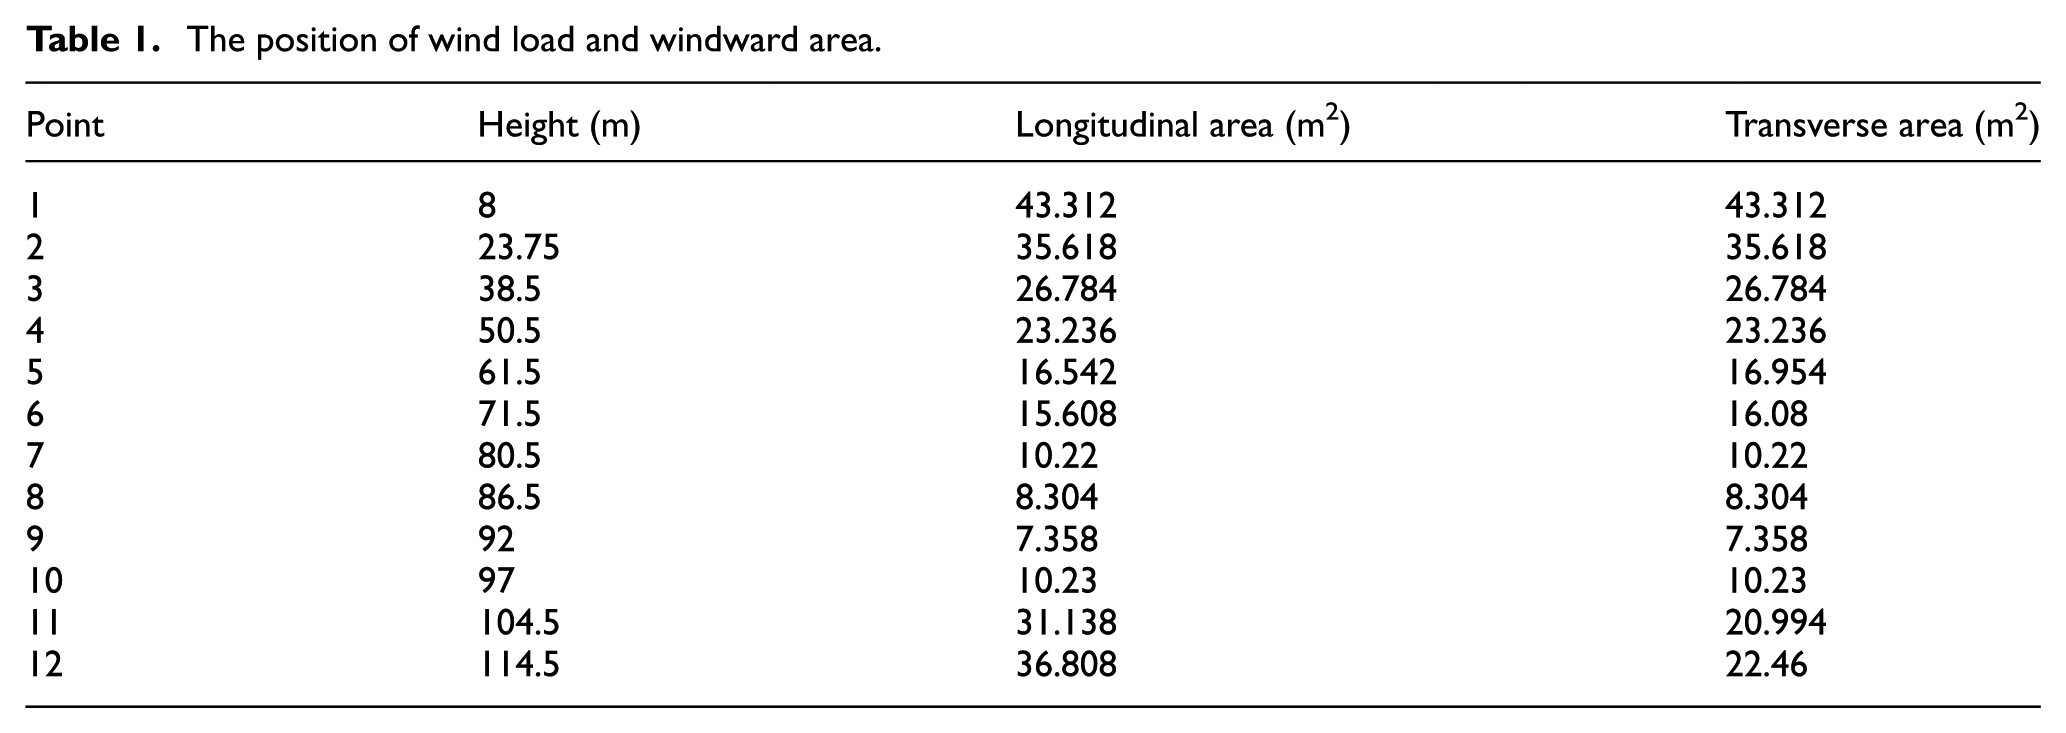
It is difficult to simulate the wind velocity history for every point of the transmission tower due to the large number of points in the structure. To simplify the regional simulation of the transmission tower, each simulated region is simplified as a simulated point to simulate the wind load, and the transmission tower is divided into 12 regions. The wind simulation points of the transmission tower are shown in Figure 4(b). The wind load position and windward area are provided in Table 1. The simulated points of the transmission line are arranged at equal intervals. The middle and side spans of the transmission lines are divided into 20 and 6 simulated points, respectively. In order to verify the effectiveness of the simulation method, the mean wind speed at a height of 10 m is assumed to be 30 m/s. Figure 6(a) shows the fluctuating wind speed time history of the simulated point 2. Figure 6(b) compares the target wind power spectrum and simulated time history of the fluctuating wind to verify the reliability and effectiveness of the simulation method. It can be observed that the simulation results agree well with the target spectrum. Therefore, the simulation method can be used to generate fluctuating wind speed time history with different mean wind speed.
The position of wind load and windward area.
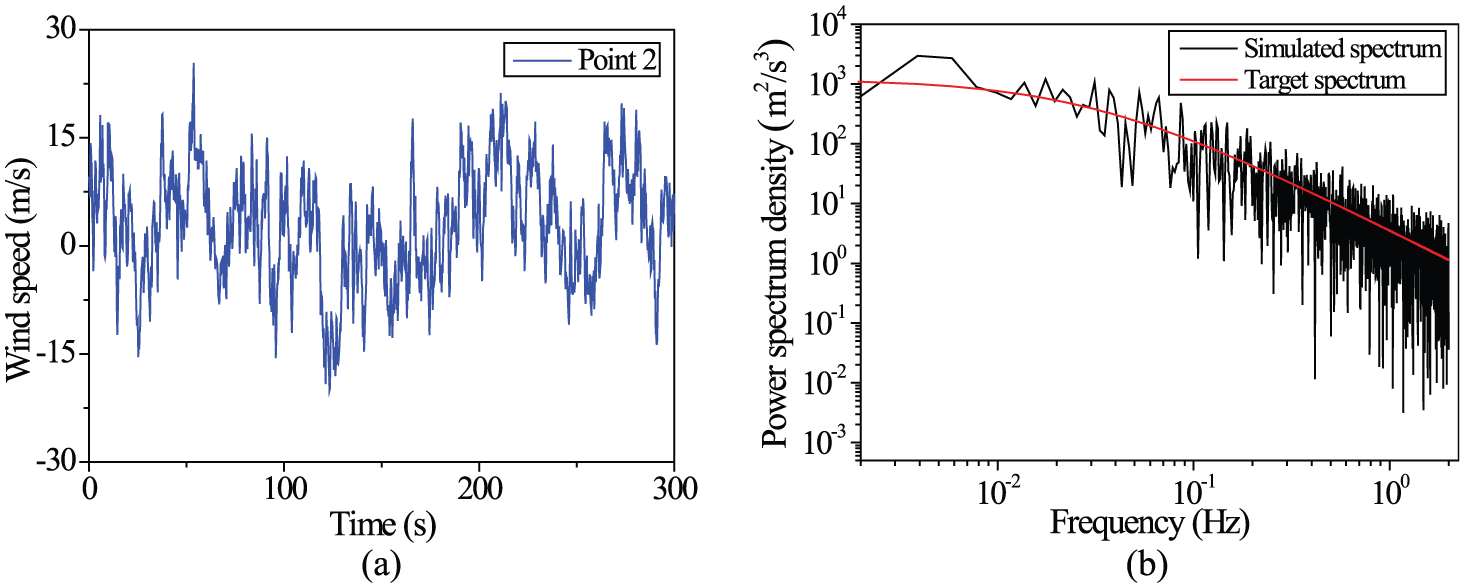
The fluctuating wind speed time history and power spectral comparison of simulated point 2: (a) fluctuating wind speed time history and (b) power spectral comparison.
The total wind speed at the simulated points is obtained by the superposition of fluctuating wind speed and average wind speed. The wind load formula of the transmission tower and transmission line can be expressed as follows (Fu et al., 2016)
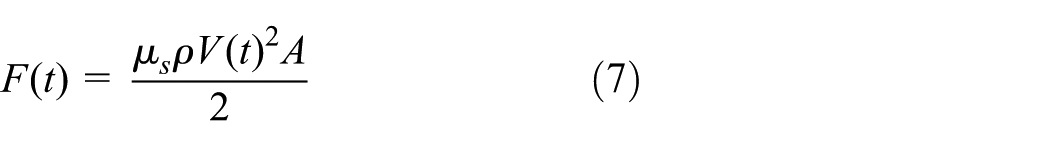
where
Numerical simulation and discussions
The collapse process of the long-span transmission tower–line system under wind load is simulated based on the implicit dynamic analysis method. As shown in Figure 7, seven wind attack angles are considered for the long-span transmission tower–line system, and the wind attack angle takes from 0° to 90° with an increment of 15°. To obtain weak position of the transmission tower, the collapse analysis of the long-span transmission tower–line system under different wind attack angles is studied. The ISDR values of the transmission tower under a wind attack angle of 45° are analyzed, and the collapse mechanism of the long-span transmission tower–line system is investigated.
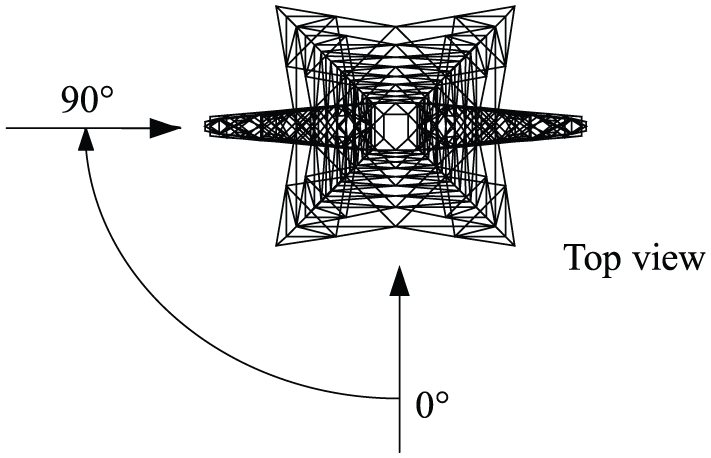
The schematic diagram of wind attack angles.
The collapse analysis of the structure under different wind attack angles
Different wind attack angles would lead to different load distributions in the two horizontal directions of the transmission tower–line system. Therefore, the collapse-resistant capacity of the long-span transmission tower–line system under different wind attack angles is analyzed by applying the incremental dynamic analysis method. The design wind speed of the transmission tower is 27 m/s. To obtain the wind speed corresponding to the collapse status of the transmission tower, the wind speed value is increased gradually with the increment of 1 m/s.
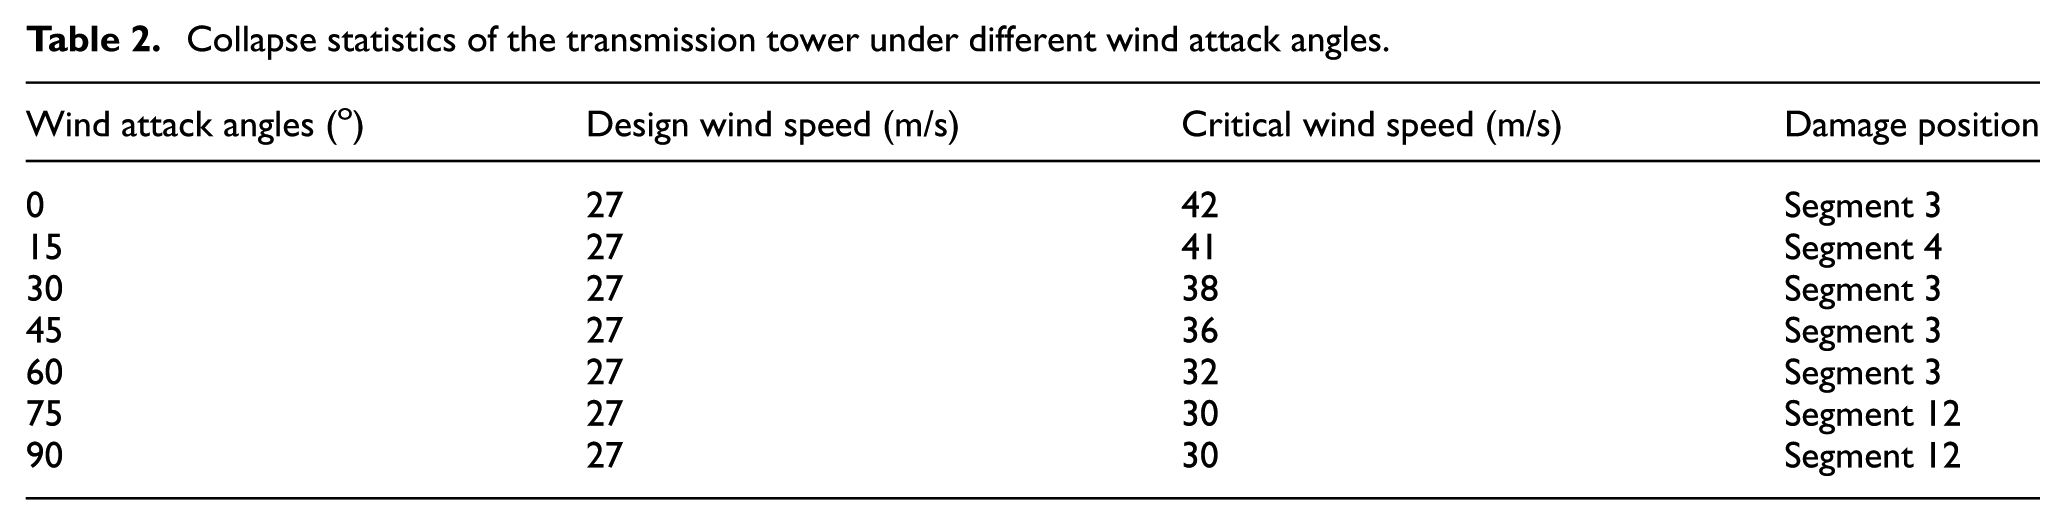
Table 2 shows the collapse statistics of the transmission tower under different wind attack angles. The wind speed corresponding to collapse is defined as the critical wind speed in this article. Figure 8 illustrates the critical wind speed corresponding to different wind attack angle. As shown in Table 2 and Figure 8, the critical wind speed decreases with the increase in the wind attack angle, which is larger than the design wind speed. It is obvious that the wind attack angle has a significant impact on the critical wind speed, and the most favorable and unfavorable wind attack angles are 0°and 90°, respectively. The primary reason is that the increase in the wind angle of attack can increase the area acted by wind and thus intensify the wind-induced response of the transmission tower–line system.
Collapse statistics of the transmission tower under different wind attack angles.
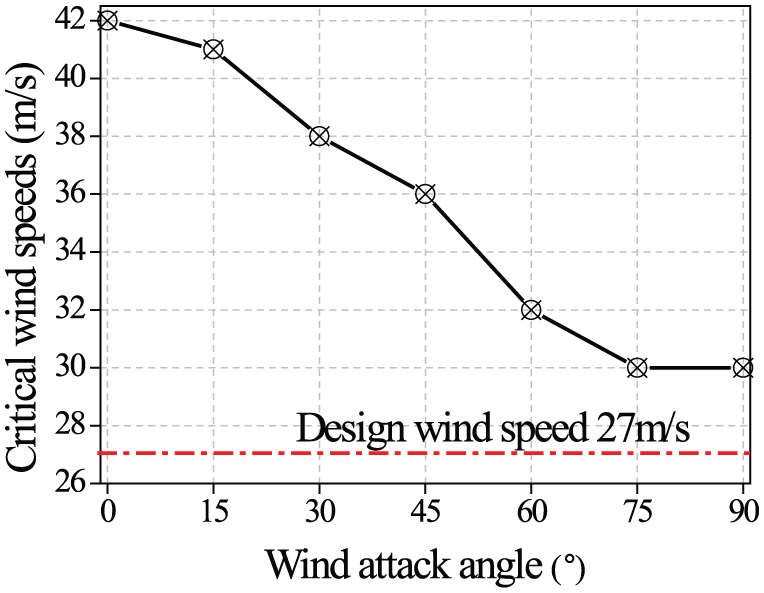
The relationship between critical wind speeds and wind attack angle.
Damage occurs on the transmission tower in the Segments 3, 12, and 4. In order to investigate the damage probability of different segments, the amplification factor
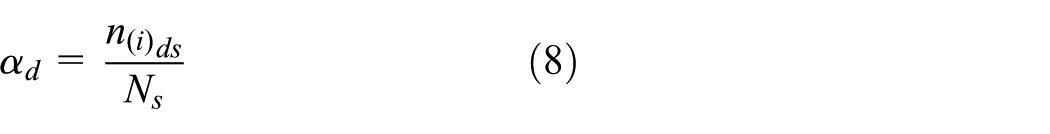
where i is the segment number,
Figure 9 shows the collapse probability of the transmission tower under different wind speeds. When the wind speed is 29 m/s, the collapse probability is zero; when the wind speed is 30 m/s, two cases collapse and the collapse probability is 28.6%; when the wind speed is 36 m/s, four cases collapse and the collapse probability is 57.1%; and when the wind speed is 42 m/s, all cases collapse and the collapse probability is 100%. Therefore, 30 m/s is the critical line for the collapse of the transmission tower. If the collapse probability is below the critical line, the structure is safe, that is to say the structure is in safety region; otherwise, the structure will collapse.
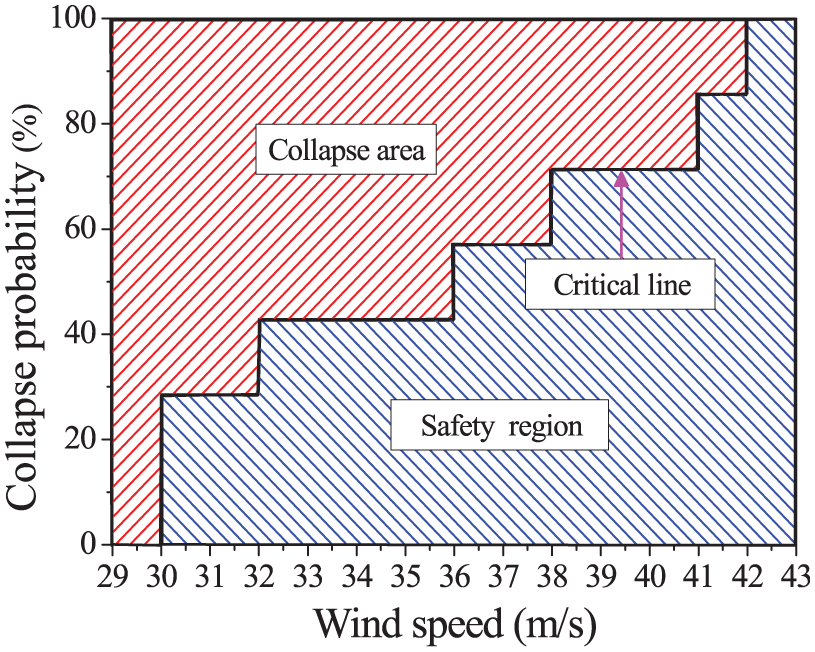
The collapse probability of the transmission tower under different wind speeds.
Figure 10 shows the wind rose diagram at the location of the long-span transmission tower–line system. The blue and red lines represent the summer and winter winds, respectively. Figure 10 illustrates that the summer and winter mainly concentrate northeast and southwest wind. The long-span transmission tower–line system is oriented in the north-south direction, but the direction of the highest wind frequency is approximately 45°. The wind speed of 36 m/s is the critical speed when the transmission tower is under a wind attack angle of 45°, and the collapse probability exceeds 50% at this wind speed for different wind attack angles. Therefore, the response of the transmission tower under the wind attack angle of 45° can be used as an important index for the collapse-resistant capability.
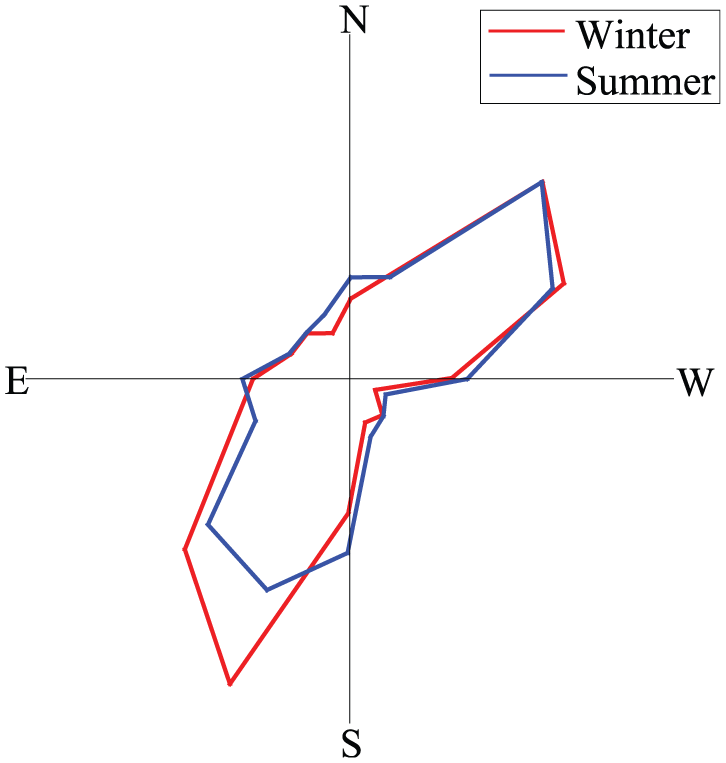
The wind rose diagram.
Collapse mechanism of the structure under a wind attack angle of 45°
As discussed in section “The collapse analysis of the structure under different wind attack angles,”, the 45° is the wind attack angle with the highest occurring frequency in practice. In this section, the dynamic incremental analyses are conducted to investigate the failure process and collapse mechanism of the system under different wind speeds.
Figure 11 shows the curves of the ISDR value of Tower 1 and Tower 2 along the height of the transmission tower. As can be seen from Figure 11, the maximum values of the longitudinal and transverse ISDR responses of Tower 1 are 0.00675 and 0.00132, respectively, whereas the maximum values of the longitudinal and transverse ISDR responses of Tower 2 are 0.00187 and 0.0013, respectively. The maximum values of the longitudinal and transverse ISDR responses of the transmission tower under the same wind speed are different. The maximum transverse ISDR values of Towers 1 and 2 are highly similar. The difference in the maximum longitudinal ISDR values between Tower 1 and Tower 2 is extremely large due to the asymmetry of the transmission tower–line system and the coupling effect between the transmission tower and line. The longitudinal ISDR values of Towers 1 and 2 are larger than the transverse values at the same wind speed, indicating that the longitudinal direction of the transmission tower–line system is more unfavorable than that of the transverse under a wind attack angle of 45°.
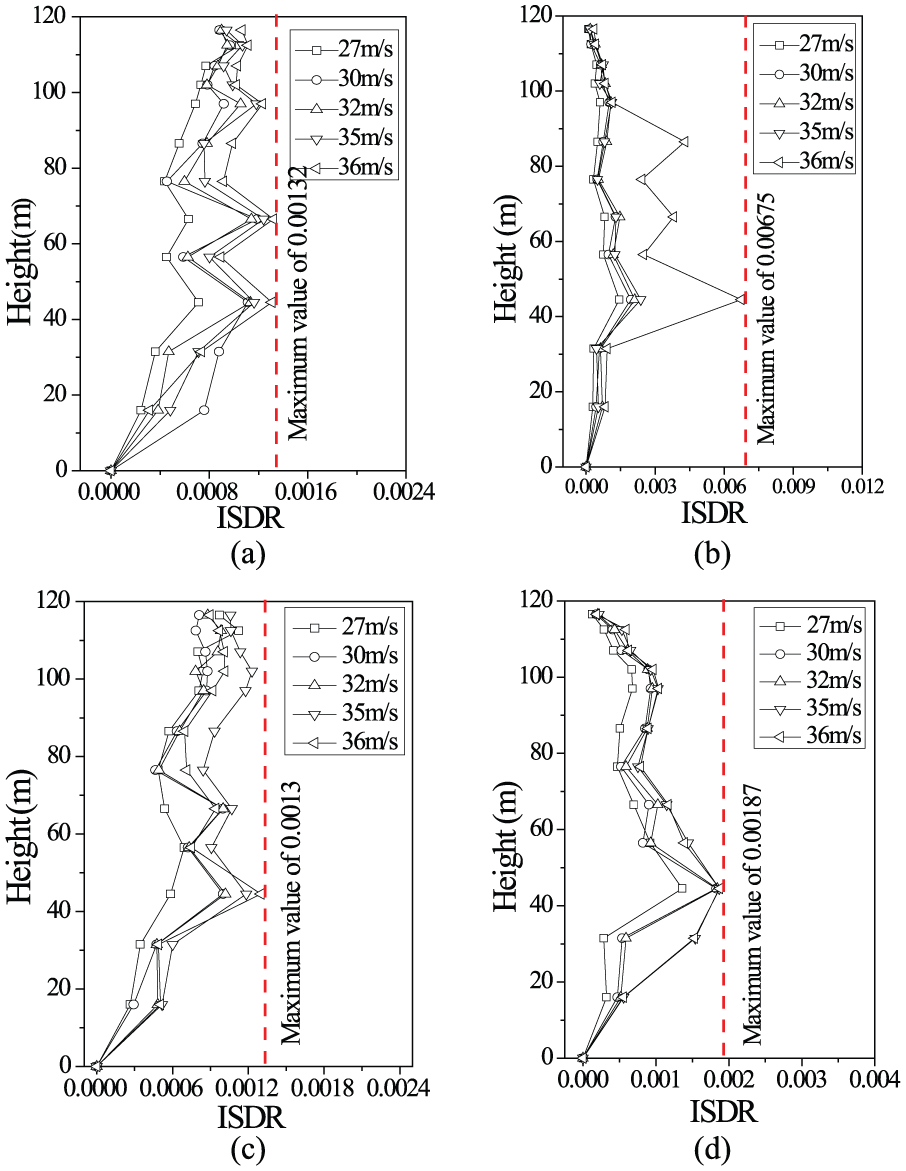
Distribution of ISDR value: (a) transverse direction of Tower 1, (b) longitudinal direction of Tower 1, (c) transverse direction of Tower 2, and (d) longitudinal direction of Tower 2.
As shown in Figure 11, the maximum values of the ISDR response of the transmission tower appear at a height of 45 m, which indicates that Segment 3 is weaker than the other segments. The longitudinal ISDR response at the height of 45 m changes suddenly at a wind speed of 36 m/s, which indicates that the members of the transmission tower are damaged. This result is consistent with the weak position of the transmission tower collapse in the previous section.
Figure 12 shows the collapse process of the long-span transmission tower at a wind speed of 36 m/s. The progression of member damages is shown, and the failed members are highlighted in red. At the initial stage, when t = 3.37 s (Figure 12(a)), the main member 321 in Segment 3 develops compression buckling and starts to lose its bearing capacity, which leads to the redistribution of the internal force of the transmission tower. Figure 13 shows the strain and force time histories of main member 321. When t = 3.47 s (Figure 12(b)), failure occurs at the diagonal member 340 connecting with main member 321 in Segment 3 (Figure 12b). When t = 3.54 s (Figure 12(c)), more members in Segments 3 and 5 begin to buckle and fail. Finally, the tower loses the horizontal and vertical load transmission path, leading to collapse. Based on the above collapse analysis, the structural failure sequence proceeds as follows: from the main member in Segment 3, to a diagonal member in Segment 3, and finally to a lot of members in Segments 3 and 5.
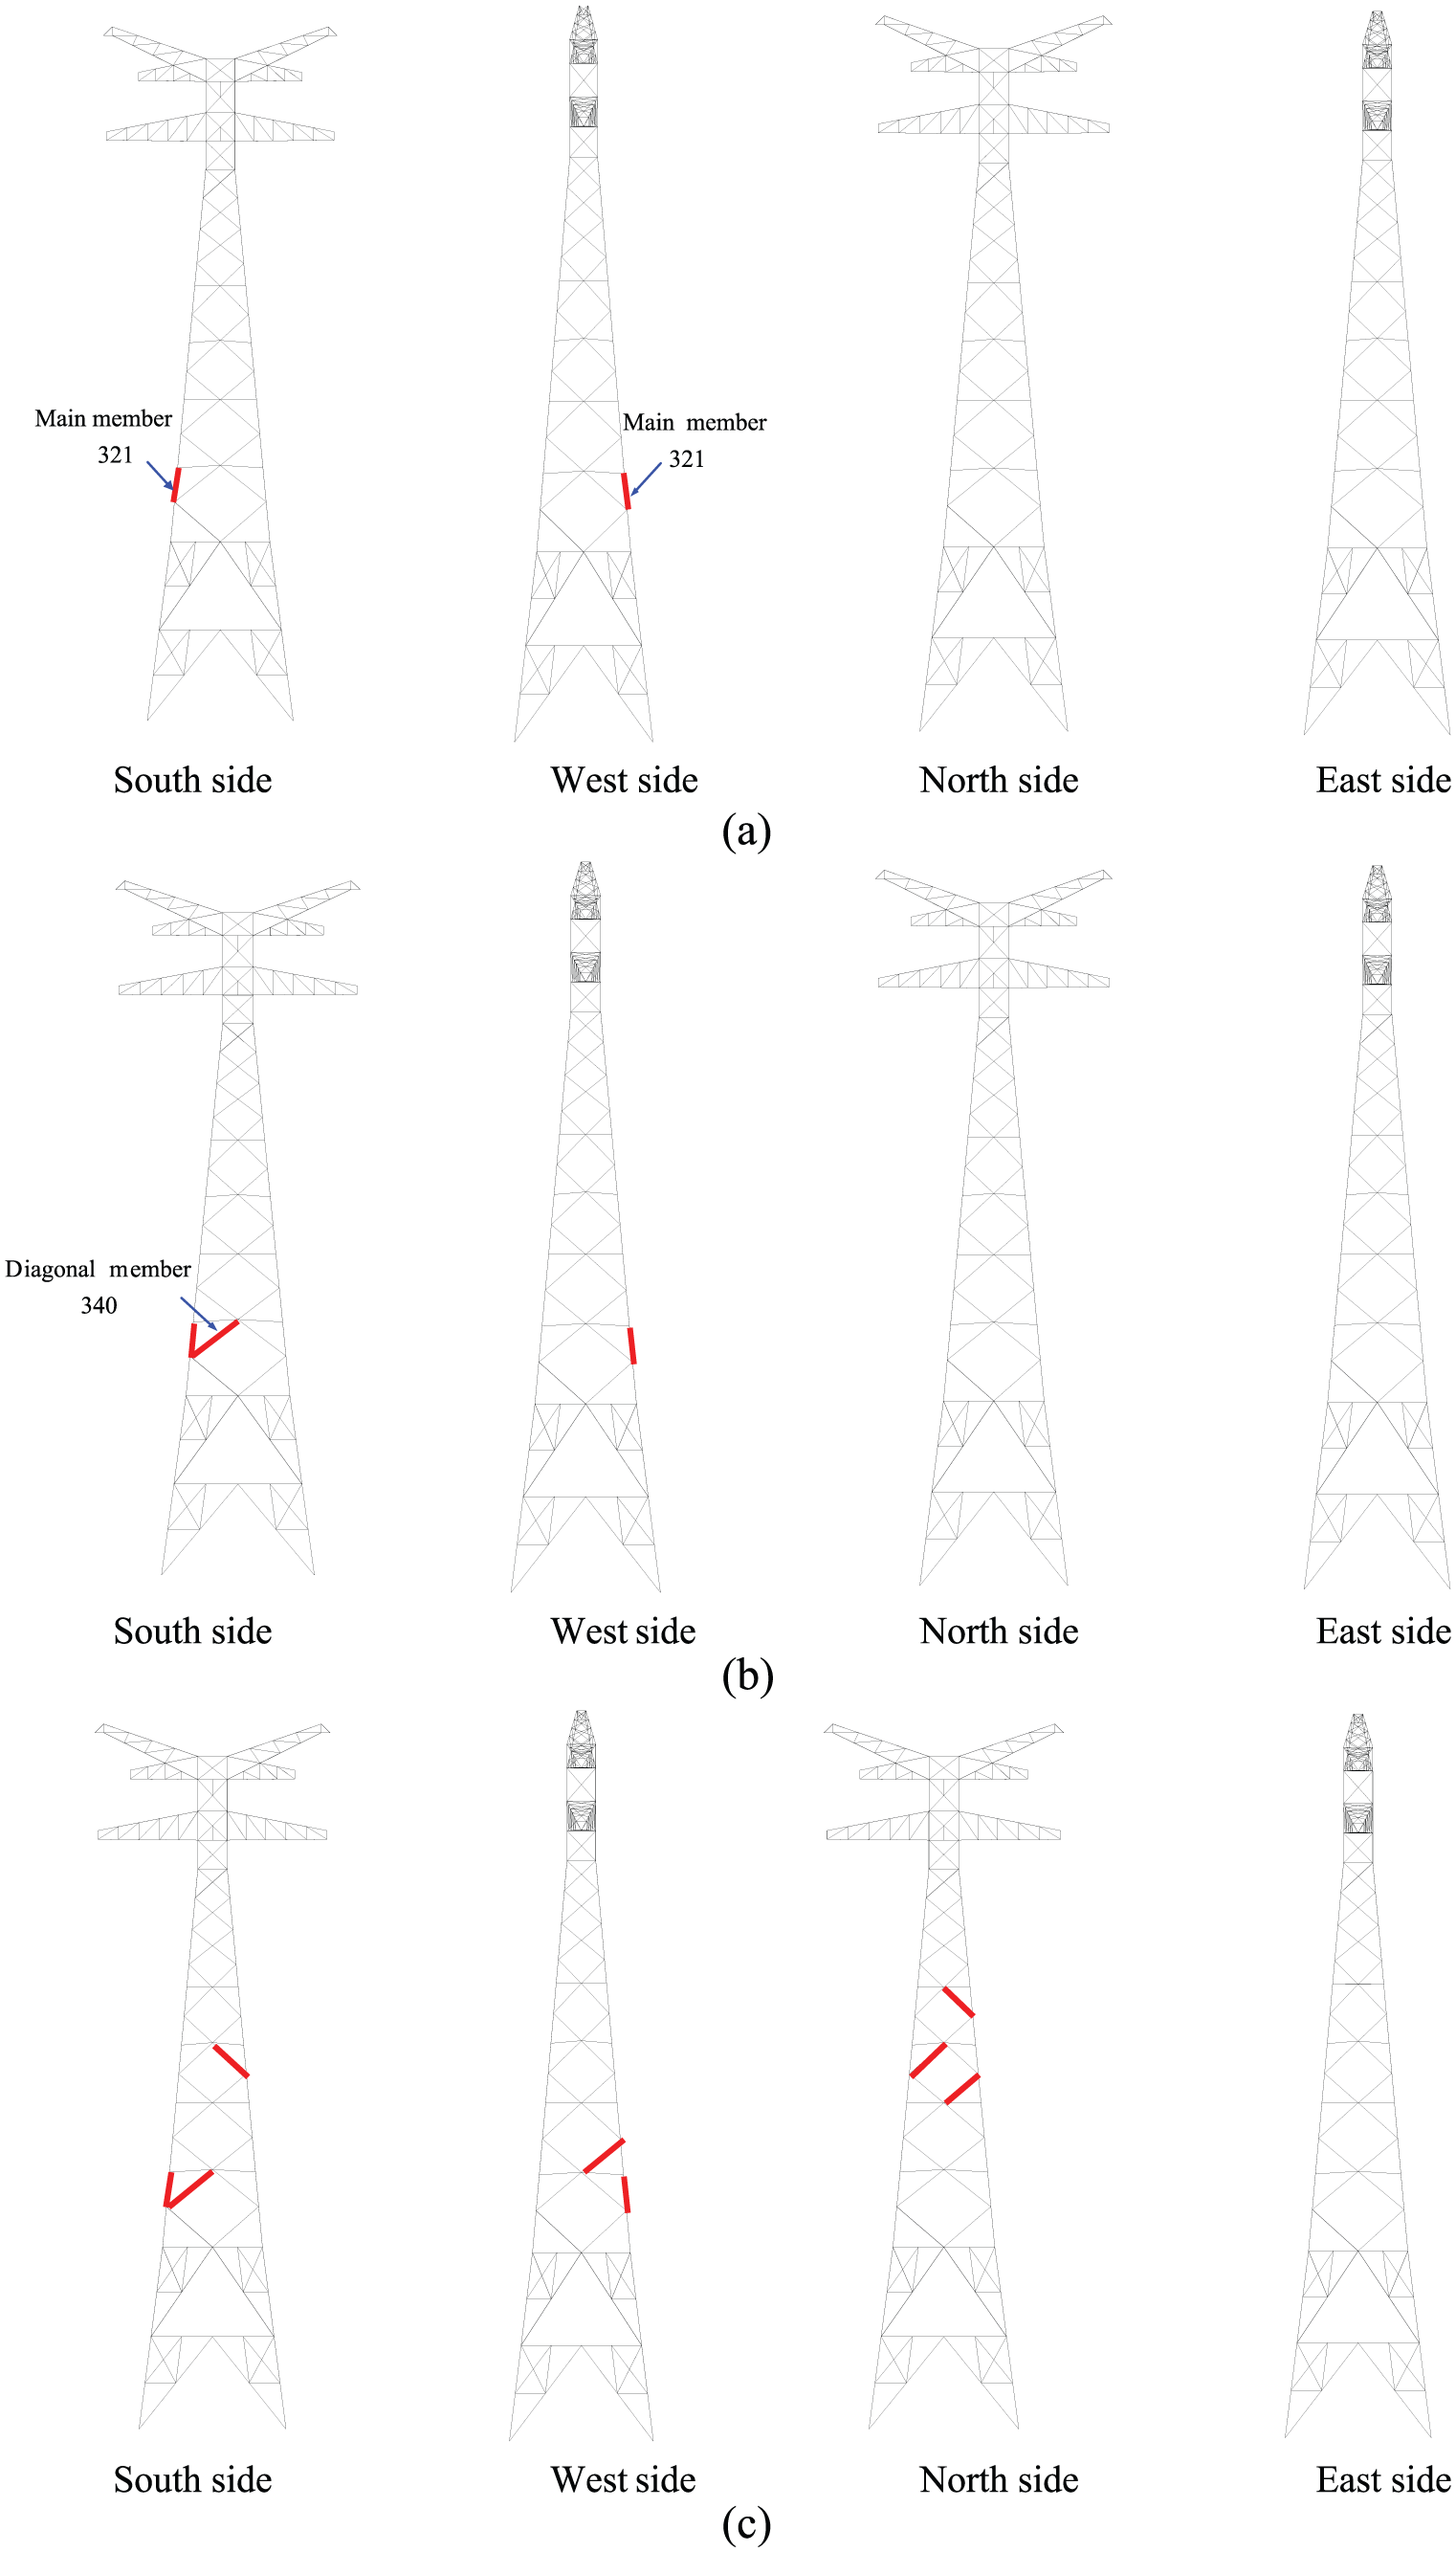
The collapse process of the long-span transmission tower: (a) damage distribution at t = 3.37 s, (b) damage distribution at t = 3.47 s, and (c) damage distribution at t = 3.54 s.
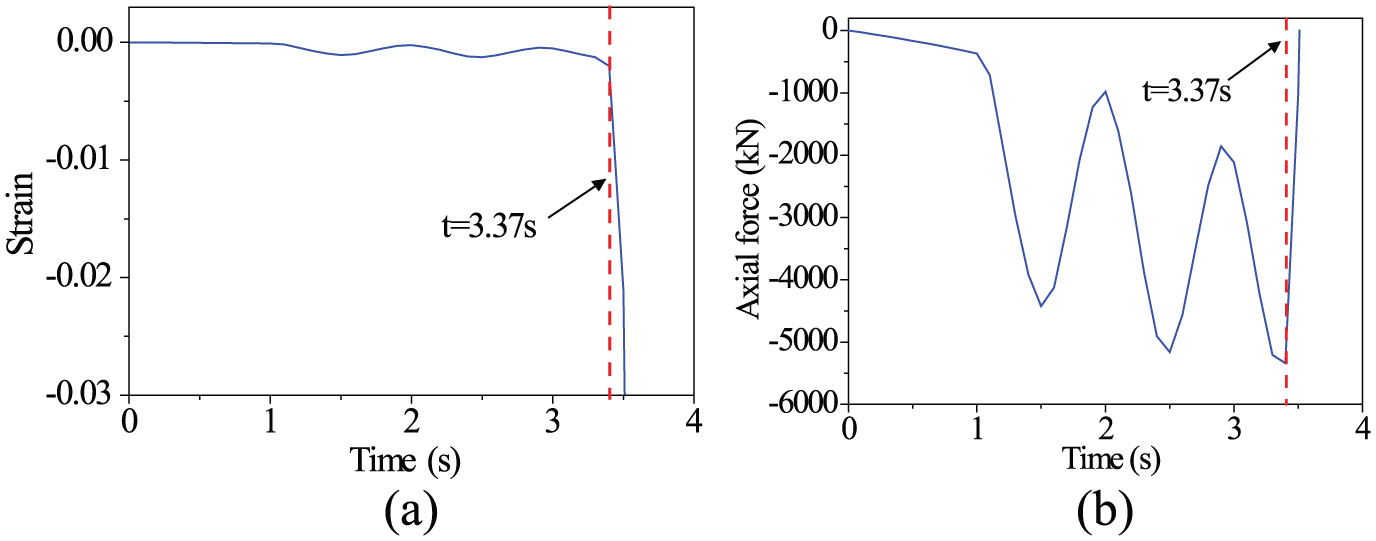
The curves of strain and force time histories of the main member 321: (a) strain–time history curve and (b) force–time history curve.
Figure 14 shows the bending and shear deformation distributions of the transmission tower at a wind speed of 36 m/s. The longitudinal deformation of the transmission tower changes suddenly in Segments 3 and 5, and the transverse deformation of the transmission tower changes dramatically in Segment 5, which is consistent with the position of the failure members. For the typical steel structure of a transmission tower, the failure of a main member is due to excessive bending deformation, but excessive shear deformation can result in the failure of a diagonal member. As shown in Figure 14, the bending deformation of the transmission tower in Segment 3 is significantly larger than that of the shear deformation, which leads to the failure of the main member. This result is consistent with the damage of main member 321 shown in Figure 12. Therefore, the reasons for the failure of transmission tower are determined to be bending deformation and shear deformation.
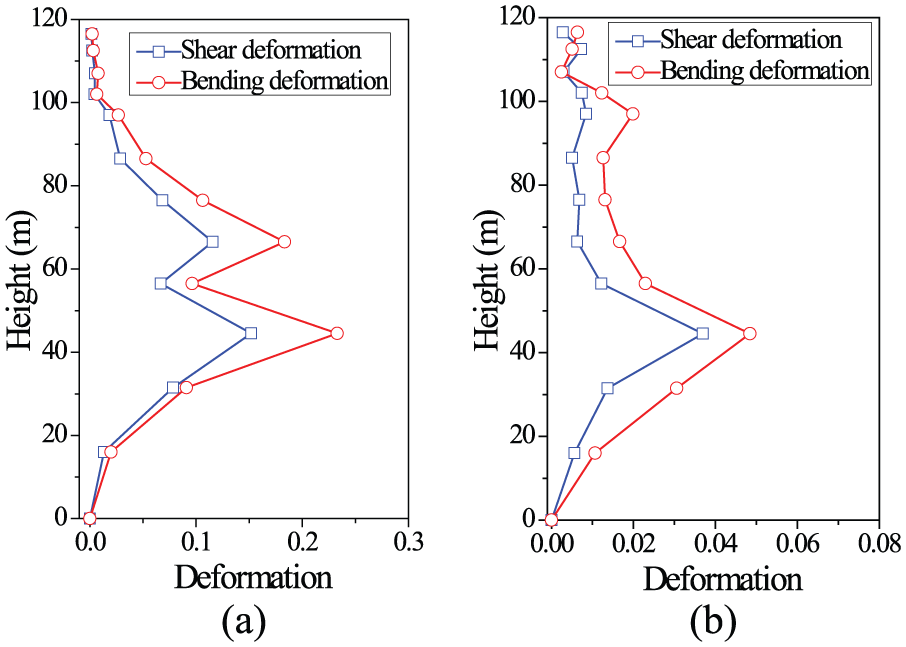
Deformation distribution of the transmission tower under the wind speed of 36 m/s: (a) longitudinal direction and (b) transverse direction.
Conclusion
The research focuses on the collapse simulation of a long-span transmission tower–line system under wind loading using an explicit integral method. The collapse analyses of the long-span transmission tower–line system under different wind attack angles are performed. The collapse mechanism of the long-span transmission tower–line system under a wind attack angle of 45° is investigated. Based on the above analysis results, the following conclusions are drawn.
The mechanical properties of the buckling instability of the member can be simulated by frame element which is based on the Marshall model. The collapse simulation method could evaluate the collapse-resistant capacity of the structure.
The wind attack angles have a significant influence on the critical wind speed of the transmission tower. The vulnerability of Segment 3 of the transmission towers is higher than that of the other segments, and the damage probability of Segment 3 of the transmission tower exceeds 50%.
The maximum values of the longitudinal and transverse ISDR responses of the transmission tower under the same wind speed are different. Segment 3 is weaker than the other segments owing to the mutation in the longitudinal ISDR response at the height of 45 m.
The instability of the main member causes collapse of the transmission tower according to the collapse mechanism of the transmission tower under a wind attack angle of 45°. The reason for the failure reason of the transmission tower can be obtained based on the values of bending deformation and shear deformation.
Footnotes
Acknowledgements
The support for this research is greatly appreciated. Finally yet importantly, the authors wish to thank the anonymous reviewers for their careful evaluations and insightful comments that helped improve the paper.
Declaration of Conflicting Interests
The author(s) declared no potential conflicts of interest with respect to the research, authorship, and/or publication of this article.
Funding
The author(s) disclosed receipt of the following financial support for the research, authorship, and/or publication of this article: This study was financially supported by the PhD Programs Foundation of Ministry of Education of China project under grant no. 20120131120036, the Shandong Provincial Natural Science Foundation of China under grant no. ZR2012EEQ005, and Young Scholars Program of Shandong University.