
Abstract
The temperature differences in bridge structures have been one primary concern for bridge engineers and researchers. In the traditional view, the temperature differences between steel truss members are treated as uniform because of the good heat transfer characteristic of steel material and the shading effect of deck coverage. However, for some steel truss bridges, some truss members are directly exposed to solar radiation, while some other truss members are totally shaded by steel decks, which may cause obvious temperature differences between them, so it is reasonable to doubt the correctness of uniform temperature existing between steel truss members. In this research, the temperature differences between steel truss members in two long-span truss bridges are analyzed using long-term temperature field data, and after analysis, the temperature differences which contain obvious positive or negative values are made clear. Furthermore, the evaluation method of temperature differences in bridge service life for thermal action design is put forward together with the determination method of probability density function, and the evaluated temperature differences are further obtained after probability statistics analysis. Finally, the evaluated temperature differences are classified by sun radiation and steel deck coverage, and then compared with the specified values in the three specifications. The research results can provide important reference for current specifications and structural design, especially for steel truss bridges.
Keywords
Introduction
The various environmental influence factors (such as solar radiation, wind speed, humidity, and air temperature) can result in complex temperature fields in bridge structures (Liu et al., 2016; Song et al., 2012; Wang et al., 2018; Webb et al., 2015; Zhou et al., 2016). Furthermore, complex temperature fields can result in a series of bridge damages such as cracking and fatigue damage (Liu et al., 2014; Xia et al., 2013). Moreover, in some cases, the continuous daily and seasonal changes of temperature field have even more significant impact on structural response than the other loads (Wang et al., 2015). Therefore, temperature field has been a major concern for bridge engineers, which is an important influence factor for bridge load design.
Many bridge design codes have provided the uniform temperature component and temperature gradient component of temperature field in bridge girders with typical cross section for thermal action design (American Association of State Highway and Transportation Officials (AASHTO), 2017; EN 1991-1-5, 2003; JTG D60, 2015; TB 10002, 2017). Furthermore, with the development of structural health monitoring technology, it is feasible to install structural health monitoring systems on bridge structures to investigate temperature gradients of bridge girders with complex shapes and sizes which are not specified in current bridge design codes, such as concrete girders with unconventional cross sections (Song et al., 2012; Wang et al., 2017) and flat steel box girders (Ding et al., 2012, 2013a; Wang et al., 2014, 2015, 2016). For example, Song et al. (2012) investigated the characteristics of temperature gradients in a concrete box girder with unconventional cross section under solar radiation; Lee et al. (2012) analyzed the effect of vertical and transversal temperature gradients on one precast and prestressed BT-1600 concrete bridge girder. Besides, our previous studies have investigated the characteristics of transversal temperature gradients in the flat steel box girders of many long-span bridges, such as the Sutong cable-stayed bridge (Wang et al., 2014), the Zhujiang Huangpu suspension bridge (Ding et al., 2012), and the Runyang Yangtze bridge (Ding et al., 2013b), which have provided important reference for thermal action design.
However, current studies at home and abroad have not paid much attention to the temperature differences between truss members for long-span steel truss bridges. Because in the traditional view, the temperature differences between truss members are treated as uniform because of the good heat transfer characteristic of steel material and the shading effect of deck coverage. Similarly, the AASHTO and China specifications have not provided the specified values for thermal action design regarding the temperature differences between truss members (AASHTO, 2017; JTG D60, 2015; TB 10002, 2017). Only the European specification has specified that the temperature difference between truss members is 15°C for thermal action design (EN 1991-1-5, 2003), but it does not make clear which truss member contains higher temperature than the other one. For some steel truss bridges, it is possible that some truss members are directly exposed to solar radiation, while some other truss members are totally shaded by steel decks, which may cause obvious temperature differences between truss members. It is reasonable to doubt the correctness of uniform temperature existing between steel truss members.
Therefore, this research selects two long-span steel truss bridges as research objects, and some thermocouples are installed on the key truss members of these two bridges to obtain long-term temperature field data for analysis. First, temperature differences between steel truss members in two long-span truss bridges are investigated; furthermore, the temperature differences which have big positive or negative values are further evaluated for thermal action design through probability statistics analysis; finally, the evaluated temperature differences are compared with the specified values in the three specifications. The research results can provide important reference for current specifications and structural design, especially for steel truss bridges.
Description of bridge health monitoring
In order to verify whether obvious temperature differences exist between steel truss members, two long-span bridges containing steel truss elements (i.e. the Dashengguan Yangtze River Bridge and the Tongling Yangtze River Bridge) are selected for this research, as shown in Figure 1. Thermocouples are installed on the key truss members to obtain temperature differences for analysis.
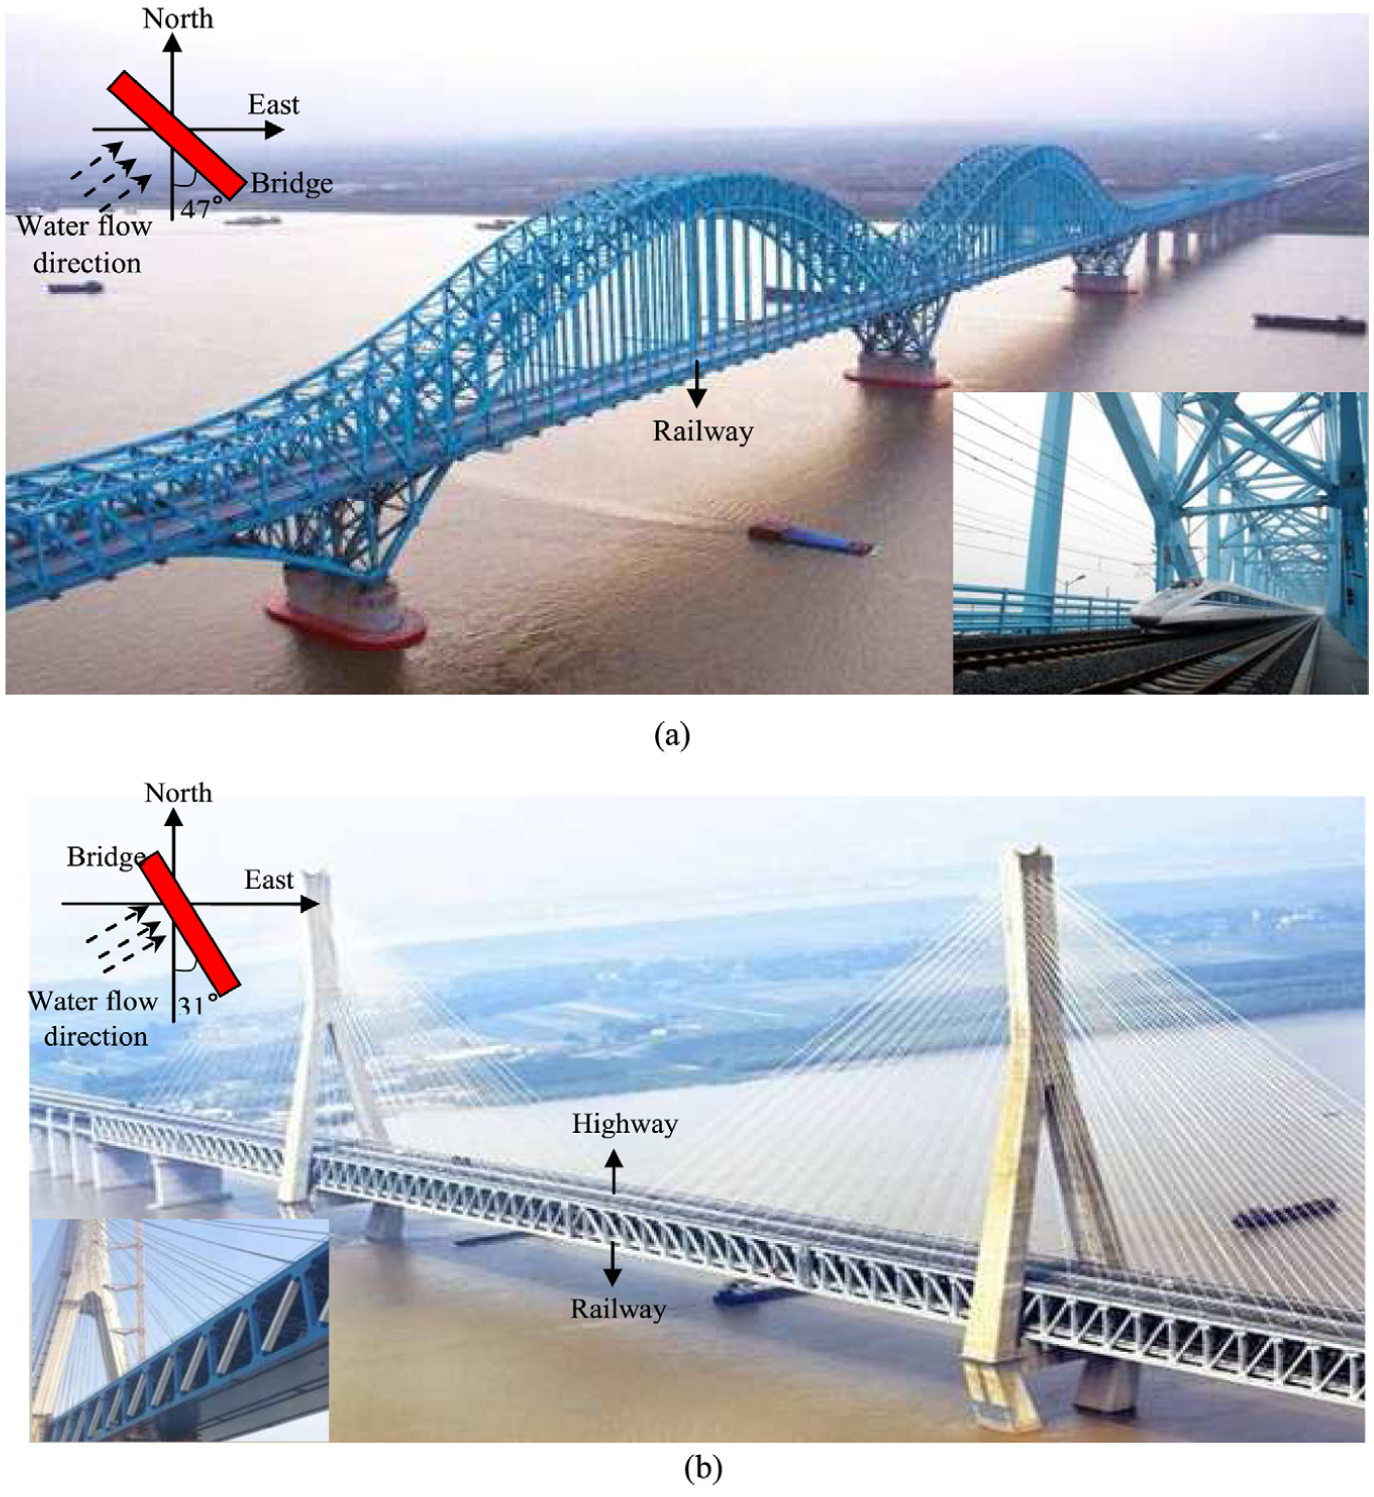
Two types of long-span steel truss bridges: (a) the Dashengguan Yangtze River Bridge and (b) the Tongling Yangtze River Bridge.
The Dashengguan Yangtze River Bridge
The long-span Dashengguan Yangtze River Bridge is designed as the river-crossing channel for the Beijing–Shanghai high-speed railway and the Nanjing bidirectional subway. The main girder is a six-span continuous steel truss arch girder, as shown in Figure 2(a). According to the profiles 1-1 and 2-2 as shown in Figure 2(b) and (c), the continuous steel truss arch girder is composed of steel truss arch and steel deck. In detail, the steel truss arch is composed of chord members (i.e. top chord member, bottom chord member, and bridge deck chord member), diagonal web members, vertical web members, and horizontal and vertical bracings; the steel deck is composed of top plate and transverse diaphragm. A total number of seven groups of spherical steel bearings (i.e. bearings 1–7) are employed to support the steel truss arch girder, where the bearing 4 is totally fixed in all the three translational directions and the other bearings can allow longitudinal thermal expansion movement in steel truss arch girder. In order to investigate the temperature differences between steel truss members, 12 thermocouples are installed on the chord members M1–M6 in the middle and side trusses as shown in Figure 2(b) to (f), which are denoted by W1–W12. M1, M2, M4, and M5 are totally exposed to solar radiation, while M3 and M6 are totally shaded by steel deck at daytime. The sampling frequency of thermocouple is set to 1 Hz. Unfortunately, the thermocouples W9 and W10 are damaged during data acquisition, so only the temperature data from W1–W8 and W11–W12 are obtained for analysis.

Installation locations of thermocouples (unit: mm): (a) longitudinal view, (b) 1-1 profile, (c) 2-2 profile, (d) 3-3 profile, (e) 4-4 profile, and (f) 5-5 profile.
The Tongling Yangtze River Bridge
The Tongling Yangtze River Bridge is a five-span cable-stayed continuous truss bridge, as depicted in Figure 3(a). It is constructed for Hefei–Fuzhou railway and Tongling–Chaohu highway across the Yangtze River. The 1-1 profile of this bridge is shown in Figure 3(b). One obvious structural feature of this bridge is that the two steel decks are supported by six steel truss members (i.e. the top steel deck supported by M7–M9 for highway, and the bottom steel deck supported by M10–M12 for railway). M8 and M11 are totally shaded by the top steel deck and upper-layer asphalt concrete pavement; M7, M9, M10, and M12 can be partially exposed to solar radiation for a period of daytime. In order to obtain the temperature differences between steel truss members, 12 thermocouples are installed on M7–M12, denoted by W13–W24, respectively. The sampling frequency of the thermocouple is set to 1 Hz.
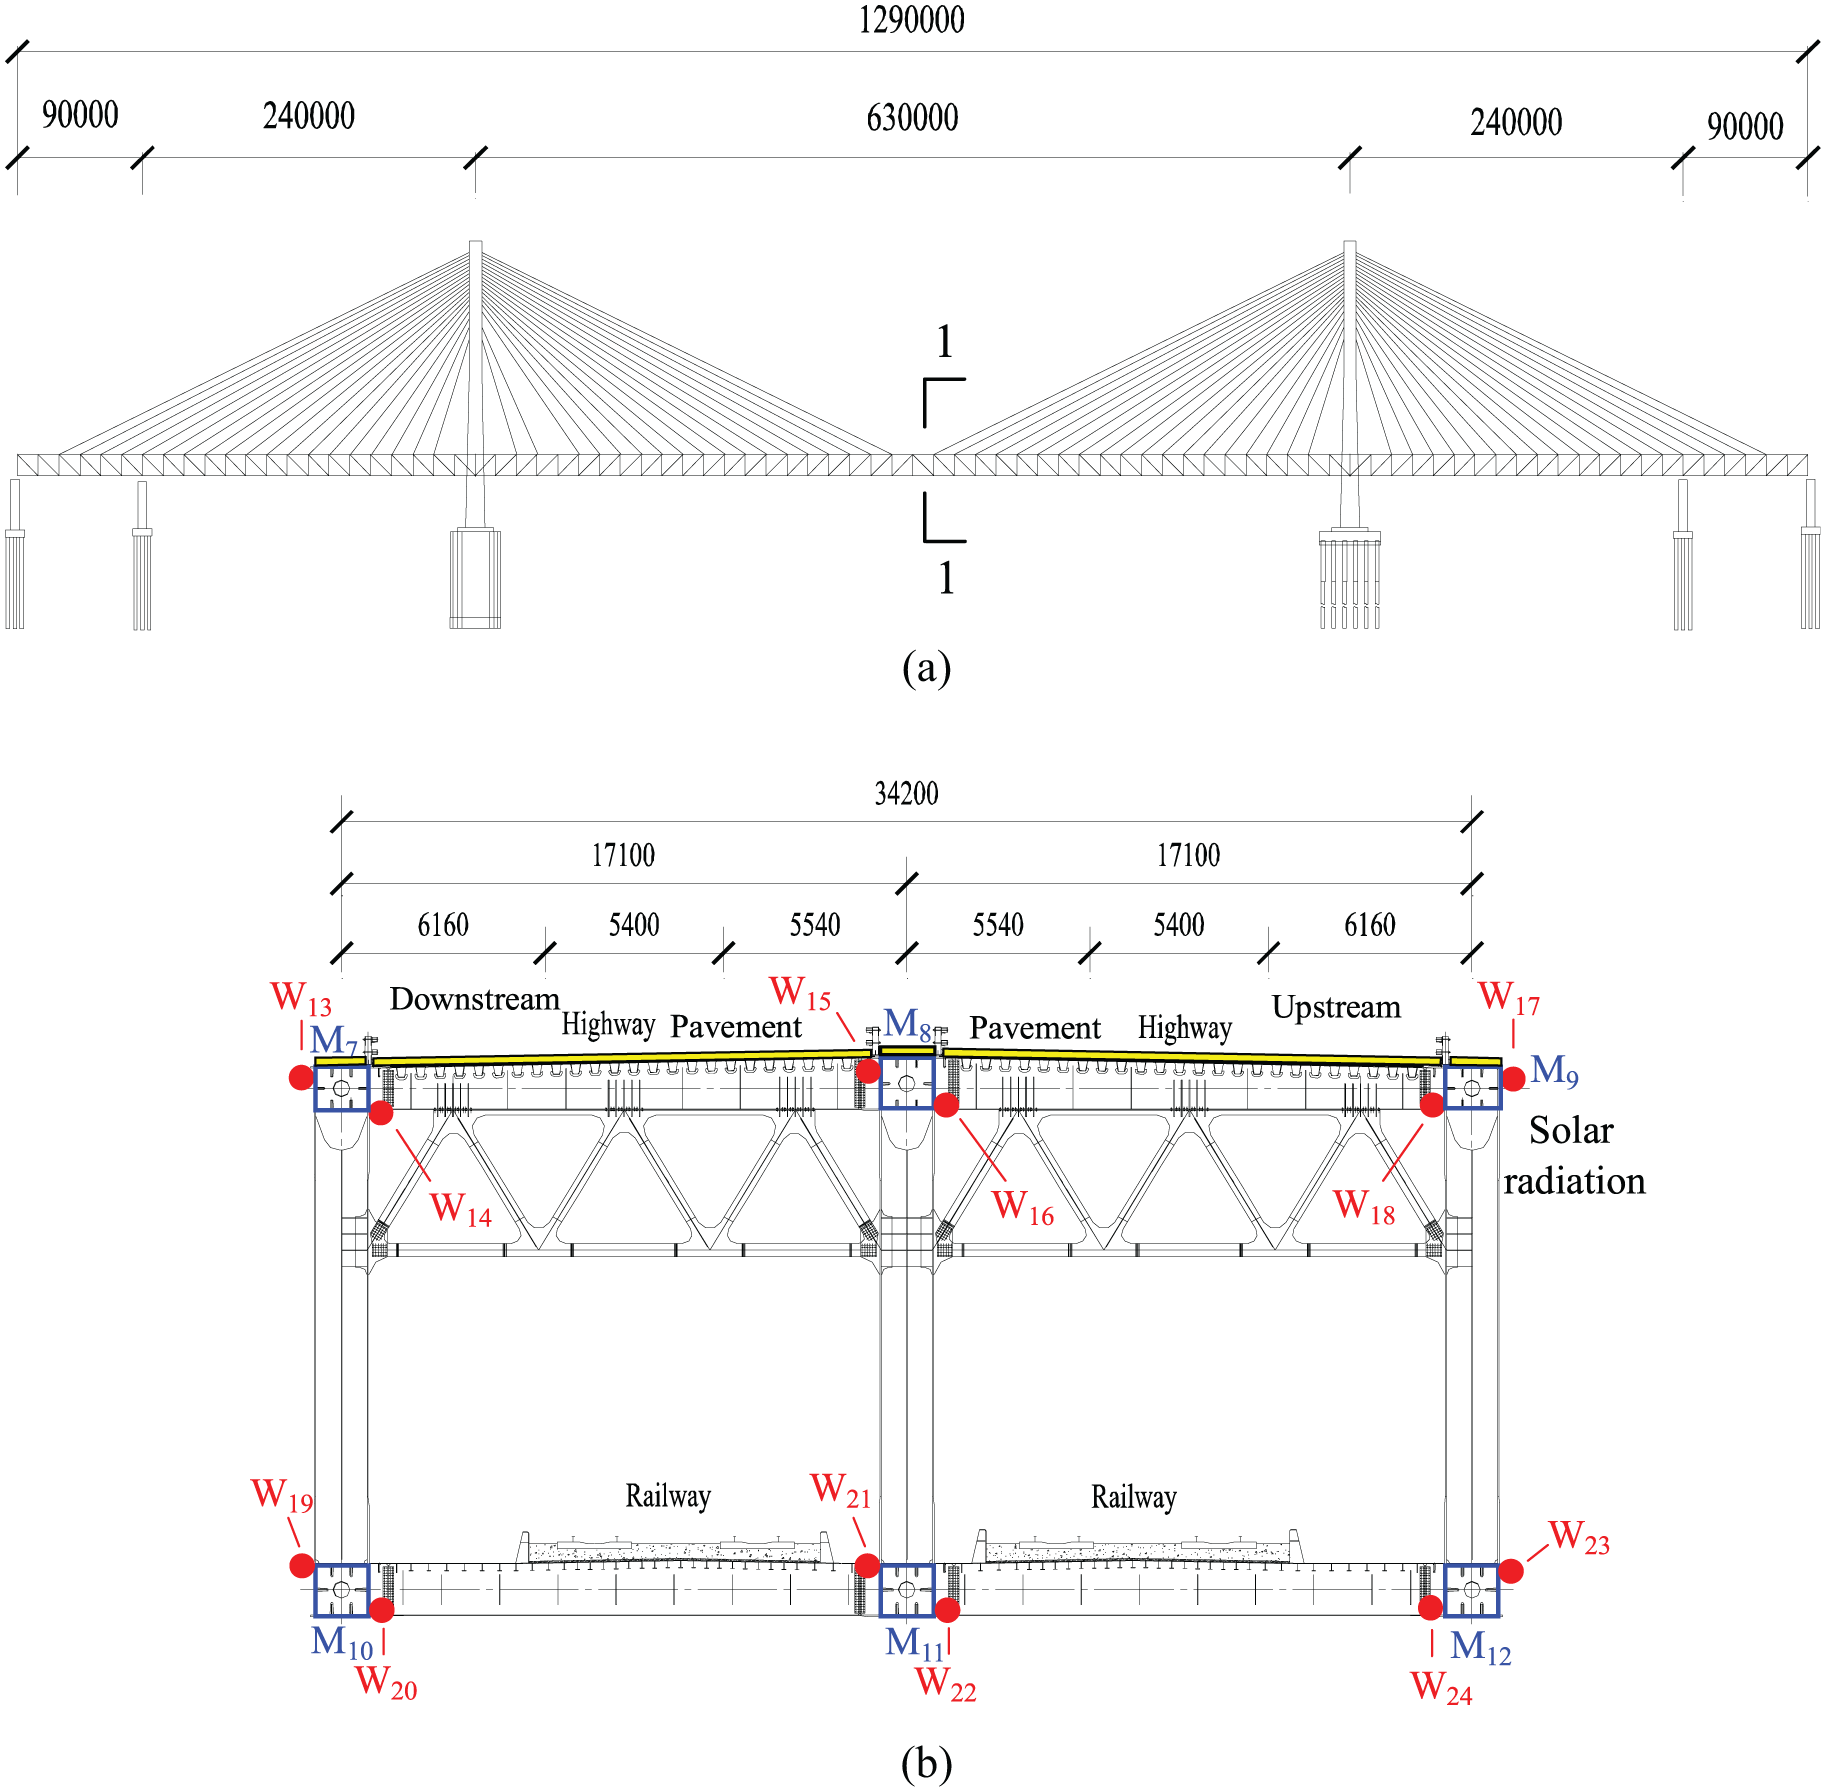
Installation locations of thermocouples (unit: mm): (a) longitudinal view and (b) 1-1 profile.
Measured temperature difference
There are two thermocouples in each truss member, so the average temperature of these two thermocouples is used to represent the temperature level of this truss member, which is denoted by Ti,a for the ith truss member M i . Moreover, the temperature difference between different truss members M i and M j is denoted by Ti,j,a with Ti,j,a = Ti,a−Tj,a. There are two kinds of temperature differences existing between truss members, namely, transversal temperature difference (TTD) and vertical temperature difference (VTD), which are analyzed here. Positive VTD means that the top member has a higher temperature than the lower member, and positive TTD means that the outside of the bridge has a higher temperature than the center of the bridge.
The Dashengguan Yangtze River Bridge
The TTDs (i.e. T1,4,a and T3,6,a) from March to October in 2017 are shown in Figure 4(a) and (b), respectively. It can be seen that both the positive and the negative values are small, indicating that the temperature field between M1 and M4, and M3 and M6 can be treated as uniform (i.e. T1,a = T4,a and T3,a = T6,a).

TTDs: (a) T1,4,a and (b) T3,6,a.
Moreover, the VTDs (i.e. T1,2,a and T2,3,a) from March to October in 2017 are shown in Figure 5(a) and (b), respectively. It can be seen that both the positive and the negative values for T1,2,a are small, indicating that the temperature field between M1 and M2 can be treated as uniform (i.e. T1,a = T2,a). However, the positive values for T2,3,a are obviously big compared with the negative values, and the maximum positive value can reach 10.4°C, indicating that positive VTD is the dominant temperature difference between M2 and M3 (i.e. T2,a > T3,a).
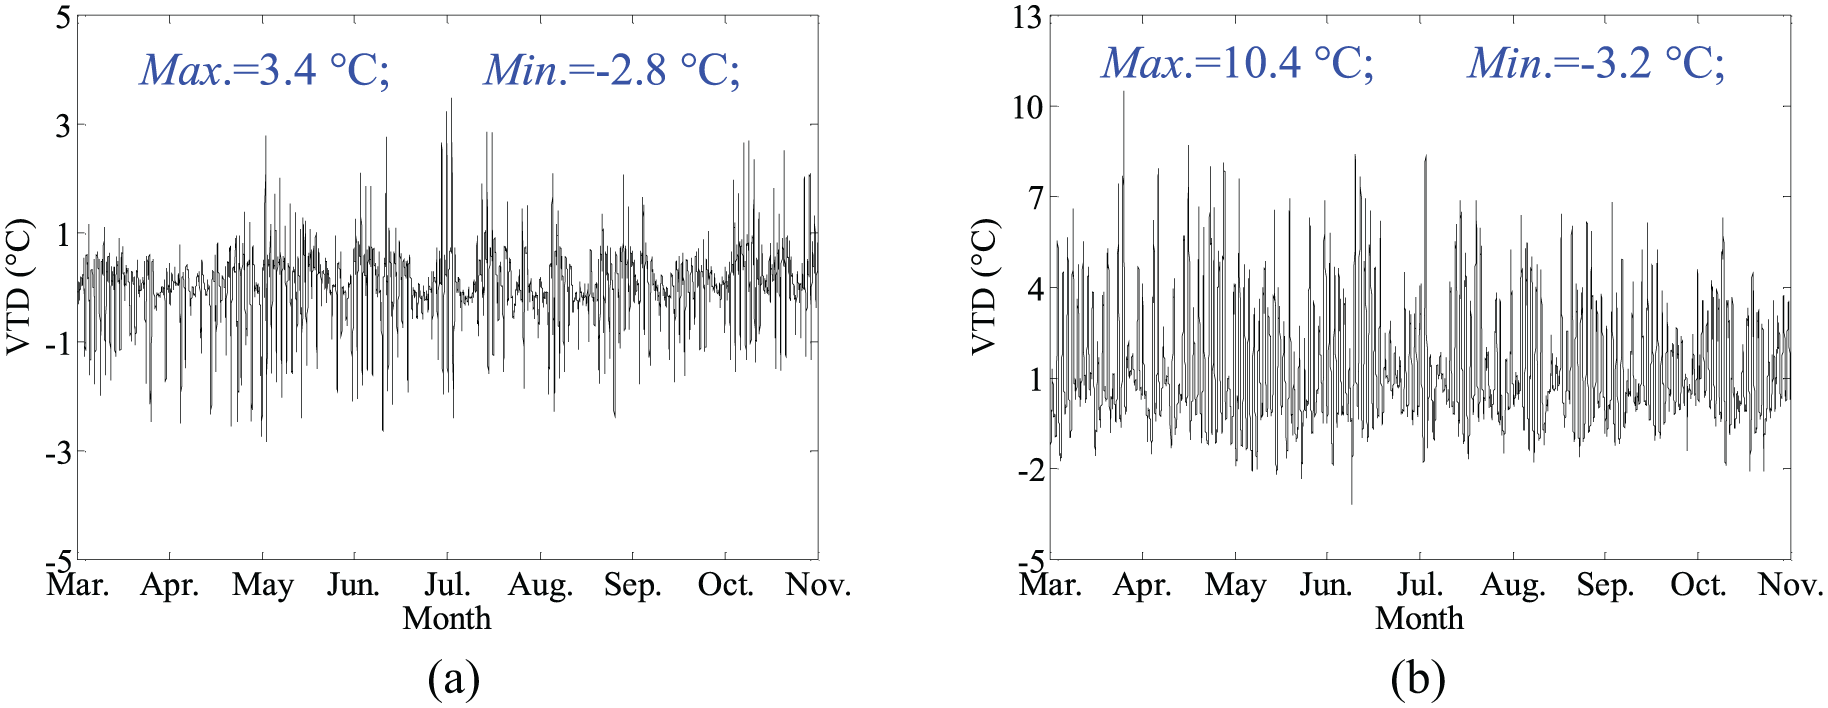
VTDs: (a) T1,2,a and (b) T2,3,a.
According to the orientation of bridge with relation to the sun, both the upstream and the downstream of the Dashengguan Yangtze River Bridge is exposed to sun radiation, as shown in Figure 6. For T2,3,a, M2 is directly exposed to solar radiation, while M3 is totally shaded by steel decks without solar radiation at daytime, which is the reason for big positive temperature difference existing between M2 and M3. For T1,4,a and T1,2,a, all of M1, M2, and M4 are directly exposed to solar radiation at daytime, so the radiation intensities they receive do not make big difference, which is the reason for small temperature differences for T1,4,a and T1,2,a. For T3,6,a, both M3 and M6 are totally shaded by steel decks without solar radiation, so the temperature difference between M3 and M6 is also small.
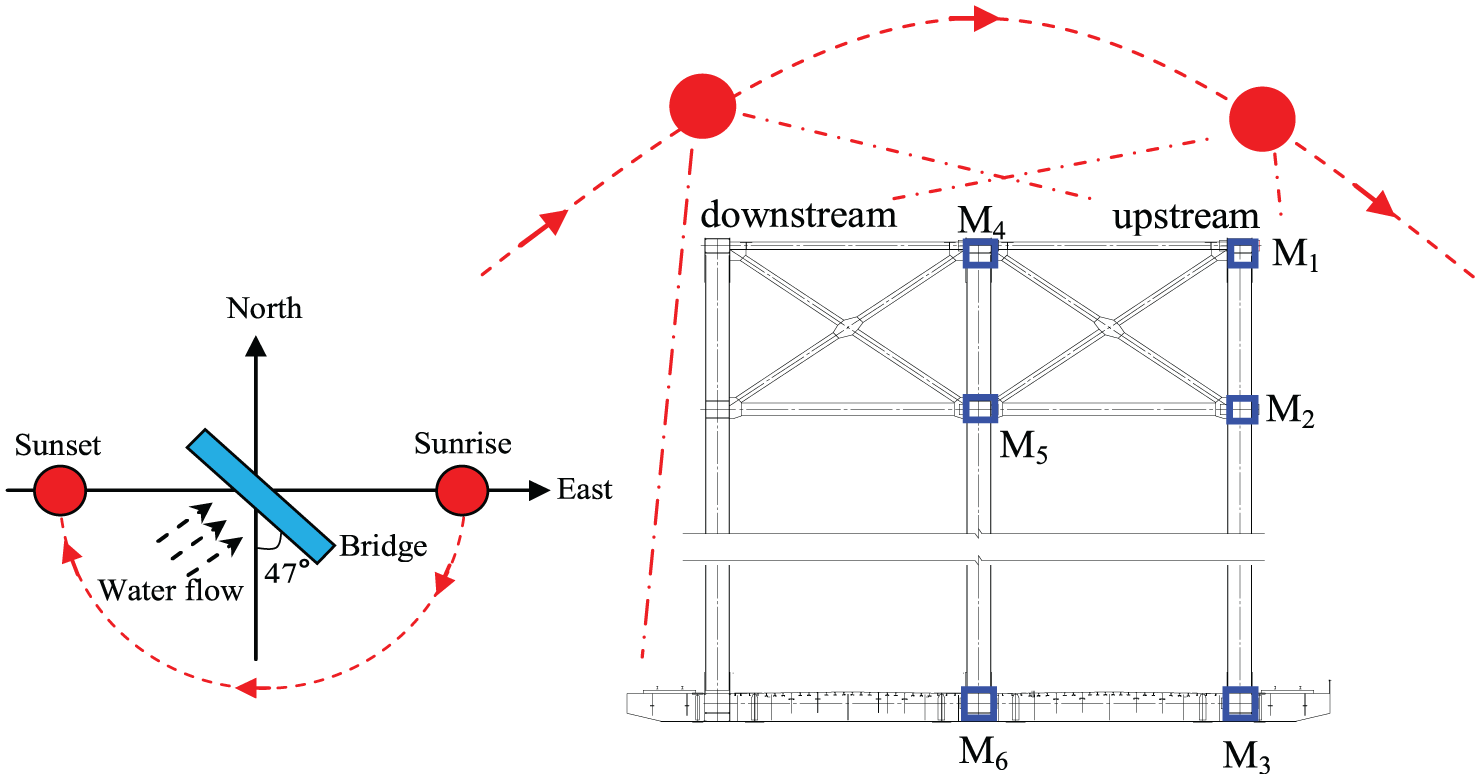
Illustration of orientation of bridge with relation to the sun.
The Tongling Yangtze River Bridge
For the Tongling Yangtze River Bridge, the outside is exposed to solar radiation, while the center is shaded by bridge deck at daytime, so in order to study whether the temperature from outside is obviously higher than the one from center at daytime, the TTDs (i.e. T7,8,a, T9,8,a, T10,11,a, and T12,11,a) from March to October in 2017 are shown in Figure 7, respectively. It can be seen that the positive TTDs are generally bigger than the negative ones regarding the changing amplitude, indicating that the positive temperature differences (i.e. the temperature from the outside of the bridge is higher than the one from the center of the bridge) are the dominant temperature differences for TTDs (i.e.T7, a > T8, a < T9, a, T10,a > T11,a < T12,a).
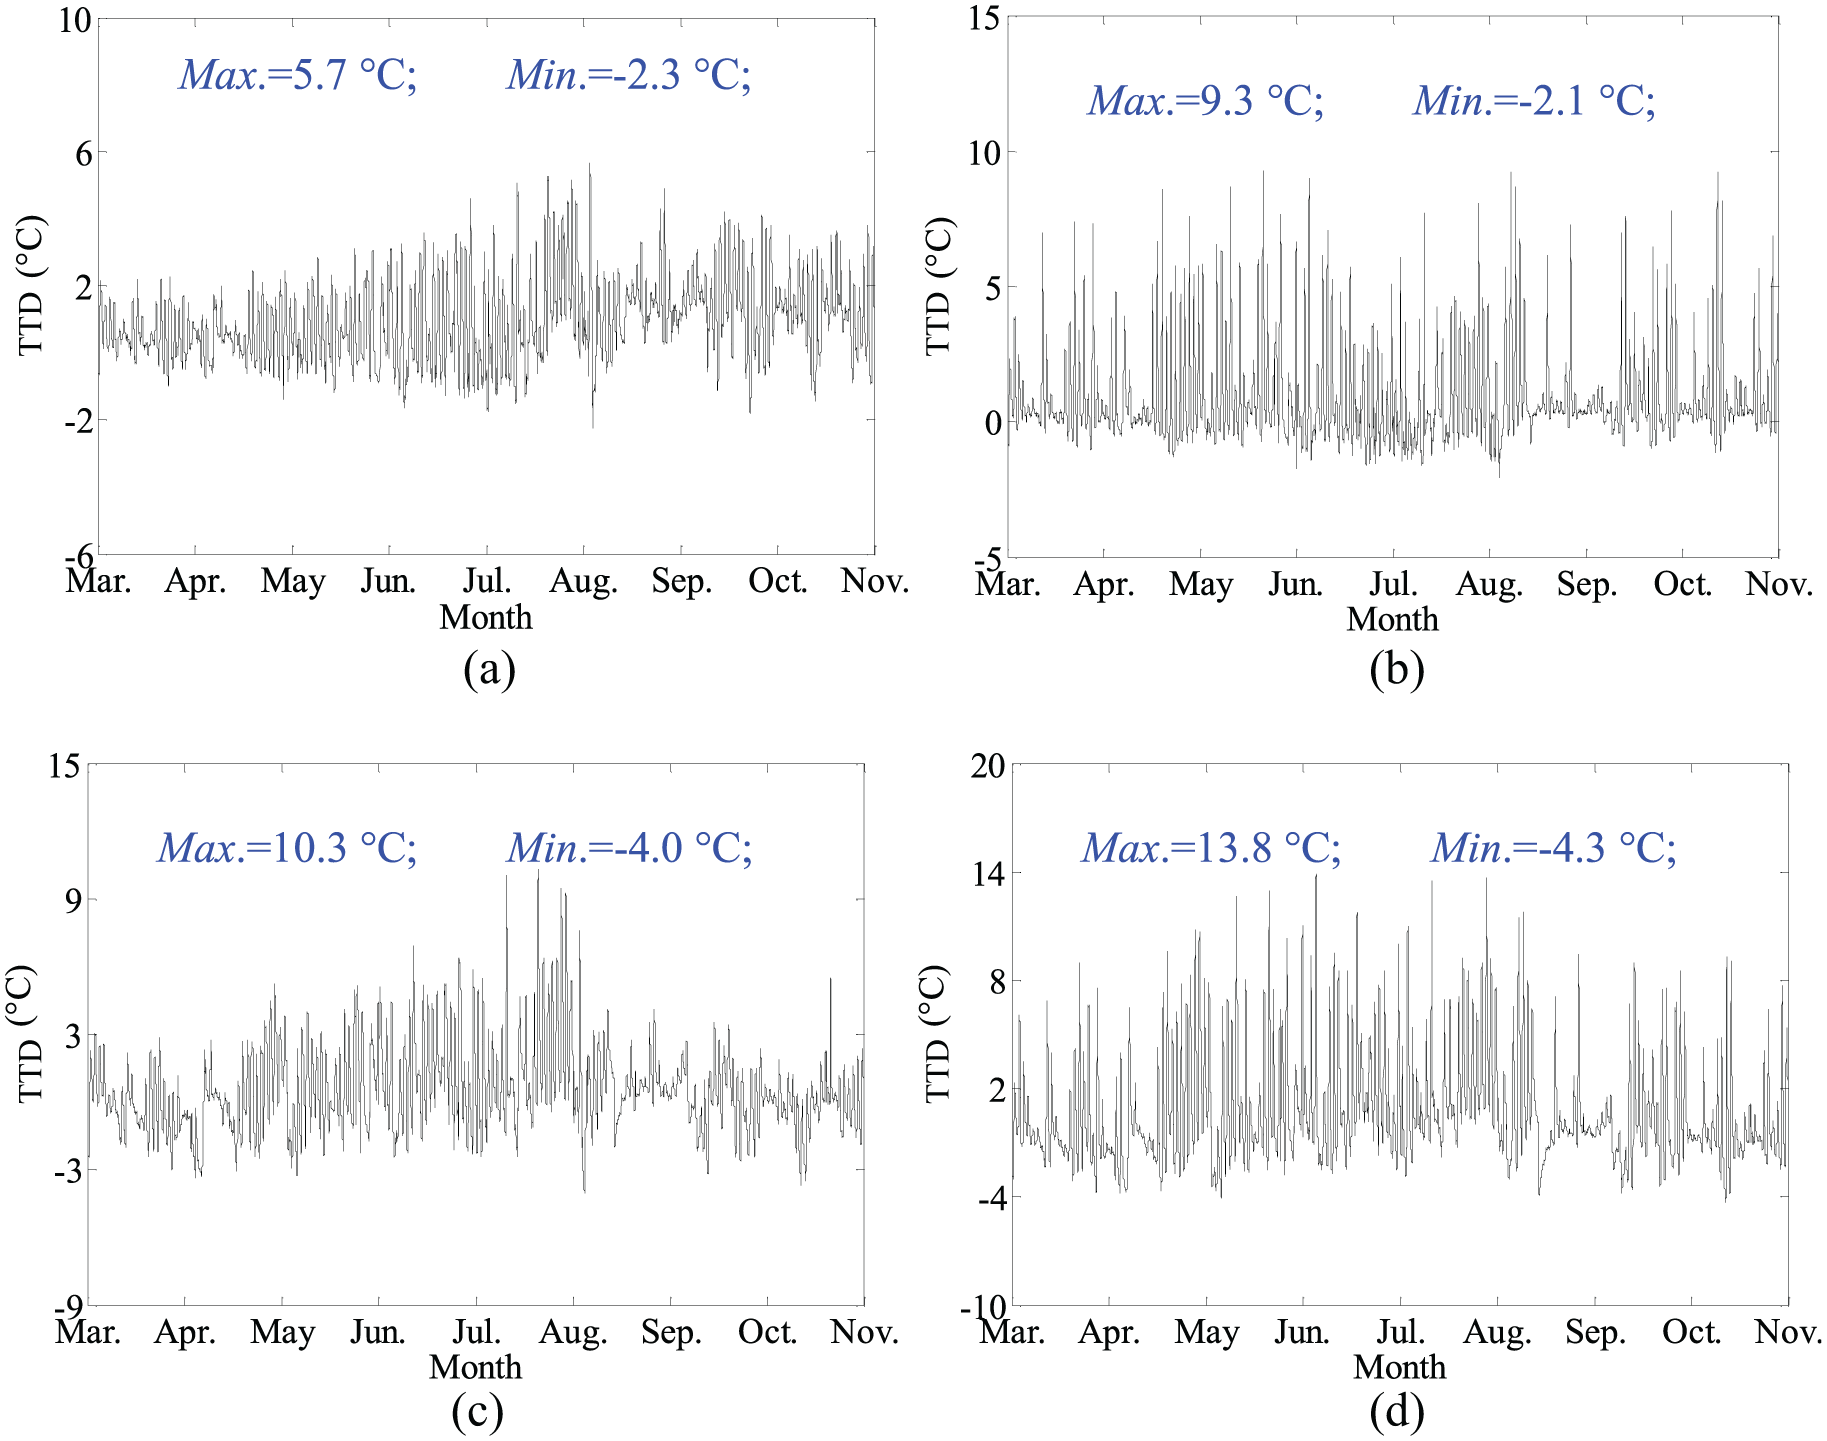
TTDs: (a) T7,8,a, (b) T9,8,a, (c) T10,11,a, and (d) T12,11,a.
Moreover, the VTDs (i.e. T7,10,a, T8,11,a, and T9,12,a) from March to October in 2017 are shown in Figure 8, respectively. It can be seen that both the positive and the negative values for T8,11,a are small, indicating that the temperature field between M8 and M11 can be treated as uniform (i.e. T8,a = T11,a). However, the negative values for T7,10,a and T9,12,a are big compared with the positive ones, indicating that negative VTD is the dominant temperature difference for T7,10,a and T9,12,a (i.e. T7,a < T10,a, T9,a < T12,a).
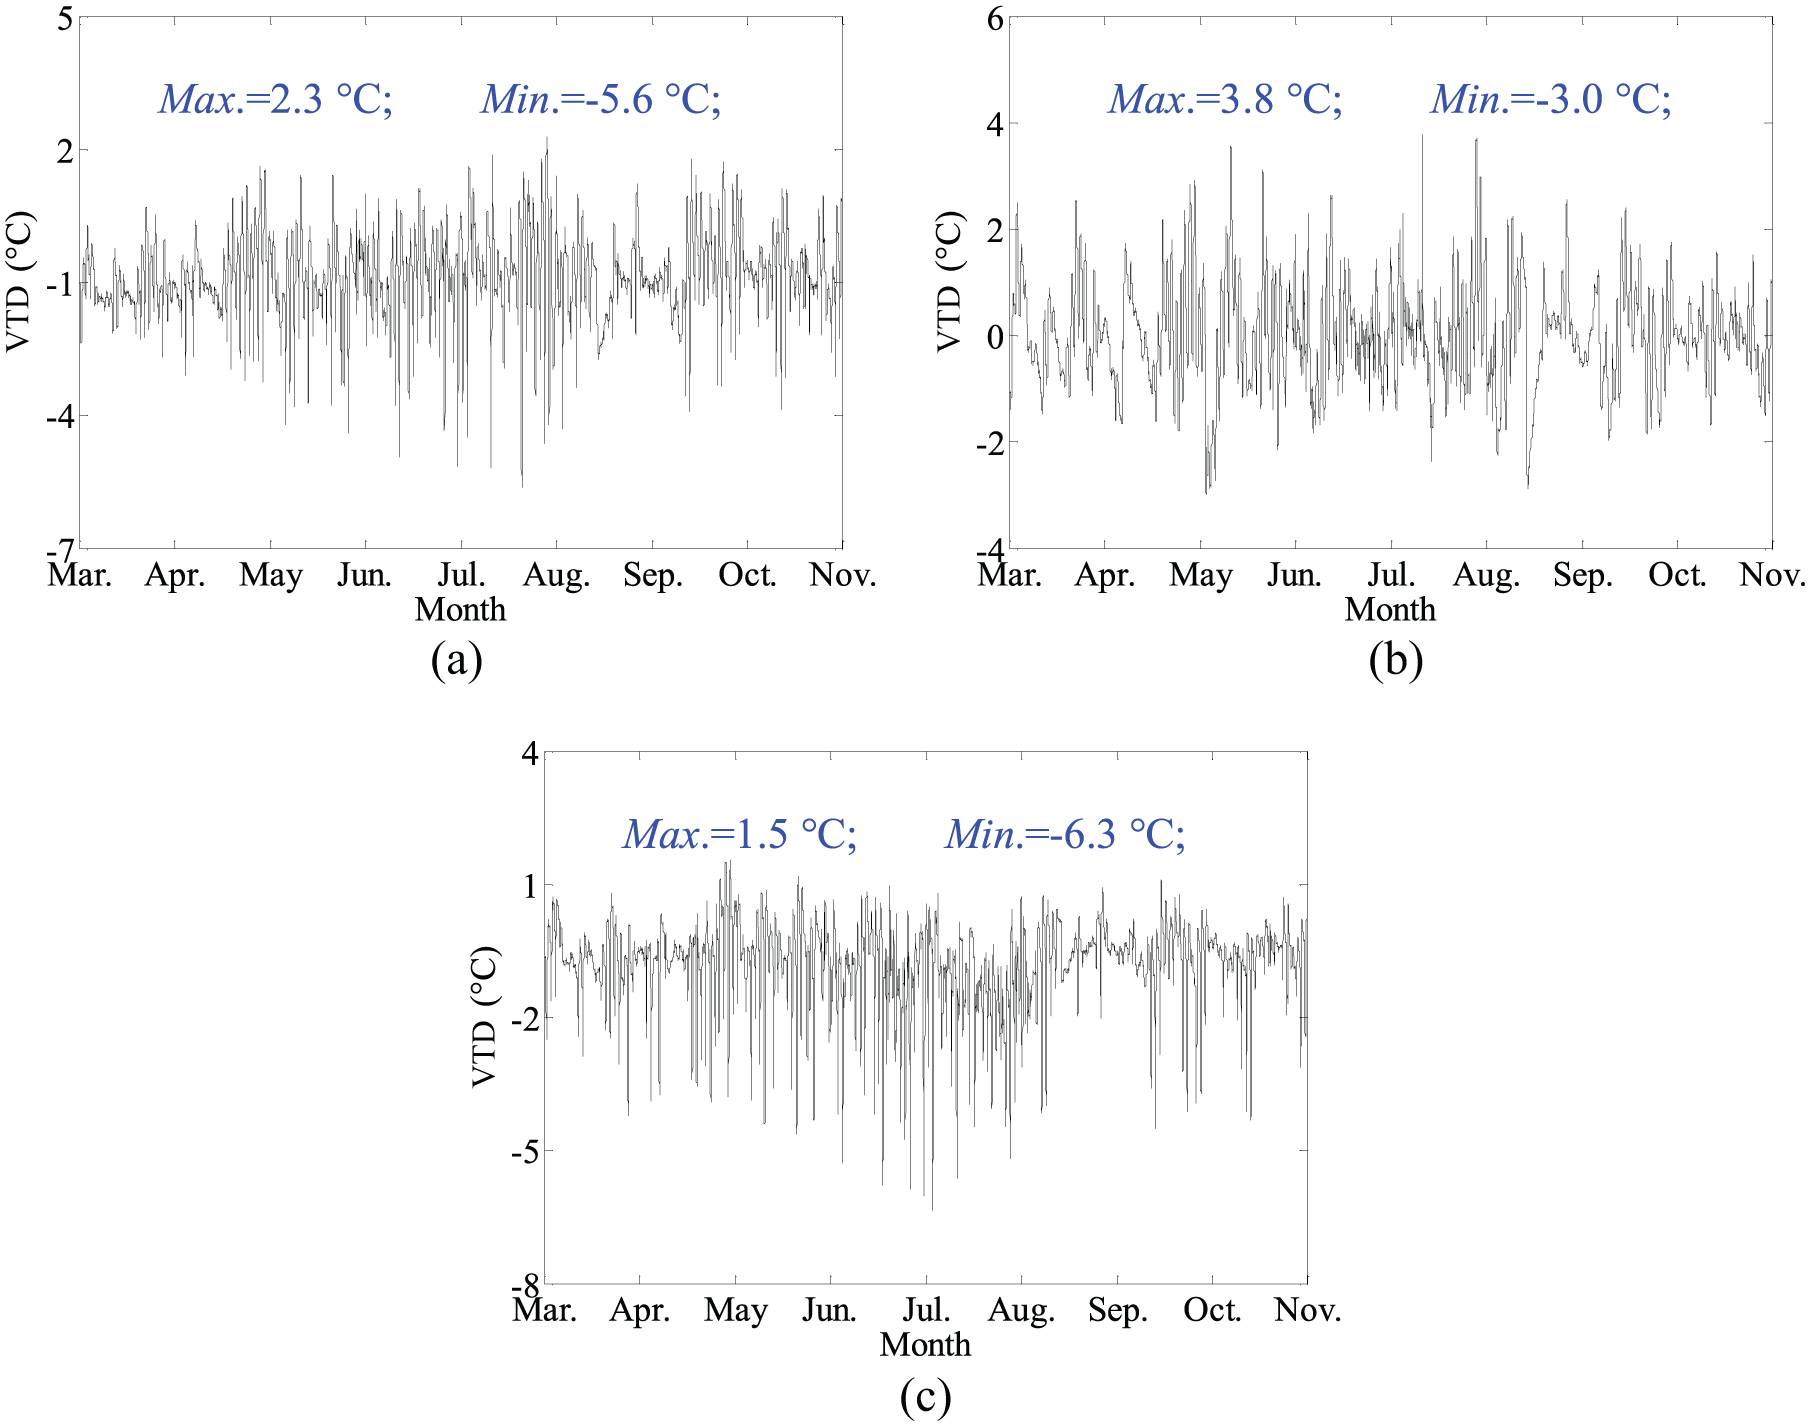
VTDs: (a) T7,10,a, (b) T8,11,a, and (c) T9,12,a.
According to the orientation of bridge with relation to the sun, both the upstream and the downstream of the Tongling Yangtze River Bridge is exposed to sun radiation, as shown in Figure 9. For T7,8,a, T9,8,a, T10,11,a, and T12,11,a, M7, M9, M10, and M12 are partially exposed to solar radiation for a period of daytime, while M8 and M10 are totally shaded by the top steel deck and upper-layer asphalt concrete pavement in the whole day, so positive temperature difference is the dominant TTD (i.e. the temperature from the outside of the bridge is higher than the one from the center of the bridge). For T8,11,a, both M8 and M11 are totally shaded by the top steel deck and upper-layer asphalt concrete pavement, so the temperature difference between M8 and M11 is small. For T7,10,a and T9,12,a, both the top and lateral sides of M10 and M12 are exposed to solar radiation, while only the lateral sides of M7 and M9 are exposed to solar radiation, so negative temperature differences are the dominant temperature difference.
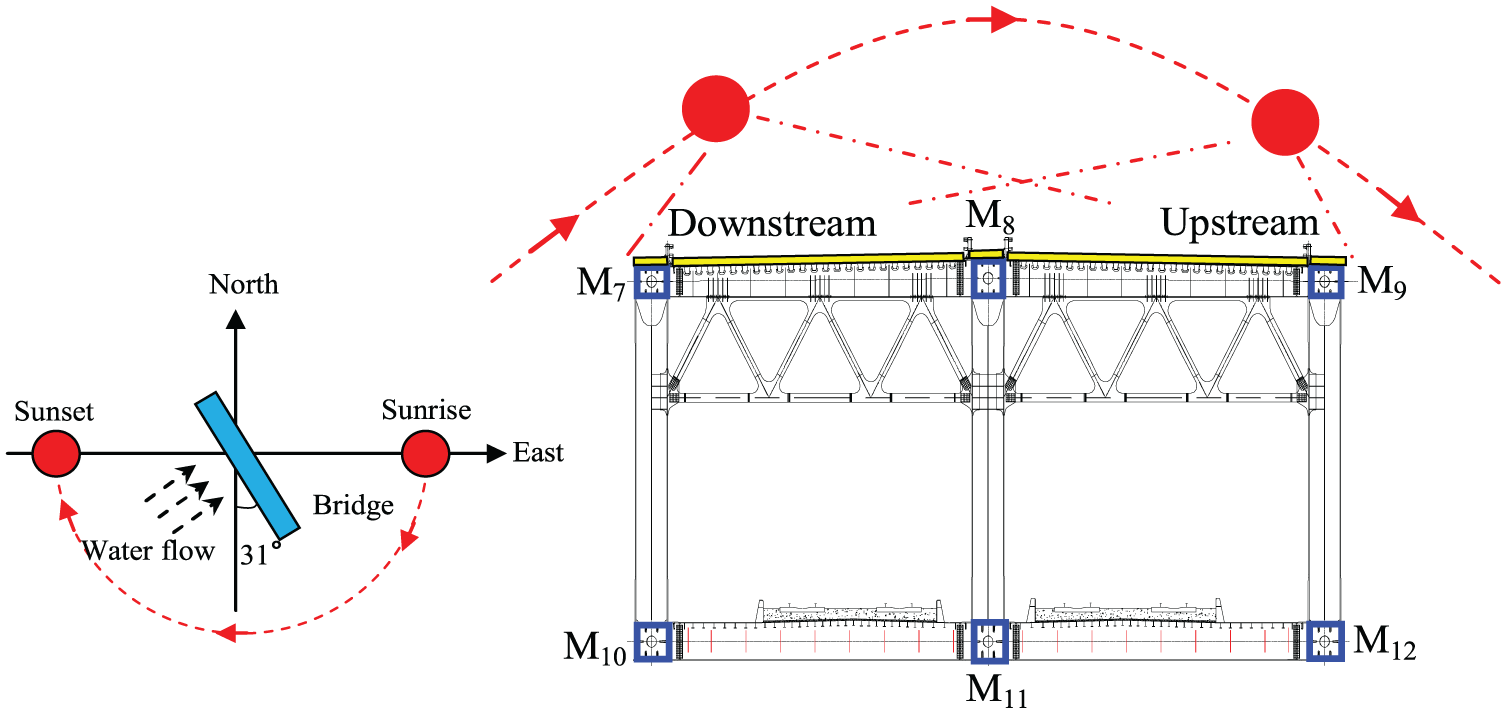
Illustration of orientation of bridge with relation to the sun.
Evaluated temperature difference
Based on the analysis above, some monitored temperature differences are big, and their evaluated values in the bridge service life may exceed the recommended values in current specifications, so it is necessary to evaluate the temperature differences between truss members for bridge design reference. Specifically, consider that the temperature differences T1,4,a, T1,2,a, T3,6,a, and T8,11,a are relatively small, so their thermal actions for design are directly treated as 0°C without further analysis; moreover, for the temperature differences T2,3,a, T7,8,a, T9,8,a, T10,11,a, T12,11,a, T7,10,a, and T9,12,a, they have obvious positive or negative values, which are specially selected for evaluation here.
Evaluation method
Theoretically, the temperature difference in the whole bridge service life should not exceed the recommended values in the bridge design codes, that is

where Tg(t) denotes the temperature difference at time t; TN and TP denote the recommended negative and positive values in the specifications, respectively; and L denotes the bridge service life in years. The sampling frequency of thermocouple installed on the Dashengguan Yangtze River Bridge and Tongling Yangtze River Bridge is 1 Hz, so the temperature difference at every second should satisfy the following inequation

where τ = 1, 2, …, N and N = L× 365 × 86,400. Many research results have revealed that the daily maximum and minimum temperature differences can be treated as statistical variables to evaluate TN and TP (Ding et al., 2012, 2013b; Song et al., 2012; Wang et al., 2014, 2015, 2016). Therefore, equation (2) is further transformed as


where Tg,dmax(j) and Tg,dmin(j) denote the daily maximum and minimum temperature differences in the jth day, respectively, where j = 1, 2, …, n and n = 365 ×L.
By referring to the Eurocode 1: actions on structures, the characteristic values (i.e. TN and TP here) can be used as thermal action values for bridge structures, and specifically, the characteristic values are the special values with an annual probability of exceeding 2%. Therefore, the characteristic values TN and TP can be calculated as follows

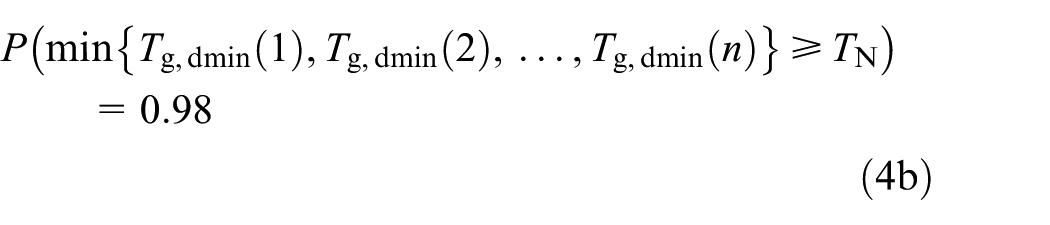
According to the probability statistics theory, equations (4a) and (4b) are equivalent to the following expressions
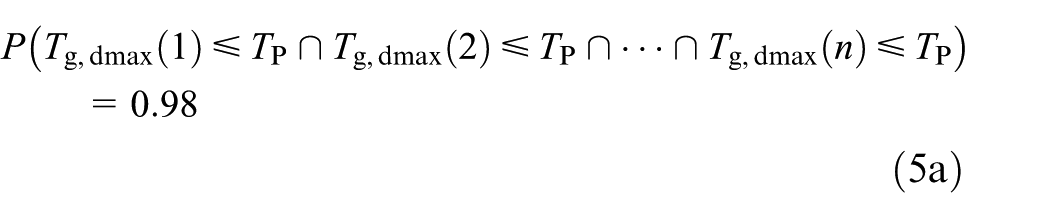
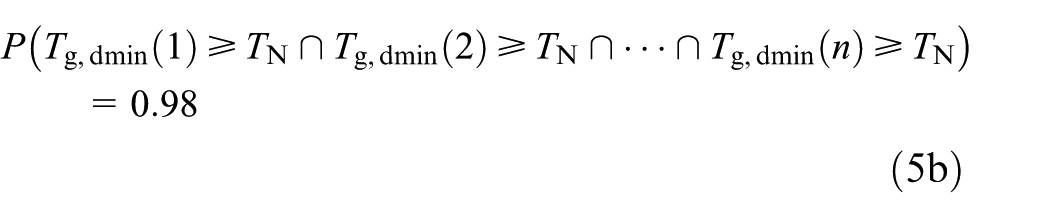
According to Song et al.’s (2012) research, Tg,dmax(1), Tg,dmax(2), …, Tg,dmax(n) can be treated as independent to each other, and similarly, Tg,dmin(1), Tg,dmax(2), …, Tg,dmax(n) can be treated as independent to each other, so equations (5a) and (5b) are further expressed as follows
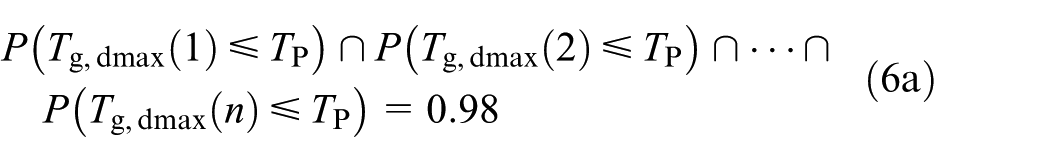
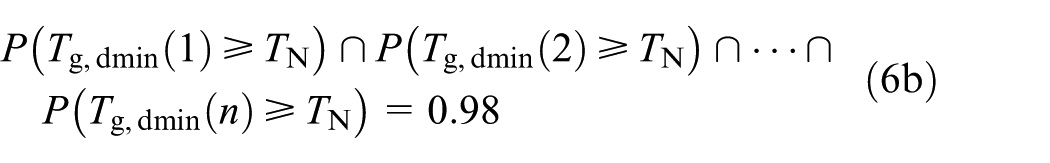
According to the definition of cumulative probability, P(Tg,dmax(j) ⩽ TP) and P(Tg,dmin(j) ⩾ TN) can be calculated using the cumulative probability functions F(Tg,dmax) and F(Tg,dmin), that is, P(Tg,dmax(j)⩽TP)= F(TP) and P(Tg,dmin(j) ⩾ TN) = 1 − F(TN). Then, equations (6a) and (6b) are rewritten using F(TP) and F(TN) as follows


What should be noted is that it may be difficult to determine the cumulative probability functions F(TP) and F(TN). For example, the norm distribution does not have cumulative probability function. Therefore, TN and TP are evaluated using probability density function as follows
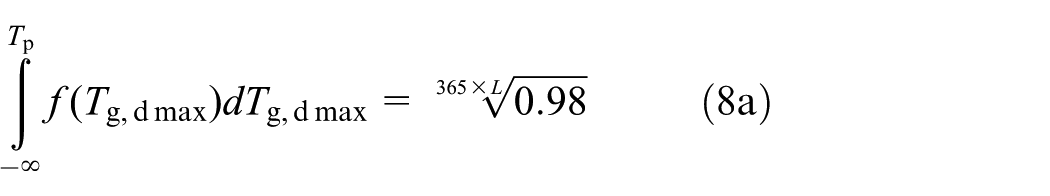

where f(Tg,dmax) and f(Tg,dmin) denote the probability density functions of Tg,dmax and Tg,dmin, respectively. If f(Tg,dmax) and f(Tg,dmin) are known, the temperature differences TN and TP can be finally evaluated using equations (8a) and (8b).
Determination of probability density function
The determination of probability density function is illustrated by two steps:
First, the probability density is calculated through probability statistics analysis. In detail, according to probability statistics theory, Tg,dmax or Tg,dmin is evenly divided into some intervals, and the probability density in each interval is calculated as follows
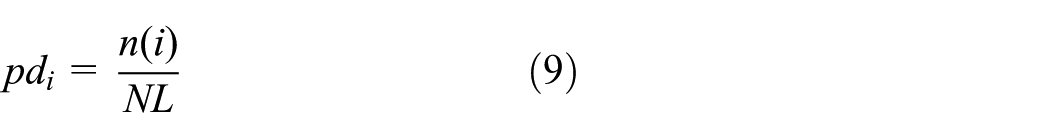
where pdi denotes the probability density in the ith interval; n(i) denotes the number of values in the ith interval; N denotes the total number of values in Tg,dmax or Tg,dmin; and L denotes the interval length.
Second, the type of probability distribution function is determined. Our previous research results have revealed that the probability density function can be built by the sum of two norm distributions as follows (Ding et al., 2012, 2013b; Wang et al., 2014)
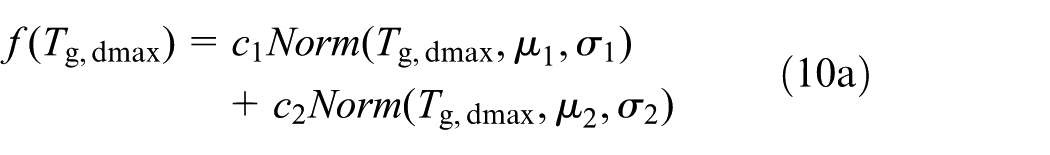

where Norm(Tg,dmax, μ1, σ1) and Norm(Tg,dmin, μ2, σ2) denote the norm distributions of Tg,dmax and Tg,dmin with mean parameters μ1 and μ2 and standard deviation parameters σ1 and σ2, respectively; c1 and c2 denote the weighting coefficients of the two norm distributions, respectively, and c1+c2=1. The values of c1, c2, μ1, σ1, μ2, and σ2 can be estimated using the calculated probability densities pdi of Tg,dmax and Tg,dmin in least-squares sense.
Finally, through the two-step analysis, the estimated values of c1, c2, μ1, σ1, μ2, and σ2 are shown in Table 1, and the fitted probability density functions are shown in Figure 10. It can be seen that the sum of two norm distributions can well characterize the calculated probability densities. Furthermore, Kolmogorov–Smirnov test is introduced to verify whether the fitted probability density functions can represent the probability densities of measured Tg,dmax and Tg,dmin at the 5% significance level. The null hypothesis is h = 0, indicating that the probability densities of measured Tg,dmax and Tg,dmin follow the sum of two norm distributions, and the test result h = 1 if the test rejects the null hypothesis. After verification, all the test results h = 0, indicating that the sum of two norm distributions can be used as the probability density function of measured Tg,dmax and Tg,dmin.
Estimated values of c1, c2, μ1, σ1, μ2, and σ2.

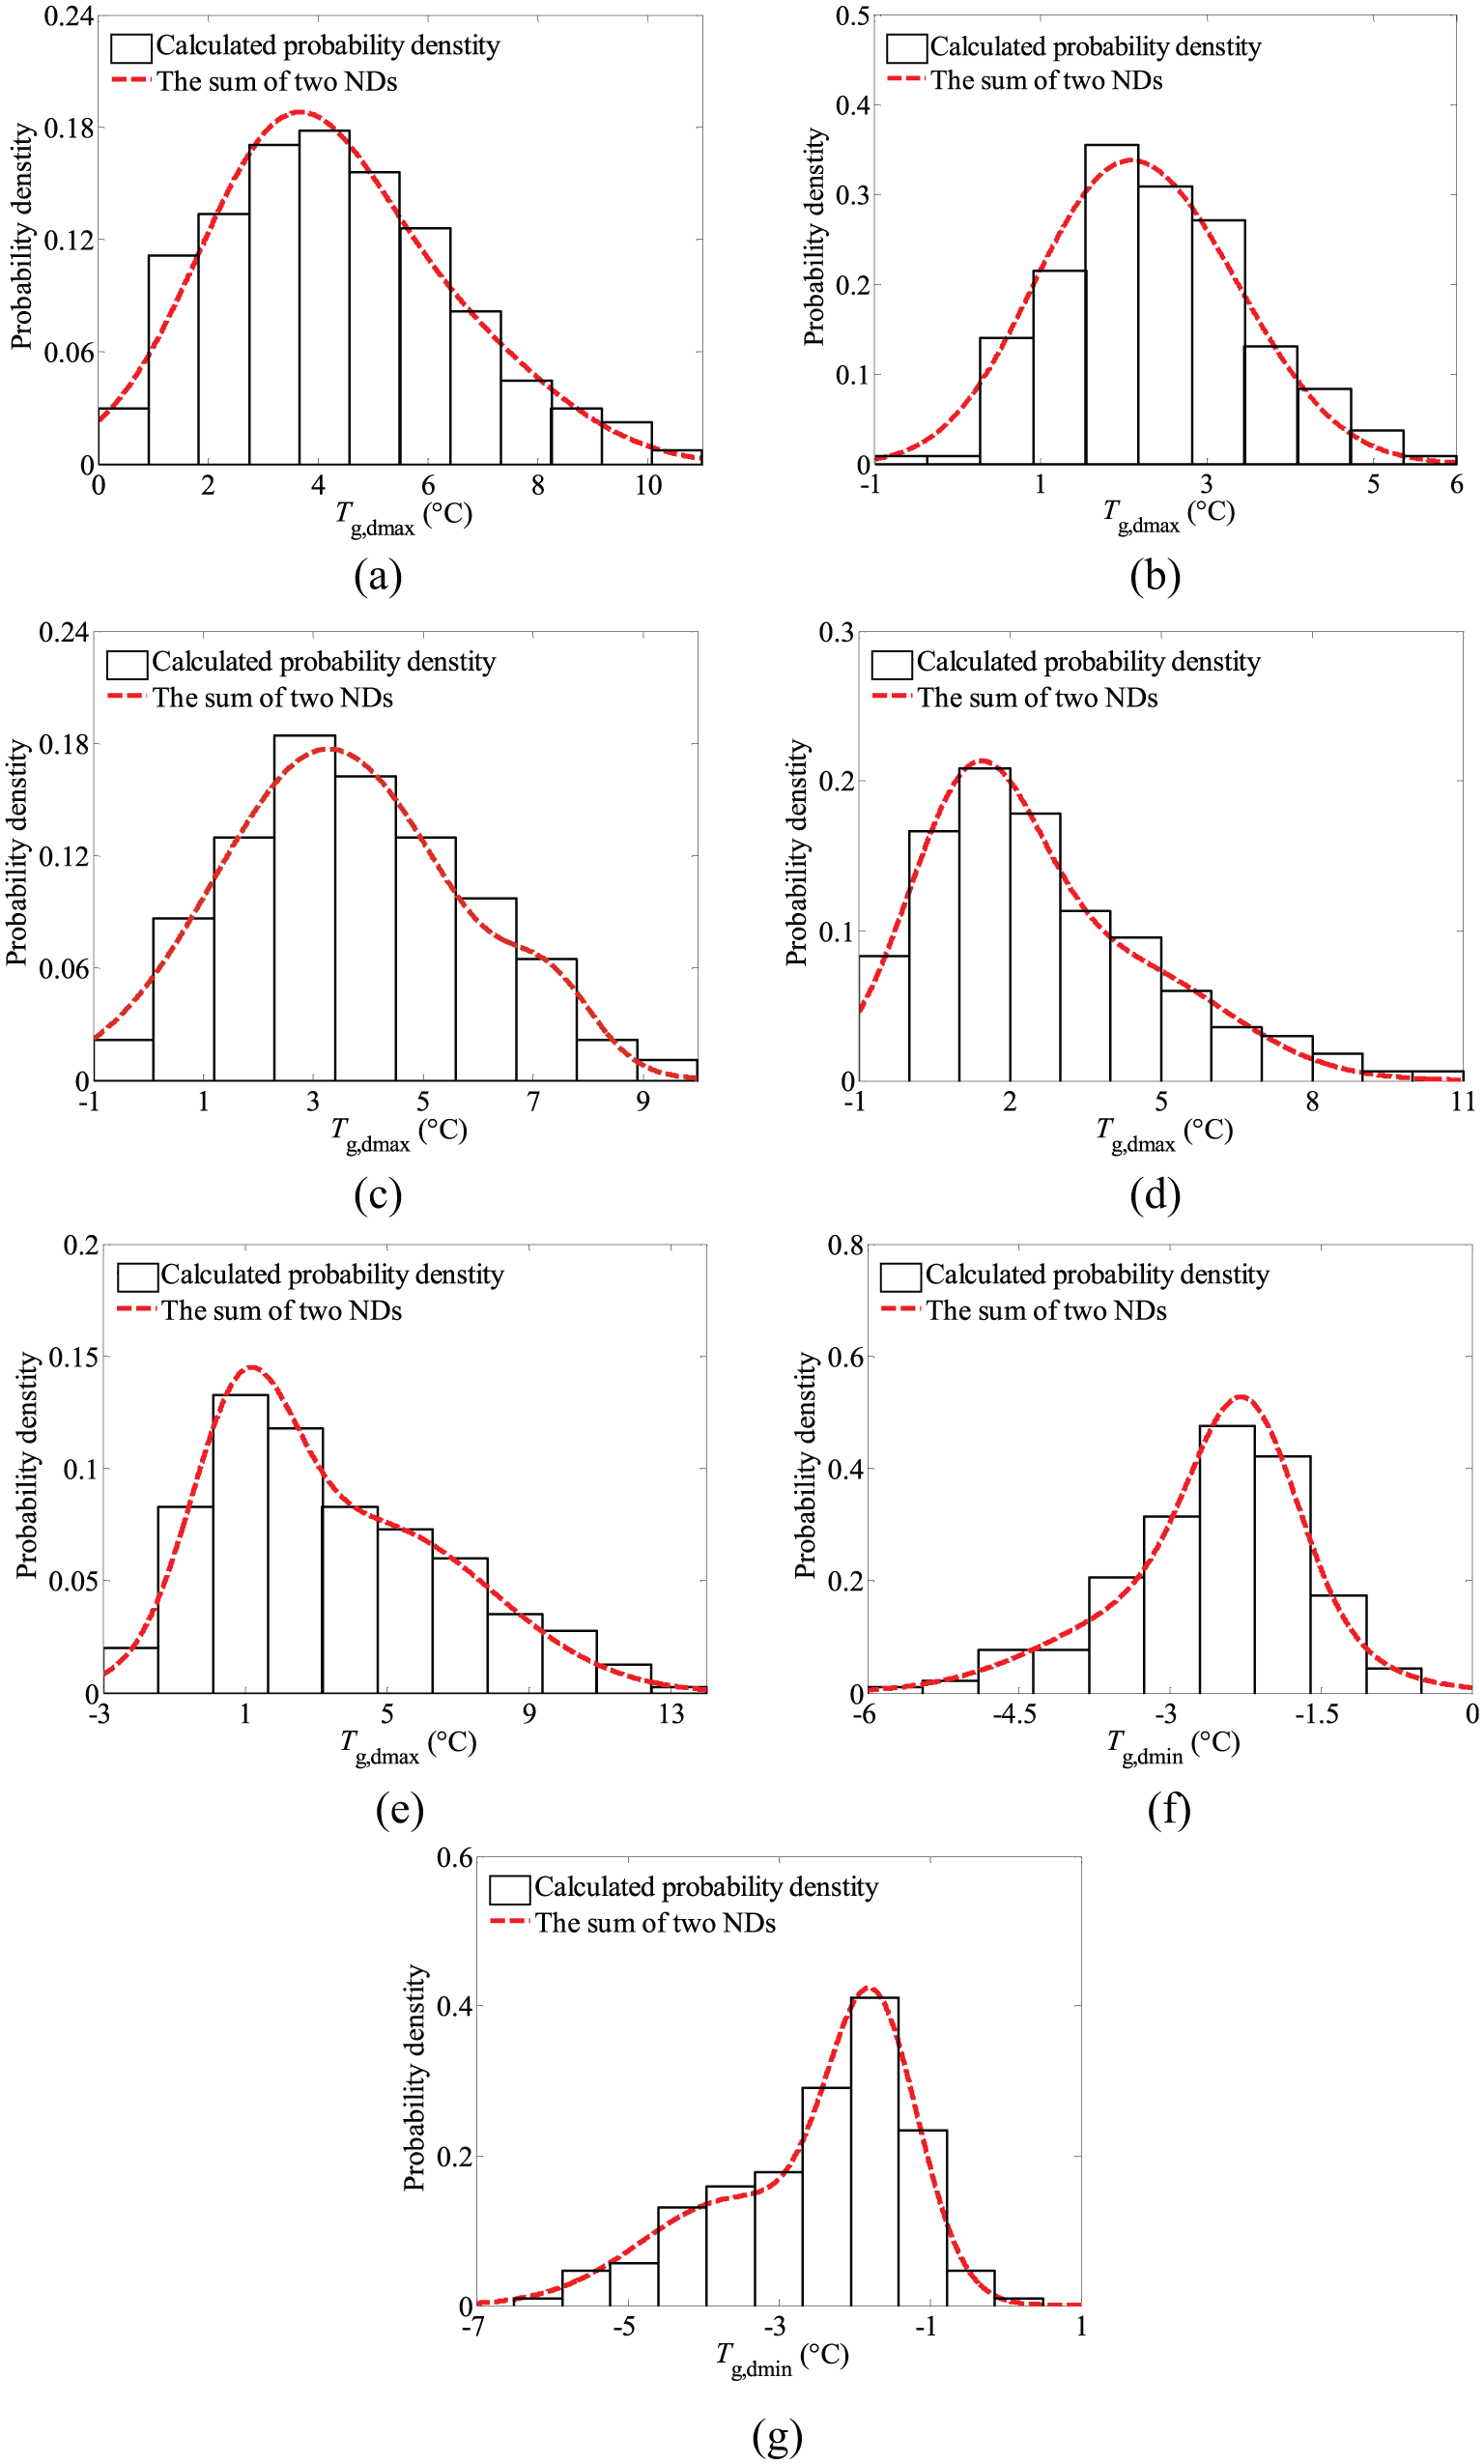
Fitting results of the sum of two norm distributions: (a) T2,3,a, (b) T7,8,a, (c) T9,8,a, (d) T10,11,a, (e) T12,11,a, (f) T7,10,a, and(g) T9,12,a.
Evaluation result
The designed service life for the two bridges is 100 years, so the value of L in equations (8a) and (8b) is 100 for evaluation. After evaluation using equations (8a), (8b), (10a), and (10b), the TP of T2,3,a, T7,8,a, T9,8,a, T10,11,a, and T12,11,a for thermal action design is 14.9°C, 7.8°C, 13.5C, 13.9°C, and 20.5°C, respectively, and the TN of T7,10,a and T9,12,a for thermal action design is −8.5°C and −9.3°C, respectively, which are illustrated in Figure 11. Besides, the temperature differences T1,4,a, T1,2,a, T3,6,a, and T8,11,a are relatively small, so their thermal actions for design are directly treated as 0°C, which is also illustrated in Figure 11.
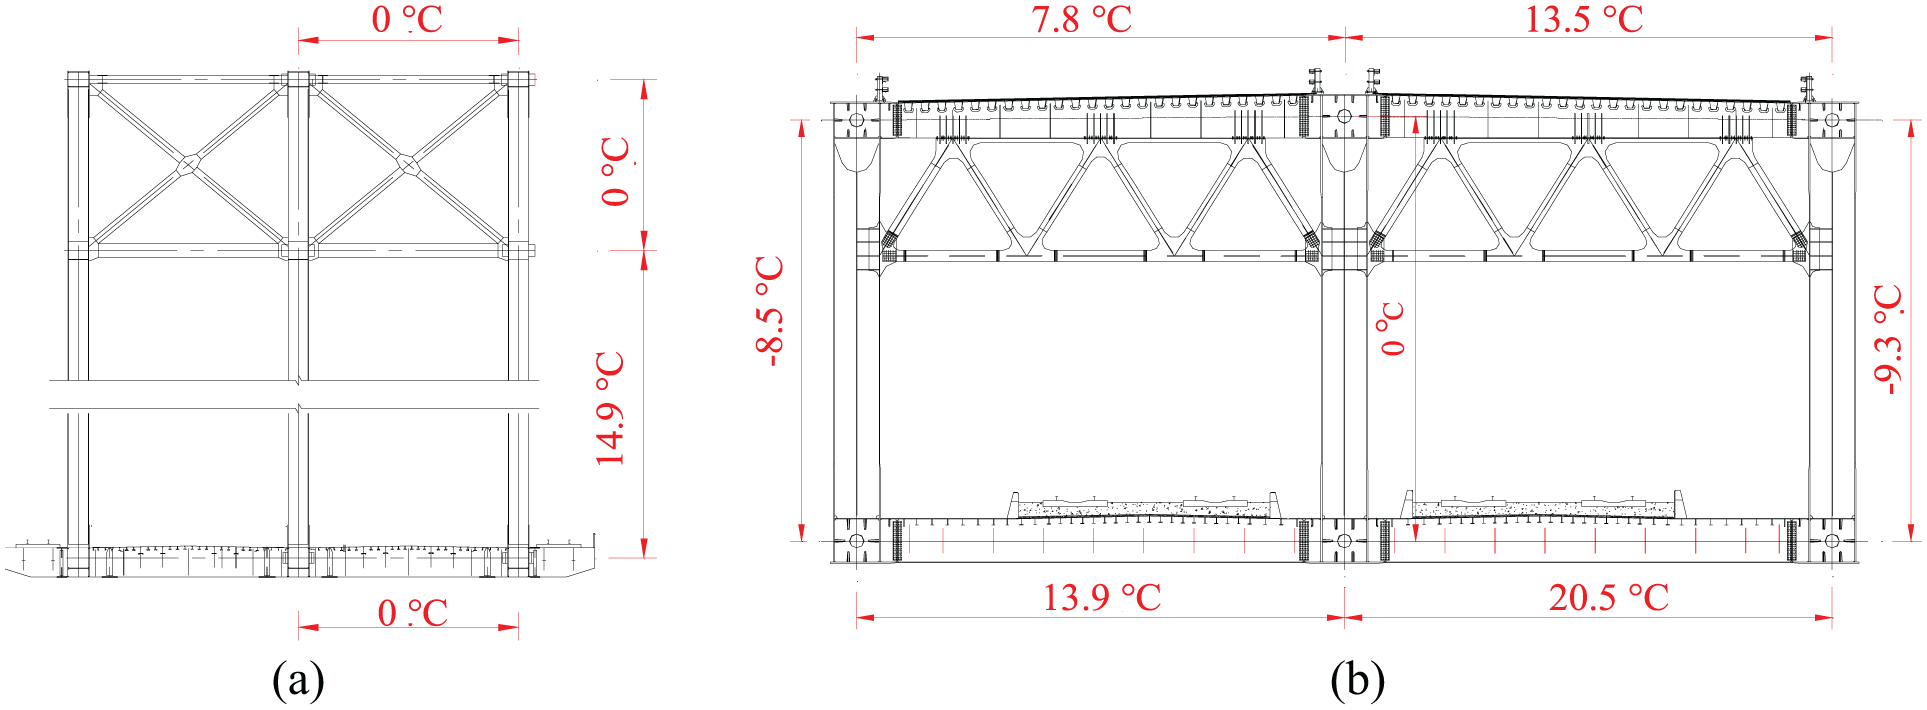
Evaluation results of two bridges: (a) the Dashengguan Yangtze River Bridge and (b) the Tongling Yangtze River Bridge.
Moreover, each evaluated TP or TN of Ti,j,a corresponds to one measured maximum or minimum value of Ti,j,a. For example, the evaluated TP of T2,3,a is 14.9°C, which corresponds to the maximum value 10.4°C of T2,3,a. So, the correlation between the evaluated and the measured values is plotted in Figure 12. It can be seen that the correlation shows good linear relationship, which can be mathematically fitted by one linear function as follows

where Ty denotes the TP or TN, Tx denotes the maximum or minimum value, k denotes the linear slope, and c denotes the constant term. The values of k and c are fitted in least-squares sense and the fitted results are k = 1.454 and c = −0.268. The R2 value is 0.9984, verifying the goodness of the fit. The fitted linear function reveals the relationship between the evaluated and the measured values. In the future, maybe more temperature differences from other locations of these bridges are concerned. Using the linear relationship, it is convenient that the evaluated values can be directly calculated by substituting the monitored maximum and minimum values into the linear relationship. So, the linear relationship is worth further study in the future.
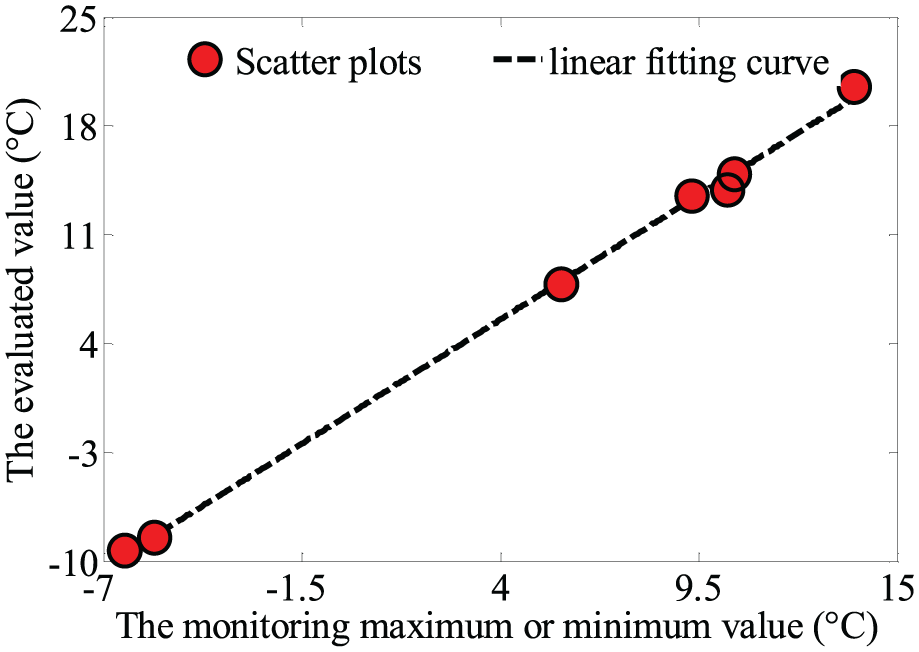
Correlation between evaluated values and measured maximum or minimum values.
Comparison with bridge design codes
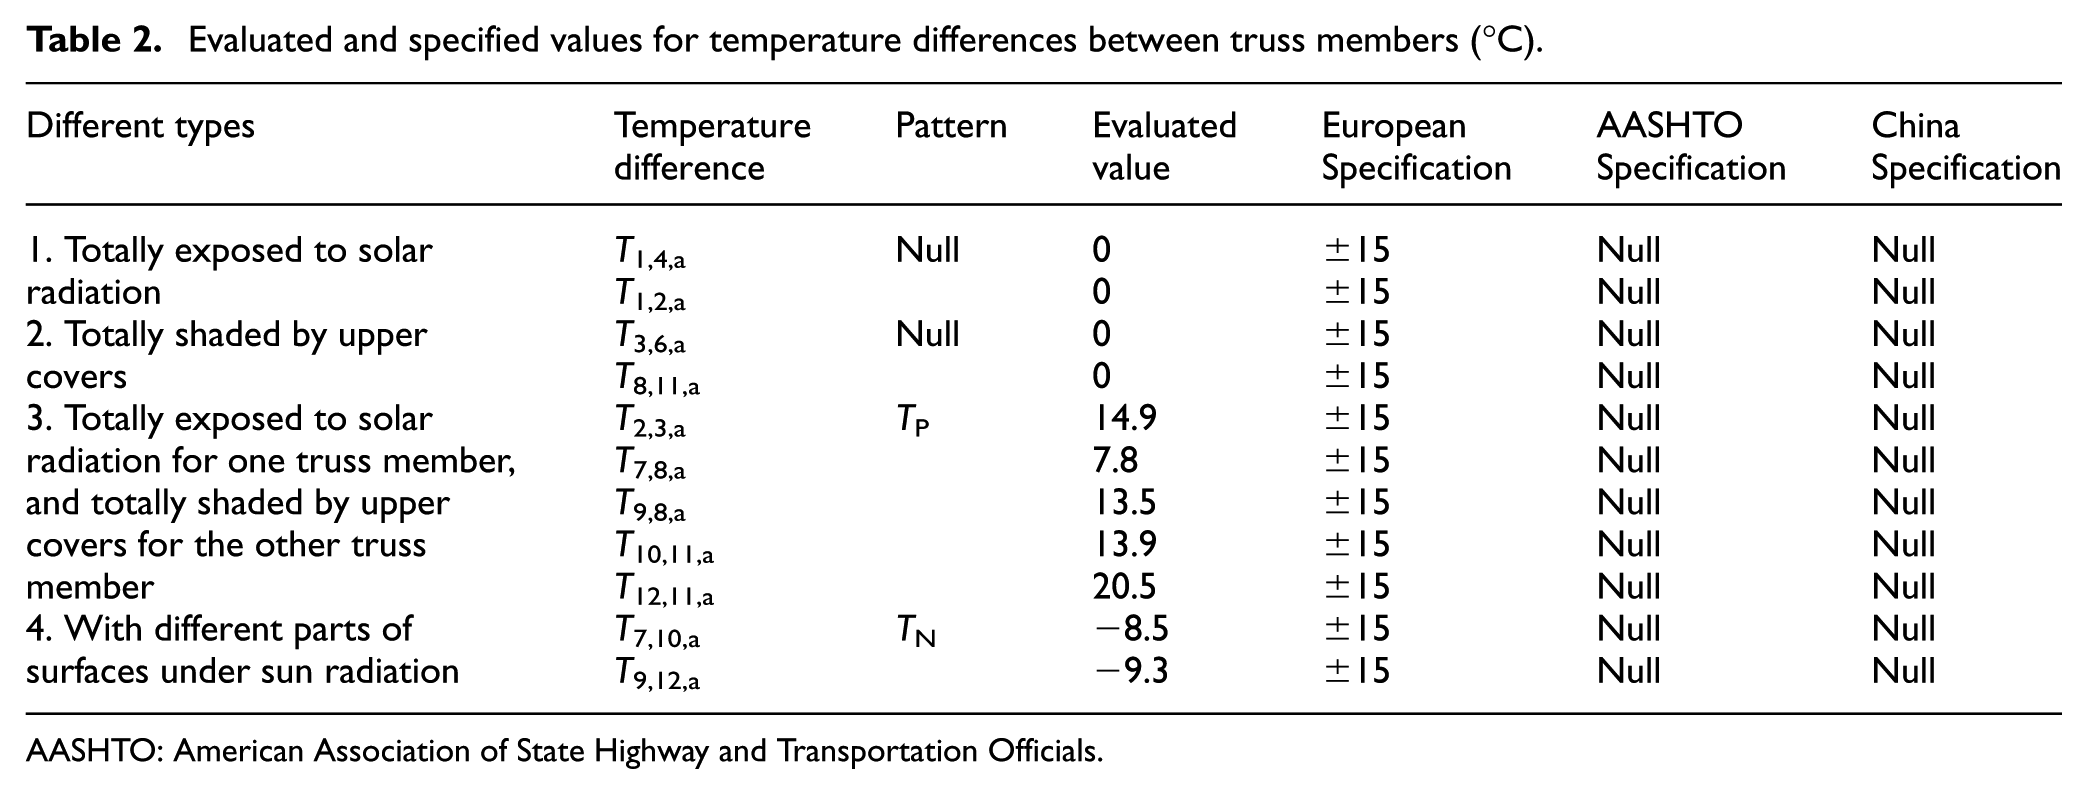
Different types of temperature differences are classified by sun radiation and steel deck coverage, and furthermore, the evaluated temperature differences are compared with the specified values in the three specifications, as shown in Table 2. Besides, with regard to the specified values from the European, AASHTO, and China specifications, the value from European specification is 15°C, while the values from AASHTO and China specifications are not mentioned, as shown in Table 2. For the first and second types of temperature differences (i.e. the steel truss members are totally exposed to solar radiation or totally shaded by upper covers (steel deck or asphalt concrete pavement)), the evaluated temperature differences are all 0°C, which is far from the value from European specification; for the third and fourth types of temperature differences (i.e. one steel truss member is totally exposed to solar radiation, while the other steel truss member is totally shaded by upper covers, or the two steel truss members have different parts of surfaces under radiation), the evaluated temperature differences are generally close to the specified one in the European specification. But what should be mentioned is that, although the European specification has specified that the temperature difference between two truss members is 15°C for thermal action design, it does not furthermore make clear which truss member has 15°C higher temperature than the other one, which is revealed using monitored data in this research.
Evaluated and specified values for temperature differences between truss members (°C).
AASHTO: American Association of State Highway and Transportation Officials.
Conclusion
In this research, the temperature differences between steel truss members in two long-span truss bridges are investigated, and the temperature differences which have obvious positive or negative values for thermal action design are further evaluated. Moreover, the evaluated temperature differences are compared with the specified values in the three specifications. The research results can provide important reference for current specifications and structural design, especially for steel truss bridges. The main conclusions are drawn as follows:
For the first and second types of temperature differences (i.e. the steel truss members are totally exposed to solar radiation or totally shaded by upper covers (steel deck or asphalt concrete pavement)), the measured temperature differences have small positive and negative values, and the evaluated temperature differences can be treated as 0°C.
For the third and fourth types of temperature differences (i.e. one steel truss member is totally exposed to solar radiation, while the other steel truss member is totally shaded by upper covers, or the two steel truss members have different parts of surfaces under radiation), the measured temperature differences have big positive or negative values, and the evaluated temperature differences are generally closer to the specified ones in the European specification.
The sum of two norm distributions can be used to describe the probability densities of daily maximum or minimum temperature differences. The correlation between the evaluated and the measured maximum or minimum temperature difference shows good linear relationship.
Footnotes
Appendix 1
Declaration of Conflicting Interests
The author(s) declared no potential conflicts of interest with respect to the research, authorship, and/or publication of this article.
Funding
The author(s) disclosed receipt of the following financial support for the research, authorship, and/or publication of this article: This study was supported by the Fundamental Research Funds for the Central Universities (2018QNA37).