
Abstract
Modal properties of the primary structure and tuned mass dampers are basic parameters for in situ tuned mass damper frequency tuning and periodic condition assessment of the structure–tuned mass damper system. In this study, a state space technique is developed for identifying the respective modal properties of structure and tuned mass damper device from the dynamic responses of the coupled structure–tuned mass damper systems. The coupled structure–tuned mass damper system is represented by a reduced two-degree-of-freedom model which characterizes the coupled dynamics of the structural mode under control and tuned mass damper. A simple expression is derived for calculating the respective modal properties of the structural mode and tuned mass damper from the modal properties of the coupled two-degree-of-freedom model. Stochastic subspace identification is employed to estimate the modal properties of the combined system from ambient or free vibration responses. Numerical simulation of two structures and experimental validation of a laboratory steel frame equipped with a tuned mass damper are carried out to verify the proposed method. It is shown the proposed method successfully identifies the modal properties of both the structural mode under control and the tuned mass damper. Compared to the ambient vibration data, the identification results are superior when using the free decay responses. When the tuned mass damper is not perfectly tuned to the primary structure, much accurate identification results can be obtained, especially for the damping ratios of the primary structure and the tuned mass damper.
Keywords
Introduction
Tuned mass damper (TMD), also known as vibration absorber, is a vibration control device mounted in structures to mitigate the undesirable vibrations due to various dynamic loadings such as wind, earthquake, and traffic loadings. It is a single-degree-of-freedom (SDOF) system that consists of a mass, a spring, and a damper. If the TMD is tuned in resonance with the primary structure but in an opposite phase, a large amount of vibration energy is transferred to the TMD and then dissipated by damping in TMD when the primary structure is subjected to harmonic excitations. TMDs have been widely applied in civil engineering structures such as high-rise buildings (Irwin, 2009; Kareem and Kijewski, 1999; Kwok and Samali, 1995; Shi et al., 2012; Wang et al., 2018; Xu et al., 2017), long-span bridges (Battista and Pfeil, 2000; Fujino and Yoshida, 2002; Larsen et al., 1995; Weber and Maslanka, 2012), and industrial chimneys (Brownjohns et al., 2010; Gorski, 2015).
The optimal parameters of TMD are designed according to the modal properties of bare primary structure for the controlled mode. They can be expressed by the optimal frequency tuning ratio and optimal damping as a function of mass ratio, that is, the ratio of TMD mass with respect to structural modal mass for the mode under control (Rana and Soong, 1998; Warburton, 1982). The performance of TMD strongly depends on the frequency tuning ratio between the TMD and the structure; even a slight deviation from the optimal value, called the detuning effect, could result in a dramatic deterioration in TMD performance (Weber and Feltrin, 2010). Therefore, accurate information about modal frequency and modal mass for the controlled mode of the primary structure should be known beforehand for parameter design of TMD.
In most instances, modal testing for the primary structures is performed prior to deployment of TMD, and modal parameters of the bare primary structures can be determined by traditional techniques from ambient or forced vibration data, such as peak picking technique, frequency domain decomposition, random decrement technique, and stochastic subspace identification (SSI; Brincker and Anderson, 2000; Lin et al., 2001; Loh et al., 2012; Van Overschee and De Moor, 1996). In addition, the frequency response function (FRF)-based approach enables the estimation of modal mass for a specific mode of the primary structures, which is essential to determine the mass ratio of TMD (Pavic et al., 2002; Wen et al., 2016). However, in a few occasions where TMD is installed in synchronization with the construction of the primary structure, it is necessary to estimate the modal properties of the primary structure from the combined structure–TMD system, instead of from the bare structure only. As well, detuning of in-service TMD, due to parameter changes either in TMD or in primary structure, and application of semi-active TMD are other examples which require the estimation of modal parameters of the primary structure while the TMD is in operation (Weber and Feltrin, 2010; Weber and Maslanka, 2012).
To evaluate the modal properties of the primary structures equipped with TMD, the traditional way is to perform dynamic tests while TMDs are locked out (e.g. Shi et al., 2012; Wen et al., 2016). This technique is able to provide the modal properties of the controlled modes which are sufficiently accurate for frequency tuning of TMD. However, it does not permit estimation of the TMD parameters (i.e. stiffness and damping coefficients) simultaneously as TMDs are deactivated. As already mentioned, the TMD parameters, especially for TMD damping parameters, may vary due to performance aging over time. Simultaneous identification of the structural and TMD parameters is an important task. The major difficulty lies in the treatment of two closely spaced modes inherently present in the structure–TMD systems. From the experimental point of view, closely spaced modes are sometimes identified as one single mode during modal identification (Brownjohns et al., 2010).
Several studies have addressed the modal identification of the structure–TMD system for performance assessment and frequency tuning of in-service TMDs. Weber and Feltrin (2010) carried out performance evaluation of TMDs installed on two pedestrian bridges that have been in service for 19 years. The authors employed the SSI method to identify the modal properties of the combined system, and no attempt has been made to distinguish the modal properties of bare structure from those of the combined system. They also noted that significant changes in TMD damping may occur due to season variations of temperatures. Hazra et al. (2010) proposed a combined method of modified cross-correlation with empirical mode decomposition (MCC-EMD) to identify the modal properties of the structure–TMD system. The natural frequency of the bare structure for the controlled mode was approximated by the arithmetic mean of two selected frequencies of the combined system. Kang et al. (2012) identified the modal frequency of the TMD using the relative responses between the structure and TMD, and the dynamic properties of the bare building were then evaluated based on the natural frequencies of the TMD and the coupled system. Roffel and Narasimhan (2014) proposed a method based on the extended Kalman filtering to separate bare structural dynamics from the combined system by assuming that the TMD parameters are known. Yuan et al. (2018) combined the second-order blind identification method with the empirical wavelet transform to delineate closely spaced frequencies. Wang and Lin (2015) extracted the modal frequencies and damping ratios of the TMD and primary structure from the combined structure response. However, the identification of the structural modal mass or the mass ratio of TMD is not discussed. Structural modal mass for the controlled mode is essential for TMD optimal design; however, the prediction of modal mass from the finite element model may differ significantly from the measurement due to uncertainty in boundary conditions (Weber and Feltrin, 2010). A few studies have been reported to estimate the modal mass by employing TMD excitation (Hwang et al., 2006, 2015; Porras et al., 2012).
For the purpose of in situ frequency tuning and condition assessment, the modal frequency and modal damping of the bare primary structure, and those for the TMD are necessary. In this study, a state space technique is formulated to identify the respective modal properties of the TMD and the primary structure from dynamic responses of the combined system. The combined system is simplified as a reduced two-degree-of-freedom (DOF) model characterizing the dynamics of structural mode under control and TMD. The state space representation is employed to formulate the mathematical model of the 2-DOF model. The system matrices describing the 2-DOF model are evaluated from dynamic measurements and the respective modal properties of the structure and TMD are determined. Two numerical examples and a laboratory model of one-story steel frame are presented to verify the proposed method. The performance of identification using free vibration or ambient vibration data is compared. Moreover, the influence of TMD parameters on the identification results is also evaluated.
State space representation for the structure–TMD system
Figure 1 shows the schematic of an N-DOF primary structure equipped with a TMD, located at the nth DOF of the primary structure. The dynamic equations of motion for the combined structure–TMD system subjected to external excitation are expressed as
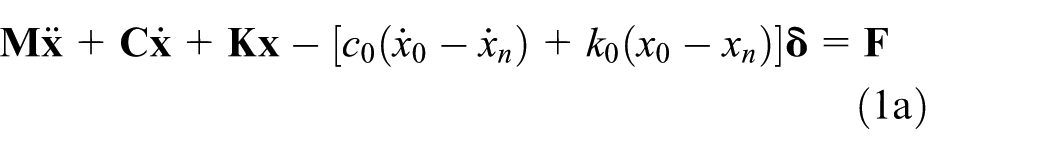

where
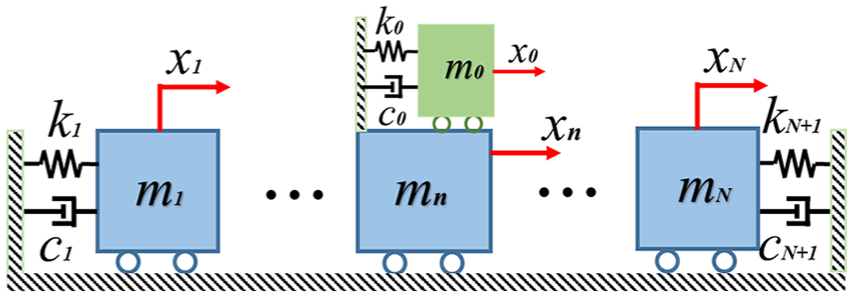
Schematic view of the structure with a TMD.
By applying the mode superposition technique, the displacement vector of the primary structure is given as
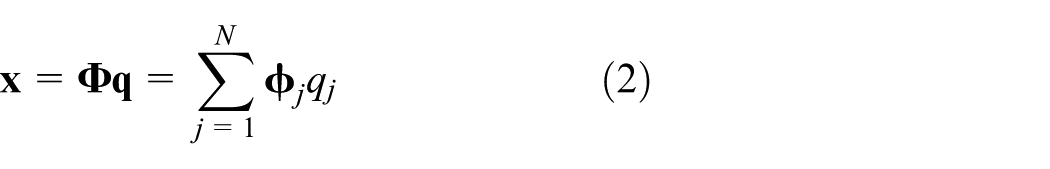
where
Substituting equation (2) into equation (1) and then pre-multiplying
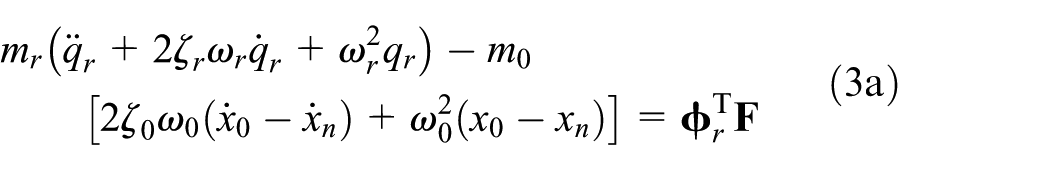

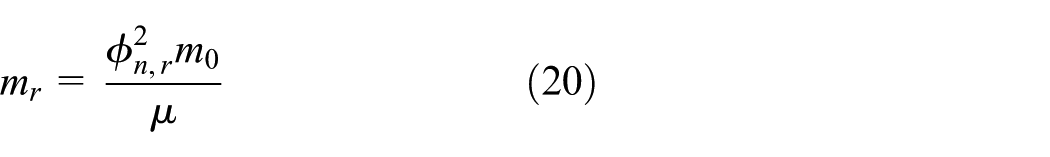
where mr is the rth modal mass and is given by
In equation (3), xn and x0 are the physical displacements, but qr is defined in the modal coordinate system. Given that only the rth mode of the structure is involved in the vibration, that is, xn = ϕn,rqr·qr, equation (3) can be written as
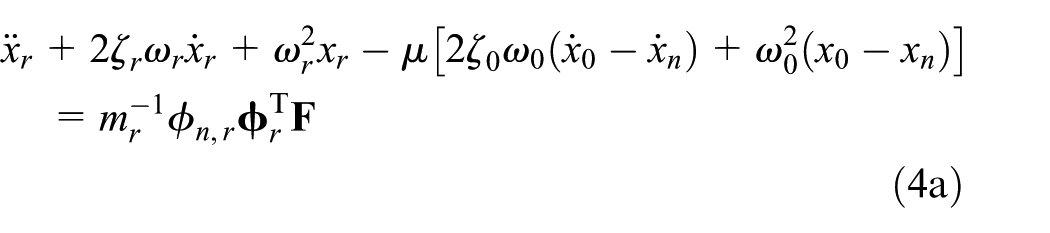

where
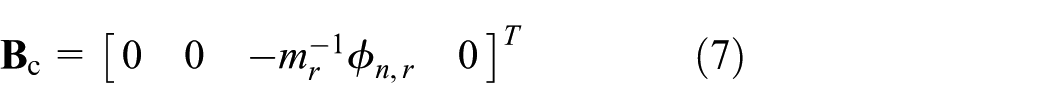
Equation (4) represents the equations of motion for the combined 2-DOF system. The state space representation of the above 2-DOF system given in equation (4) in the continuous time domain is given as follows

where

The state matrix

where
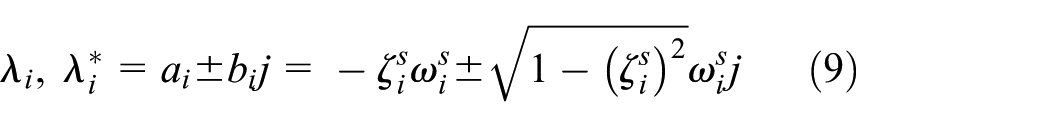
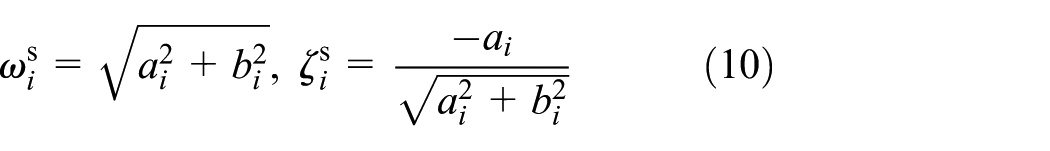
The natural frequencies
System identification procedure
Outline of the identification strategy
As already shown in the above section, equation (6) implies that the state matrix
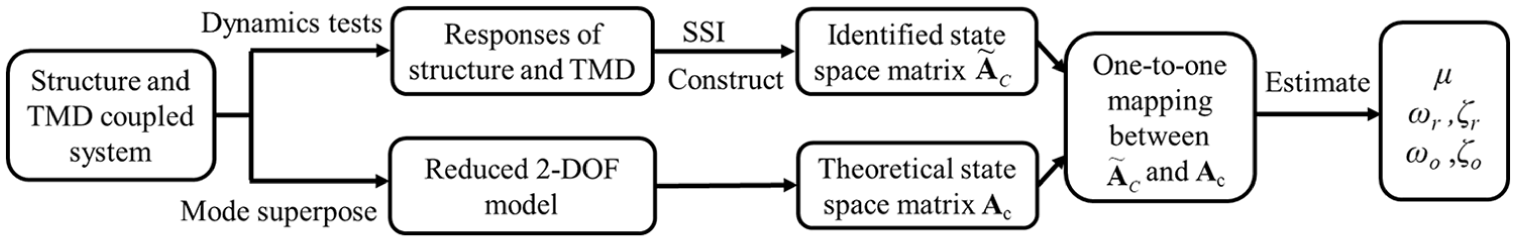
Flowchart of the proposed method.
One critical issue of the proposed method is that both of the identified state matrix Ãc and the theoretical state matrix
Estimation of state matrix
Based on equation (8), the state matrix
In practice, the recorded signals are discrete with a constant small time interval Δt. Hence, the discrete state space model is employed to replace the continuous state space model. The state space model in the discrete time domain is given as follows (e.g. Van Overschee and De Moor, 1996)


where
For free vibration tests,


This state space model can be identified by the system identification techniques, such as eigensystem realization algorithm and SSI. SSI is a widely used technique to identify discrete state space equations of the linear system from ambient vibration tests and free vibration tests. Hence, in this study, SSI is used to identify the discrete state space model.
Using the recorded displacement or acceleration responses of the structure at the nth DOF and TMD from free vibration tests or ambient tests,

where
By transforming
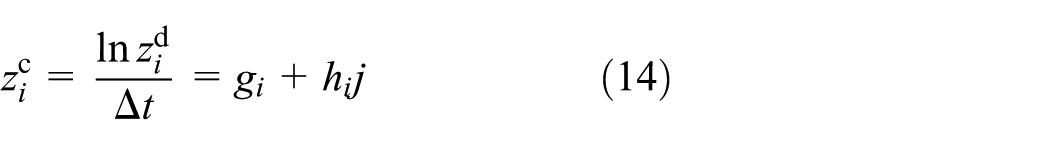
The natural frequencies and damping ratios of the combined system can be evaluated using

The corresponding shape matrix

For a specific model order L, the characteristic parameters can be obtained from equations (15) and (16). Among those characteristic parameters, some are related to the actual modes of the combined structure–TMD system, while others are related to noise modes without physical meaning. To determine the actual modes, a stabilization diagram is established by assembling the estimated characteristic parameters for different model orders. In the stabilization diagram, there will be several stable poles related to the dynamic properties of the combined system. Then, the two characteristic parameters, the frequencies of which are close to the frequencies given by equation (10), are selected out. Finally, the eigenvalues
In practice, a few modes of the structure–TMD system can be excited by ambient vibration or free vibration. When the natural modes of the structure are well separated, it is straightforward to select out the two relevant modes of the combined system, as will be discussed later.
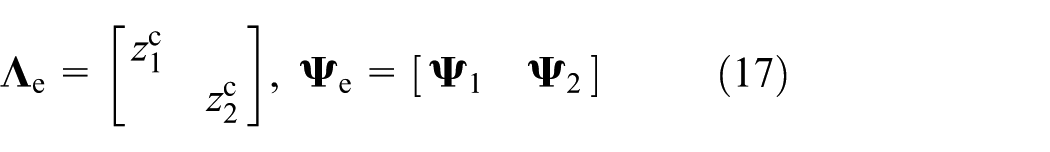
After obtaining the diagonal matrix
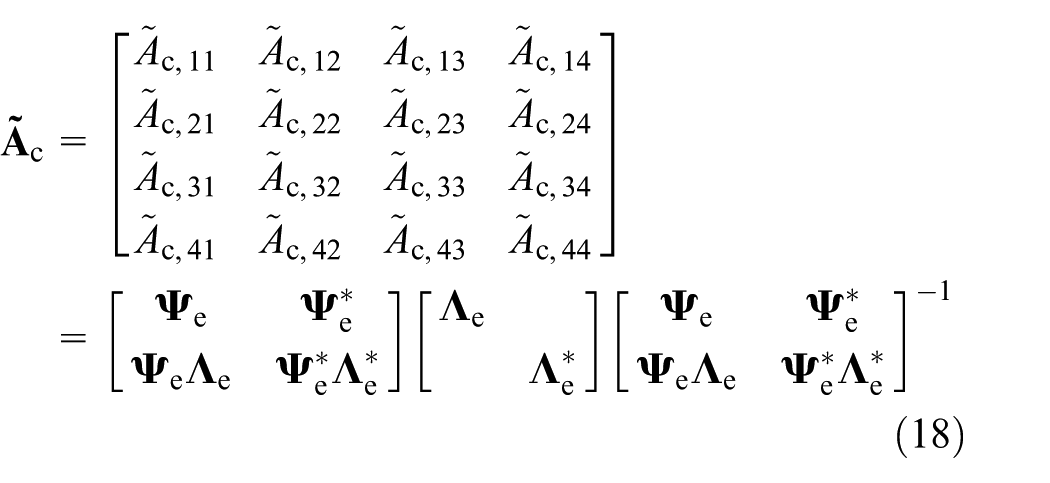
where
Parameter estimation of both structure and TMD
Once the state matrix

When the mass of the TMD, namely, m0, is known, the rth modal mass of the primary structure is estimated as
Numerical examples
SDOF structure with one TMD
The first numerical example is an ideal SDOF structure equipped with one TMD. The structural parameters of the SDOF system are as follows: mass m1 = 100.0 kg, stiffness k1 = 5684.9 N/m, and damping c1 = 7.54 N s/m. The natural frequency f1 and the modal damping radio ζ1 of the SDOF structure are 1.20 Hz and 0.5%, respectively. The mass ratio µ of 1% is selected to optimally design parameters of TMD, and then the optimal frequency ratio and optimal damping ratio of TMD are determined following the criterion of minimizing the peak in the FRF of the displacement. The optimal frequency of TMD is f0 = f1/(1 + µ) = 1.188 Hz and the optimal TMD damping ratio is ζ0 = (3µ/8(1+µ))1/2 = 6.09%. The physical parameters of TMD are as follows: m0 = 1.0 kg, k0 = 55.73 N/m, and damping c0 = 0.91 N s/m. Hence, in this case, the combined system refers to a perfectly tuned system. The acceleration responses of the combined structure–TMD system are simulated with the sampling rate of 100 Hz. They are employed to identify the modal properties of the primary structure and the TMD, namely, f1, ζ1, f0, and ζ0. Both free decay vibration and ambient vibration are investigated for modal identification.
The simulated free vibration data are first used for parameter identification. In order to evaluate the influence of noise, artificial white noise w is added to the simulated free decay accelerations. For this reason, two types of noises are considered. The first is the white noise excitation which represents the environmental loadings such as wind loading while performing free decay tests. The other is actually the measurement noise inevitably present in the experimental data. The noise level is defined as the noise-to-signal ratio (NSR), which is the ratio of the standard deviation of noise, σw, in relation to the standard deviation of acceleration,
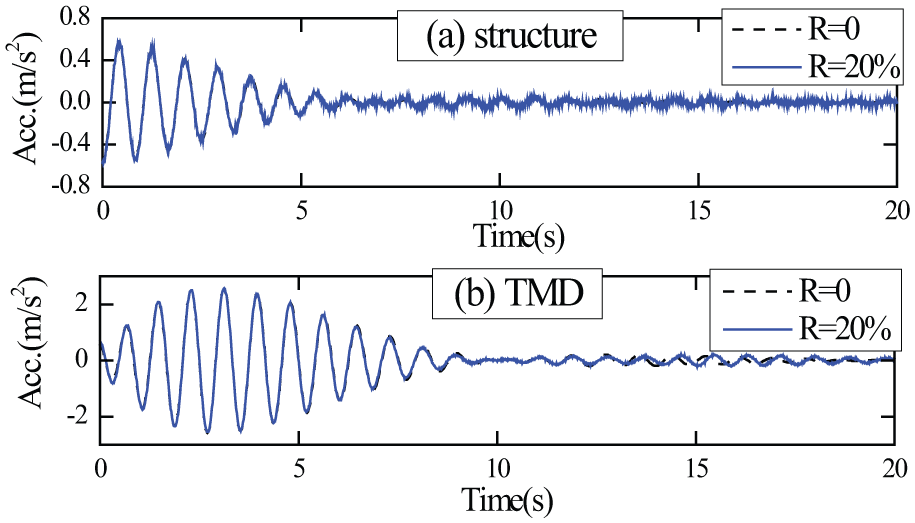
Free decay responses of the combined SDOF-TMD system with NSR = 20%.
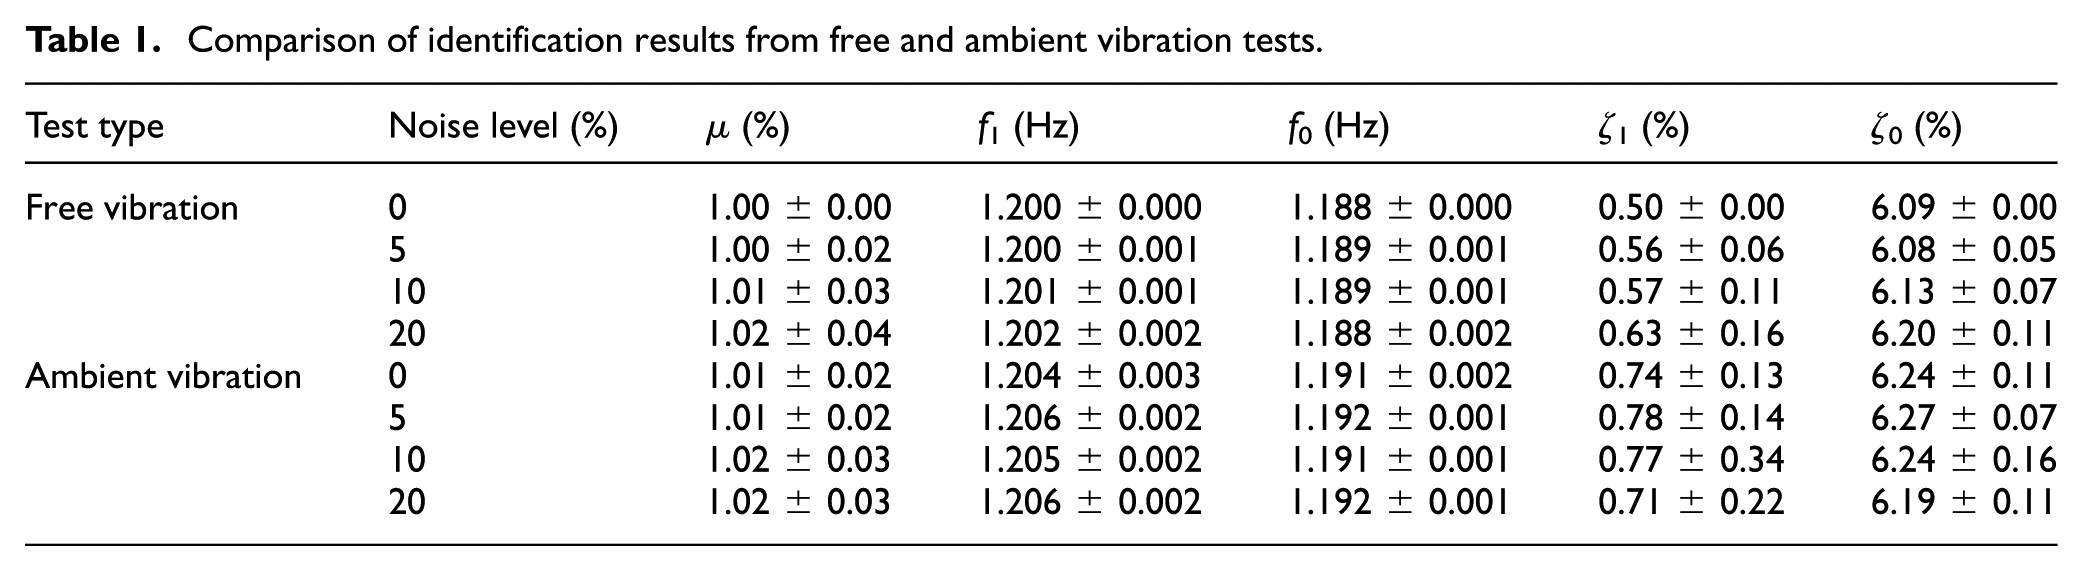
For a chosen model order L, the modal properties of the combined system are identified from SSI. Figure 4 shows the stabilization diagram with the model order L varying from 8 to 40. It is seen that there are two obvious stable poles in Figure 4 for different model orders, which indicate the modal frequencies of the combined structure–TMD system, which are 1.146 and 1.244 Hz. The identified eigenvalues and mode shapes of the combined system are used to identify the natural frequencies and damping ratios of the primary structure and the TMD and mass ratio. The results are summarized in Table 1, where 1000 simulation trials are used to obtain the statistics of the identification results.
Comparison of identification results from free and ambient vibration tests.
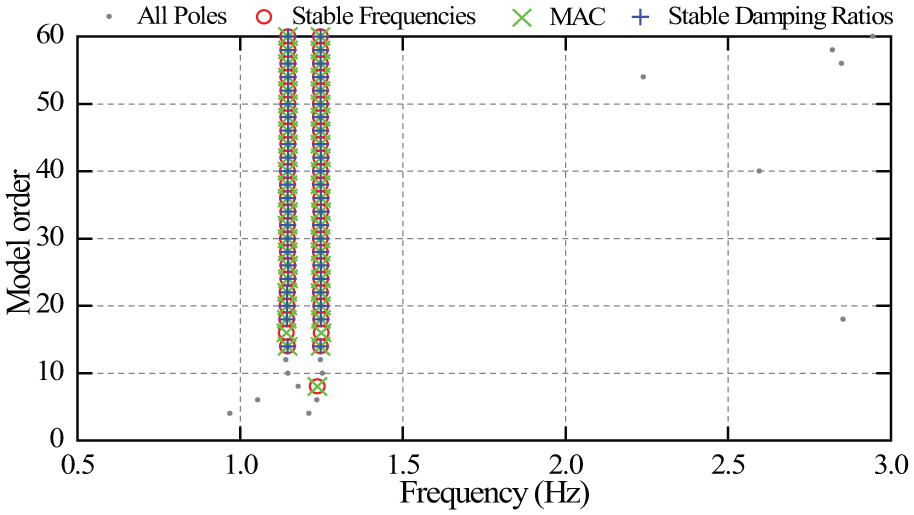
Stabilization diagram for free decay responses with NSR = 20%.
The same procedures are used for modal parameter identification using ambient vibration responses. The total duration of time series is 600 s. The ambient excitation is modeled by a zero-mean low-pass-filtered white noise. Only the measurement noise is considered for the case of ambient vibration tests. Figure 5 shows the simulated accelerations of the combined system for NSR = 10%. Figure 6 shows the stabilization diagram for the ambient vibration data. The identification results are also summarized in Table 1.
Ambient responses of the combined SDOF-TMD system with NSR = 10%.
Stabilization diagram for ambient vibration test with NSR = 10%.
It can be seen from Table 1 that the estimated parameters are of high accuracy except for the damping ratio of the primary structure. The estimated structural damping ratios ζ1 are of relatively large errors. The identification of ζ1 is associated with ω1, μ, ζ0, and ω0, as shown in equations (6) and (19). Hence, their errors may be propagated to the damping ratio of the primary structure ζ1. Much more accurate parameters are obtained by free vibration test rather than ambient vibration test.
Multi-degree-of-freedom structure with one TMD
The parameters identified above are based on the simplified motion equations of equation (4), where it is assumed that only one mode of vibration is involved at the nth DOF. But, in actual field testing, the vibrations in structures are often contributed by a few vibration modes, especially in ambient vibration tests. In this section, a combined system consisting of a 3-DOF structure and a TMD, as shown in Figure 7, is simulated to analyze the effect of the multimode vibration of the structure on the parameter identification. Moreover, the damping ratios of the TMD are taken as different values covering perfectly the tuning case condition and the detuned ones.
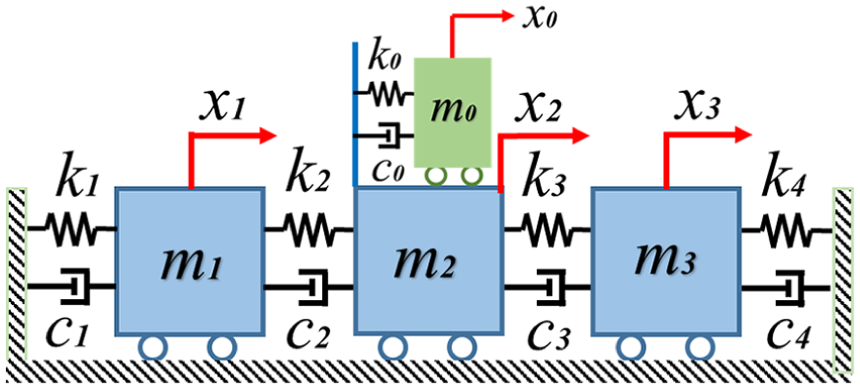
3-DOF structure and STMD combined system.
The physical parameters of the 3-DOF structure are as follows: m1 = 100 kg, m2 = m3 = 80 kg, ki = 3000 N/m, ci = 2.0 N s/m, i = 1, 2, 3, 4. The modal properties of the structure are listed in Table 2. The modal masses of the structure are estimated using the unity-scaled mode shapes. One TMD is installed atop m2 to suppress the vibration of the first mode of the primary structure. The mass ratio µ is taken as 1% which is used to design TMD. The natural frequency f0 and the damping ratio ζ0 of TMD are 0.715 Hz and 6.09%, respectively, which are tuned to the modal properties of the fundamental mode of the primary structure.
Modal parameters of the 3-DOF structure.
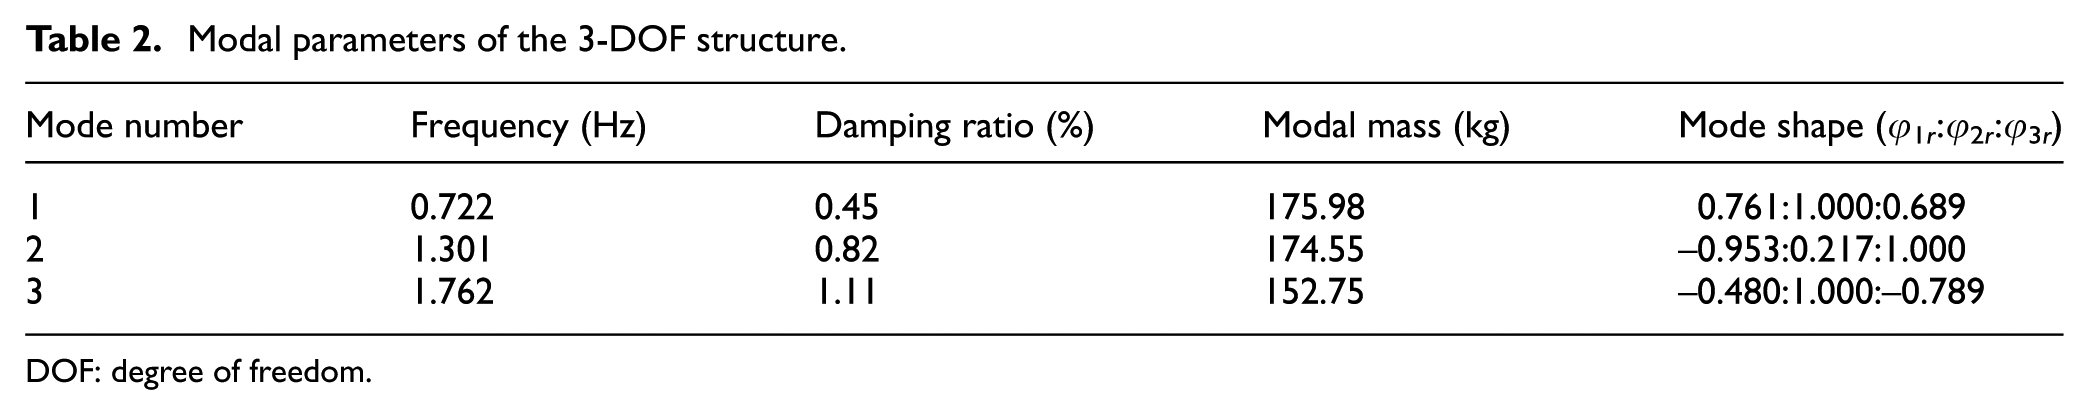
DOF: degree of freedom.
Free vibration acceleration responses of the combined system are simulated at three different initial displacements of mass m2, namely, x20 = 0 m, 0.002 m, and 0.006 m, but at a fixed TMD’s initial displacement x00 = 0.05 m. The measurement noise is not included in this simulation exercise. Figure 8 shows the acceleration responses of TMD and m2, along with their power spectral densities (PSDs) of the system subject to the applied initial displacements. It is observed that, with the increase of the initial displacement of mass m2, higher modes are excited.
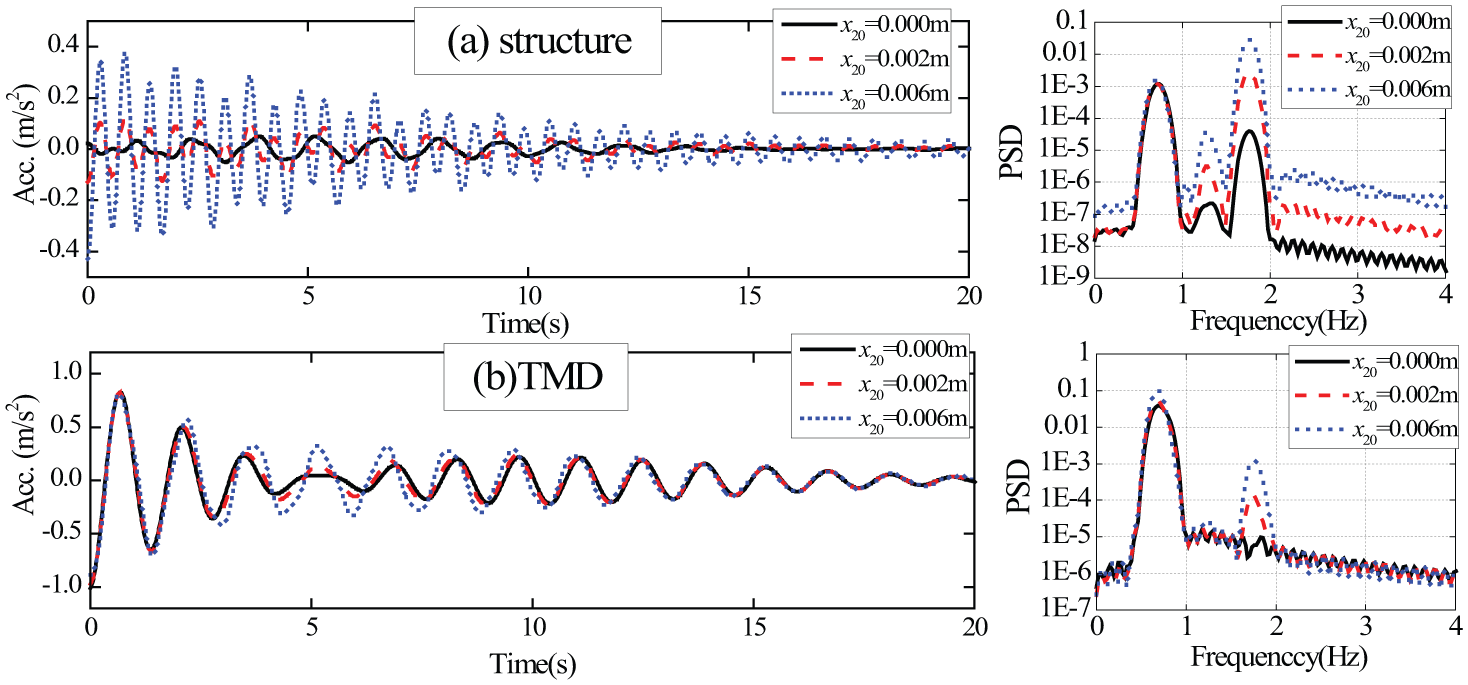
Free vibration responses and their PSDs of m2 and TMD at x00 = 0.05 m: (a) structure and (b) TMD.
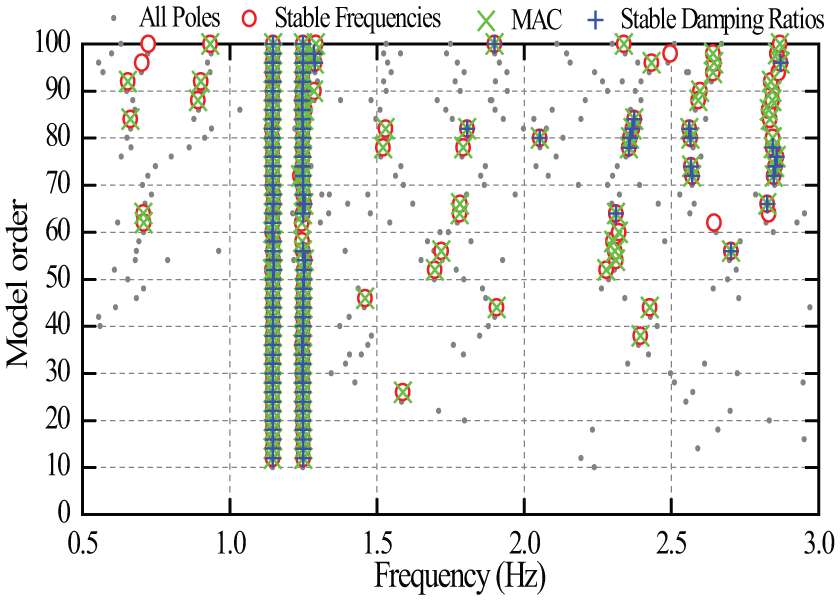
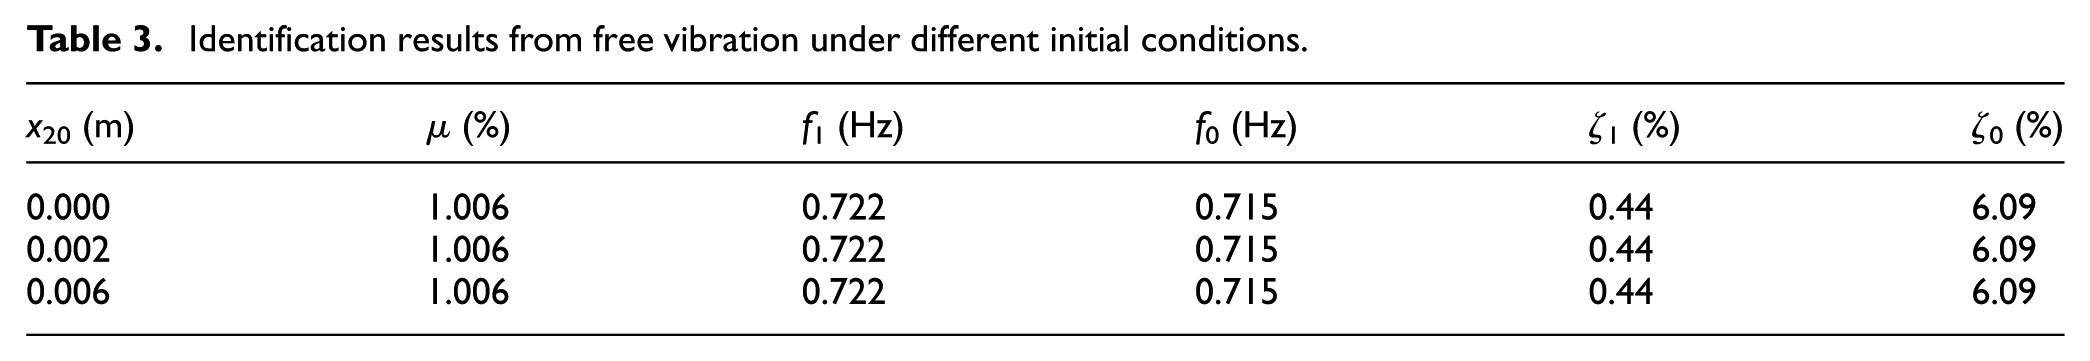
SSI is used to identify the modal properties of the combined system using different model orders. The identification results are assembled in the form of a stabilization diagram, as shown in Figure 9 for the case of x20 = 0.002 m. There are four obvious stable poles, the frequencies of which are 0.689, 0.749, 1.301, and 1.763 Hz. The frequencies of the first two stable poles are identical to the ones estimated by equation (10). Hence, the first two stable poles are selected out to construct the state matrix of the reduced 2-DOF model. The identified modal properties of the primary structure and the TMD are shown in Table 3. As the measurement noise is not considered, the estimated parameters by this method for a multi-DOF combined system are exactly identical to the theoretical values. From the numerical simulation, it is shown that the proposed method is valid when multimode response measurement data are used.
Identification results from free vibration under different initial conditions.
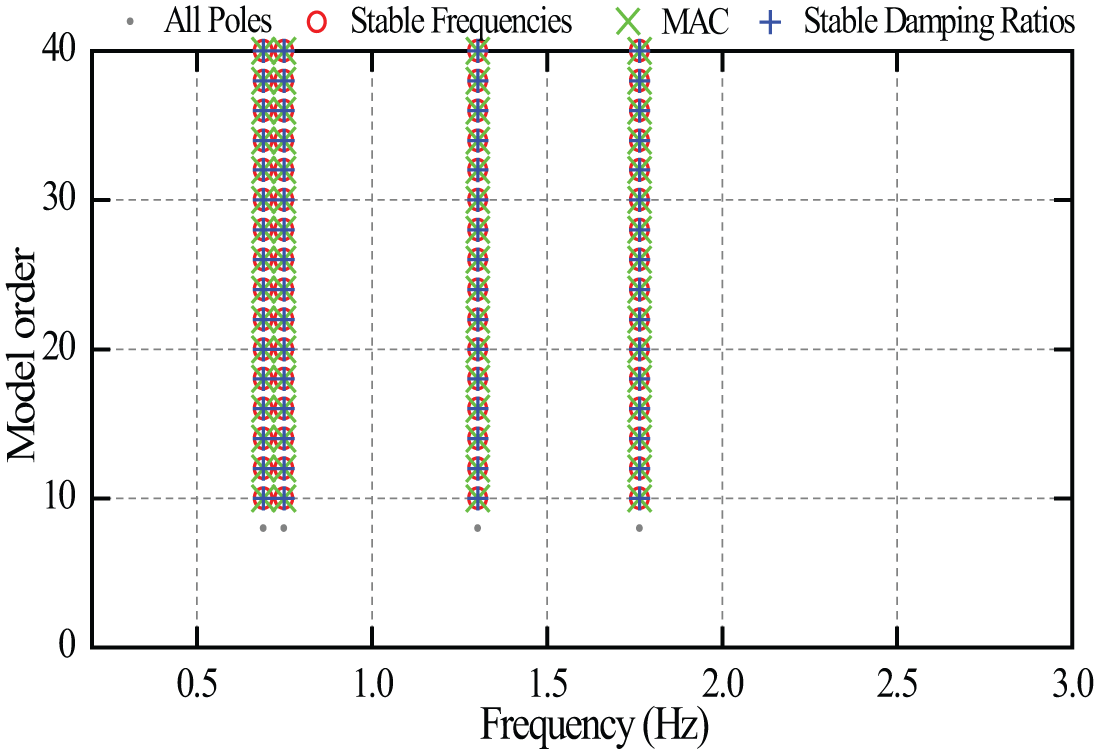
A Stabilization diagram for free vibration response at x20 = 0.002 m.
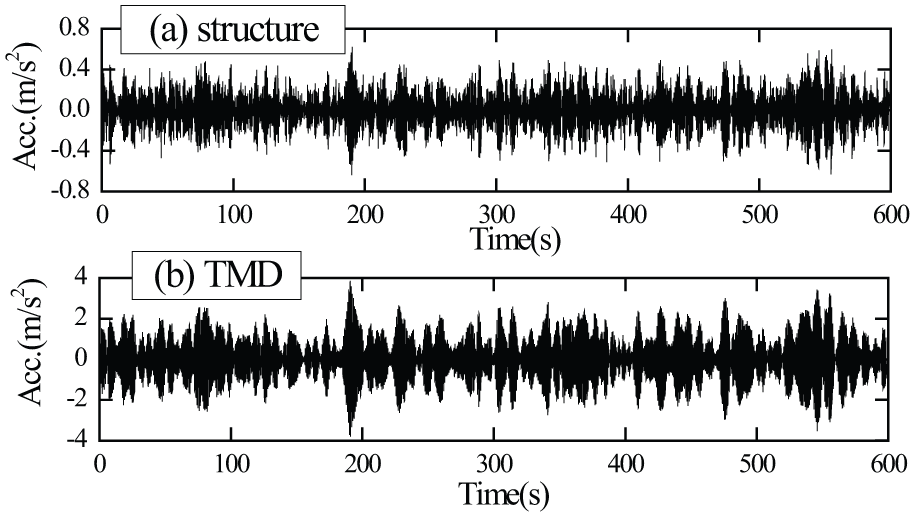
The same procedure is used for ambient vibration tests, and noise level is fixed at NSR = 10%. Figure 10 shows the acceleration responses of TMD and m2, along with their PSDs. The identified modal properties of the combined system using SSI are shown in Figure 11 for different model orders.
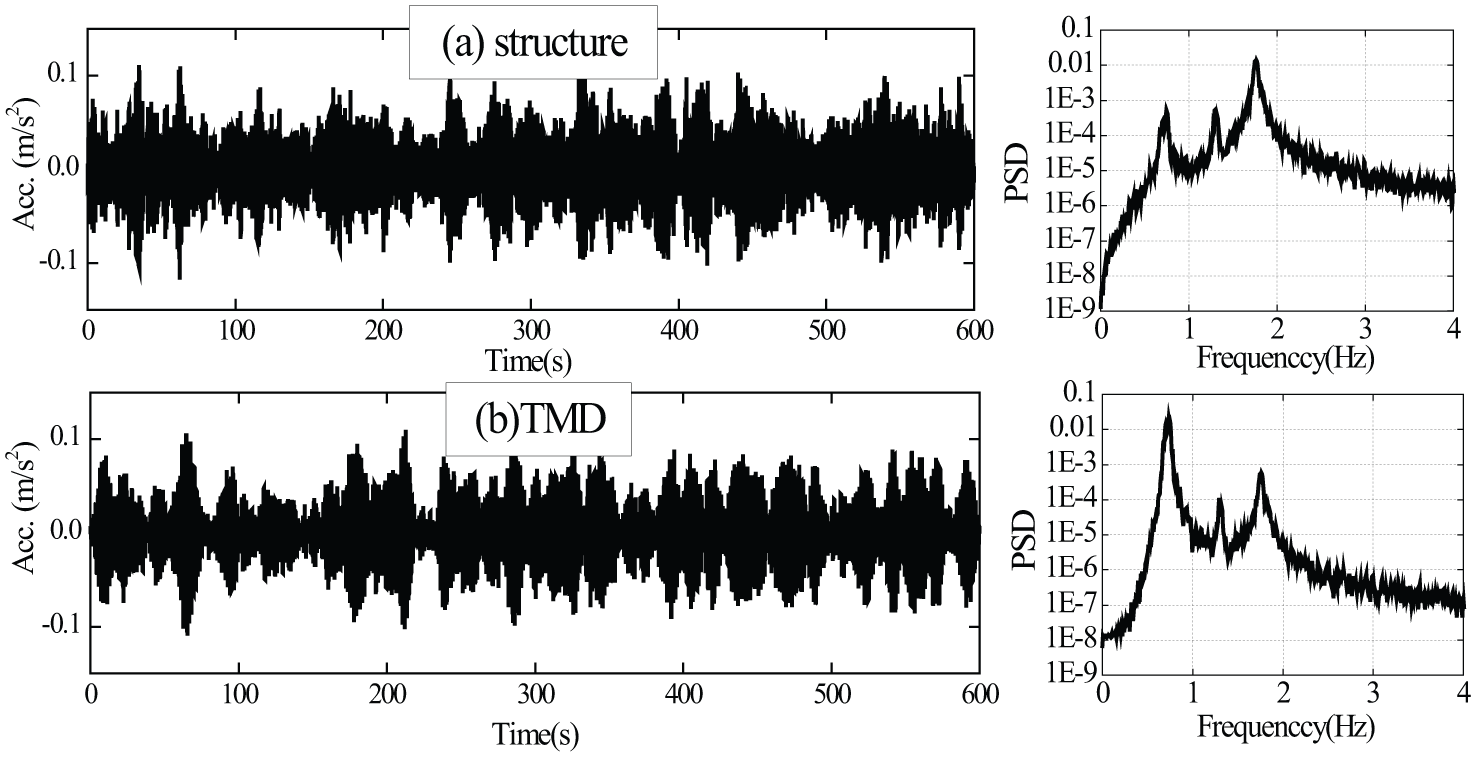
Ambient responses and their PSDs of m2 and TMD at ζ0 = 6.09%: (a) structure and (b) TMD.
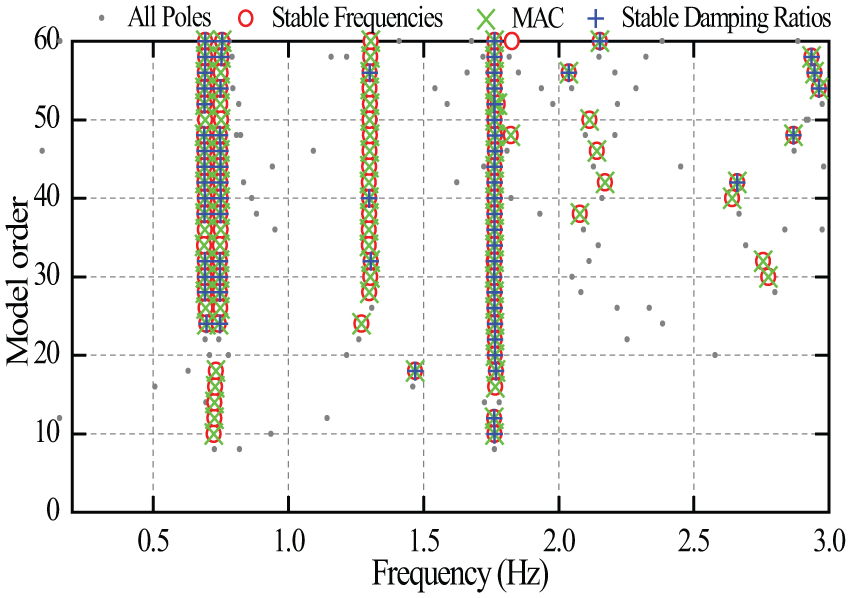
Stabilization diagram for ambient vibration test at ζ0 = 6.09%.
Table 4 summarizes the estimated modal properties of the primary structure and the TMD using the simulation data at different TMD damping ratios ζ0. The estimation error in the mass ratio is only about 5% when the damping ratio of TMD is set at 6.09%. But one can see that the estimation error in structural damping ζ1 is quite large. As shown in Figure 10, the magnitudes of PSD at the first two modes are much less than those of the remaining frequency components, due to high damping supplied by the optimally designed TMD. As such, several additional cases with the different damping ratios of the TMD are simulated and analyzed. The results are also shown in Table 4. With the decrease of the damping ratio of the TMD, the errors in the estimated parameters decrease. A significant improvement in the identification accuracy is obtained for the TMD detuning case which can be realized by reducing the damping in TMD.
Identification results by ambient vibration tests at different TMD damping.
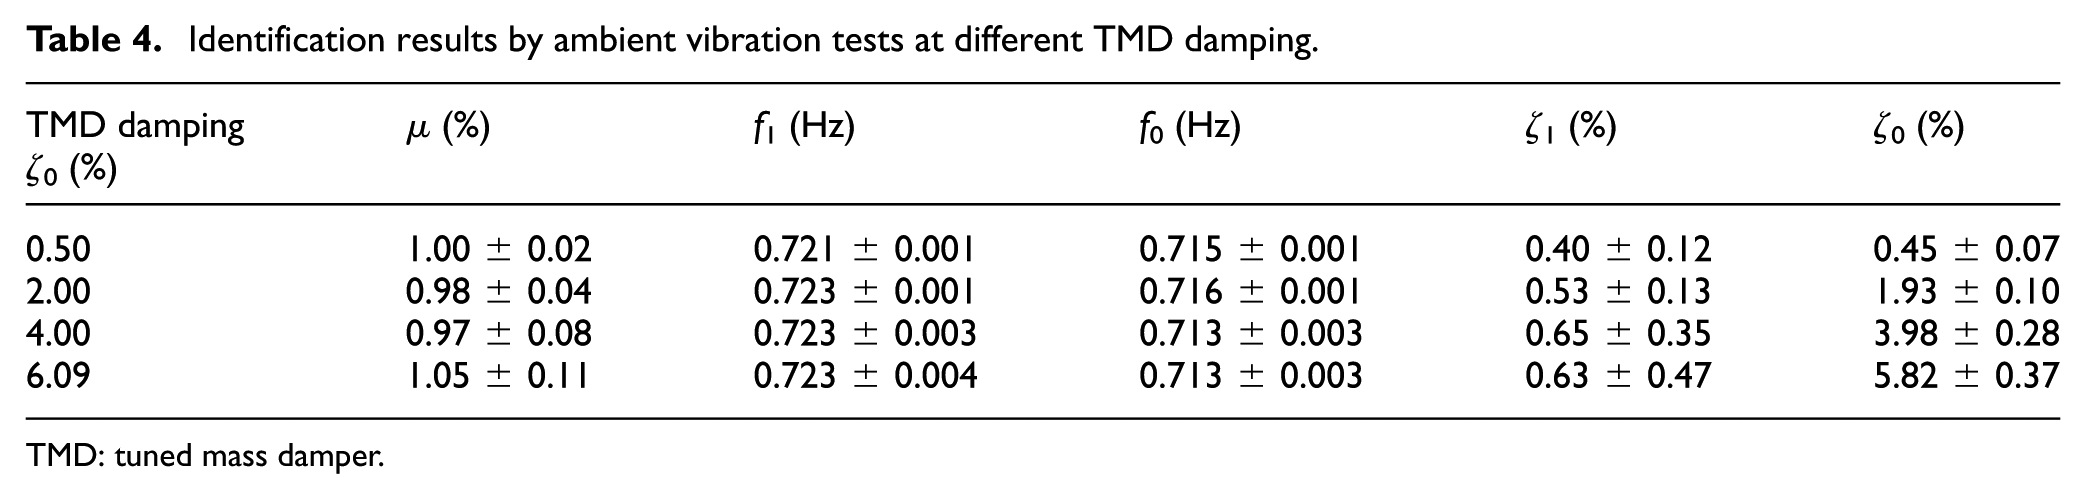
TMD: tuned mass damper.
Experimental validation
Description of frame structure and TMD
Laboratory experiments are conducted to further validate the proposed method for identifying the respective modal properties of the primary structure and the TMD. Figure 12 shows the investigated frame structure with the experimental setup. The primary structure can be considered as a single-story steel frame. The mass for the structure is mainly concentrated atop which suggests that the structure can be well approximated by an SDOF system. The TMD is made of a cantilever beam, an assembly mass, and an eddy current damping element atop the cantilever beam, as shown in Figure 13. At the lower velocity of vibration, the eddy damping is ideally linear viscous. The TMD and the structure are coupled by fixing the TMD on the platform of the structure. In this example, the modal properties of the primary structure and the TMD are identified from the responses of the combined system, and the results are compared with those identified from the two individual systems separately.
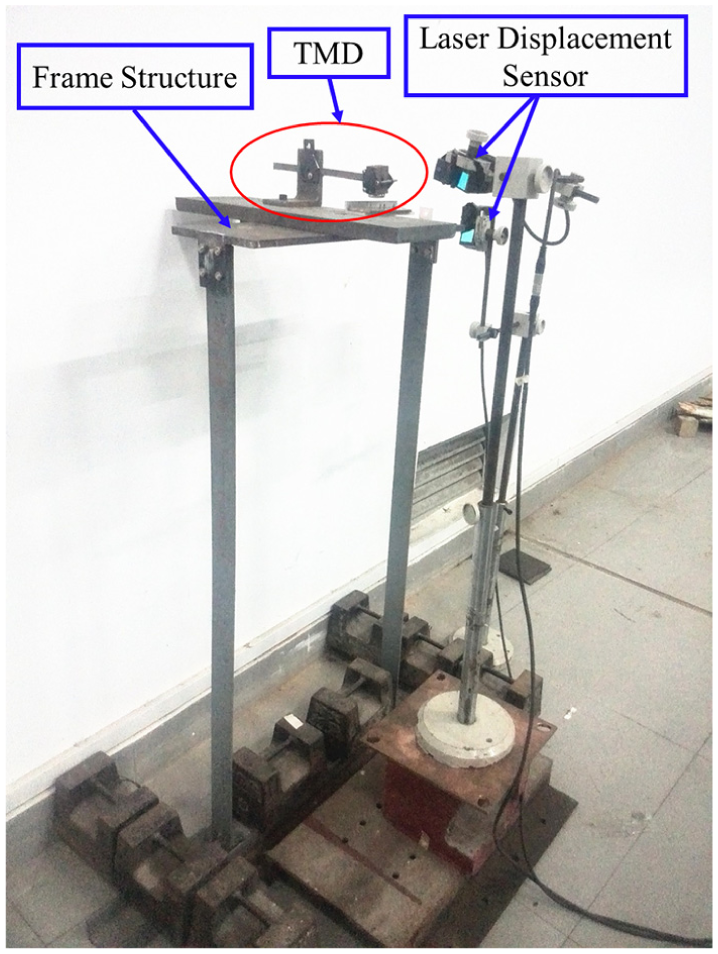
Experimental setup of frame structure and TMD.
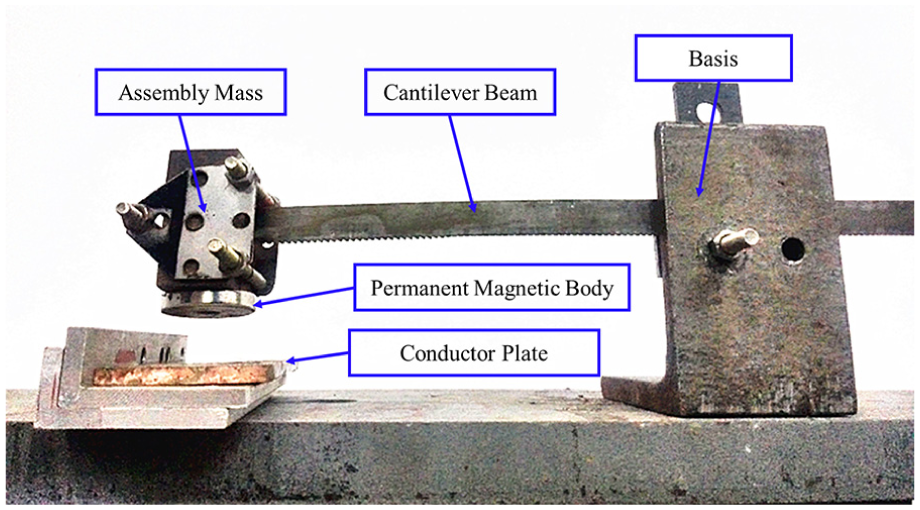
Details of TMD with eddy current damping.
Identification of primary structure and TMD
The modal properties of the frame structure and those of the TMD are first identified by the conventional method, respectively. For the steel frame, a sinusoidal shaker is used to excite the structure at varying frequencies and the FRF is obtained to estimate the modal properties of the frame structure only. The modal frequency (f1), modal damping (ζ1), and modal mass (m1) based on the unity-scaled mode shape corresponding to the fundamental modes of the steel frame only are identified as 1.579 Hz, 0.12%, and 27.9 kg, respectively. The modal mass identified includes the mass atop the frame and the equivalent mass of the supporting beam. The modal frequency (f0), modal damping (ζ0), and mass (m0) for the TMD are 1.529 Hz, 4.9%, and 0.19 kg, respectively.
Modal properties of the primary structure and of the TMD are then identified from the dynamic responses of the combined system. Both free vibration and ambient vibration are used to excite the combined structure–TMD system, and the displacement responses are employed to identify the modal proprieties using SSI. Figures 14 and 15 show the recorded displacements of the frame top and the TMD. Table 5 shows the modal properties of the primary structure and the TMD identified from the combined system. Compared to those identified from two individual systems separately, it is shown that the free vibration tests produce very good results while there are some deviations for ambient vibration tests.
Modal properties of the primary structure and of the TMD.
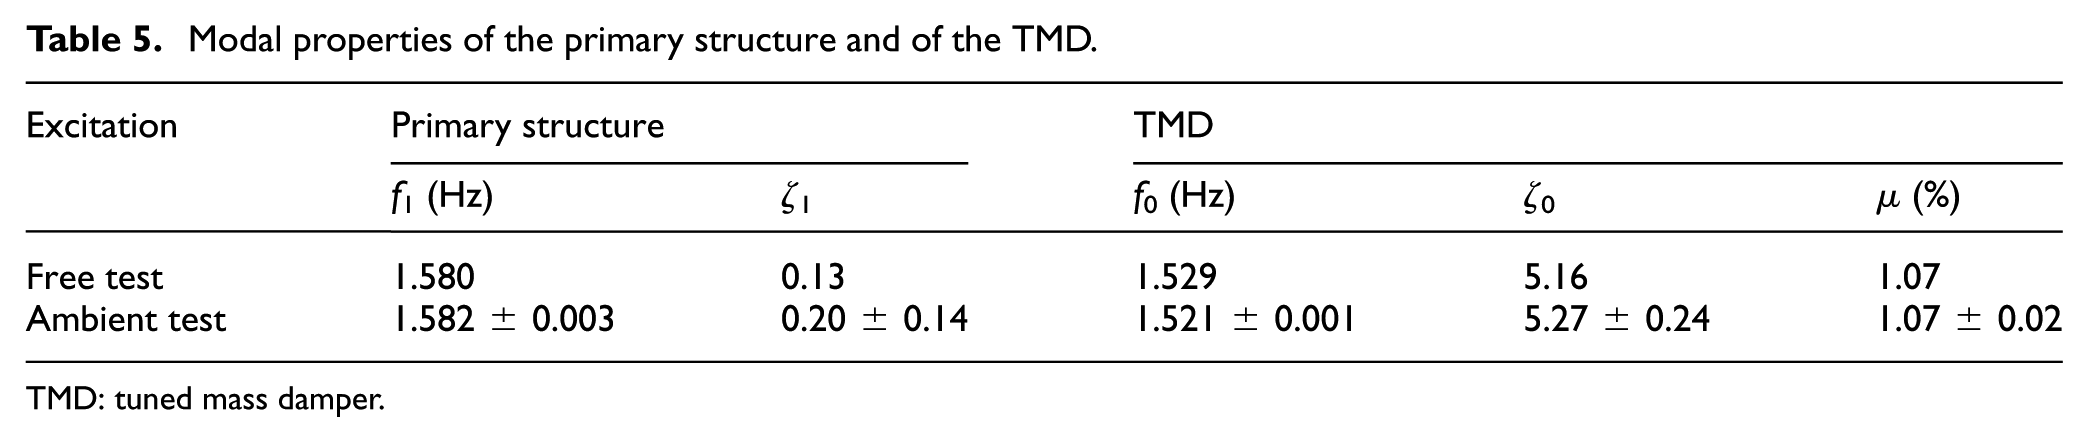
TMD: tuned mass damper.
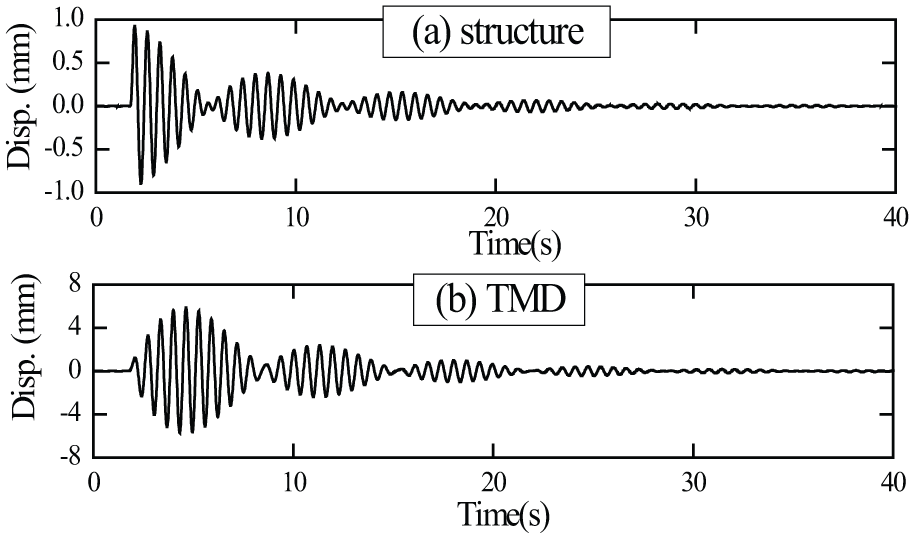
Free decay displacements at the frame top and TMD: (a) structure and (b) TMD.
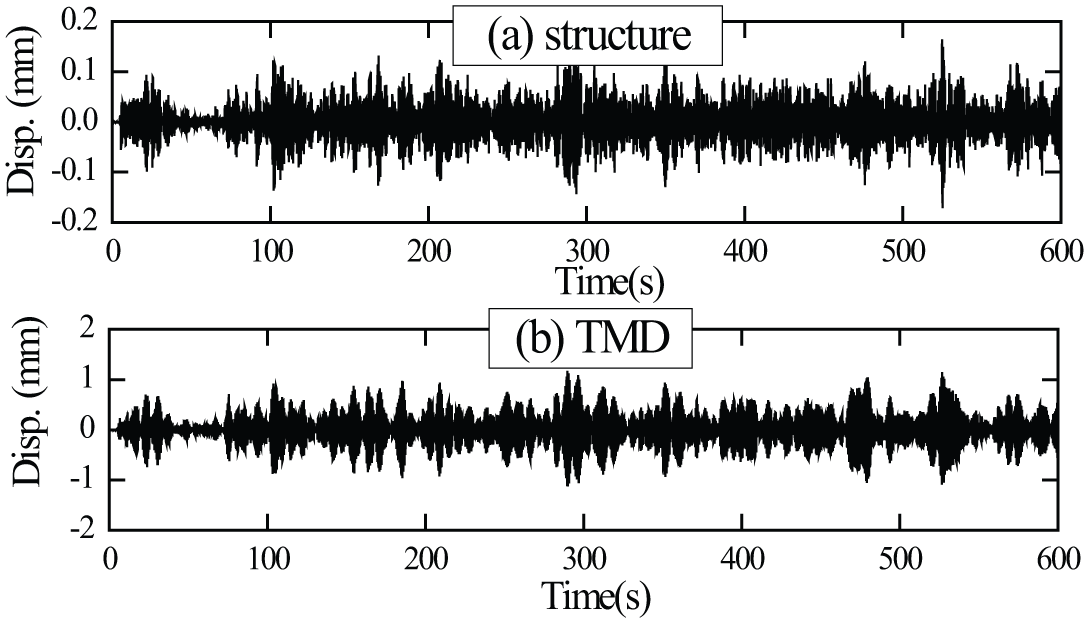
Ambient vibration displacements at the frame top and TMD: (a) structure and (b) TMD.
Effect of TMD detuning
In practice, as the modal properties of both the primary structure and the TMD are not accurately known, the TMD is usually not perfectly tuned to the controlled mode of the primary structure. Therefore, both the frequency detuning and the damping detuning of the TMD are likely to occur. Their influence on parameter identification is evaluated experimentally.
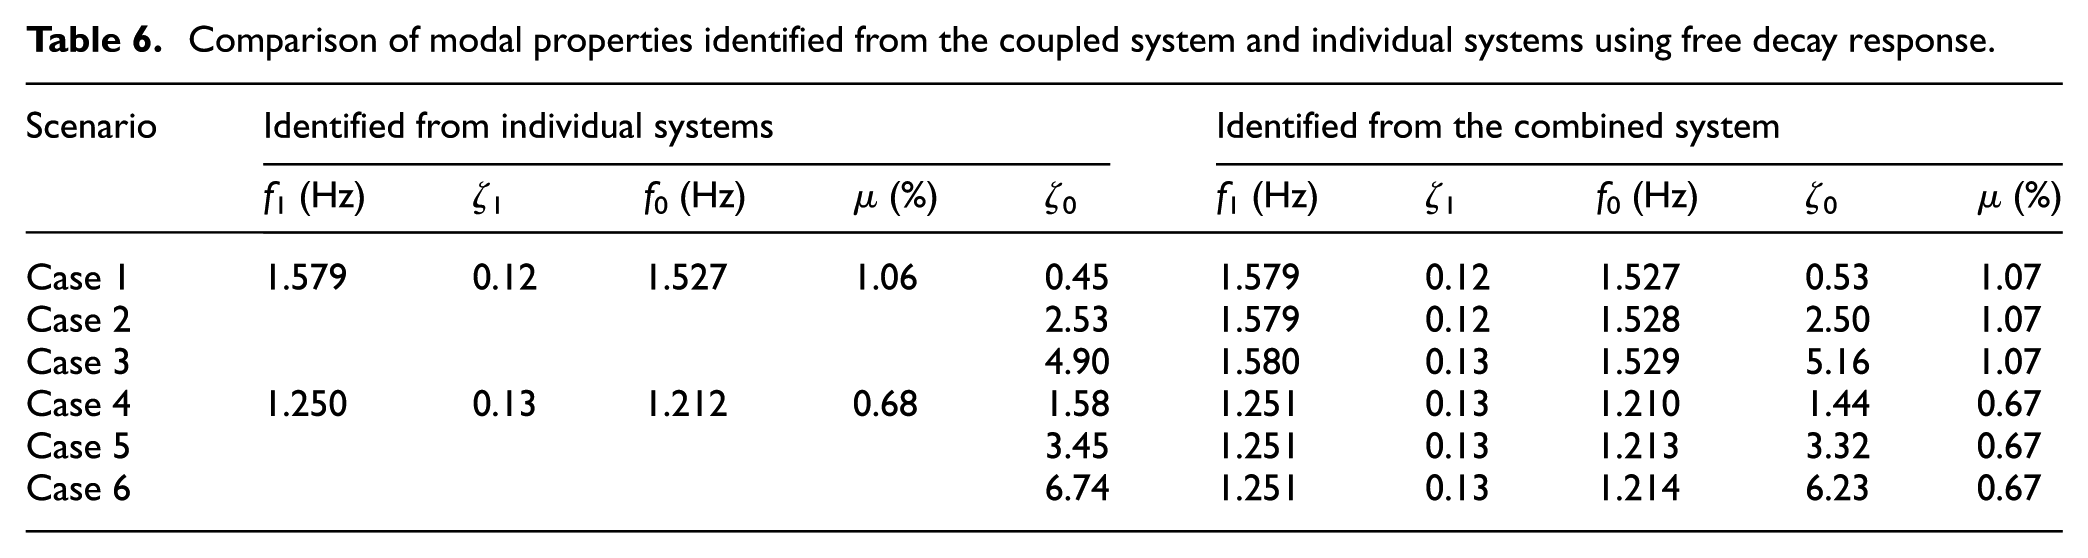
For the damping detuning, the TMD damping in the experiments is reduced; while for the frequency detuning, the modal frequency of the primary structure is reduced by placing extra mass block on the frame top. Free decay acceleration responses are first used to identify the respective modal properties of the structure and TMD. Table 6 shows the comparison of the results obtained from the proposed method with those obtained from the individual systems. It is seen that the modal properties identified from the combined system and from the individual systems are very close to each other. For this simple frame without closely spaced modes, only two modes are involved when it is equipped with TMD, regardless of whether the TMD frequency is tuned or detuned to the controlled mode of the primary structure.
Comparison of modal properties identified from the coupled system and individual systems using free decay response.
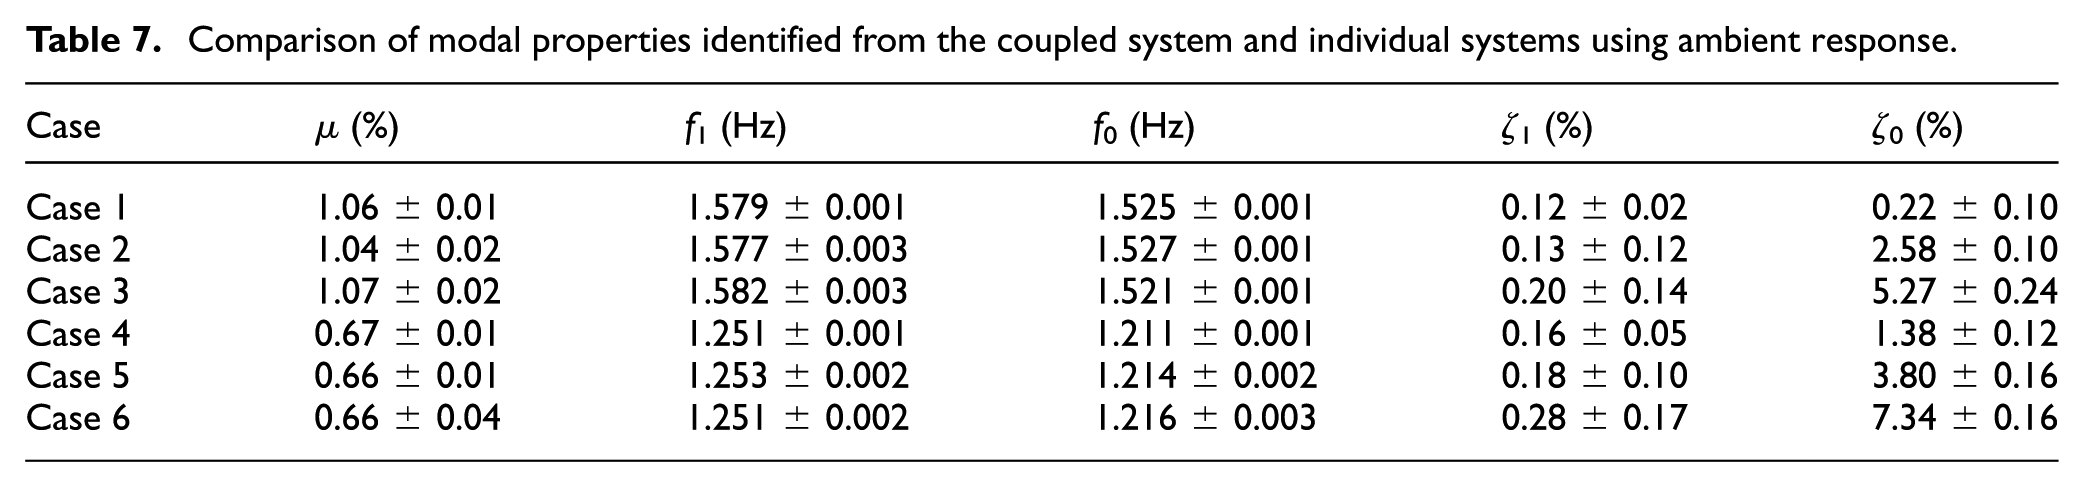
The ambient responses obtained under different TMD parameters are used to identify the modal properties from the ambient data. Table 7 summarizes the main results. When the TMD is perfectly tuned to optimal damping, the estimated damping ratio of the primary structures is of considerable error and large uncertainty bound. When the TMD damping is reduced to a lower level, improved estimation results are obtained. It can be explained that the controlled mode of the primary structure is less damped in the case of TMD detuning.
Comparison of modal properties identified from the coupled system and individual systems using ambient response.
Conclusion
A new method is proposed to extract the respective modal properties of the structure and the TMD from dynamic responses of the combined structure–TMD systems. It has been shown that the proposed method correctly identifies the modal properties of the two separate systems through numerical simulation and laboratory experiments, and the effect of the noise on parameter identification is not significant. When the TMD is not perfectly tuned to the target modes of the primary structure, more accurate identification results can be achieved. This can be explained that the concerned mode of the primary structure is less damped in the case of TMD detuning. It should be noted that the method is only applicable to the structure with the well-separated structural modes.
Footnotes
Declaration of Conflicting Interests
The author(s) declared no potential conflicts of interest with respect to the research, authorship, and/or publication of this article.
Funding
The author(s) disclosed receipt of the following financial support for the research, authorship, and/or publication of this article: This study was sponsored by the National Science Foundation of China (Program Nos. 51422806 and 51708208). The support from the State’s Key Project of Research and Development Plan (No. 2016YFE012790) is also greatly acknowledged.