



Abstract
This article presents an experimental study on the screw connections between cold-formed steel walls and cement-based boards such as fibercement boards and ferrocement boards. The effect of loading direction, type of sheathing, board thickness, and screw number and spacing were investigated. Tests were performed under shear which is perpendicular to the free edge and also under shear which is parallel to the free edge of the board to simulate the actual behavior of sheathed shear walls. In each case, the peak load and displacement, elastic load and displacement, elastic stiffness and ductility were found and compared to other cases. The results of the 20 test reported in the paper showed that connection strength obtained under parallel loading was much higher than those obtained under perpendicular loading while as the displacements obtained under parallel loading were much larger than those obtained under perpendicular loading. Consequently, the elastic stiffness values were found to be smaller under parallel loading than under perpendicular loading. The results also showed that fibercement boards had much higher strength than ferrocement board, and that the screw strength increased nearly linearly with the board thickness.
Introduction
Cold-formed steel (CFS) wall systems present an efficient alternative to other conventional construction systems commonly used as load bearing elements in low and mid-rise residential and office buildings. Their advantages include high strength-to-weight ratio, ease and speed of construction, and ductility. Walls are usually made of CFS vertical studs sheathed with different materials to provide architectural finish. Commonly used sheathing material includes steel sheets, gypsum boards (GB), and oriented stranded boards (OSB). Cement-based boards (CB) are composed of cement and sand with some reinforcing element such as cellulose fibers in the case of fibercement boards (FBB) or one layer of expanded metal or light wire mesh in the case of ferrocement boards (FCB). Cement-based boards presents a strong alternative to other sheathing material such as GB and OSB in addition to improved fire resistance. In addition, cement-based boards are water-resistant and thus can be used as external cladding without additional water proofing as opposed to GB and OSB. Also GB and OSB are susceptible to mold while cement-based boards are not.
Sheathing boards are usually connected to the CFS sections using self-drilling screw connections. If the boards have adequate structural strength and stiffness, they may be considered to act compositely with the CFS wall studs. This composite effect is beneficial in walls under vertical loads and also for the compression chord of shear walls under lateral loads. In this case, the boards provide effective bracing to the compression studs against local, distortional, and global buckling. Furthermore, the current AISI lateral design standard AISI S213-07/S1-09 (2012) allows the boards used in shear walls to act as vertical diaphragms in transmitting the applied lateral loads to the wall supports replacing the conventional X-bracing members. The standard contains tables of nominal shear strength of shear walls for some special cases of commonly used sheathing material such as steel, GB, OSB, and fiberboard. Many experimental studies cover the structural behavior of sheathed CFS walls. Most of these studies are mainly focused on commonly used sheathing material such as GB (Lange and Naujoks, 2006; Pan and Shan, 2011; Vieira and Schafer, 2012; Ye et al., 2015), OSB (Baran and Alica, 2012; Buonopane et al., 2015; Fülöp and Dubina, 2004; Liu et al., 2014), and steel (DaBreo et al., 2014; Yu and Chen 2011). Fewer studies cover other not-commonly used sheathing material such as calcium silicate boards (Lin et al., 2014; Nithyadharan and Kalyanaraman, 2012) and cement-based boards (Baldassino et al., 2014; Khaliq and Moghis, 2017).
These studies have shown that the strength of sheathed CFS walls is greatly affected by the structural behavior of screw connections. This behavior is more complicated than the behavior of bolted connections in conventional hot rolled steel framing because of the flexibility of thin plate components of the CFS sections and of the associated sheathing. Tilting of the screw, pull-over of the screw, bearing of the steel plates, and/or the sheathing board material contribute to this complexity. It is therefore common for CFS design codes to rely on test results for the governing design rules. Most of the available experimental studies of screw connections are mainly focused on commonly used sheathing material such as GB, OSB, and steel. Chen et al. (2016), Fiorino et al. (2007, 2008), Peterman et al. (2014), Vieira and Schafer (2012), Ye et al. (2016), and Henriques et al. (2017) performed experimental studies on GB and OSB under different loading and geometric conditions. Fewer studies cover other not-commonly used sheathing material. Nithyadharan and Kalyanaraman (2011) and Ye et al. (2016) presented experimental studies on screw connections between CFS and calcium silicate boards (CSB). Fiorino et al. (2008, 2017a, 2017b), Swensen et al. (2015), and Shahi et al. (2013) presented experimental studies on cement-based boards (CB). Ye et al. (2016) performed an experimental study on screw connections of Bolivian magnesium board (MGB). Table 1 and Figures 1 and 2 compare the results extracted from the cited papers of all these tests. In order to minimize the effect of the differences in geometric and loading conditions, the plotted values have been normalized with respect to a screw diameter of 4.2 mm and a board thickness of 10 mm. Nevertheless, the results show the great scatter of results even for the same sheathing material. More research is therefore needed to fully understand the effect of sheathing material on the structural behavior of screw connection.
Literature review of screw strength test results.
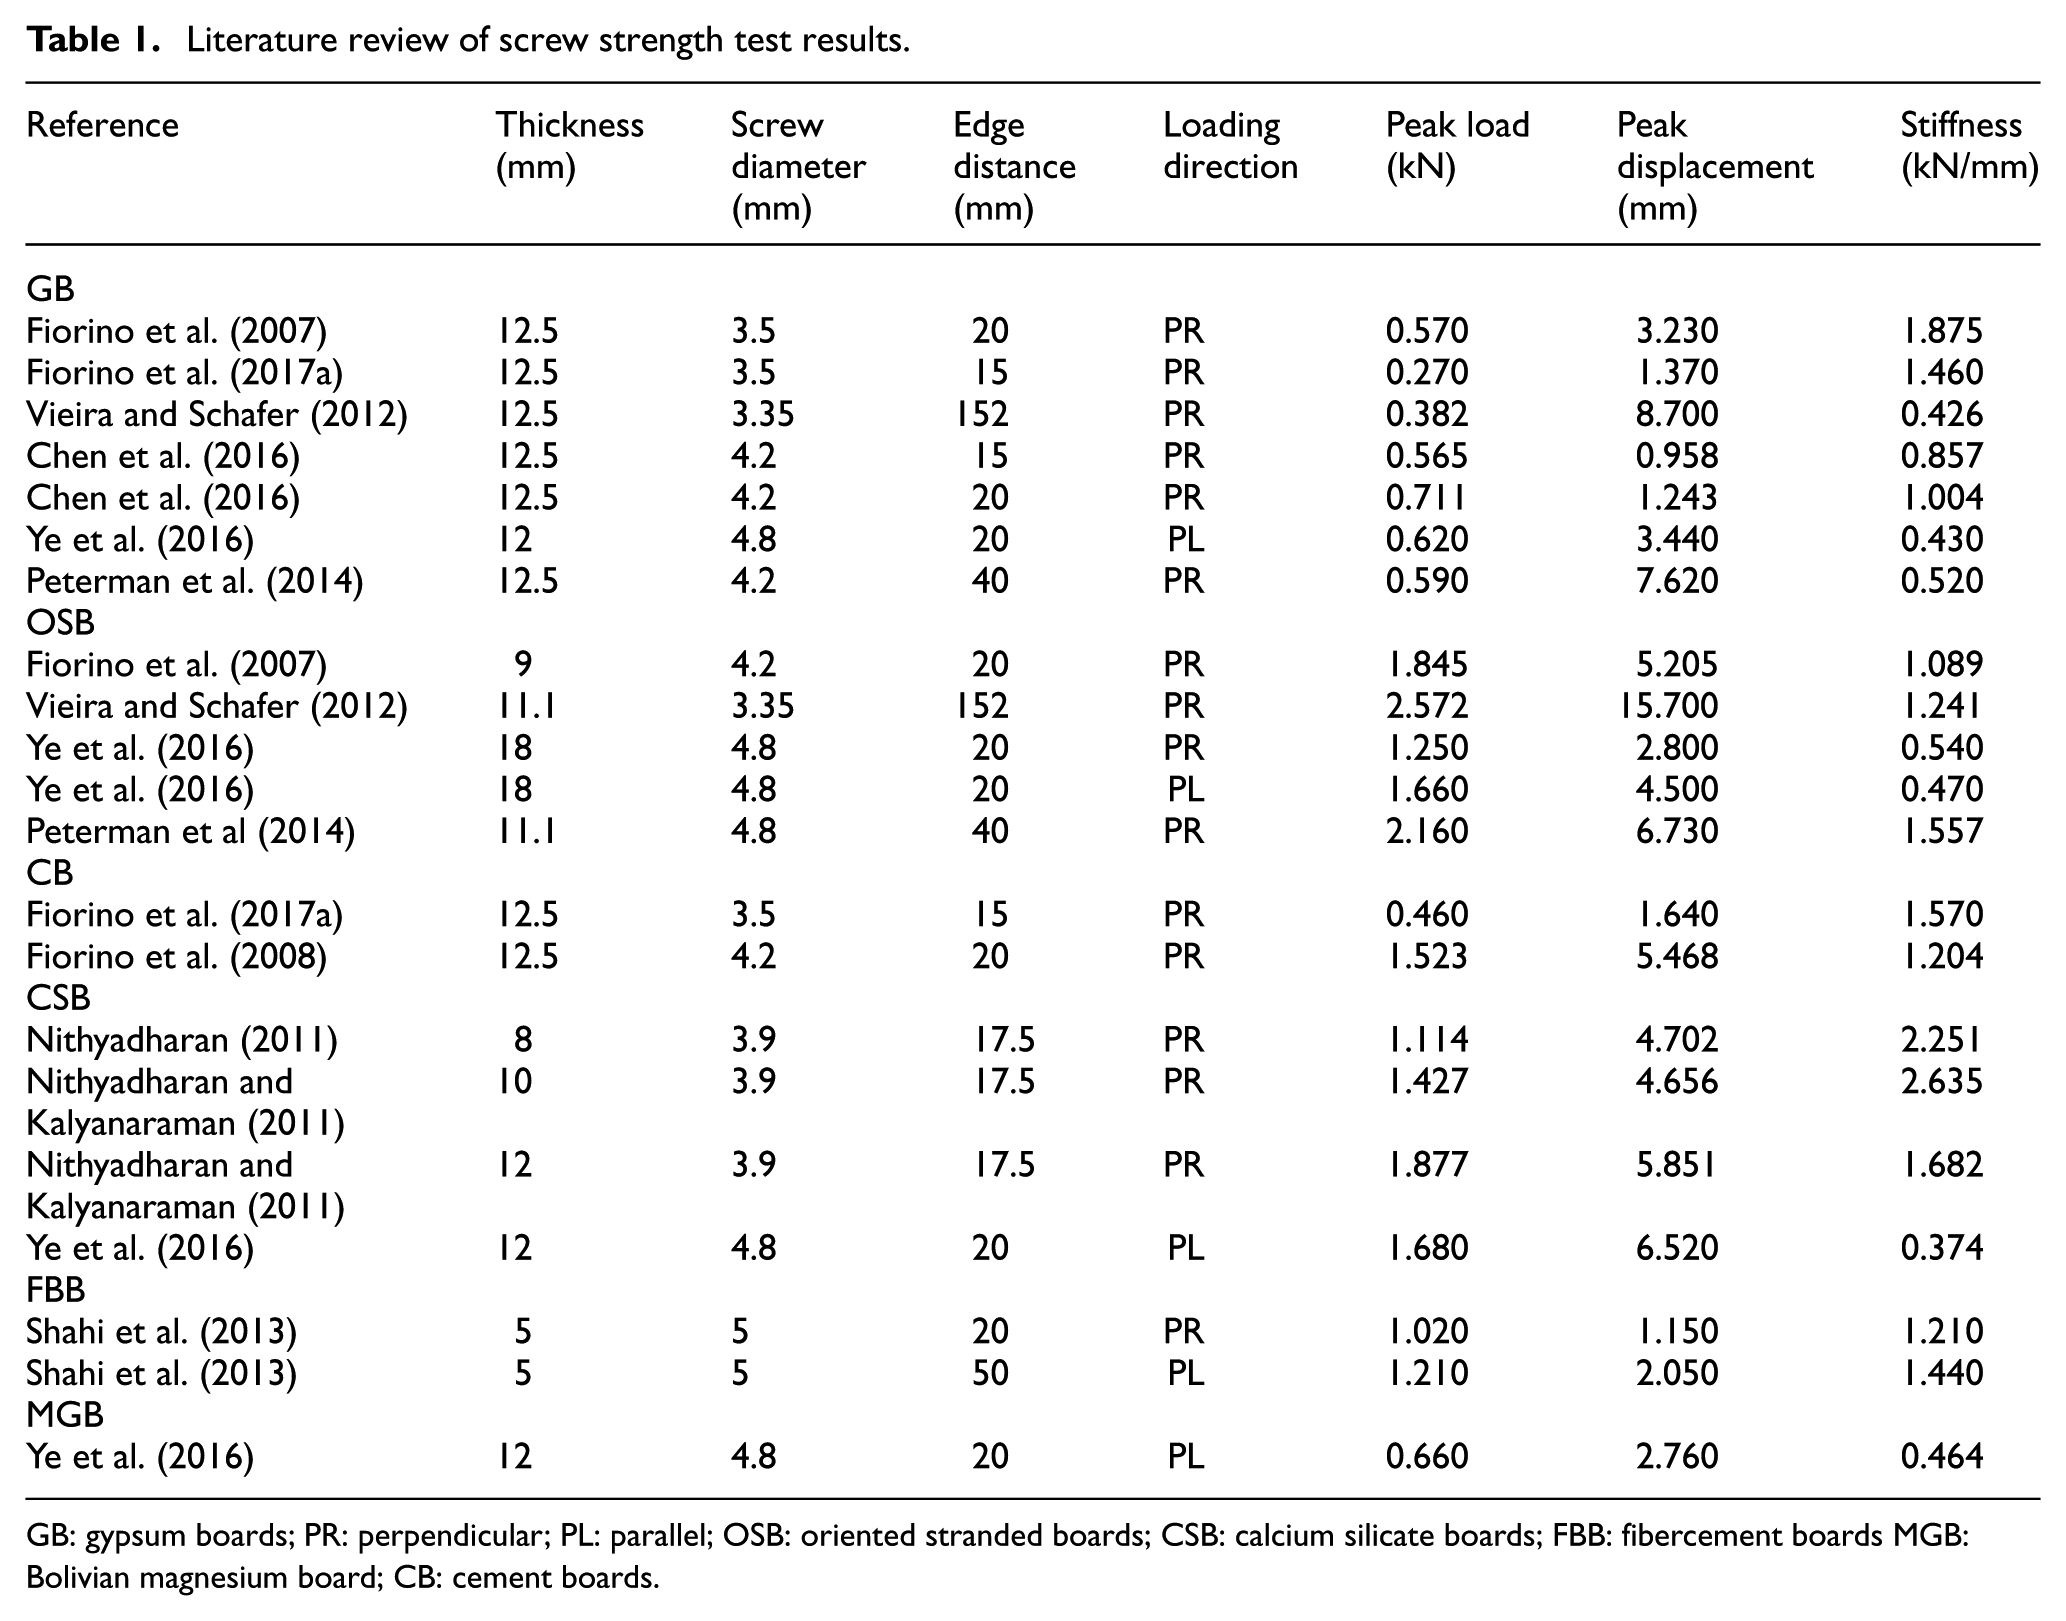
GB: gypsum boards; PR: perpendicular; PL: parallel; OSB: oriented stranded boards; CSB: calcium silicate boards; FBB: fibercement boards MGB: Bolivian magnesium board; CB: cement boards.
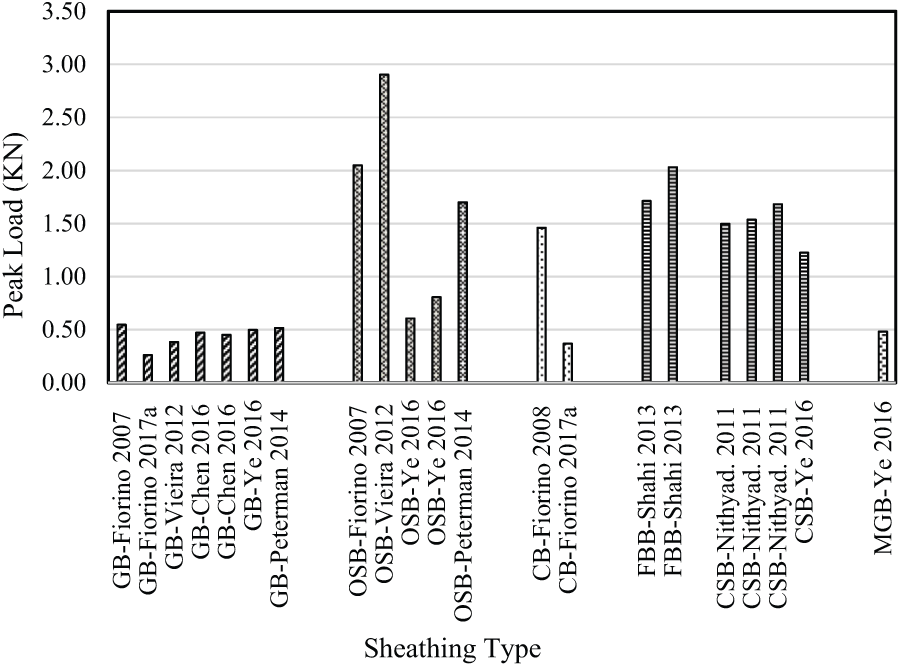
Comparison of peak load test results for different sheathing materials.
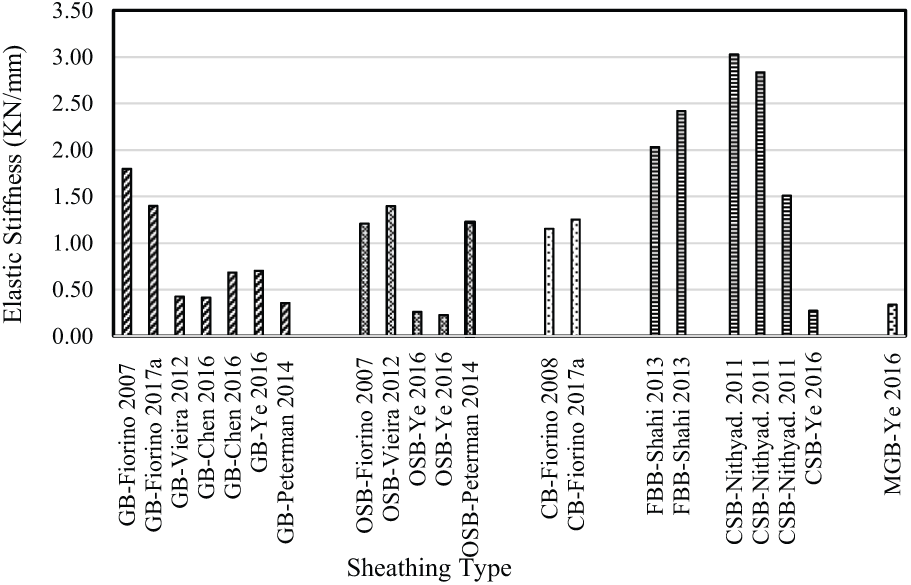
Comparison of elastic stiffness test results for different sheathing materials.
Furthermore, the shear load in most of these tests is applied perpendicular to the free edge of the board. In reality, the shear loads in screw connections of sheathed CFS shear walls are essentially parallel to the free edge. The structural behavior of these two types of connections is different and using the results obtained under perpendicular loading is very conservative when compared with the results obtained under parallel loading.
This article presents an experimental study of the structural behavior of screw connections used to connect CFS walls to CB. The experimental study involved full-scale testing of 20 CFS screw connections under different geometric and loading conditions to investigate the effect of different parameters on the structural behavior. The studied parameters included the loading direction, type and thickness of sheathing, and screw spacing. In each case, the peak load and displacement, elastic load and displacement, elastic stiffness and ductility were found and compared to other cases.
Experimental program
Study objectives
The objectives of this research are to study the behavior of screw connections in CFS walls with cement board sheathing. Two types of cement boards are covered: FBB using cellulose fibers and FCB reinforced with one layer of expanded metal. The main objectives are as follows:
To evaluate the effect of the applied shear direction (shear applied perpendicular to the free edge versus shear applied parallel to the free edge).
To evaluate the effect of sheathing type and thickness of FBB and FCB.
To evaluate the effect of screw spacing and screw number, for example, single-screw connections versus multiple-screw connections.
To achieve these objectives, an experimental program composed of 20 tests was conducted at the Concrete Research Laboratory of the Faculty of Engineering at Cairo University. The 20 tests were grouped as follows:
Group 1: Eight tests conducted on FBB under shear which is applied parallel to the free edge. The parameters changed in this group were the board thickness (9 and 12 mm) and the number and spacing of screws (one and three screws spaced at 80 mm).
Group 2: Four tests conducted on 10 mm FCB under shear which is applied parallel to the free edge. The parameter changed in this group was the number of screws (one and three screws spaced at 80 mm).
Group 3: Eight tests conducted on FBB under shear which is applied perpendicular to the free edge. The parameters changed in this group were the board thickness (9 and 12 mm) and the spacing of screws (80 and 130 mm). No tests were conducted with only one screw under shear which is perpendicular to the free edge due to the very small strength associated with this connection.
It should be noted that AISI S905-08/S1-11 (2011) standard for connection testing requires a minimum of three specimens to be tested for each variable. Accordingly, the data obtained under this experimental program are not repeatable since only two specimens were tested for each variable.
The test matrix is shown in Table 2. The specimens were named according to the following convention: board type (FBB for Fibercement boards and FCB for ferrocement boards), test number in group (1 for first test and 2 for second test), board thickness in millimeter, shear direction (PL for parallel and PR for perpendicular), number of tested screws (1 for single-screw tests and 3 for three-screw tests), and screw spacing (0 for single-screw tests). For example, FBB-1-12-PL-1-0 corresponds to first test of 12 mm fibercement board tested with single screw under parallel shear.
Test matrix for screw connections.
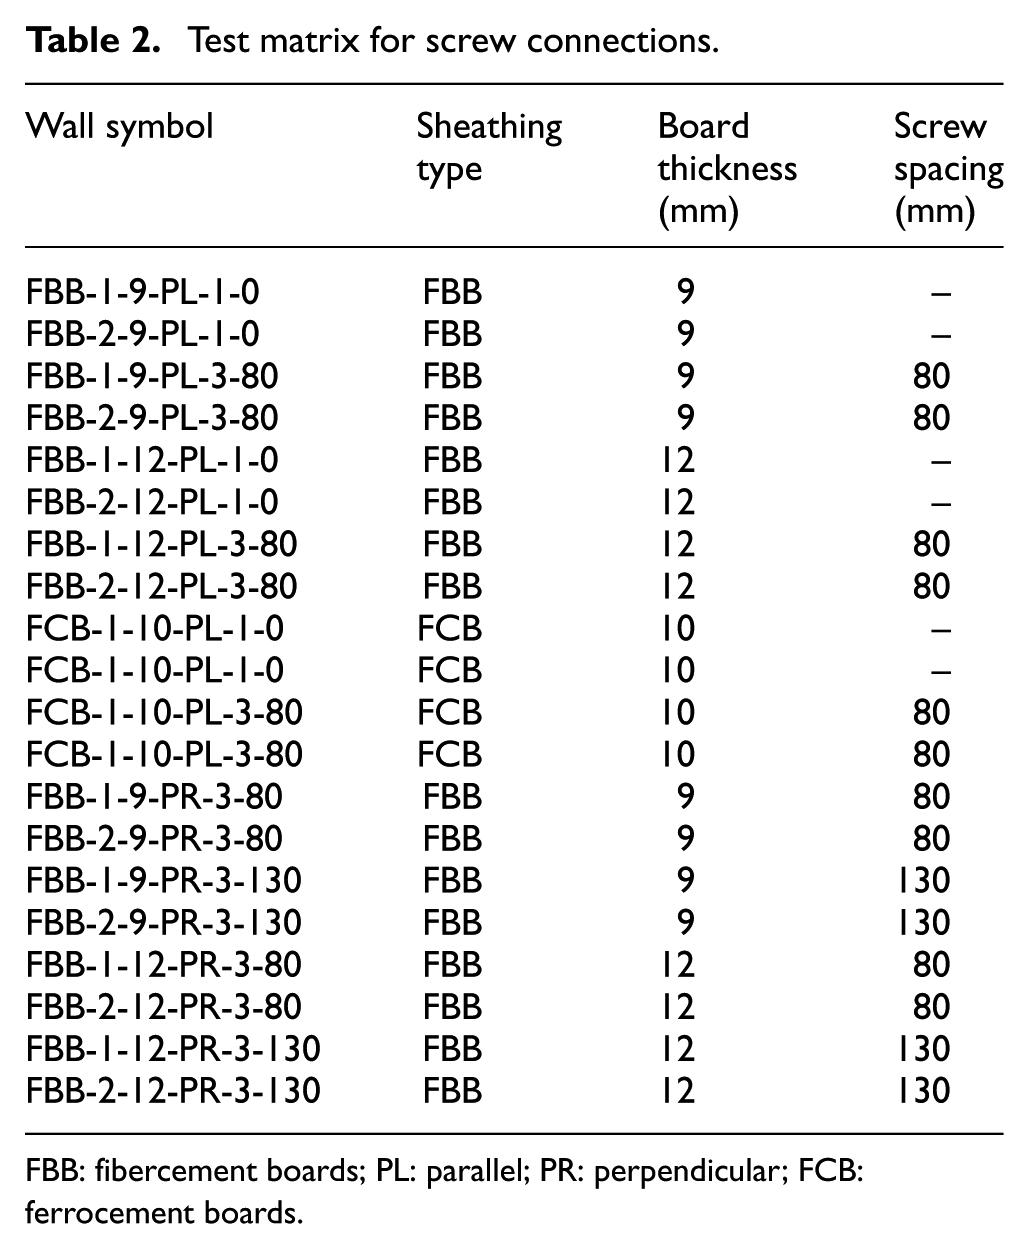
FBB: fibercement boards; PL: parallel; PR: perpendicular; FCB: ferrocement boards.
Tests of connections with shear applied perpendicular to the free edge
Test setup
The setup for testing screw connections under shear which is applied perpendicular to the board’s free edge is shown in Figure 3. It consisted of a pair of sheathing board segments connected to each side of the flanges of an upper and a lower stud assembly each having two CFS lipped channels of size 120 × 60 × 15 × 1.2 mm interconnected at their inner flanges using six hexagon head screws size ϕ6.25 × 25 mm. The lower assembly was clamped to the lower beam of the test frame to prevent any lateral movement. The upper assembly was strengthened by three CFS channels connected transversally to minimize the effect of bending on the upper assembly. The sheathing board segments were connected to the upper assembly using three screws on each side (flat countersunk size ϕ4.2 × 25 mm). The edge distance perpendicular to the free edge was set at 20 mm for all test specimens. The screw spacing parallel to the free edge was either 80 or 130 mm. In order to force the failure to occur in the upper part, the sheathing board segments were connected to the lower stud assembly using six screws on each side. Based on this arrangement, the measured relative displacements at the tested screws were considered to represent the connection displacements and used to calculate the elastic stiffness while the displacements at the oversized end were neglected. This assumption is used in all tests of similar connection (e.g. Fiorino et al., 2007).
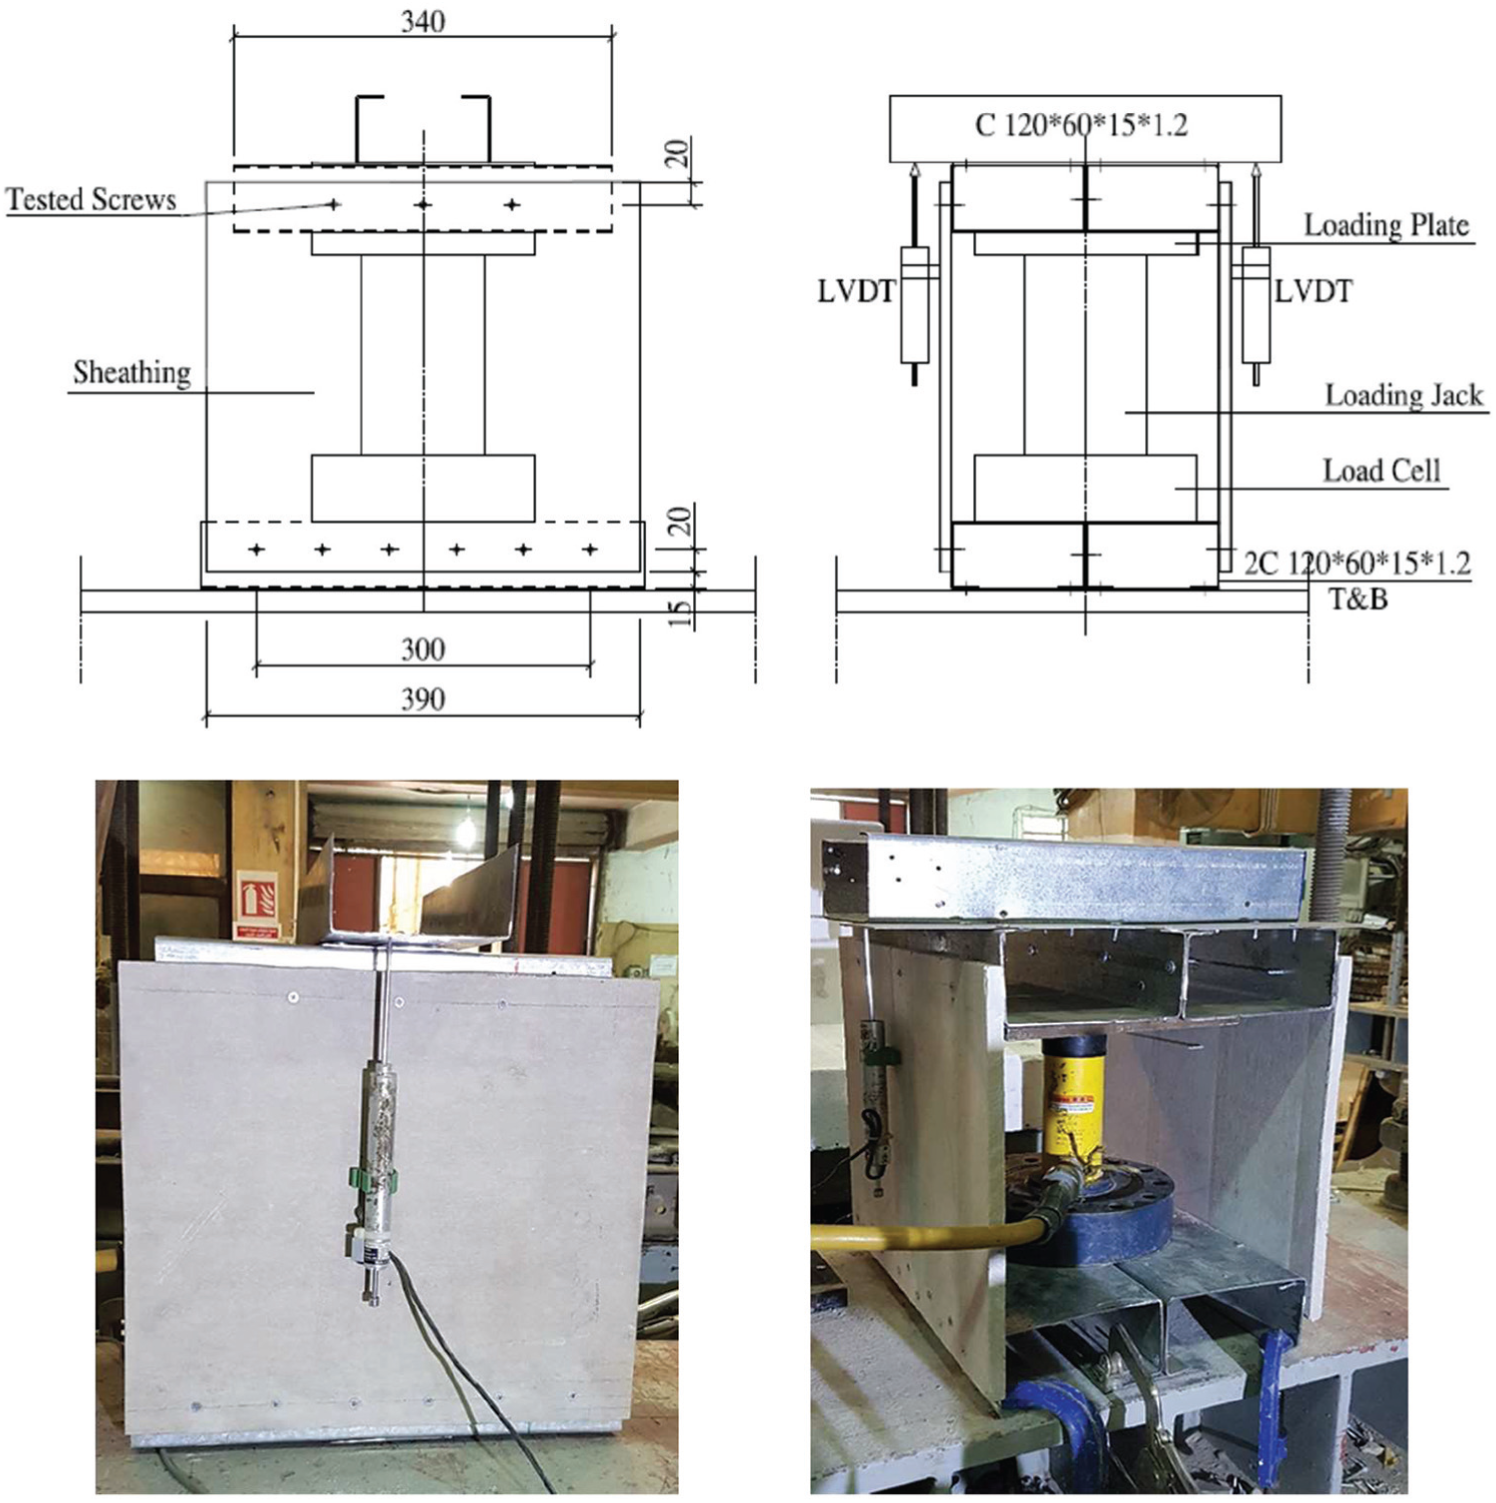
Test setup for screw connection under applied perpendicular load.
Loading and instrumentation
The shear load was applied to the screw connection using a 90 kN loading jack positioned between the lower surface of the upper assembly and the top surface of the lower assembly. The load was distributed on the upper assembly using a 200 × 200 × 20 mm loading plate and on the lower assembly using a load cell of diameter of 200 mm. The relative displacement between the top assembly and the sheathing board segments was measured using two linear variable displacement transducers (LVDT) fixed to the sheathing board segments and touching the lower surface of the transversal channels of the top assembly. The total applied vertical load was thus transmitted to the screw connection on both sides as shear force in the direction perpendicular to the free edge of the board. Due to symmetry, the strength of a single screw is equal to one-sixth of the applied load. The corresponding relative displacement was obtained as the average of the two LVDT readings on both sides of the specimen. The loading was applied monotonically at 2 kN increments and the load value was kept until no variation of displacement was recorded and then continued until connection failure at peak load. The post-peak branch of the load–displacement curve was continued using the recorded load and displacement values. It should be noted that in this force control loading scheme, the post-peak branch of the load–displacement curve is not as reliable as the pre-peak curve. This however affects only the calculations of the ductility ratio which is of minor importance in monotonic tests.
Tests of connections with shear applied parallel to the free edge
Test setup
The setup for testing screw connections under shear which is applied parallel to the board’s free edge is shown in Figure 4. It consisted of four sheathing board segments connected to both sides of the flanges of a vertical assembly which consisted of a pair of back-to-back CFS lipped channels of size 120 × 60 × 15 × 1.2 interconnected at their inner webs using six hexagon head screws size ϕ6.25 × 25 mm. The vertical assembly was connected at top and bottom by two track sections of size 120 × 60 × 1.2 mm. Each sheathing board segment was connected to the vertical assembly using either one screw or three screws at the lower end and using six screws at the upper end in order to force the failure to occur in the lower part.
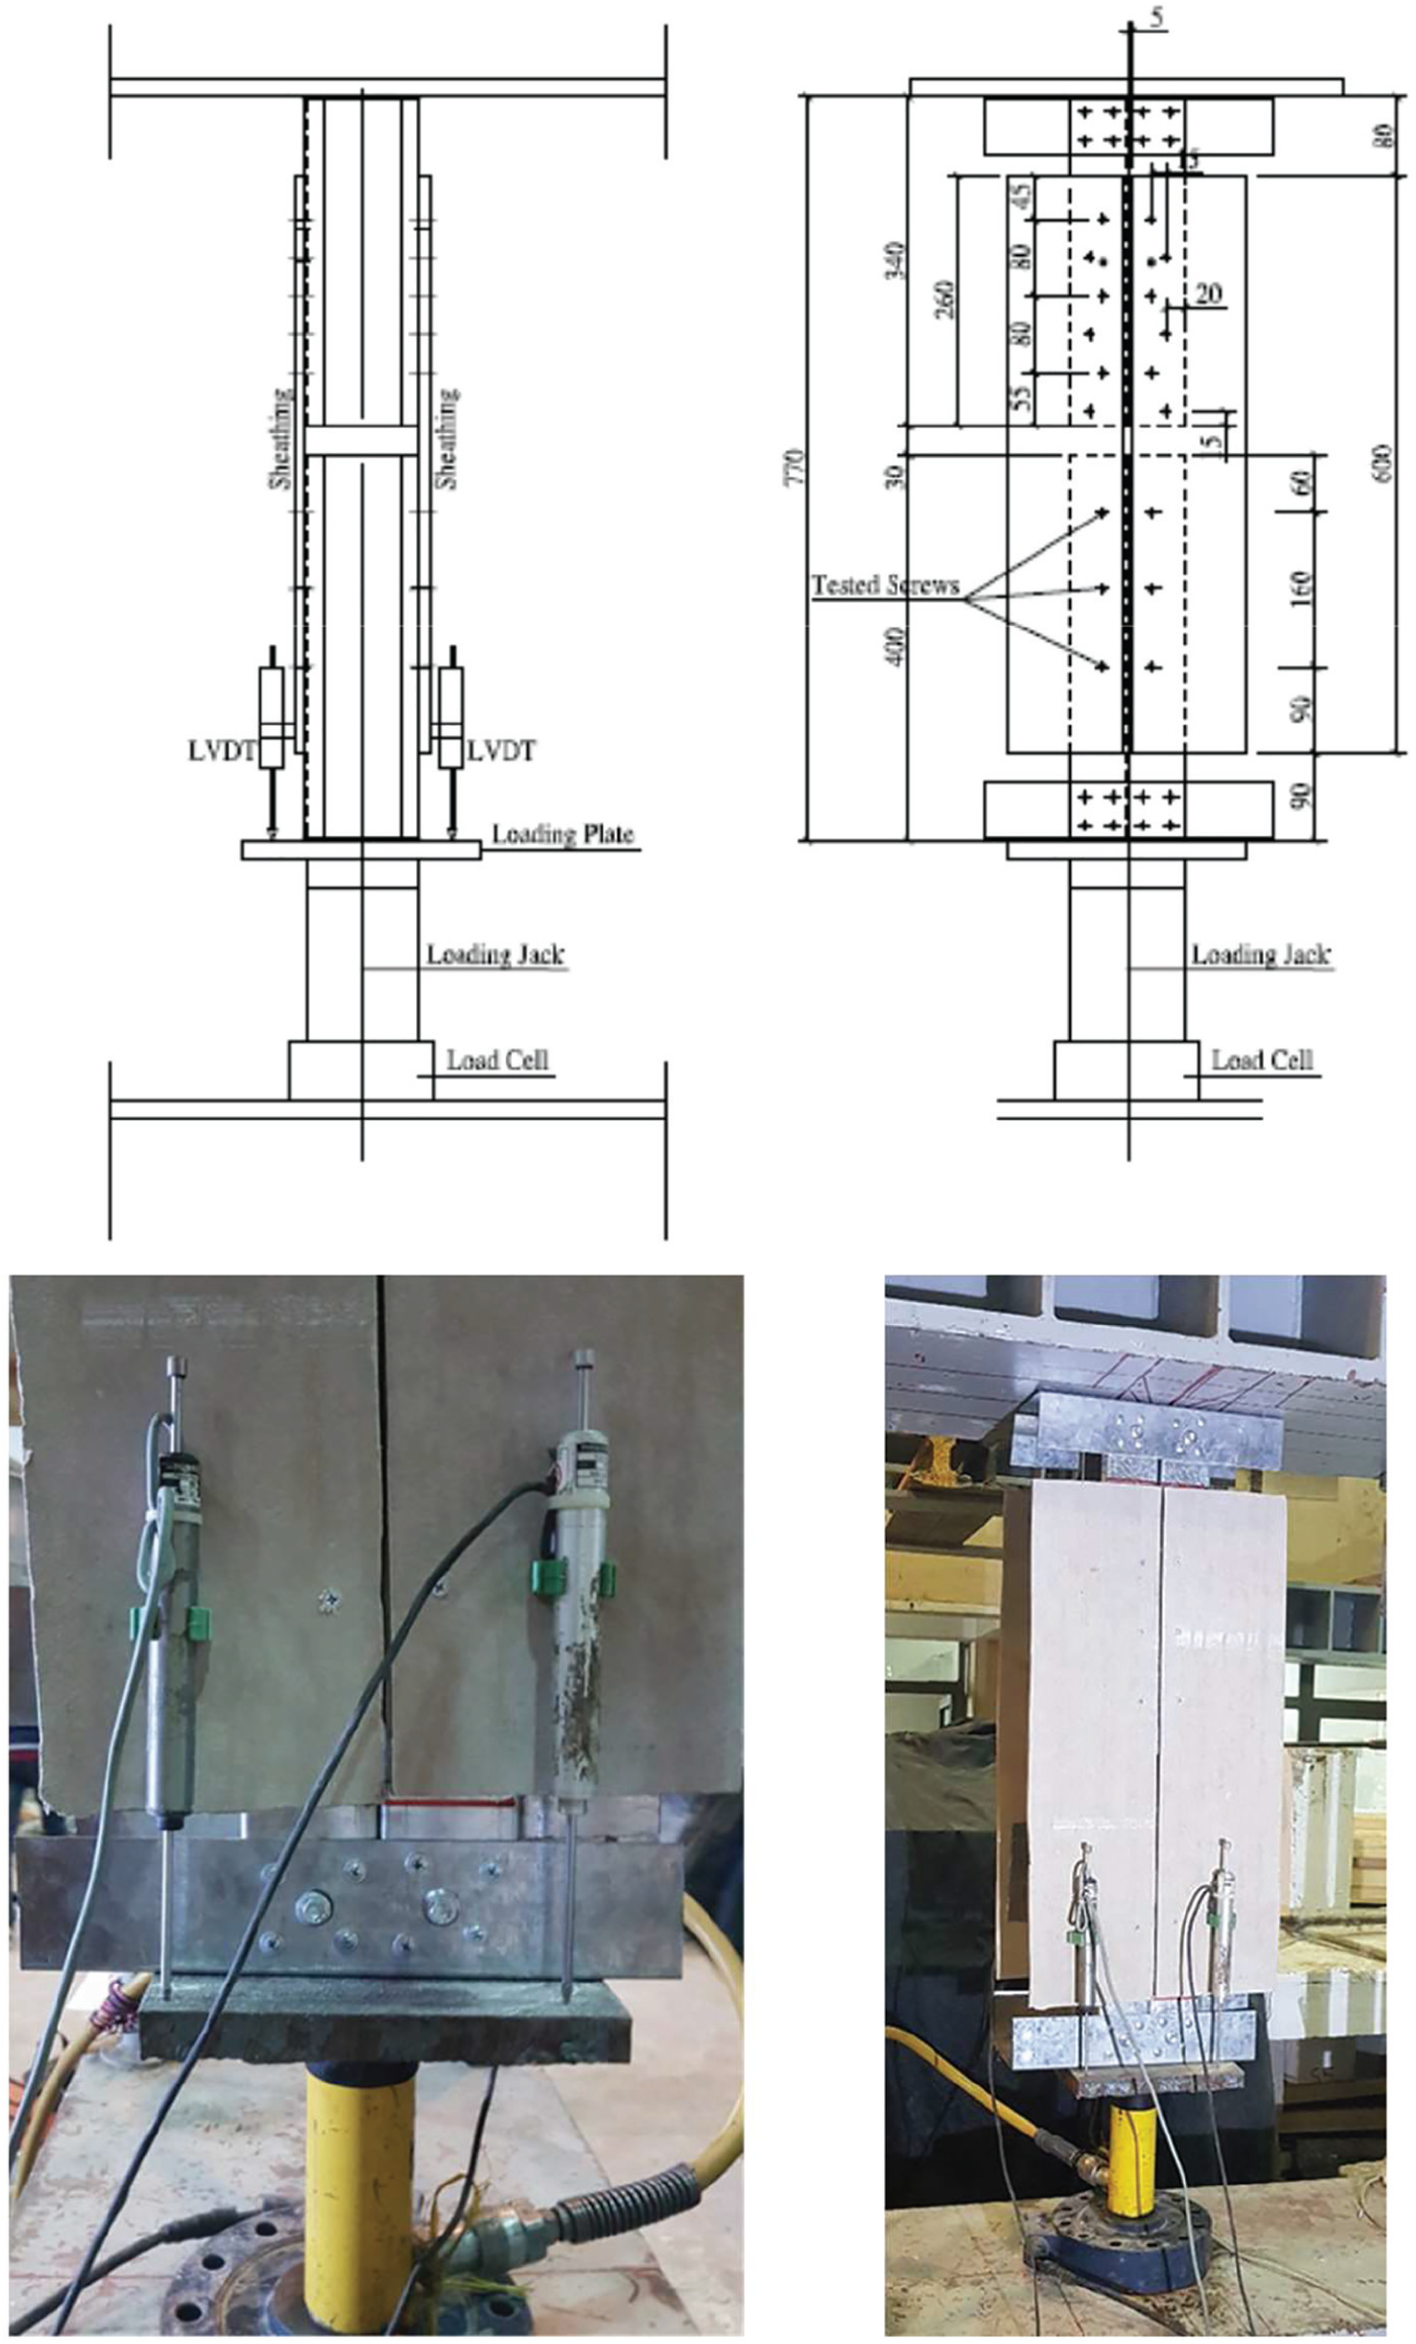
Test setup for screw connection under applied parallel load.
It should be noted that the connection displacement in the case of connections having three screws at the tested end is equal to the sum of the displacements of individual screws. The screws used were self-drilling flat countersunk size ϕ4.2 × 25 mm. The edge distance perpendicular to the free edge was set at 20 mm for all test specimens. The screw spacing parallel to the free edge was set at 80 mm. The end distance of the tested screws parallel to the applied force was kept sufficiently large (60 mm) to prevent failure due to shear perpendicular to the board edge. This arrangement insures that the applied shear is parallel to the free edge as in sheathed shear walls under in-plane shear.
Loading and instrumentation
The shear load was applied to the screw connection using a 90 kN loading jack positioned under the bottom surface of the assembly. The load was distributed using a 200 × 200 × 20 mm loading plate. A load cell was positioned under the loading jack for load measurement. The relative displacement between the assembly and the sheathing board segments were measured using four LVDT fixed to the sheathing board segments and touching the top surface of the loading plate. The total applied vertical load was thus transmitted to the screw connection on both sides as shear force in the direction parallel to the free edge of the board. Due to symmetry, the strength of a single screw is equal to the applied load divided by the number of tested screws which is 4 for single-screw arrangement and 12 for three-screw arrangement. The corresponding relative displacement was obtained as the average of the four LVDT readings on both sides of the specimens. The loading was applied monotonically at 2 kN increments and the load value was kept until no variation of displacement was recorded and then continued until connection failure at peak load. The post-peak branch of the load–displacement curve was continued using the recorded load and displacement values. It should be noted that in this force control loading scheme, the post-peak branch of the load–displacement curve is not as reliable as the pre-peak curve. This however affects only the calculations of the ductility ratio.
Material properties
Material properties of CFS sections
Two coupon test samples were cut from the webs of stud sections and machined to ASTM 370 for tension testing. Tests were performed by at The Strength of Material Laboratory at the Faculty of Engineering, Cairo University. Summary of the test results is as follows: average yield strength = 313.5 MPa, average tensile strength = 264.5 MPa, and average elongation = 0.365.
Fibercement Boards
The FBB used were of the type C-board supplied by the company ASK (www.gulfgypsums.com). Supplier’s data provided for the used boards are as follows: density is 1650 kg/m3, flexural strength is 7 MPa, compressive strength is 30 MPa, and elastic modulus is 7500 MPa.
Ferrocement Boards
The FCB used were produced locally by the company ESDCO (www.esdcoegypt.com). The material properties were obtained from laboratory tests as follows: density is 2400 kg/m3, flexural strength is 5.46 MPa, compressive strength is 26 MPa, and elastic modulus is 225 MPa.
Screws
The self-drilling screws used were supplied by the company PATTA (www.patta.com). Material AISI C1022 Case Hardened Steel with the following properties: yield strength is 350 MPa, tensile strength is 550 MPa, and elongation is 27%.
Test results and discussions
Observed failure modes
The following failure modes were visually observed during the experimental program.
Screw tilting
In all tests, the failure was initiated by tilting of the screws resulting from the relative movement between the steel section and the sheathing board. This failure mode was always present for all sheathing boards and for both parallel shear and perpendicular shear, as shown in Figure 5.
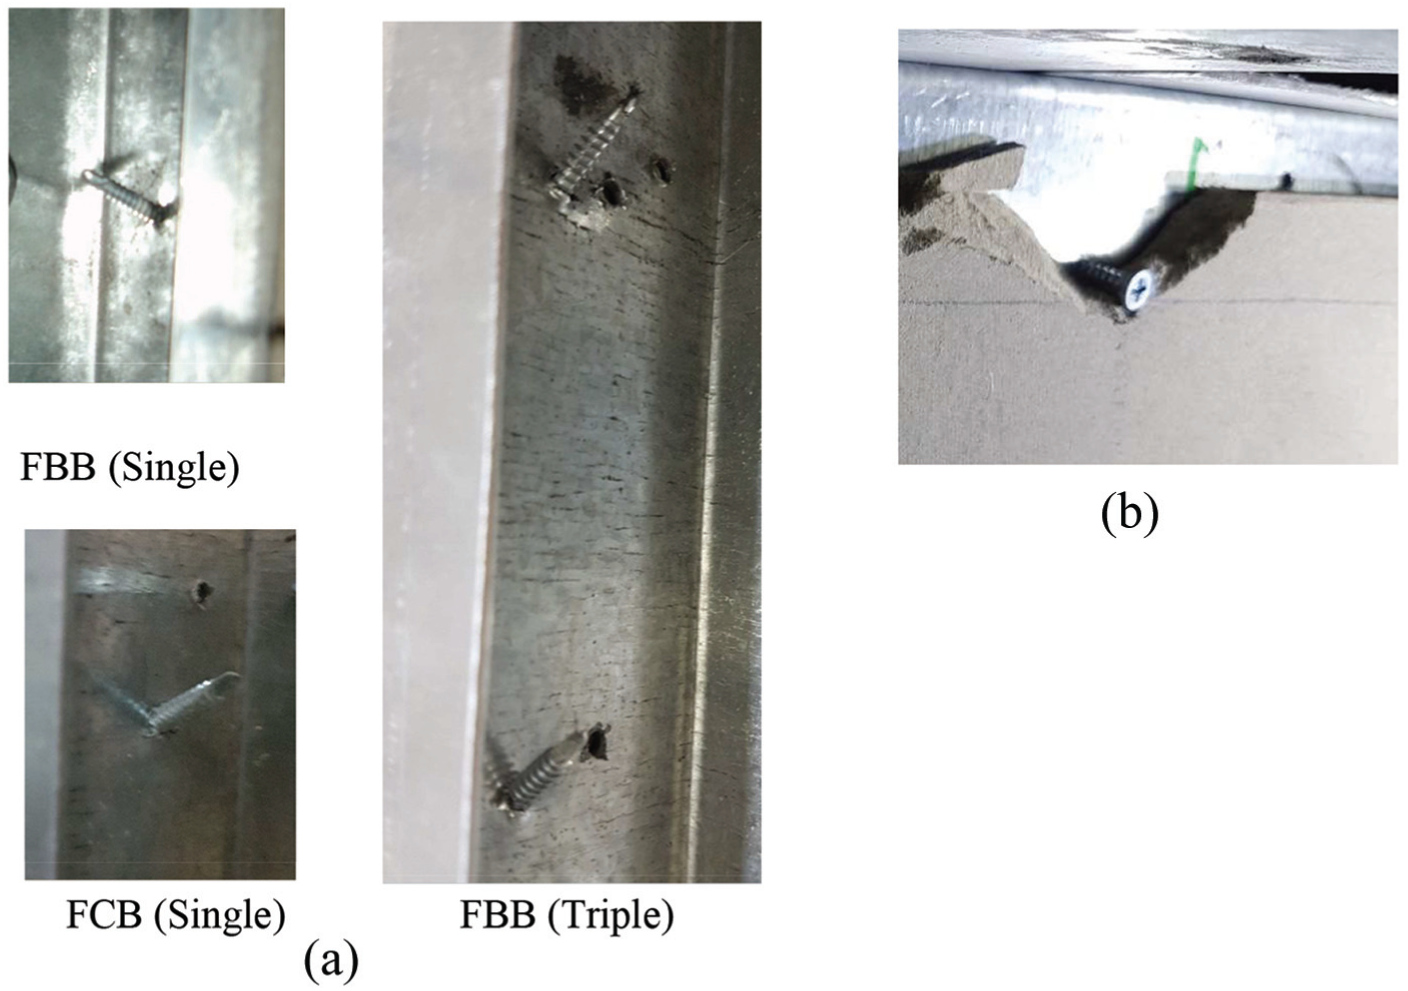
Screw tilting before failure: (a) under parallel loading and (b) FFB under perpendicular loading.
Bearing failure of the sheathing around the screw location
For tests performed under parallel shear, the screw tilting was followed by screw pull through and bearing failure of the sheathing material around the screw location. This is shown in Figure 6 for the FBB and in Figure 7 for the FCB.
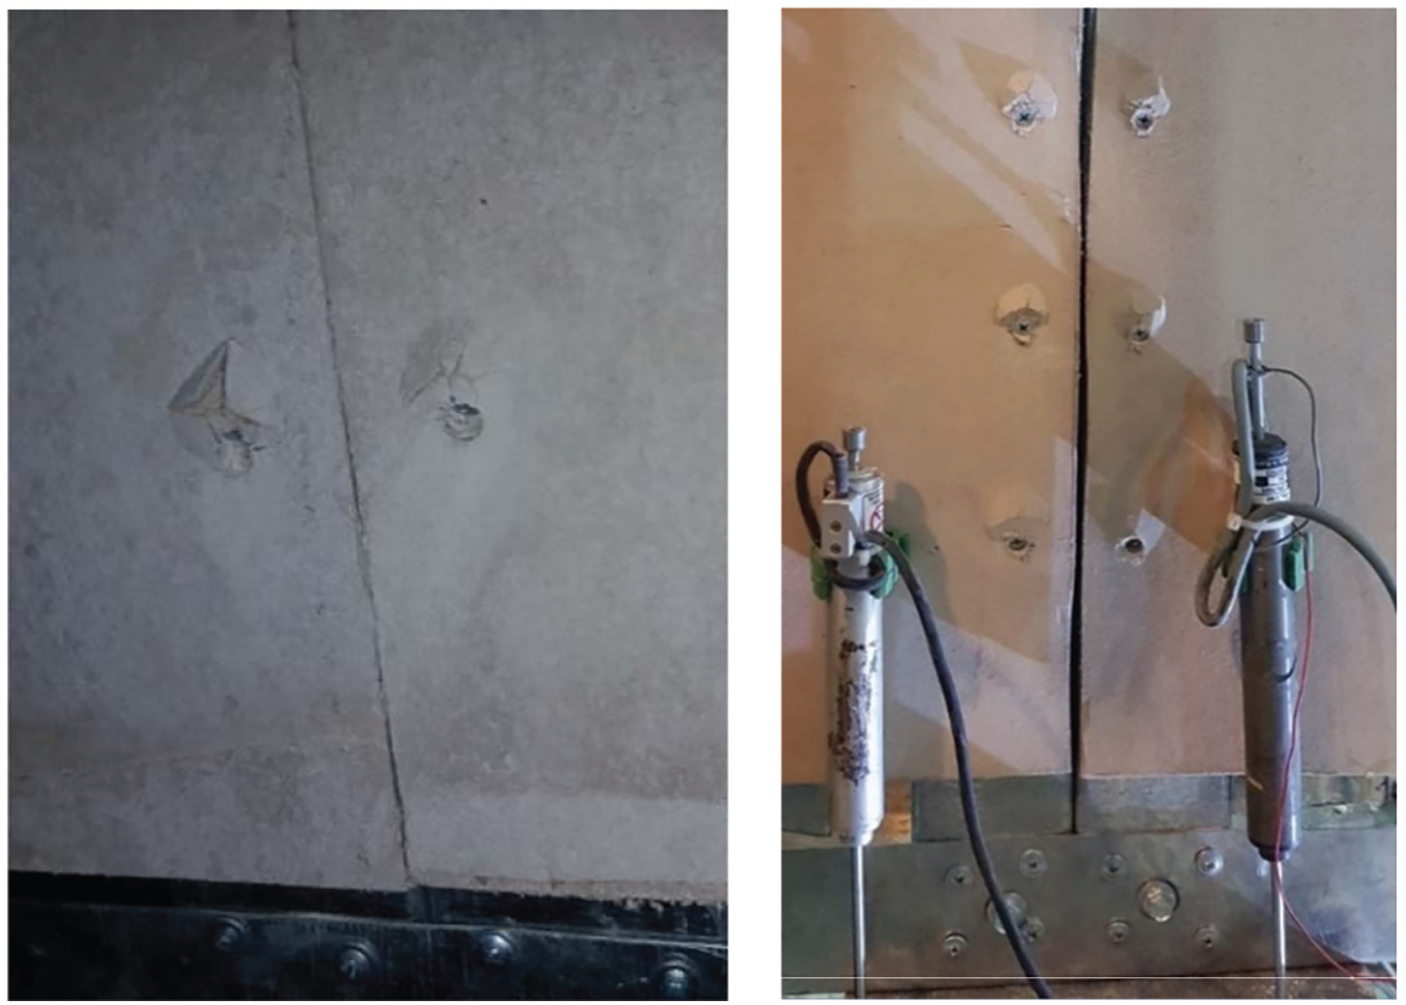
Bearing failure of fibercement sheathing around screw location.
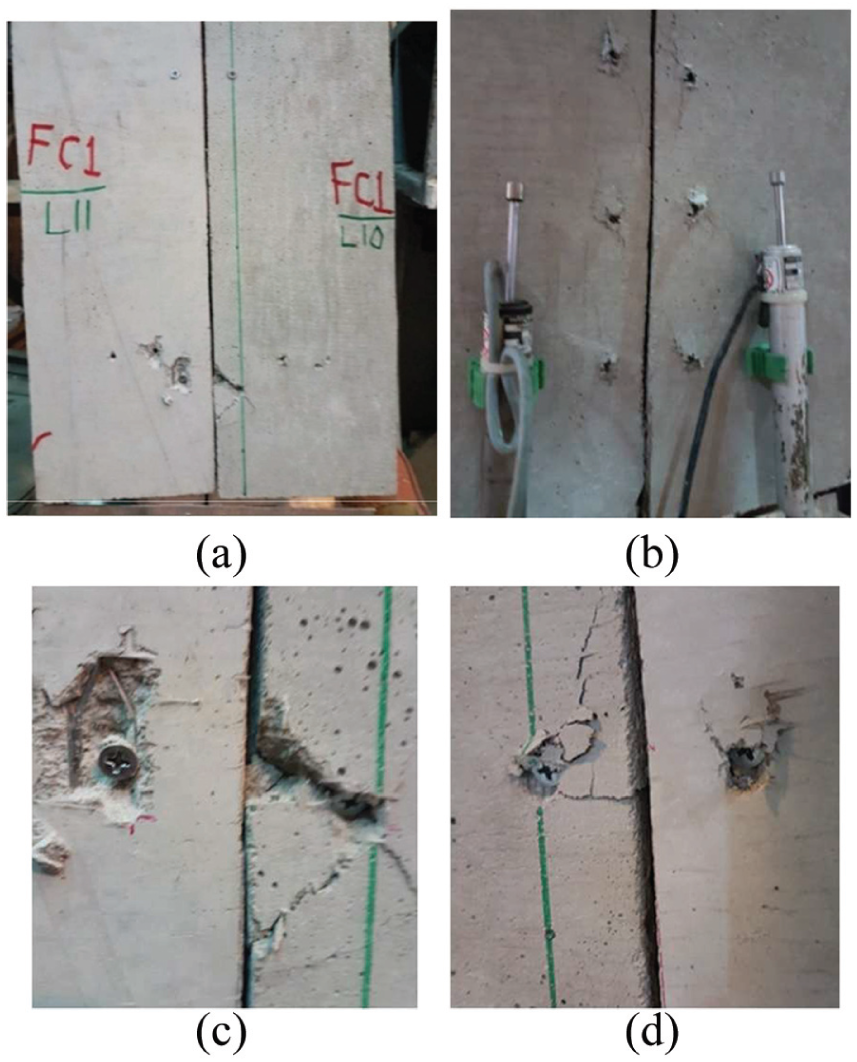
Bearing failure of ferrocement sheathing around screw location: (a) single screw, (b) three screws, (c) screw tilting and concrete failure, and (d) screw pull-through and concrete failure.
The sheathing material bearing failure was more pronounced in FCB than in FBB as shown in Figure 7(c) and (d). This can be attributed to the presence of fibers in the fiberboards which contains the failure.
Tearing of sheathing around the screw location
For tests performed under perpendicular shear, the screw tilting was followed by tearing of the sheathing board in the applied shear direction. In some tests, the tearing failure was localized around the screw location as shown in Figure 8(a) while in some other tests the tearing failure occurred with complete separation of the free edge as shown in Figure 8(b).
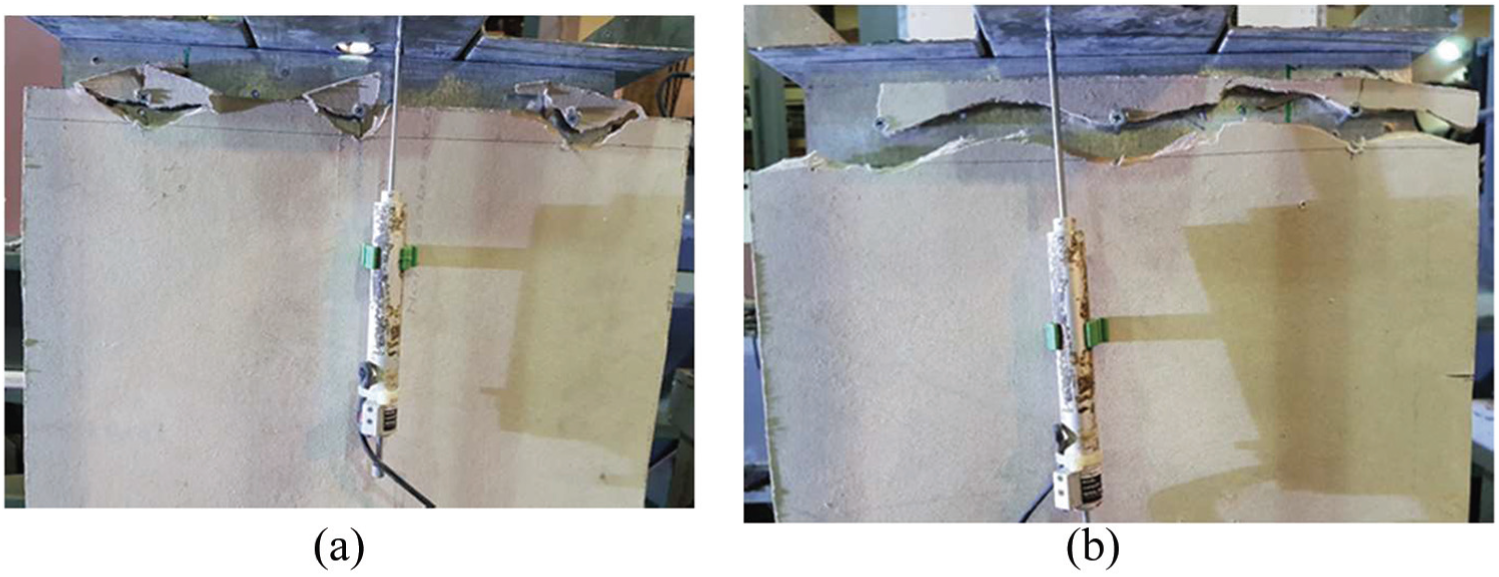
(a) Tearing of sheathing at screw location and (b) complete tearing of sheathing.
Load–displacement curves
A typical load versus displacement curve for screw connections under shear is shown in Figure 9. The behavior can generally be divided into the following three regions:
Elastic region, where the load–displacement relation is nearly linear up to the elastic load value Fe value which is usually taken equal to 40% of the peak load (Fiorino et al., 2007). The corresponding elastic displacement equals De and the elastic stiffness is defined as Ke = Fe/De.
Nonlinear region up to the peak load Fp with the corresponding displacement Dp.
Post-peak region up to a load value which is usually taken equals 80% of the peak load (Fiorino et al., 2007) with the corresponding displacement equals Du. The ratio Du/De is a measure of the connection ductility.
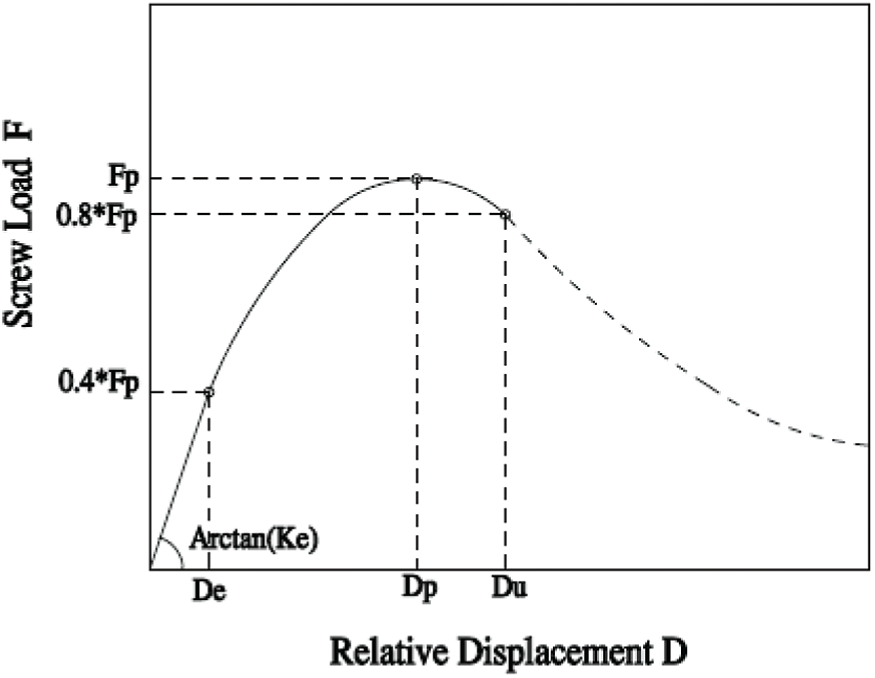
Typical load–displacement curve for screw connections under shear.
The load–displacement curves of the test results are shown in Figure 10 for FBB under parallel loading, Figure 11 for FCB under parallel loading, and Figure 12 for FBB under perpendicular loading. The single-screw load was obtained by dividing the load cell load by the number of tested screws while the corresponding relative displacement was calculated as the average value of the LVDT readings. Table 3 shows the parameters corresponding to the behavior regions for all tests. Based on these results, the following observations can be made.
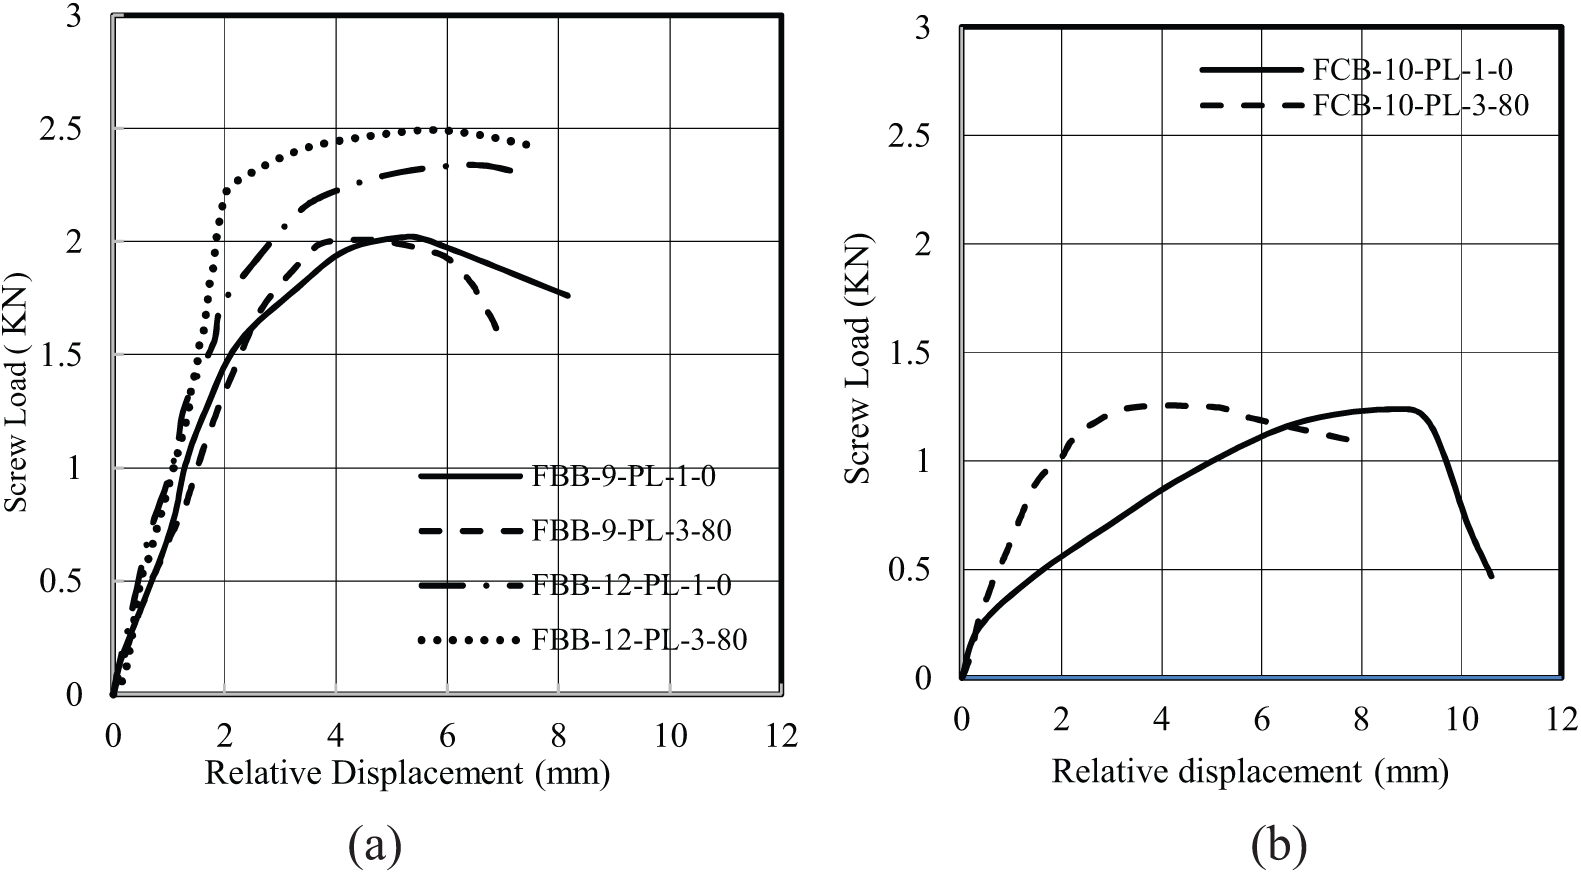
Load–displacement curves for screw connections of fibercement sheathing under loading parallel to free edge: (a) fibercement sheathing and (b) ferrocement sheathing.
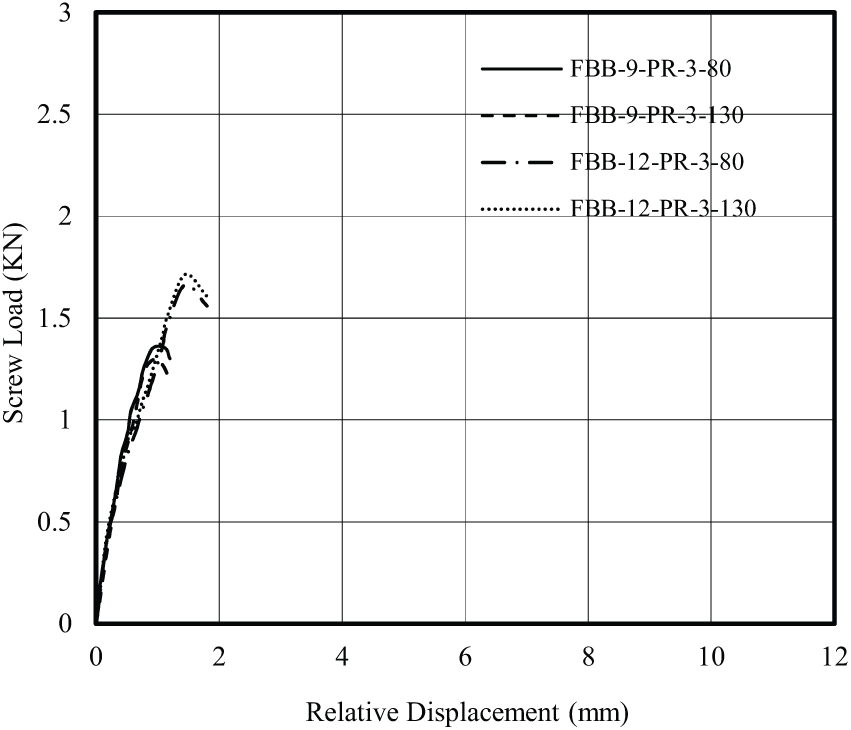
Load–displacement curves for screw connection of ferrocement sheathing under loading parallel to free edge.
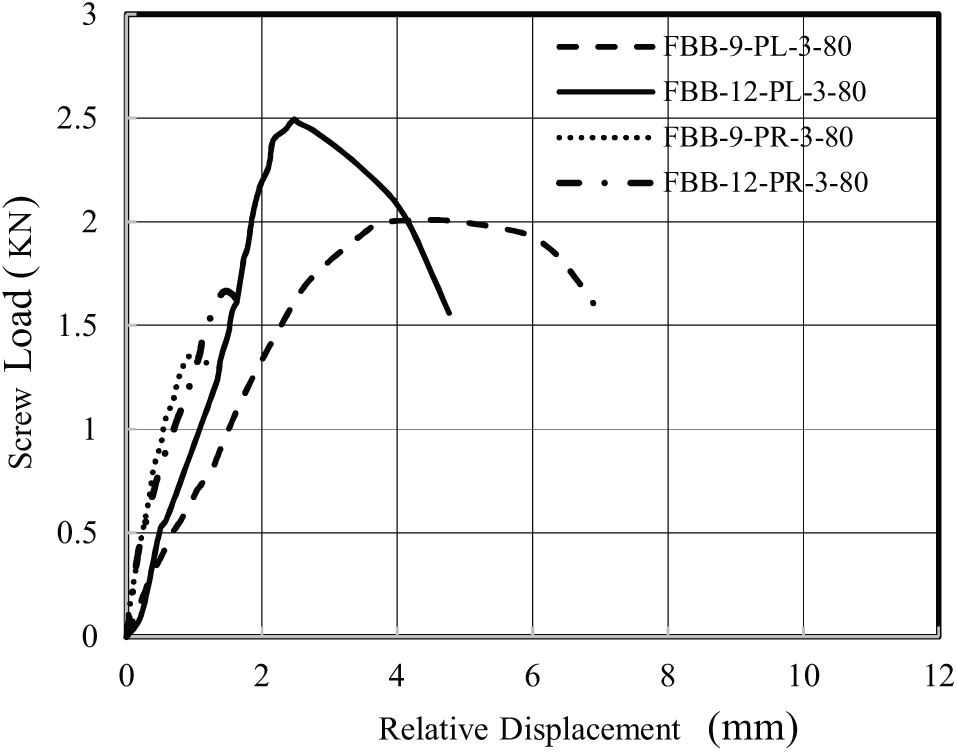
Load–displacement curves for screw connection of fibercement sheathing under loading perpendicular to free edge.
Test results.
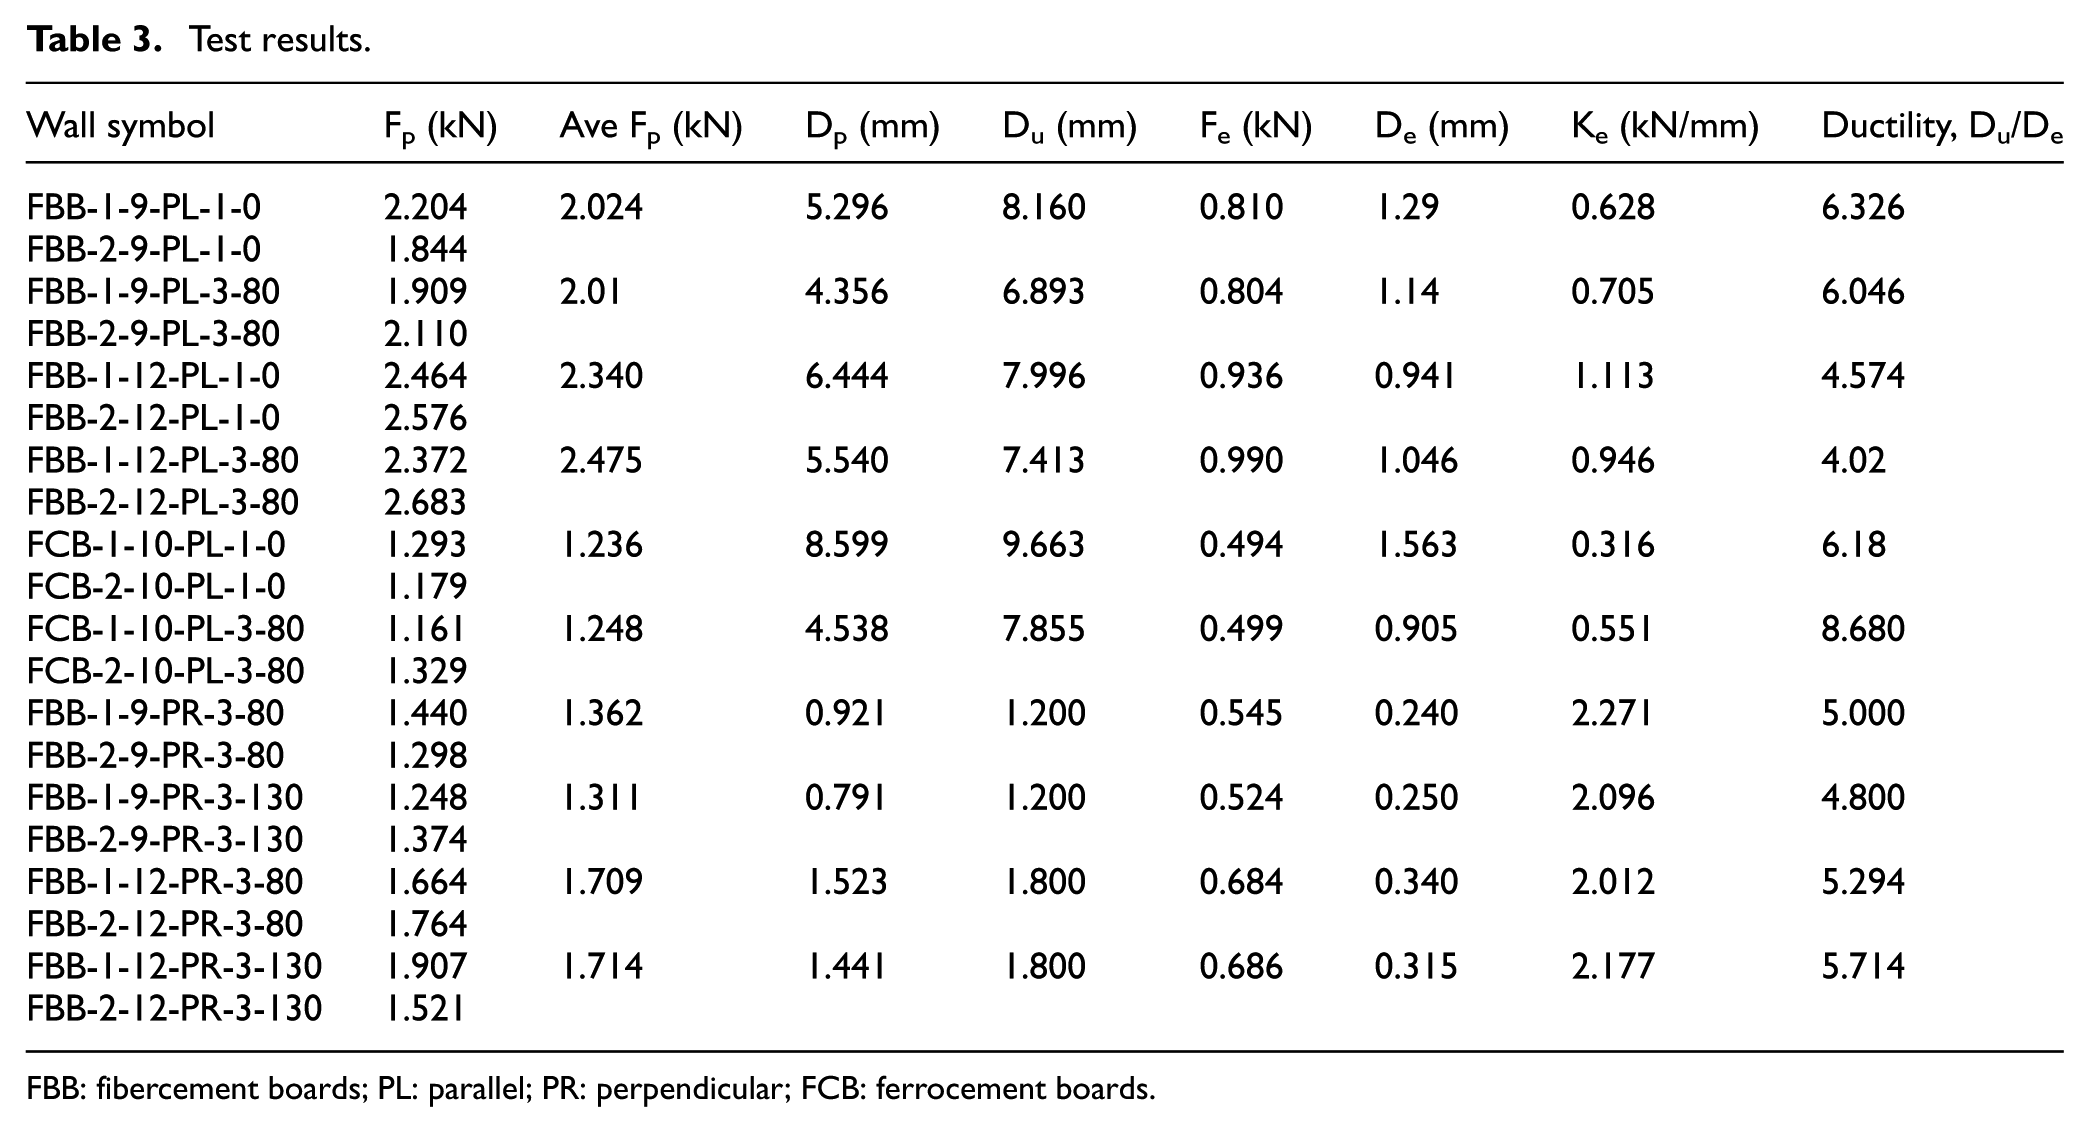
FBB: fibercement boards; PL: parallel; PR: perpendicular; FCB: ferrocement boards.
Effect of applied load direction
Figure 13 shows a comparison between the screw strength results obtained under loading applied parallel to the free edge versus the screw strength results obtained under loading applied perpendicular to the free edge for FBB with three screws spaced at 80 mm. The following observations can be made:
Peak load. The ratio of the peak load under parallel loading to that under perpendicular load is equal to 2.01/1.362 = 1.475 for the 9 mm boards and 2.475/1.709 = 1.448 for the 12 mm boards. These results show that screw strength obtained under parallel loading is higher than those obtained under perpendicular loading. Accordingly, using the screw strength results obtained under perpendicular loading to represent the diaphragm action in sheathed shear walls is conservative.
Peak displacements. The ratio of the peak displacement under parallel loading to that under perpendicular load is equal to 4.356/0.921 = 4.73 for the 9 mm boards and 2.54/1.523 = 1.668 for the 12 mm boards. These results show that the peak displacement under parallel loading is larger than under perpendicular loading. This increase is attributed to the fact that the total displacement in parallel loading is equal to the sum of the three-screw displacements acting in series.
Elastic stiffness. The ratio of the elastic stiffness under parallel loading to that under perpendicular load is equal to 0.946/2.012 = 0.470 for the 9 mm boards and 0.705/2.271 = 0.311 for the 12 mm boards. These results show that the peak displacement under parallel loading is larger than under perpendicular loading. This decrease is a direct result of the larger relative displacements associated with parallel loading.
Comparison of load–displacement curves for fibercement sheathing under loading parallel to free edge versus loading perpendicular to free edge: (a) single screw connection and (b) three-screw connection.
Effect of board material
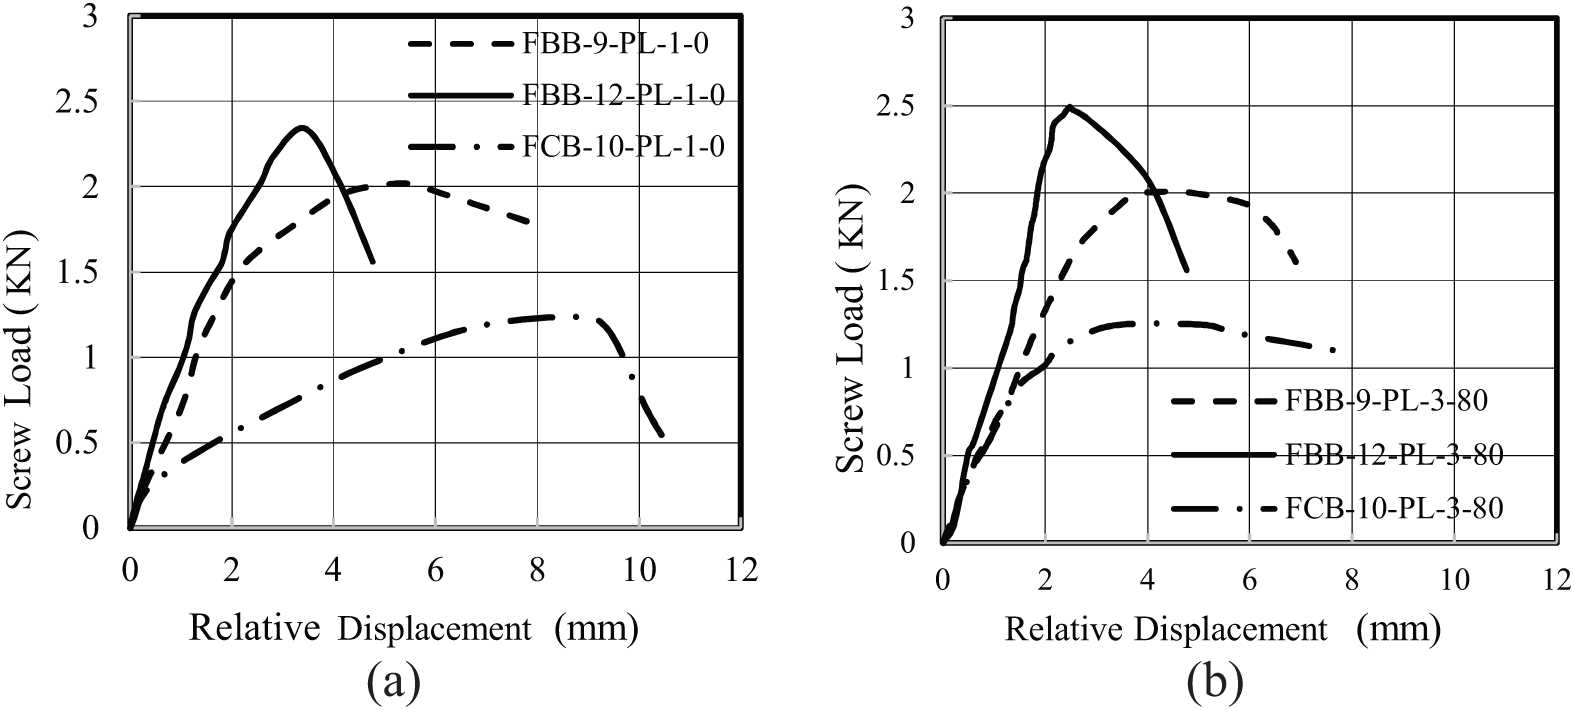
Figure 14 shows a comparison between the screw strength results of FBB versus the screw strength results of FCB under parallel loading. The following observations can be made:
Peak load. For connections with a single screw (Figure 14(a)), the ratio of the peak displacement of the 9 mm fibercement board to that of the 10 mm ferrocement board is 2.024/1.236 = 1.638. Similarly, the ratio of the peak load of the 12 mm fibercement board to that of the 10 mm ferrocement board is 2.34/1.236 = 1.893. For connections with three screws spaced at 80 mm (Figure 14(b)), the ratio of the peak load of the 9 mm fibercement board to that of the 10 mm ferrocement board is 2.01/1.248 = 1.611. Similarly, the ratio of the peak load of the 12 mm fibercement board to that of the 10 mm ferrocement board is 2.475/1.248 = 1.983.
Peak displacement. For connections with a single screw (Figure 14(a)), the ratio of the peak displacement of the 9 mm fibercement board to that of the 10 mm ferrocement board is 5.296/8.559 = 0.619. Similarly, the ratio of the peak displacement of the 12 mm fibercement board to that of the 10 mm ferrocement board is 3.444/8.559 = 0.402. For connections with three screws spaced at 80 mm (Figure 14(b)), the ratio of the peak displacement of the 9 mm fibercement board to that of the 10 mm ferrocement board is 4.356/4.3538 = 1.001. Similarly, the ratio of the peak displacement of the 12 mm fibercement board to that of the 10 mm ferrocement board is 2.54/4.358 = 0.583.
Elastic stiffness. For connections with a single screw (Figure 14(a)), the ratio of the elastic stiffness of the 9 mm fibercement board to that of the 10 mm ferrocement board is 0.628/0.36 = 1.744. Similarly, the ratio of the elastic stiffness of the 12 mm fibercement board to that of the 10 mm ferrocement board is 1.113/0.316 = 3.522. For connections with three screws spaced at 80 mm (Figure 14(b)), the ratio of the elastic stiffness of the 9 mm fibercement board to that of the 10 mm ferrocement board is 0.705/0.551 = 1.279. Similarly, the ratio of the elastic stiffness of the 12 mm fibercement board to that of the 10 mm ferrocement board is 0.946/0.551 = 1.717.

Comparison of load–displacement curves for fibercement sheathing versus ferrocement sheathing under loading parallel to free edge.
Although the comparison is made among boards of different thicknesses, it still shows qualitatively that FBB have higher peak load and elastic stiffness and smaller peak displacement than FCB. This increase may be attributed to the fact that connection behavior is highly dependent on the local bearing properties around the screw locations which is enhanced by the presence of fibers in FBB.
Effect of board thickness
Figure 10 to 12 show the screw strength results for the FBB under parallel and perpendicular loading, respectively. The following observation can be made:
Peak load. Under parallel loading (Figure 10), the ratio of the peak load of the 12 mm boards to that of the 9 mm boards is 2.34/2.024 = 1.156 for connections with a single screw and 2.475/2.01 = 1.231 for connections with three screws. Similarly, under perpendicular loading (Figure 12), the ratio of the peak load of the 12 mm boards to that of the 9 mm boards is 1.709/1.362 = 1.255 for connections with three screws spaced at 80 mm and 1.714/1.311 = 1.307 for connections with three screws spaced at 130 mm. Noting that the ratio of board thickness is 12/9 = 1.333, these results show that the screw strength—being dependent on the bearing strength around the screws—increased nearly in linear proportion with the increase in board thickness. Similar results are reported by Nithyadharan and Kalyanaraman (2011) and Tao and Moen (2017). Based on the results of 222 tests on steel-to-steel and sheathing-to-steel screw connections, Tao and Moen (2017) concluded that the bearing strength is a key contributor to the strength and stiffness of the connection. The bearing strength Fb is given by Fb = t d Fu, where t is the sheet thickness, d is the screw diameter, and Fu is the ultimate tensile strength of sheet material. For the same screw diameter and board material, the bearing strength is directly proportional to the board thickness.
Peak displacement. Under parallel loading (Figure 10), the ratio of the peak displacement of the 12 mm boards to that of the 9 mm boards is 6.444/5.296 = 1.217 for connections with a single screw and 5.54/4.356 = 1.381 for connections with three screws. Similarly, under perpendicular loading (Figure 12), the ratio of the peak displacement of the 12 mm boards to that of the 9 mm boards is 1.523/0.921 = 1.654 for connections with three screws spaced at 80 mm and 1.441/0.791 = 1.822 for connections with three screws spaced at 130 mm.
Elastic stiffness. Under parallel loading (Figure 10), the ratio of the elastic stiffness of the 12 mm boards to that of the 9 mm boards is 1.113/0.628 = 1.772 for connections with a single screw and 0.946/0.705 = 1.342 for connections with three screws. Similarly, under perpendicular loading (Figure 12), the ratio of the elastic stiffness of the 12 mm boards to that of the 9 mm boards is 2.012/2.271 = 0.886 for connections with three screws spaced at 80 mm and 2.177/2.096 = 1.039 for connections with three screws spaced at 130 mm.
Effect of number of screws
Figures 10 and 11 show the screw strength results under parallel loading. The following observations can be made:
Peak load. For FBB (Figure 10), the ratio of screw strength in three-screw tests spaced at 80 mm to that obtained from single-screw tests is 2.01/2.024 = 0.994 for the 9 mm boards and 2.475/2.34 = 1.058 for the 12 mm boards. For FCB under parallel loading (Figure 11), the ratio of screw strength in three-screw tests spaced at 80 mm to that obtained from single-screw tests is 1.248/1.236 = 1.01. These results show that the difference between screw strength obtained from one-screw tests and that obtained from three-screw tests is minor. Sokol et al. (1998) found that the strength of multiple-screw connections is less than the sum of single-screw strengths in the connection. The decrease in strength was defined as the “group effect.” This conclusion was derived from test data on steel-to-steel connections which had 3d (d being the nominal screw diameter) screw spacing. This result indicates using the screw strength obtained from single-screw tests to represent the screw strength in multiple-screw connections is not conservative. On the other hand, Fairuz and Ho (2013) and Lau and Tang (2012) found that the “Group Effect” is negligible for steel-to-steel connections with high-strength CFS when the screw spacing exceeds 3d. There are no similar studies on screw connections with non-steel sheathing to determine the group effect in such cases.
Peak displacement. For FBB (Figure 10), the ratio of peak displacement in three-screw tests spaced at 80 mm to that obtained from single-screw tests is 6.893/8.16 = 0.845 for the 9 mm boards and 7.413/7.996 = 0.927 for the 12 mm boards. For FCB under parallel loading (Figure 11), the ratio of peak displacement in three-screw tests spaced at 80 mm to that obtained from single-screw tests is 4.538/8.559 = 0.531. These results show that the peak displacements in three-screw tests are smaller than in single-screw tests for both FBB and FCB, although the difference is more pronounced for FCB.
Elastic stiffness. For FBB (Figure 10), the ratio of the elastic stiffness in three-screw tests spaced at 80 mm to that obtained from single-screw tests is 0.705/0.628 = 0.834 for the 9 mm boards and 0.946/1.113 = 0.849 for the 12 mm boards. For FCB under parallel loading (Figure 11), the ratio of the elastic stiffness in three-screw tests spaced at 80 mm to that obtained from single-screw tests is 0.551/0.316 = 1.744. These results show that the elastic stiffness in three-screw tests is smaller than in single-screw tests for fibercement. On the other hand, the elastic stiffness in three-screw tests is larger than in single-screw tests for FCB.
Effect of screw spacing
Figure 12 shows load–displacement curves for FBB under perpendicular loading using three screws spaced at 80 and 130 mm. The following observations can be made:
Peak load. The ratio of screw strength obtained from three-screw tests spaced at 130 mm to that obtained from three-screw tests spaced at 80 mm is 1.311/1.362 = 0.962 for the 9 mm boards and 1.714/1.709 = 1.003 for the 12 mm boards.
Peak displacement. The ratio of peak displacement obtained from three-screw tests spaced at 130 mm to that obtained from three-screw tests spaced at 80 mm is 0.791/0.921 = 0.859 for the 9 mm boards and 1.441/1.523 = 0.946 for the 12 mm boards.
Elastic stiffness. The ratio of elastic stiffness obtained from three-screw tests spaced at 130 mm to that obtained from three-screw tests spaced at 80 mm is 2.096/2.271 = 0.923 for the 9 mm boards and 2.177/2.012 = 1.082 for the 12 mm boards.
These results show that increasing the screw spacing slightly decreased the peak load, peak displacement, and elastic stiffness for the 9 mm boards while the effect was negligible for the 12 mm boards.
Comparison with available test results
Comparing the results reported in this article as listed in Table 3 with those listed in Table 1, it can be concluded that the values of screw strength in FBB and FCB are comparable to the values corresponding to OSB boards and CSB.
Summary and conclusion
This article presented an experimental study on the screw connections between CFS walls and cement-based sheathing such as FBB and FCB. The effect of loading direction, type of sheathing, board thickness, and screw number and spacing were investigated. The main conclusions related to screw strength obtained from the 20 tests reported in the paper are as follows:
Screw strength obtained under parallel loading is about 45% higher than those obtained under perpendicular loading. The corresponding displacements in multi-screw connections are higher under parallel loading than under perpendicular loading due to the series action of the longitudinal screw arrangement.
FBB have 60%–100% higher peak loads than FCB.
Screw strength increased nearly in linear proportion with the increase in board thickness.
The difference between screw strength obtained from one-screw tests and that obtained from three-screw tests is minor.
Increasing the screw spacing slightly decreased the peak load for the 9 mm boards while the effect was negligible for the 12 mm boards.
Footnotes
Declaration of Conflicting Interests
The author(s) declared no potential conflicts of interest with respect to the research, authorship, and/or publication of this article.
Funding
The author(s) disclosed receipt of the following financial support for the research, authorship, and/or publication of this article: The research presented in this article was funded by the Egyptian Science and Technology Development Fund (STDF) (Grant No. IG 15040).
