
Abstract
During landfall of Typhoon Haikui in Eastern China in 2012, ground level wind data were recorded using a smart monitoring system installed on JiuBao Bridge in Hangzhou, China. This article documents the mean flow and turbulence characteristics from data recorded during the storm. The results show that both turbulence intensity and gust factor decrease with the increase in the mean wind velocity. However, as the mean wind velocity increases, this trend gradually attenuates. The peak factor distribution with gust averaging time duration derived with the Typhoon Haikui data agrees well with the Durst curve. However, the longitudinal gust factor derived from the typhoon wind-speed record in this study is higher compared with the curves proposed by Durst and Krayer-Marshall. Analyses of the gust factor distribution with the turbulence intensity during the passage of the storm reveal a similarity to the empirical curves of Ishizaki and Choi. Results show that the relationship between lateral turbulence and gust factors can be well represented by a quadratic polynomial. Turbulence scale increased with mean wind velocity. The values of autocorrelation coefficients in longitudinal direction are larger than those in lateral direction. There has no obvious dependency of cross-correlation coefficients with mean wind velocity. In general, the wind characteristics in this study are shown to be very similar to those of winds under normal circumstance.
Introduction
China experiences frequent typhoon disasters. Land falling typhoons usually cause multiple damages, including high winds, heavy rainfall, storm surge, and tornadoes (Mohammad et al., 2017; Peng et al., 2016; Tse et al., 2015), which pose a threat to the infrastructures. With growing need to assure structural safety in the natural hazards, the sensitivity of bridges to wind receive more concern due to a decrease in the structural stiffness caused by the application of long-span and lightweight bridge structures. The long-span bridges should meet the requirement of the serviceability, safety, and sustainability in their normal service life. For the typhoon-prone regions, the wind characteristics in the vicinity of bridges are of significance to their design and construction, because the bridges—especially the long-span bridges—are sensitive structures for wind load. The fluctuating characteristics of wind such as turbulence intensities, gust factors, and peak factors are the main reason to damage bridges. In order to master the more exact value of typhoon wind characteristics, development of long-term monitoring and acquisition of more wind data on typhoon observations are warranted. In recent years, a large amount of studies has been carried out on the field measurement of wind characteristics at bridge sites. For example, Wang et al. (2009a, 2009b) utilized the typhoon data collected at Jiangsu Sutong Bridge and Runyang Yangtze River Bridge to assess strong wind characteristics, including wind velocity and direction, turbulence intensity, turbulence integral scale, and power spectrum density. Tao et al. (2016) analyzed evolutionary power spectral density on the wind-induced buffeting responses of Sutong Bridge during Typhoon Haikui. Li et al. (2010b) investigated strong wing characteristics of typhoon on Sutong Bridge site based on long-term monitoring data. Li et al. (2002) analyzed the strong wind characteristics at Nanjing Yangtze River Bridge and Nanxi Yangtze River Bridge. The relevant parameters of wind environment at the bridge site in narrow valley region were obtained by Chen et al. (2008) based on the analysis of the measured data collected at Aizhai Bridge in West Hunan. The researchers also investigated the effect of wind in mountainous-valley area on wind resistance design to bridge via wind tunnel test. Despite the studies having conducted, typhoon wind data are still not enough for the design of bridges.
Zhejiang Province is located in typhoon-prone regions. Multiple bridges across the Qiantang River (the largest river in Zhejiang Province) are being constructed and planned. As discussed above, the knowledge on turbulent characteristics of typhoon winds for the design of bridges is still insufficient. Previous studies suggested that typhoon winds were more turbulent than normal high wind events, but the discrepancies of the characteristics of these wind events have not been fully clarified. In this study, wind data were collected at the anemometer mounted on Jiubao Bridge during the passage of Typhoon Haikui. These data were used to inspect the variations in mean flow and turbulent characteristics of the wind during the passage of the storm. Specifically, mean wind velocity, direction, turbulence intensities, gust factors, and peak factors were evaluated. This research will provide useful information to the wind-resistant design of bridges in China’s coastal areas.
Field data collection program, instrumentation, and subject bridge
Typhoon Haikui
Haikui started as a tropical depression over the Western Pacific Ocean and strengthened to a typhoon on 6 August 2012. The typhoon made landfall in Zhejiang, about 225 km south of Shanghai, on 8 August 2012, and has maximum sustained winds of approximately 28 m/s with a central minimum pressure of 980 hPa. Figure 1 shows the track of the storm and the observation site. The wind velocity, direction and other data of Typhoon Haikui were recorded using the smart monitoring system installed on Jiubao Bridge. In this study, the wind data collected from 8 August 12:00 a.m. to 9 August 12:00 a.m. were utilized.
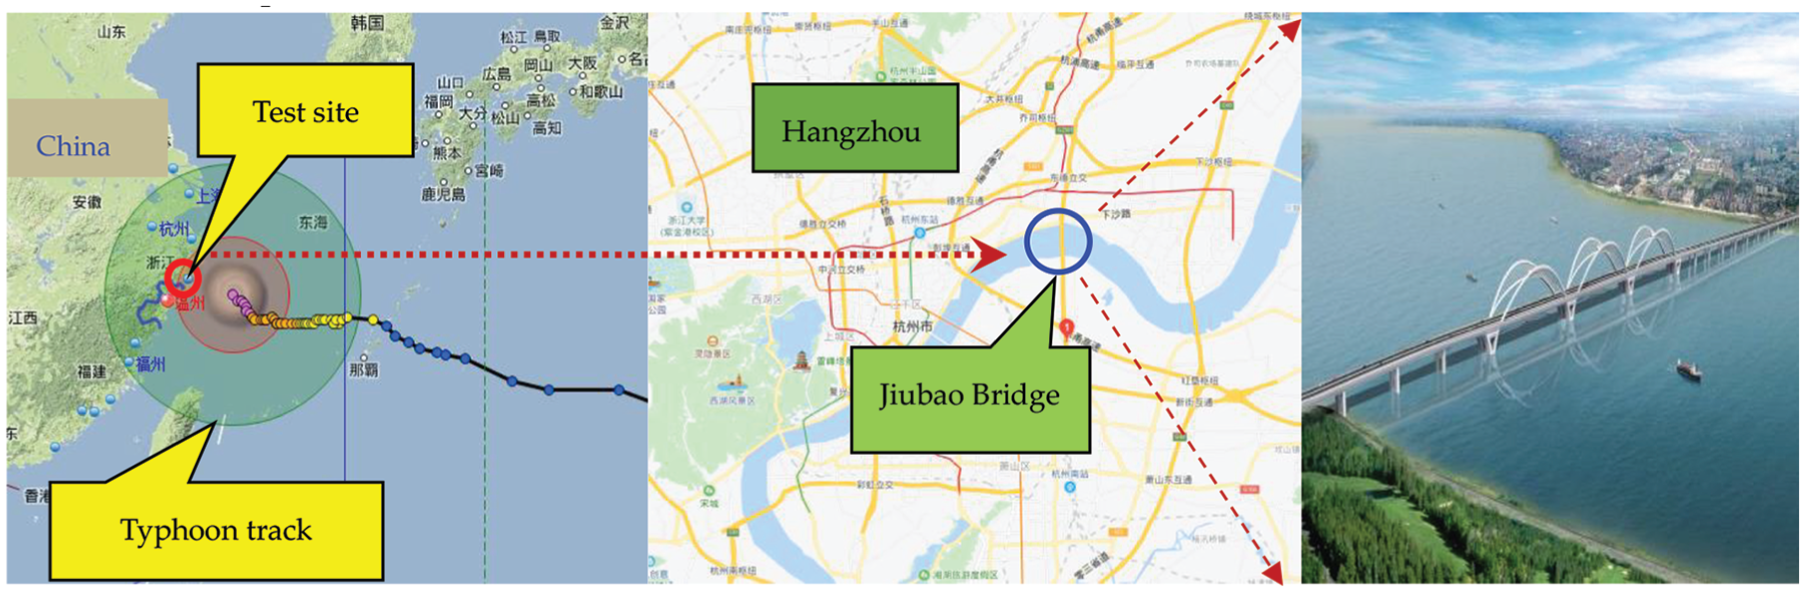
Left: schematic diagram of typhoon track; and right: overview of the Jiubao Bridge.
Health monitoring program on Jiubao Bridge
The Jiubao Bridge is a tied-arch bridge located in Hangzhou, China, which was originally constructed in 2012. The overall length of the bridge is 1855 m with three main navigation spans of 210 m (Chen et al., 2017).
The data acquisition and transmission scheme of the automatic monitoring system is composed of a data acquisition station in the external field, a server group in monitoring center, and a fiber optical signal transmission network. Field data acquisition station consists of several data acquisition modules, which can ensure the stability, durability, and high accuracy of the monitoring system.
There were 333 sensors in total mounted on the bridge, including wind velocity and direction sensors, temperature and humidity sensors, acceleration sensors, velocity and axle meters, digital camera, pressure transmission sensors, displacement sensors, strain sensors, pressure ring, and vibration sensors. The outputs of the monitoring system consist of wind velocity and direction, environmental temperature and humidity, vehicle loads, vibration, structural temperature, strain, main beam deflection, bearing displacement, and cable tension force.
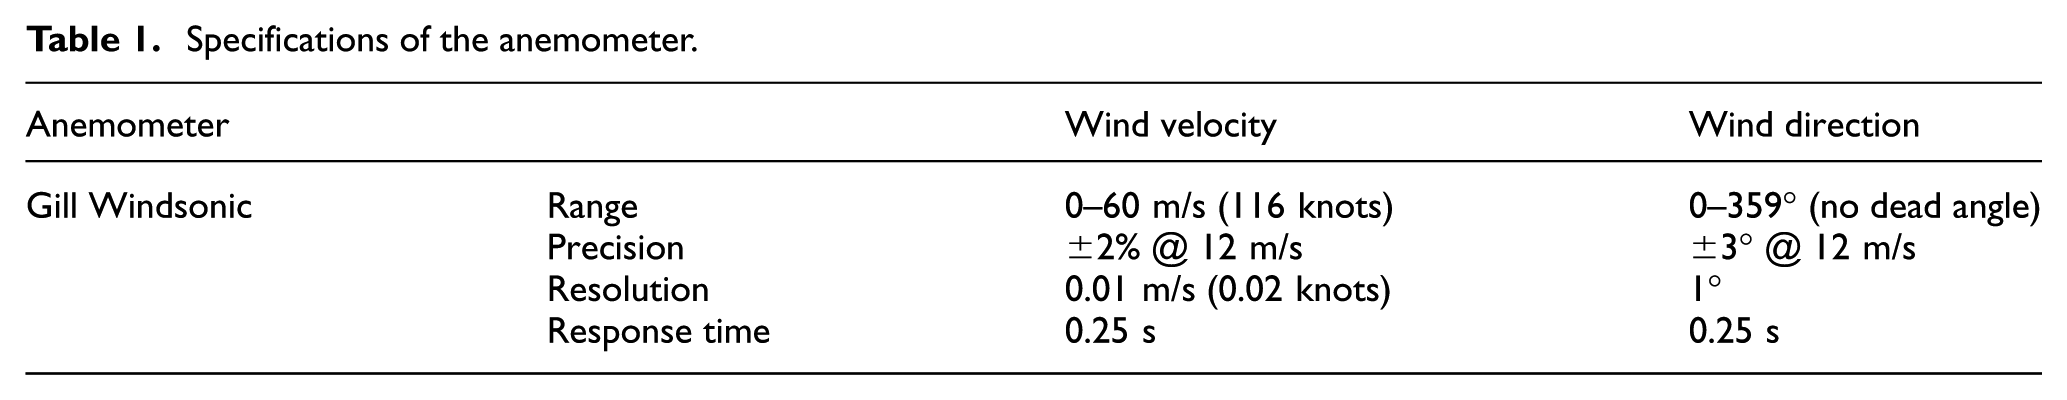
To better understand the characteristics of the wind field in the vicinity of the bridge, two-dimensional (2D) ultrasonic anemometer manufactured by Gill were installed at a height of about 6 m above the bridge decking (see Figure 2). The sampling frequency of the anemometer is 4 Hz. The north is defined as the 0° wind direction, and the wind direction angle increases clockwise. The technical specifications of the anemometer are listed in Table 1.
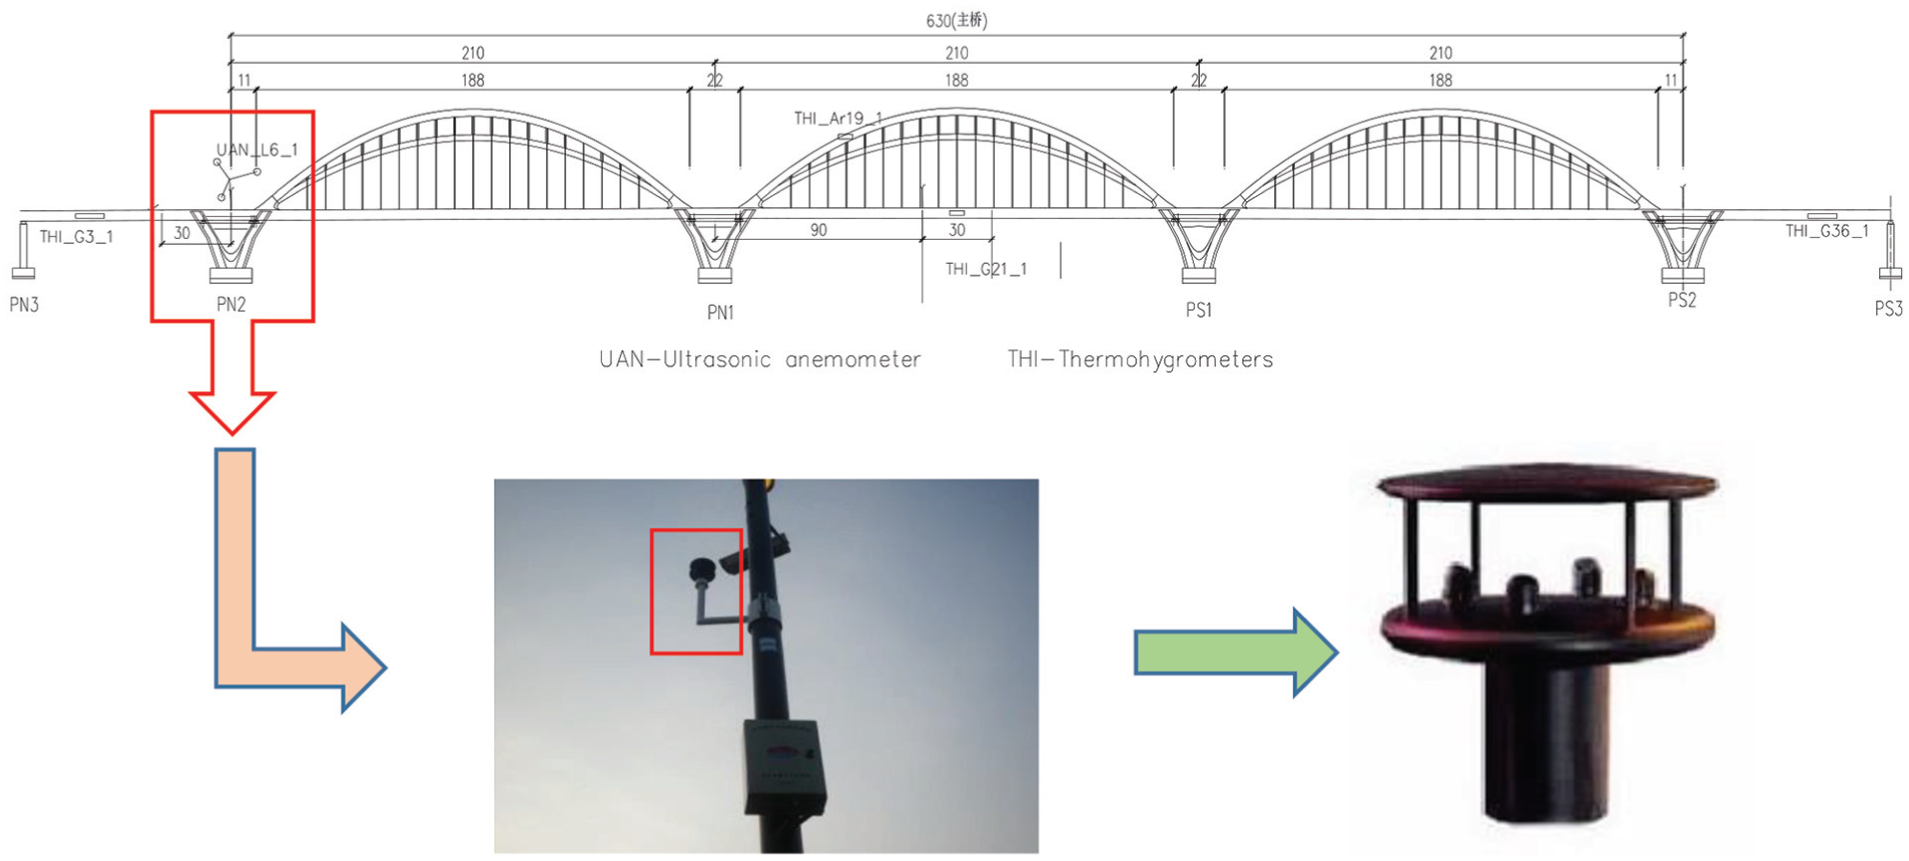
Schematic diagram of anemometer arrangement on Jiubao Bridge.
Specifications of the anemometer.
Data processing
Mean wind speed and wind direction
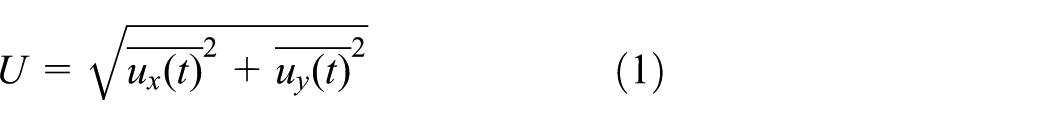
The time series of the wind data collected during the storm were divided into multiple 10-min segments. The 2D ultrasonic anemometer directly measured the wind velocity components in the orthogonal directions,
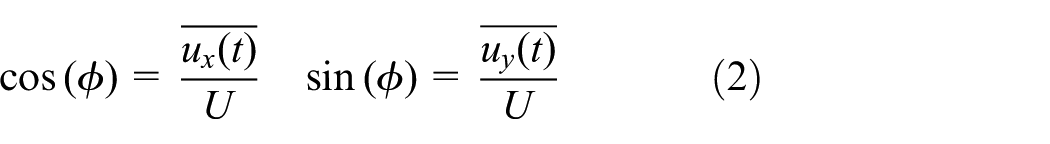
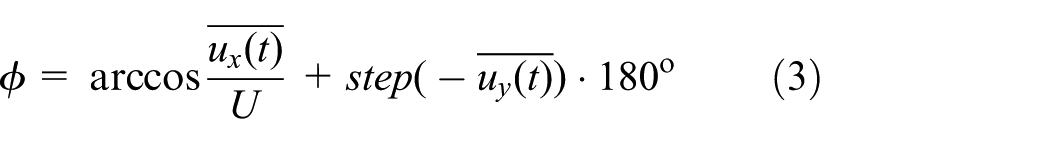
where step(·) is a step function, and
The equations for calculating the longitudinal fluctuating wind velocity component


Turbulence intensity
As an important parameter for determining wind loads on structures, turbulence intensity is the ratio of the standard deviation of each fluctuating wind velocity component to the mean wind velocity within a specific time period. It can be calculated by
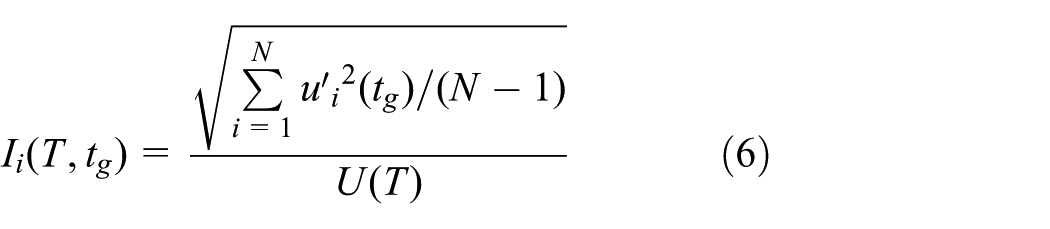
where Ii(T, tg) is turbulence intensity component in a specific direction (i = u, v, w); T is denoted as the averaging period for the mean wind speed;
Gust factors
Gust factor is defined as the ratio of the maximum gust speed within a specific time period to the mean wind speed and is determined as follows
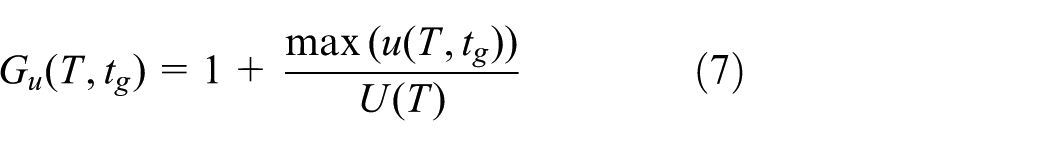
where max(u(T, tg)) and max(v(T, tg)) represent the maximum fluctuating wind velocity component in the longitudinal and lateral directions, respectively.
Peak factors
Peak factor is used to describe the instantaneous intensity of longitudinal fluctuating wind velocity. It is determined herein using the following equation (Yu et al., 2008)
where
Typhoon characteristics
Mean wind velocity and direction
In this study, the 24-h real-time record of wind data was truncated into 144 10-min samples. Wind velocity and direction time histories during the passage of Typhoon Haikui are shown in Figures 3 and 4, respectively. Since the eyewall of the storm did not pass through the location, there was only one peak observed in the wind velocity time histories. The maximum wind velocity of 18.64 m/s was recorded at approximately 3:00 p.m., where as the maximum 10-min mean wind velocity is 14.12 m/s. The 10-min mean wind direction is approximately from 20° to 80°. There has strong dispersion observed from the variation of instantaneous wind directions, which ranged from 0° to 360°. From Figure 4(c), we can see that the larger fluctuations at two wind direction areas, one is nearly at 0° that agree with Figure 4(b), another is within the region from 60° to 80°.
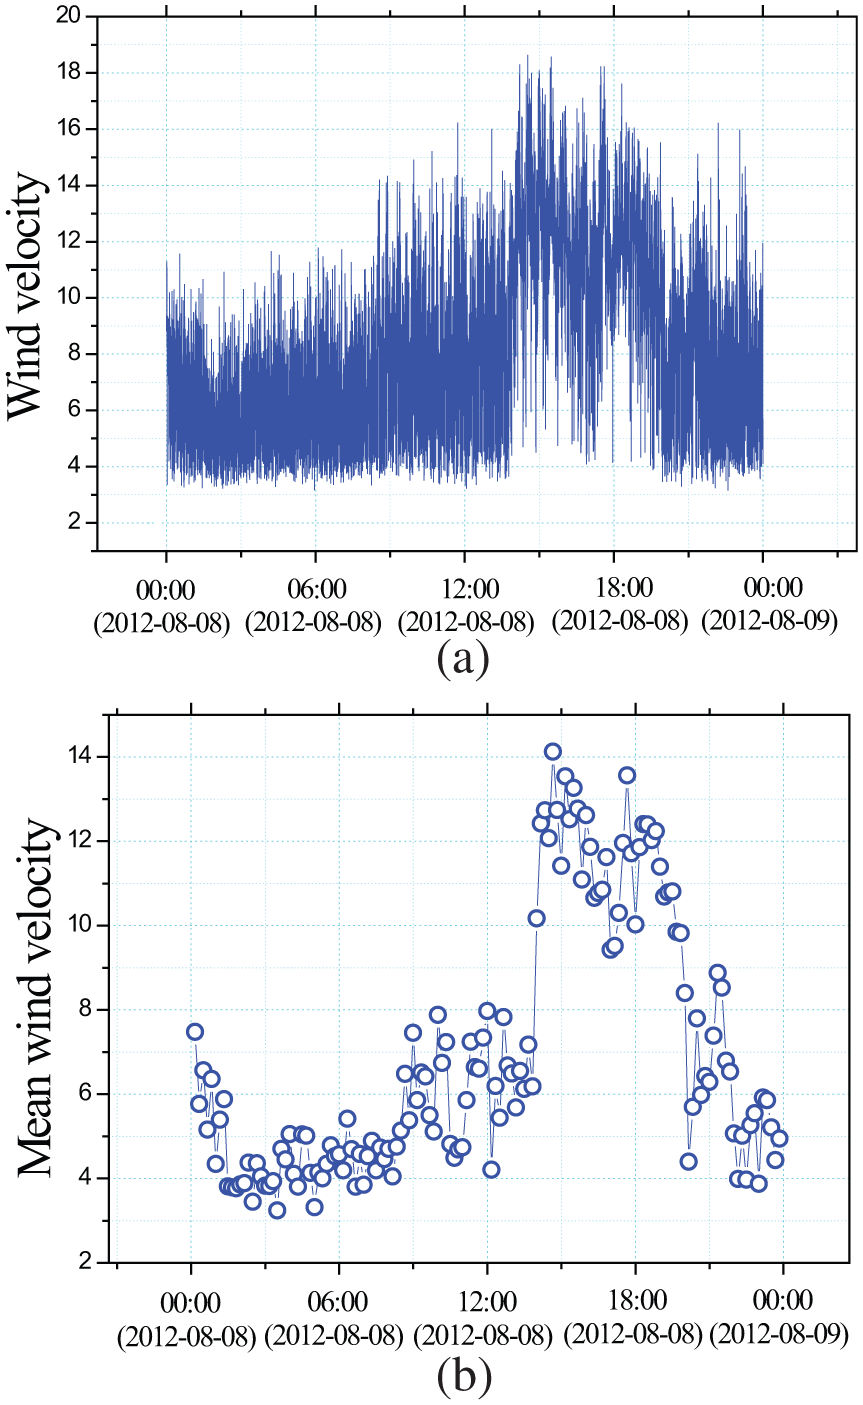
Wind velocity data collected during the passage of Typhoon Haikui: (a) instantaneous wind velocity and (b) 10-min mean wind velocity.
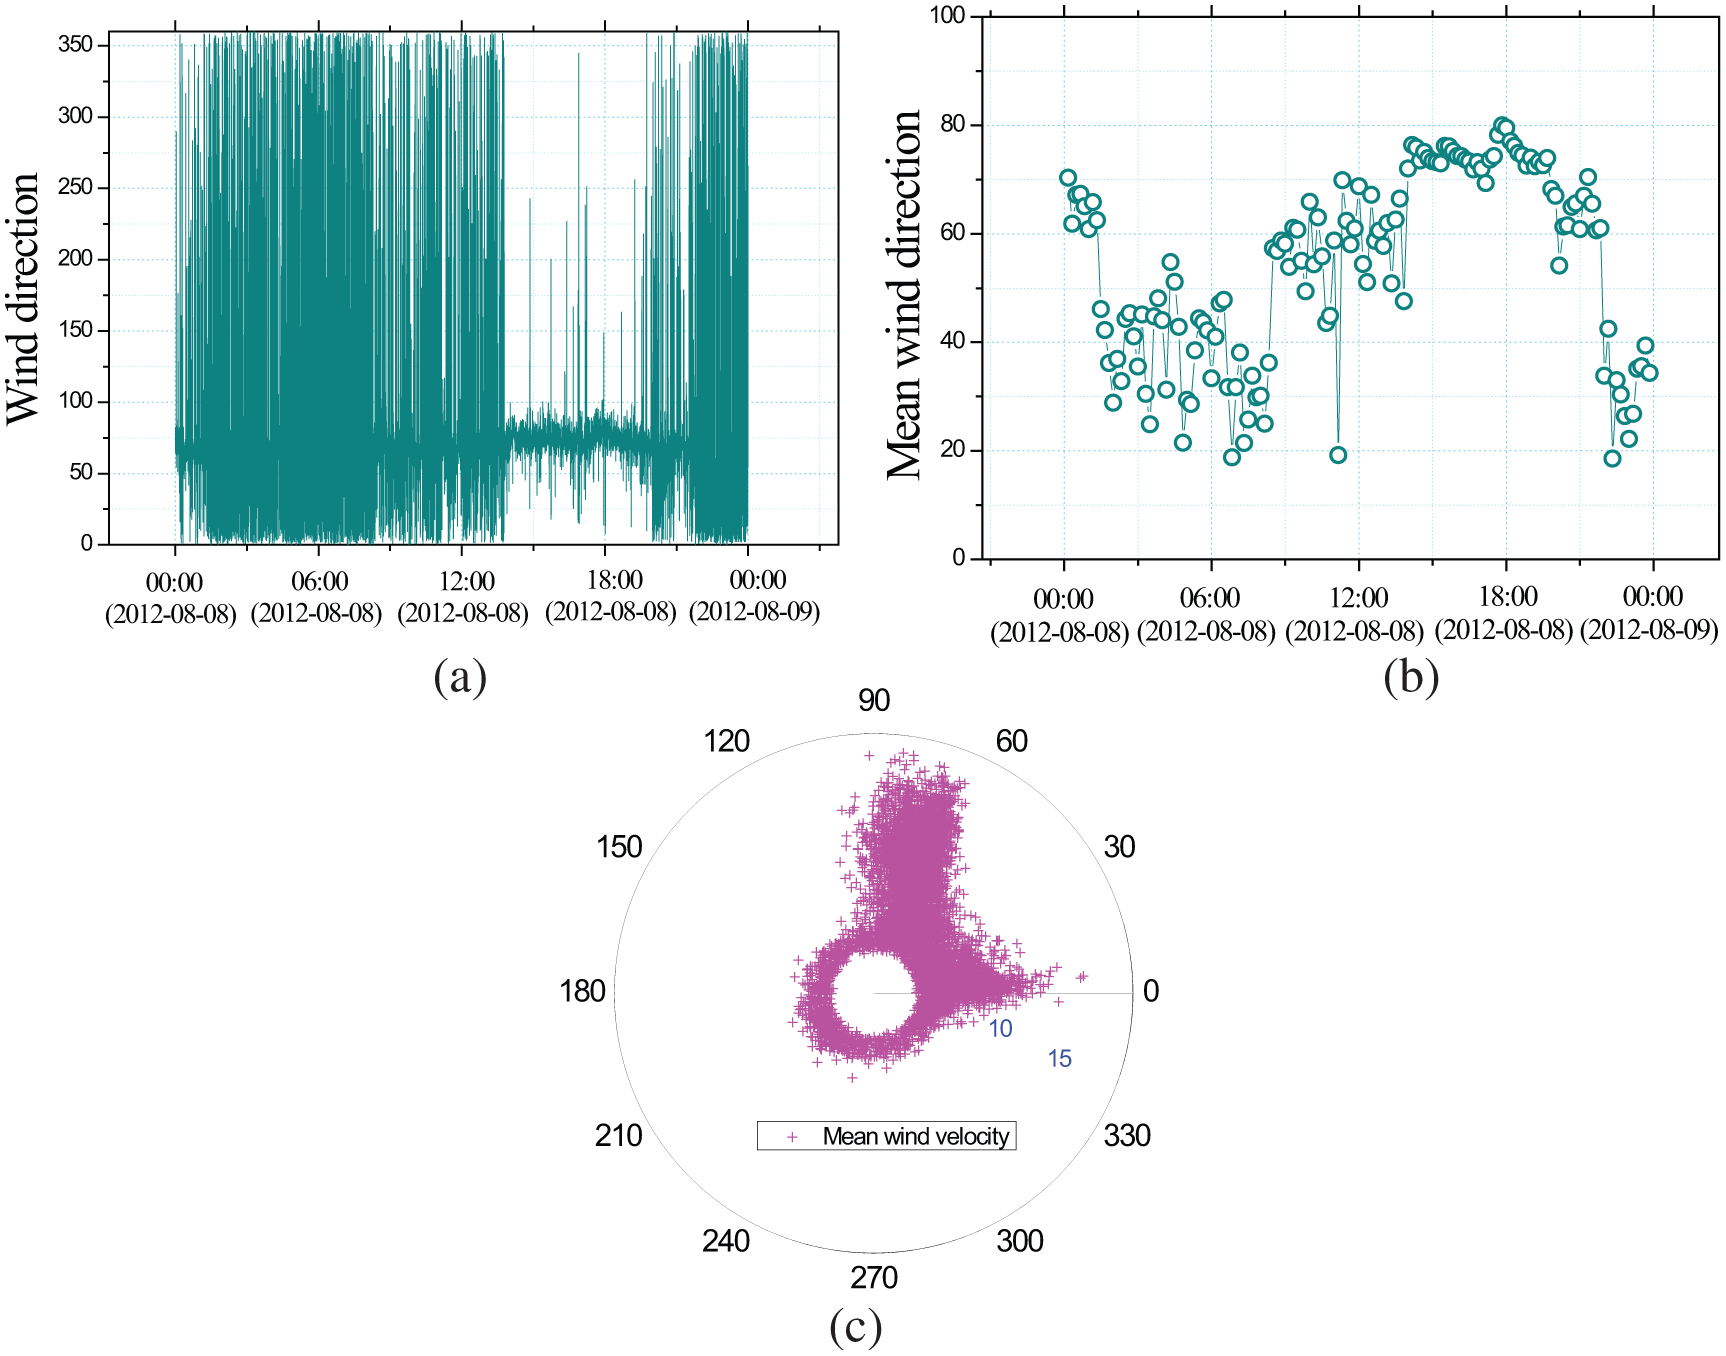
Wind direction record collected during the passage of Typhoon Haikui: (a) instantaneous wind direction, (b) 10-min mean wind direction, and (c) variation of mean wind velocity with 10-min mean wind direction.
Turbulence intensities, gust factors, and peak factors
Longitudinal and lateral turbulence intensities are plotted with the 10-min mean wind velocities in Figure 5. Like the previous study results (Cao et al., 2009; Schroeder, 1999; Xiao et al., 2009), it can be seen that both longitudinal and lateral turbulence intensities show a decreasing trend with mean wind velocities. However, the trend is no longer apparent when the mean wind velocity exceeds 10 m/s. It was found that the longitudinal turbulence intensities are slightly larger in magnitude than the lateral turbulence intensities. In order to identify the similarity and discrepancy in the wind characteristics of various storm events, the ratio of longitudinal turbulence intensity to lateral turbulence intensity in this study is compared with the values from previous studies, as shown in Table 2. As a whole, the ratios of longitudinal turbulence intensity to lateral turbulence intensity in these studies range from 0.6 to 0.95. It is noteworthy that the result in this study is in a good agreement with those in Schroeder (1999) and Cao et al. (2009), but it is more than those in Xiao et al. (2009), Huang et al. (2013), and Masters et al. (2010).
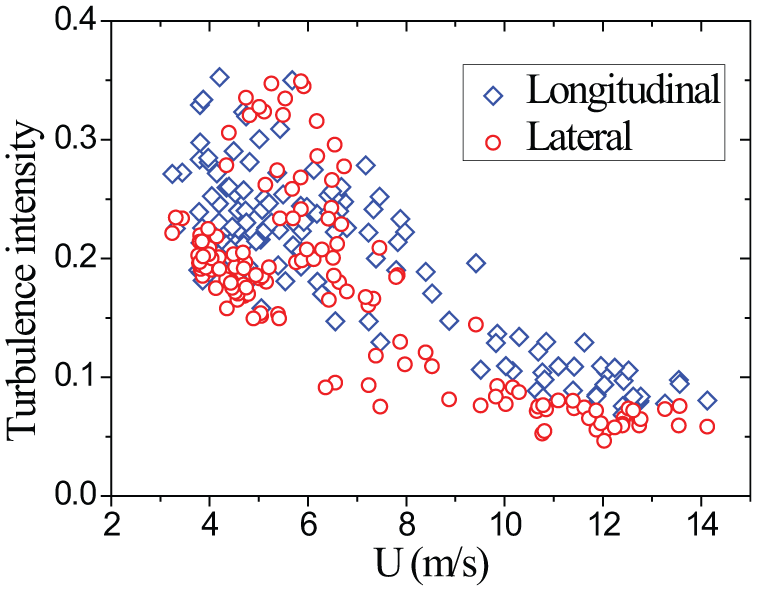
Turbulence intensity distribution with mean wind velocity.
Comparison of turbulence intensity ratios from various studies.
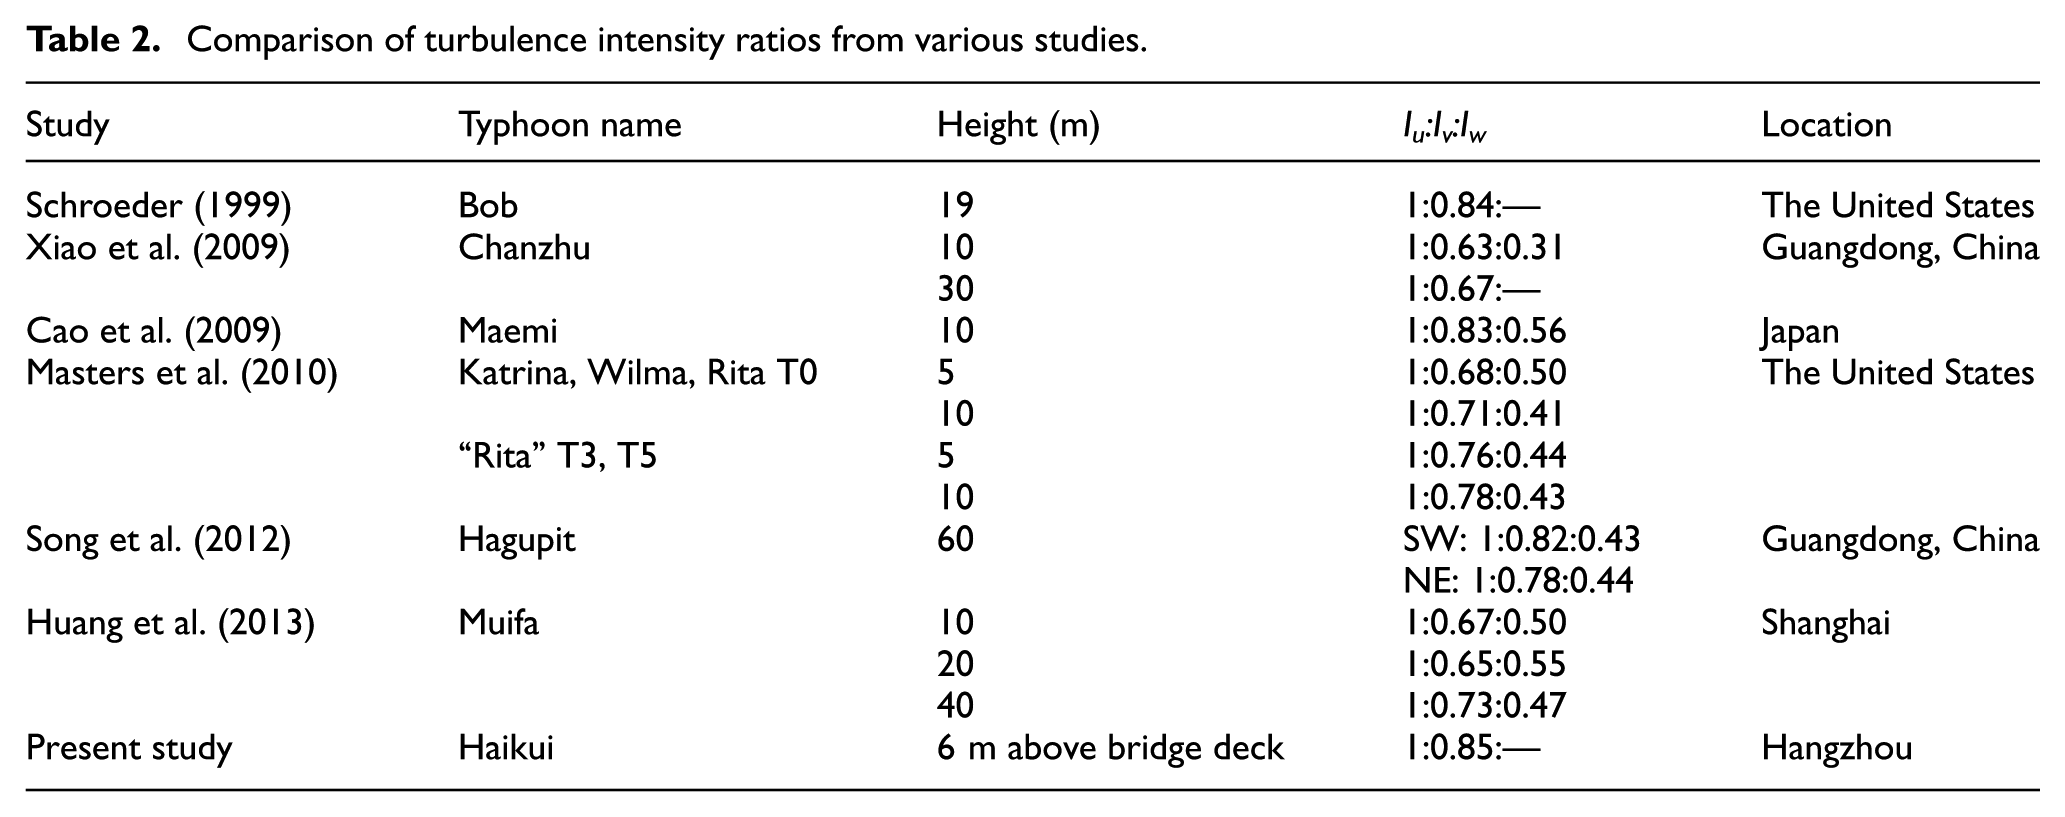
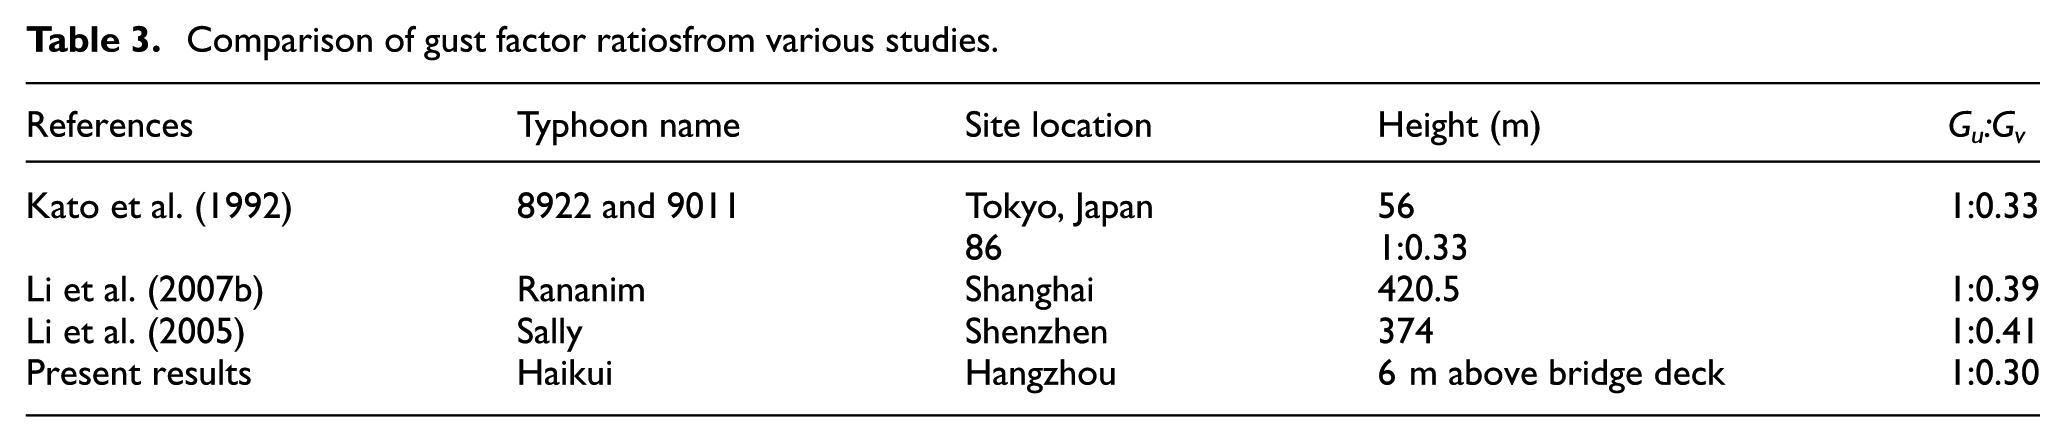
Figure 6 presents the variation of longitudinal and lateral gust factors with 10-min mean wind velocity. The longitudinal gust factors obtained using the collected wind data are larger than that obtained in the lateral direction, regardless of mean wind speeds. As the mean wind velocity increases, both the longitudinal and lateral gust factors exhibit a decreasing trend; however, the falloff rate decreases with increase in the mean wind velocity. For comparison, the gust factor ratios in previous studies are summarized in Table 3. The ratio of longitudinal gust factor to lateral gust factor in this study is 0.30, which is slightly lower than that of Li et al. (2005, 2007b) However, the former compares well to the Kato et al. (1992) value of 0.33 (see Table 3).
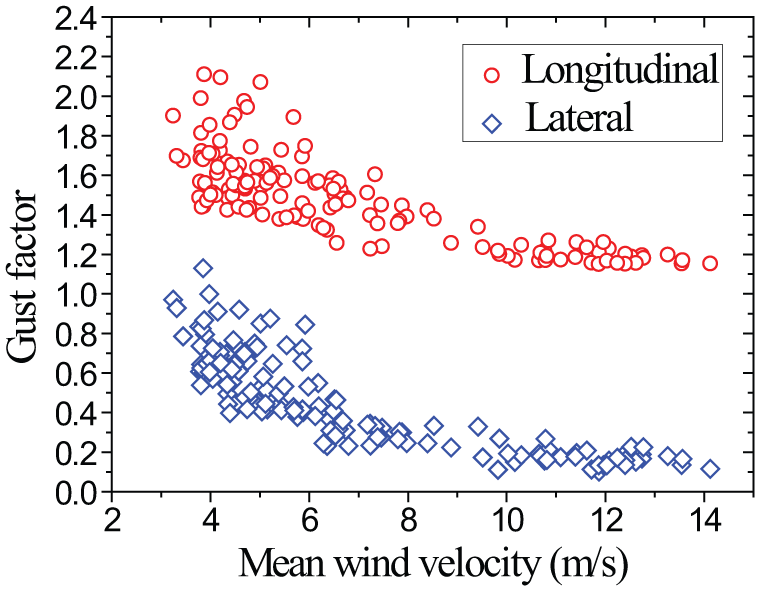
Gust factor distribution with mean wind speed.
Comparison of gust factor ratiosfrom various studies.
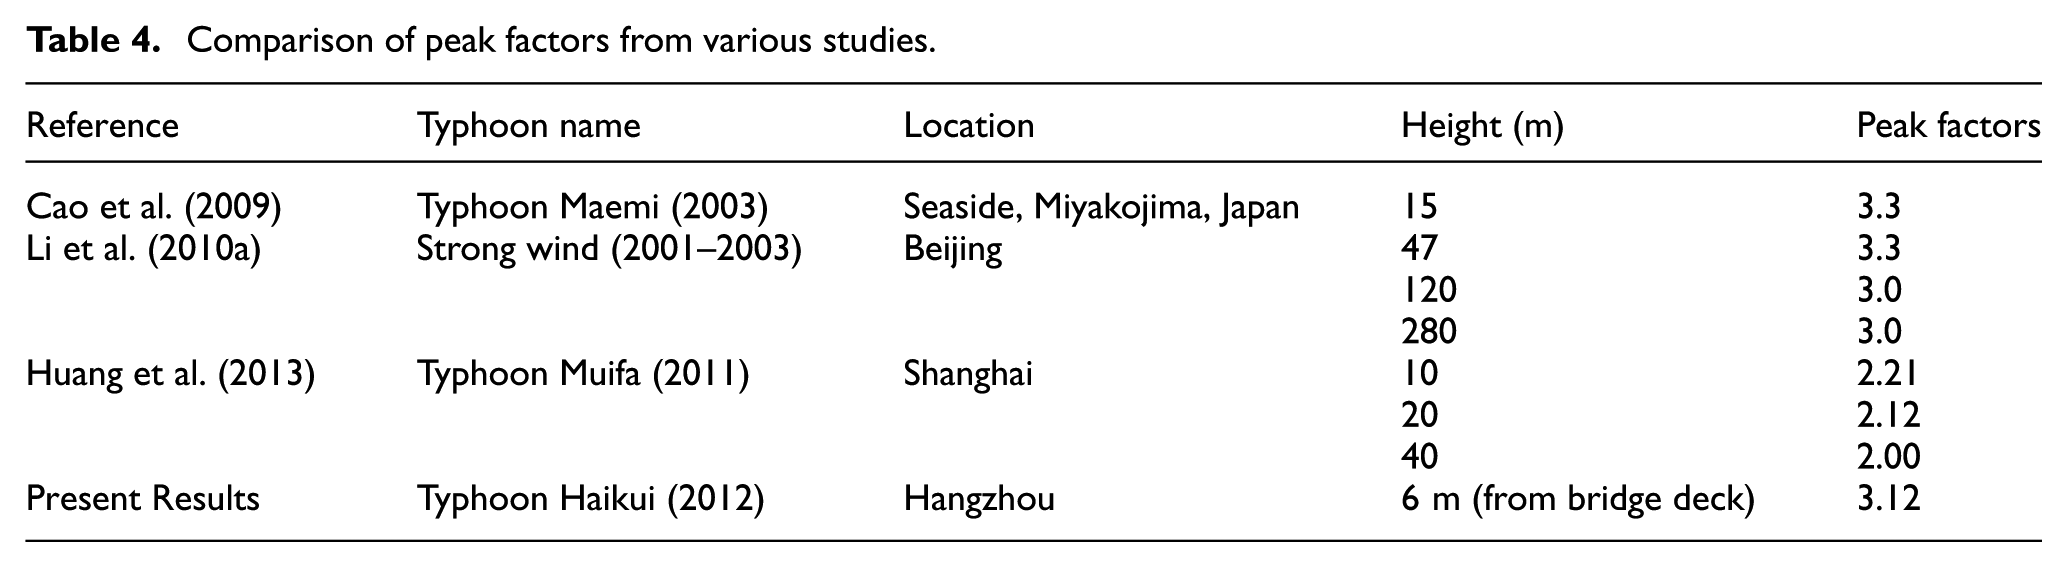
The variation of peak factors with 10-min mean wind velocity is shown in Figure 7. It can be seen that the peak factors generally vary from 2.0 to 4.2 and do not exhibit a strong correlation with the mean wind velocities. Table 4 shows the comparison between the present results and the data collected in the previous studies in the same manner as Tables 2 and 3 described in the chapters above. The mean peak factor in this study is equal to 3.12, which agrees well with the results in Cao et al. (2009) and Li et al. (2010a), and is larger than Huang et al. (2013).
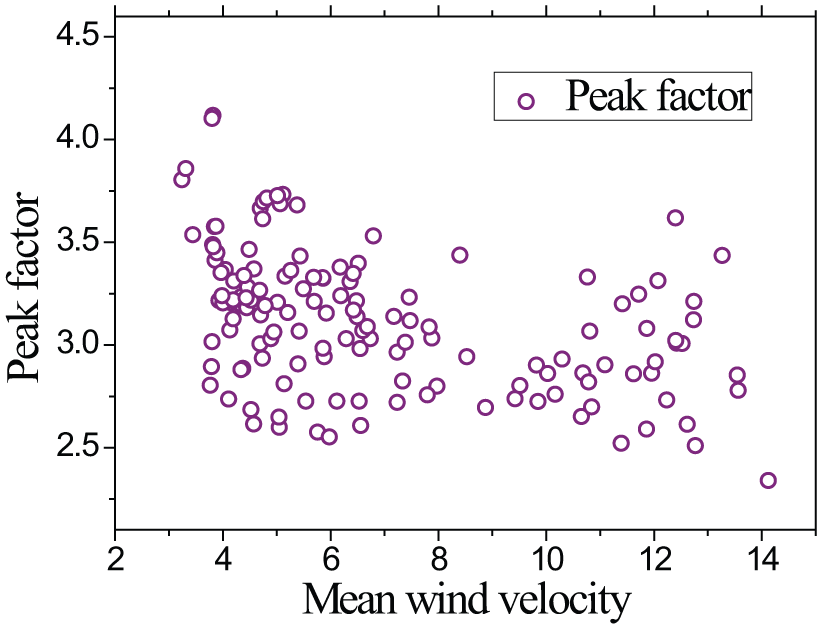
Variation of peak factors with mean wind speed.
Comparison of peak factors from various studies.
Variation of turbulence intensity, gust factor, and peak factor with gust duration
The standards and codes of wind engineering in various countries have great differences in gust averaging interval. Previous studies have shown that the selection of gust averaging interval has great influence on the estimation of the fluctuating parameters, including turbulence intensities, gust factors, and peak factors. The variation of fluctuating parameters with gust averaging interval based on field measurement of normal wind in the United States is first proposed by Durst (1960).
In this study, the relationship between some parameters, including turbulence intensity and gust factor, and gust averaging interval is evaluated and presented in Figures 8 to 10. The empirical curves developed by Durst (1960) and Krayer and Marshall (1992) are provided for comparison. It can be seen that the longitudinal turbulence intensity is larger than the lateral intensity. As a whole, there is a good agreement between the peak factor distribution curve in this study and the Durst curve. As compared with Durst and Krayer-Marshall curves, the longitudinal gust factors obtained using the data collected during the passage of Typhoon Haikui are obviously larger, as shown in Figure 11(a). It indicates that it may be not appropriate to use the previous empirical curves obtained based on normal wind events as a representation of the wind characteristics of Typhoon Haikui. The variation of lateral gust factors with gust averaging time interval is shown in Figure 11(b). The lateral gust factors also display a falloff trend with the gust averaging time, and their values are basically limited to a range between 0.0 and 1.0.
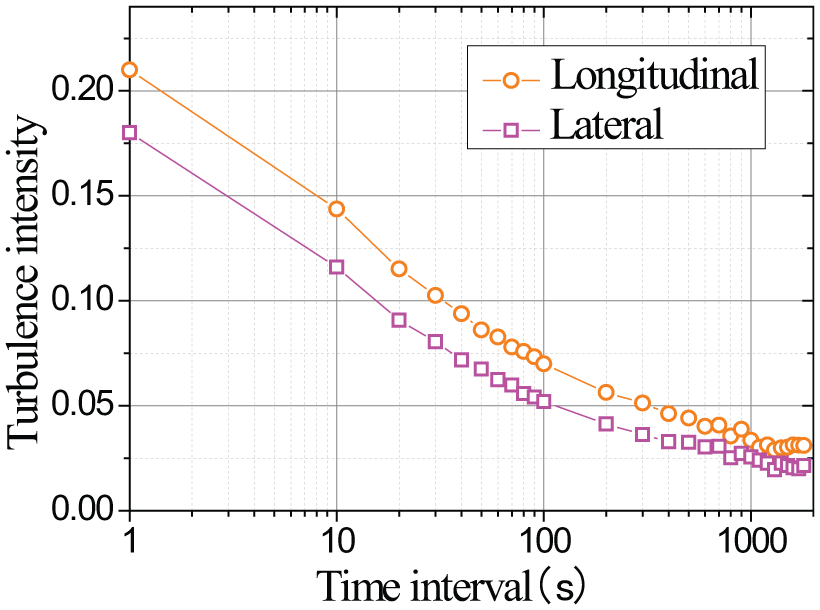
Variation of turbulence intensity with gust averaging interval.
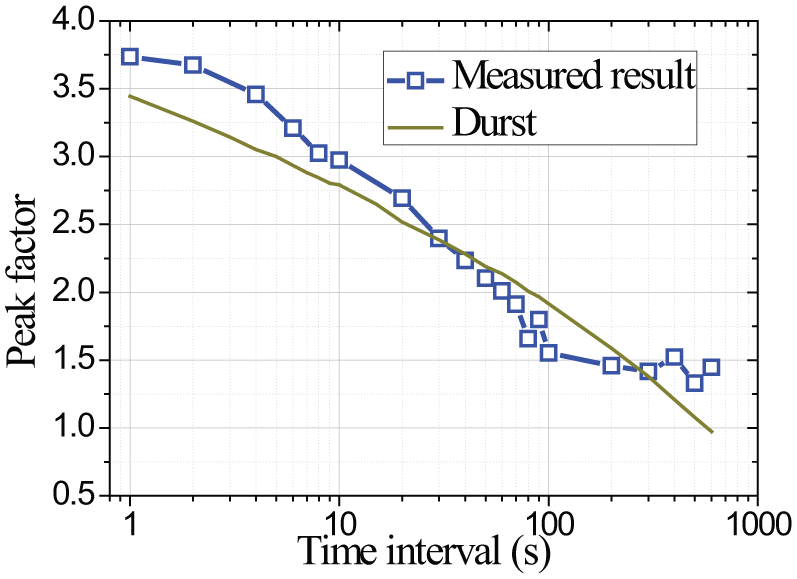
Variation of peak factors with gust averaging interval.
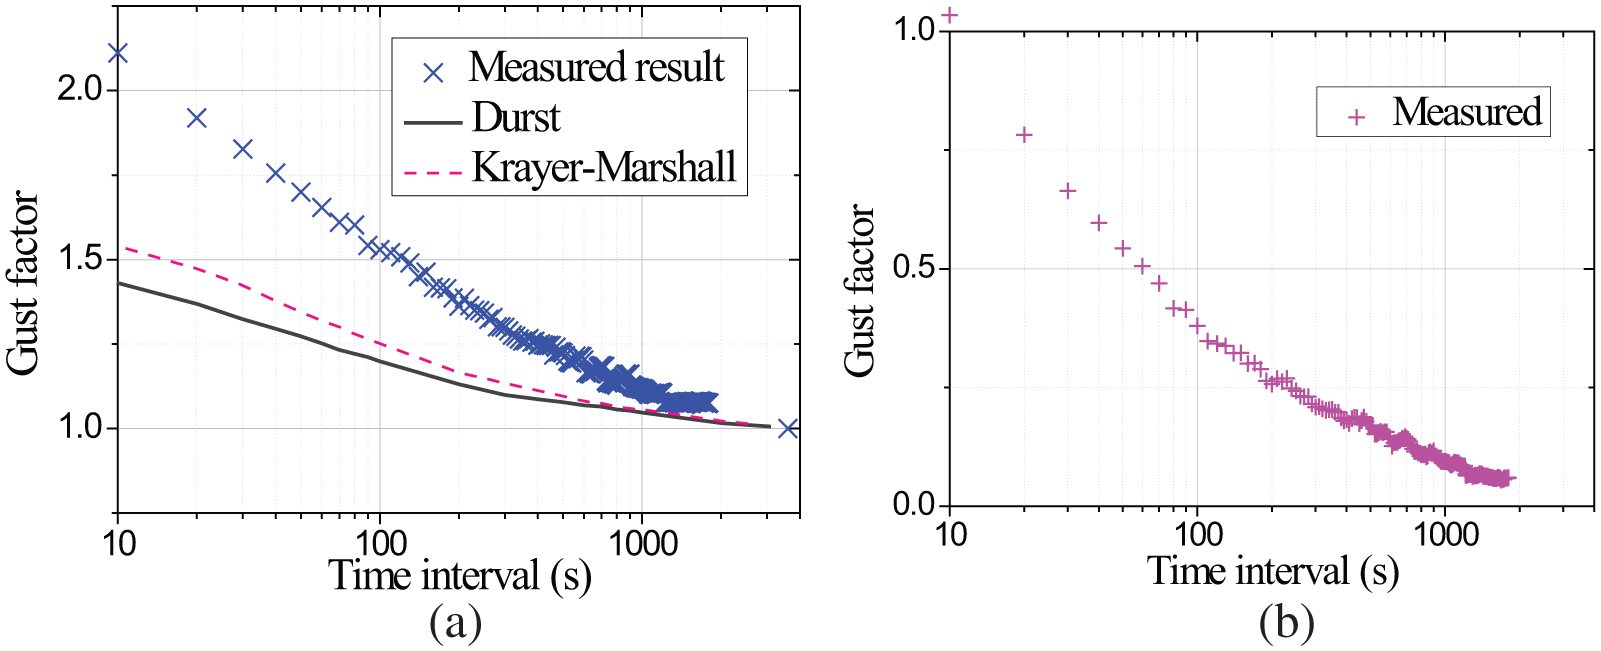
Variation of gust factors with average gust time interval: (a) longitudinal and (b) lateral.
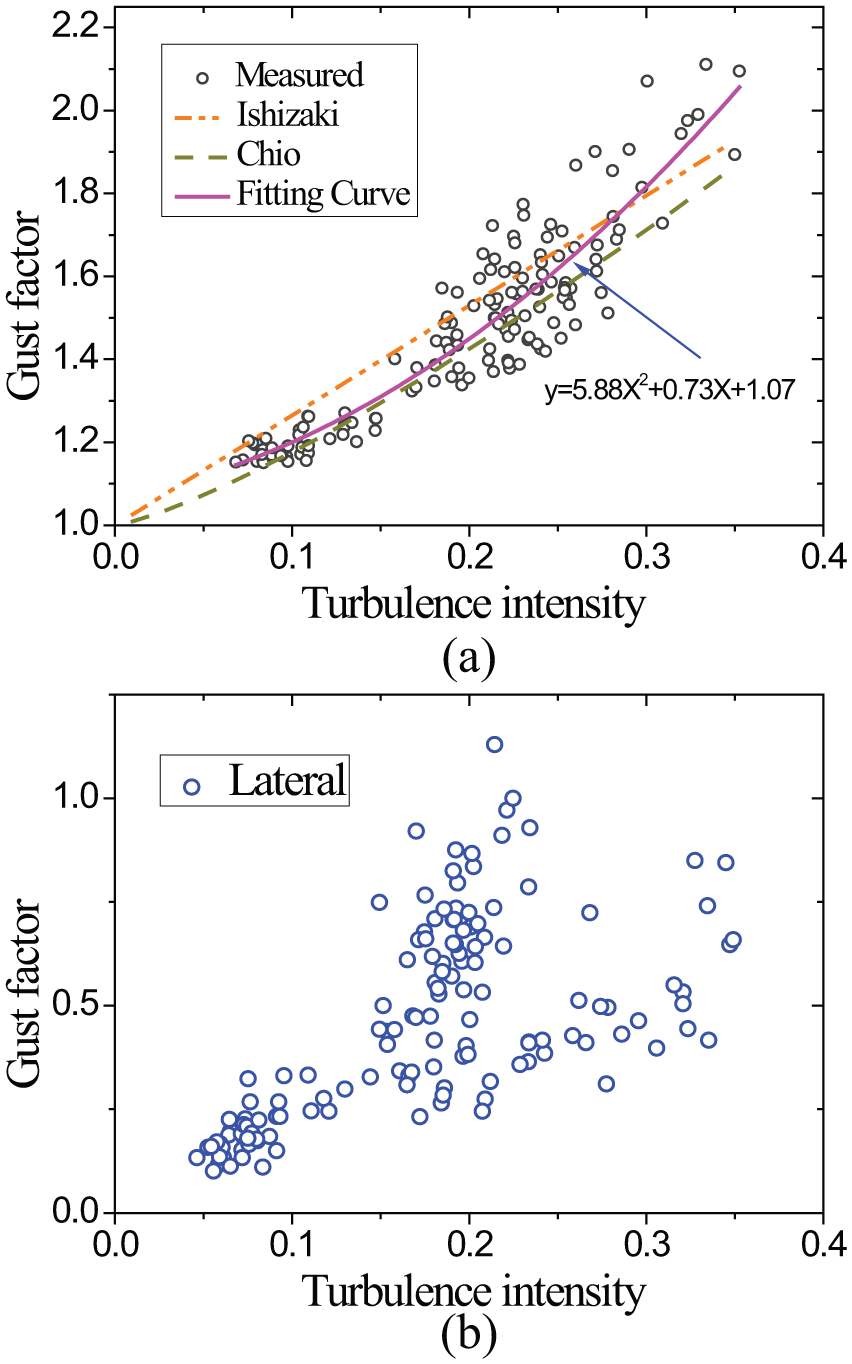
Turbulence intensity versus gust factor: (a) longitudinal and (b) lateral.
Turbulence intensity versus gust factor
Based on the measurement data of Typhoon “8922” and “9011” in Japan, the empirical formula used to describe the relationship between gust factors and longitudinal turbulence intensity was first proposed by Ishizaki (1983), as follows

where tg is average gust time and T is the basic period for the mean wind velocity. Ishizaki stated that the turbulence intensity was in a linear relationship with the gust factor and thus suggested the parameters a and b be equal to 0.5 and 1.0, respectively. This formula was improved by Choi (1983). Choi revisited the relationship between the turbulence intensity and the gust factor, and estimated the values of a and b from their measured data. In their study, a is equal to 0.62 and b is estimated to be 1.27.
Figure 11(a) presents the variation of longitudinal gust factors with longitudinal turbulence intensities. The scattered circles are representative of the results obtained from the collected data during Typhoon Haikui. It was observed that the longitudinal gust factors increase with the longitudinal turbulence. In addition, the previous empirical curves developed by Ishizaki (1983) and Choi (1983) are added to this plot for comparison. Comparison reveals that there is deviation between the measured data and the empirical expressions. The results in this study can be well fitted by a quadratic polynomial, as manifested in the pink solid line in Figure 11(a), and the expression is
Turbulence integral scale
The turbulence integral scale represents the size of the turbulence vortices most frequently occurred. According to the Taylor hypothesis, the autocorrelation function integral method was used to calculate the longitudinal turbulence integral scale
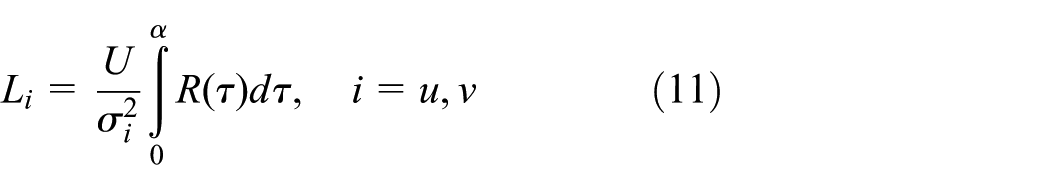
where
Figure 12 displays the variation of longitudinal and lateral turbulence integral scales with 10-min mean wind velocity. The turbulence integral scales of wind components increased with mean wind velocity. The mean values of turbulence integral scales for longitudinal and lateral directions are 85.4 and 65.5 m, respectively.
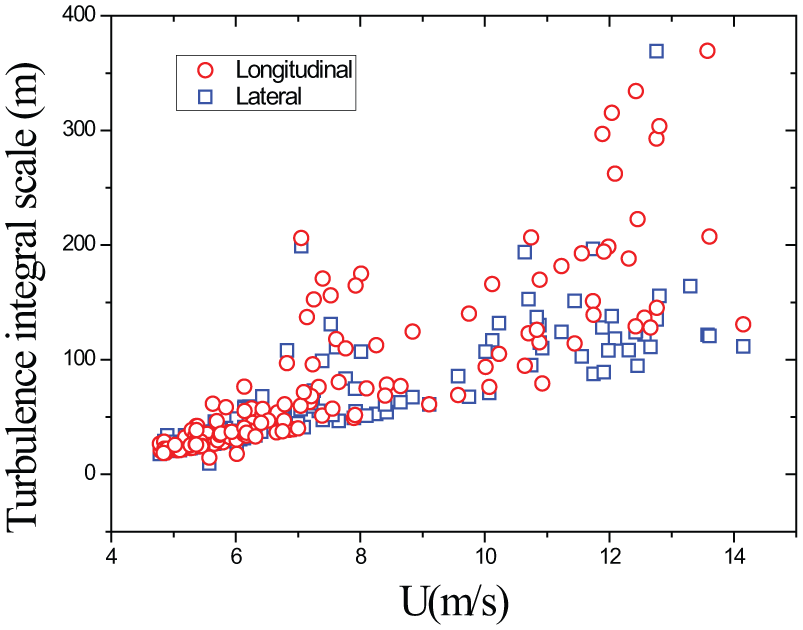
Variation of turbulence integral scale with mean wind velocity.
Furthermore, the turbulence integral scales changed with time interval was shown in Figure 13. The time interval selected in this article is from 10 to 60 s. The turbulence integral scales for 2D components both increased with time interval, but faster rate of change for longitudinal component.
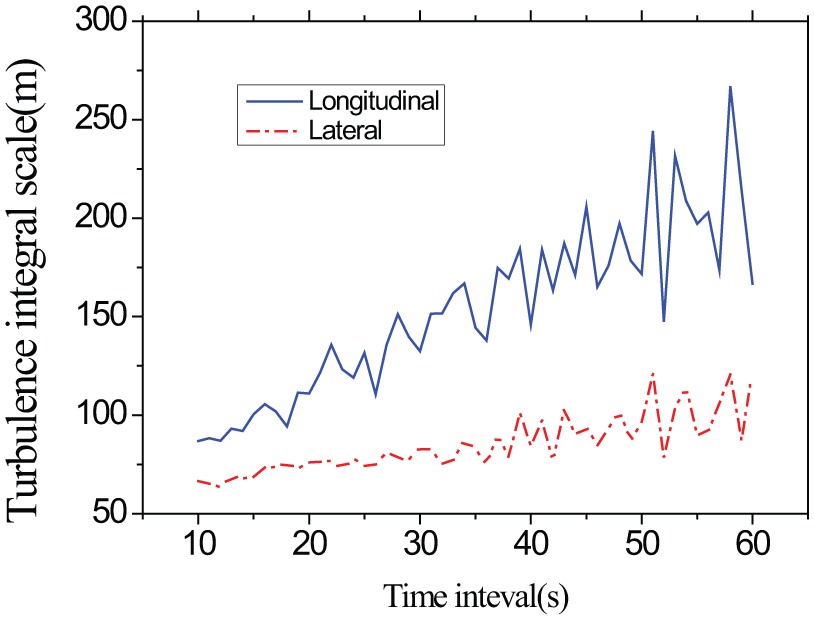
Variation of turbulence integral scale with gust averaging time.
In order to better serve engineering applications, the non-dimensional method was used. The variations of the ratio
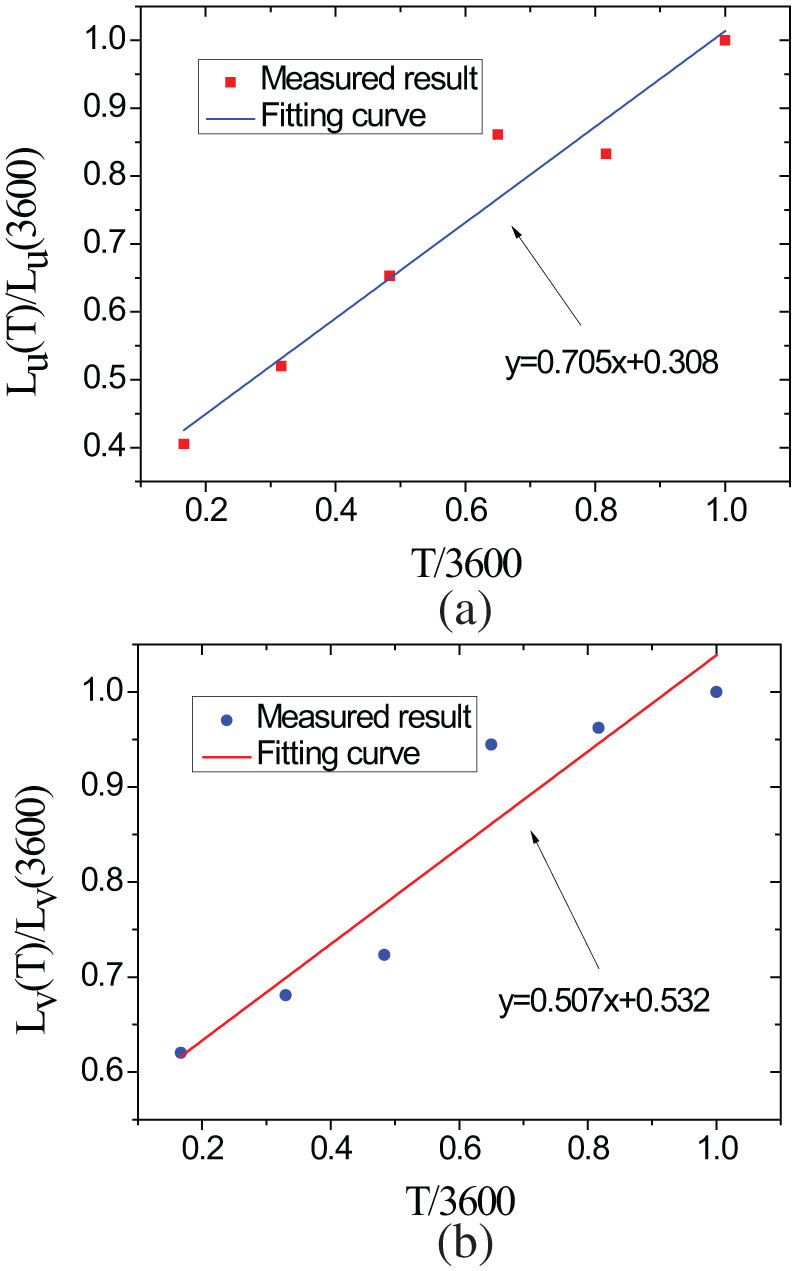
Variation of turbulence integral scale with gust averaging time: (a) longitudinal and (b) lateral.
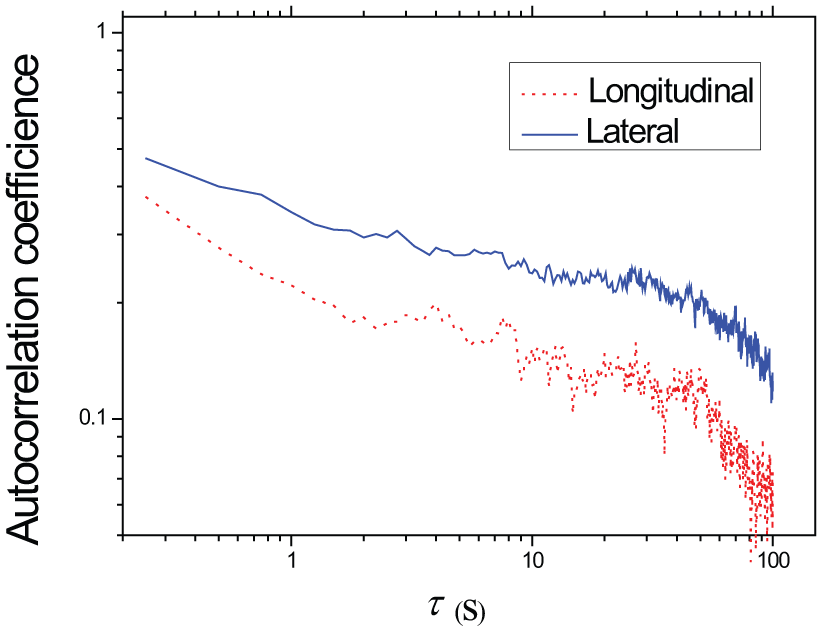
Autocorrelation coefficients of wind speed fluctuation components.
Correlation
Autocorrelation describes the correlation of two dependent time series at different time. If X(t) obeys stationary stochastic process, then its autocorrelation function can be expressed as

where
Figure 15 shows the variation of the autocorrelation coefficients of longitudinal and lateral wind components with time delay τ. The values of autocorrelation coefficients for longitudinal component are larger than lateral component among all the time delay shown in the figure. But both of the change trends for 2D components are the same.
The cross-correlation coefficient represents the degree of correlation between two time series based on mean and deviation. In this article, it is expressed as
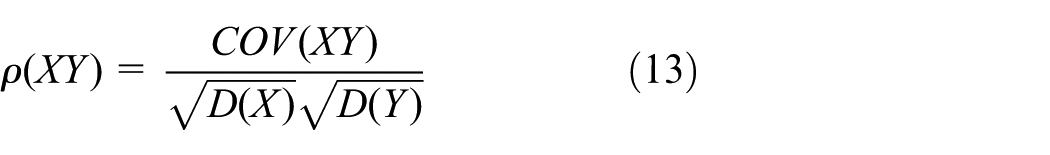
where
Figure 16 shows the variation of cross-correlation coefficient between longitudinal and lateral components with mean wind velocity based on different 10-min wind samples. There is no obvious variation of cross-correlation coefficients with mean wind velocity. The mean value of
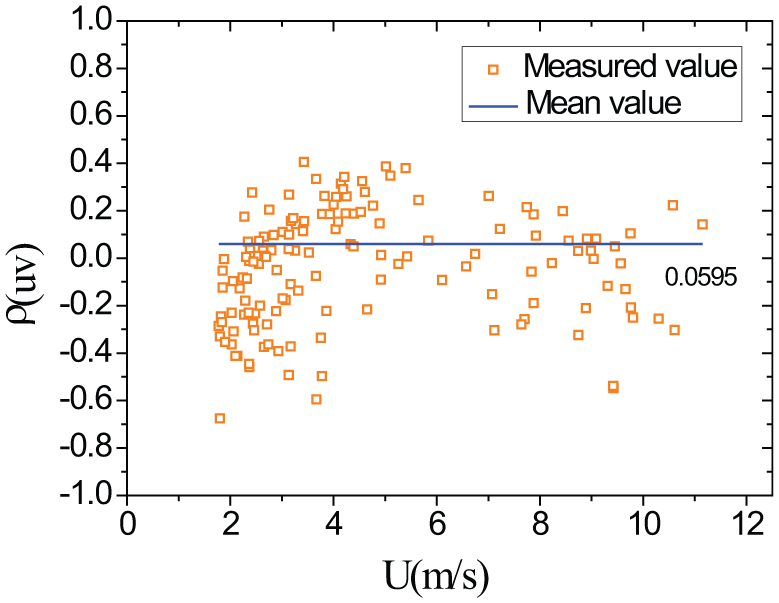
Variation of cross-correlation coefficient between longitudinal and lateral components with mean wind velocity.
Conclusion
Wind data were collected at a height of 6-m above the bridge decking of Jiubao Bridge, Hangzhou, during the passage of 2012 Typhoon Haikui. The contents of the article document the mean flow and turbulence characteristics from data recorded during the storm. The following important conclusions were made:
The turbulence intensity decreases with increase in the mean wind velocity. The longitudinal turbulence intensity component is generally larger than the turbulence component in the lateral direction. The ratio of the two turbulence intensity components obtained in this study agrees well with the values in Schroeder (1999) and Cao et al. (2009).
When the wind velocity is less than 6 m/s, the longitudinal and lateral gust factors show a rapid falloff with increase in the mean wind velocity. However, this trend gradually attenuates in the case of wind velocities of more than 6 m/s. The longitudinal gust factor is significantly larger than the lateral gust factor.
There is a general agreement between the peak factor distribution with gust averaging time duration derived with the Typhoon Haikui data and the existing Durst curve. However, it was observed that the longitudinal gust factor distribution with gust averaging time duration is larger than the Durst and Krayer-Marshall curves. The discrepancy indicates that it may be not appropriate to use these empirical curves obtained based on normal wind events as a representation of the wind characteristics of Typhoon Haikui.
Analyses of the gust factor distribution with the turbulence intensity during the passage of the storm reveal a similarity to the empirical curves of Ishizaki and Choi. Nevertheless, there is an offset between the measured results and these empirical curves. Results show that the relationship between lateral turbulence and gust factors can be well represented by a quadratic polynomial.
The turbulence integral scales of wind components increased with mean wind velocity and time interval. The mean values of turbulence integral scales for 2D fluctuating components are 85.4 and 65.5 m.
The autocorrelation coefficients in longitudinal direction are larger than those in lateral direction under different time delay. The variation of the cross-correlation coefficients has no clear regulation with mean wind velocity.
Footnotes
Declaration of Conflicting Interests
The author(s) declared no potential conflicts of interest with respect to the research, authorship, and/or publication of this article.
Funding
The author(s) disclosed receipt of the following financial support for the research, authorship, and/or publication of this article: The research was financially supported by 111 Project of China (Grant No. B18062), the National Natural Science Foundation of China (Grant Nos 51708074, 51678544, and 51678452), and the Key Project of Foundation and Frontier Research of Chongqing (Grant No. cstc2017jcyjAX0187). The authors gratefully acknowledge the financial support.