
Abstract
This work presents an experimental study on the flexural behavior of steel tube slab composite beams subjected to pure bending. The main design elements considered in the work are the flange thickness, reinforcement ratio of high strength bolts, spacing between the tubes, and transverse patterns of the tube connections. Based on nine flexural experiments on simply supported steel tube slab specimens, the failure process and crack development in steel tube slab specimens, and their load–deflection curves are investigated. The results of the laboratory tests show that the welding of the bottom flange significantly improves the flexural capacity of the steel tube slab structure. In addition, a lower concrete’s compressive strength improves the ductility of the steel tube slab specimens. Moreover, the flexural capacities predicted from the design guidelines are in good agreement with the experimental test results. Finally, based on the numerical simulations using the ABAQUS software, a numerical model is established to further investigate the effect of the additional parameters on the flexural capacity of steel tube slab structures. The numerical results suggested that the diameter of the steel bolts and the reinforcement ratio have a limited effect on the flexural bearing capacity of the steel tube slab beams, and the ultimate bearing capacity increases linearly along with increase in the diameter of the steel bolts and the reinforcement ratio in a certain range.
Keywords
Introduction
The pipe-roofing method has been widely used in tunneling activities since the 1970s because of its several advantages, such as limited effect on the surrounding environment, and applicability in different ground conditions (Schumacher and Kim, 2013; Musso, 1979). The pipe-roofing method may serve as a presupported structure in tunnel operations to increase the stability of the tunnel face and decrease the ground settlement caused by the tunnel excavation. In the traditional pipe-roofing method, the steel tubes are connected by a low-strength interlock system in the transverse direction (Liu et al., 2018). Thus, the stability of the pipe-roofing system during excavation is ensured by the longitudinal flexural strength of the concrete-filled steel tube and the steel temporary supporting system. During tunneling, the diameter of the steel tubes used in the pipe-roofing method and their spacing are determined based on the length of each excavation stage (Hamaguchi et al., 2005; Zhang et al., 2013).
Studies on the working mechanism of pipe-roofing support systems have shown that the maximum bending moment of the steel grid is often much larger than that of the pipe-roofing system in the longitudinal direction (Gou et al., 2007). Therefore, to ensure the stability of the pipe-roofing system during excavation, an intensive temporary supporting structure is often required. The tedious and expensive setup of the steel supporting structure is a big disadvantage of the traditional pipe-roofing method.
To overcome the problem associated with supporting system requirements as mentioned above, a new pipe-roofing structure, also known as the steel tube slab (STS) structure, has been proposed (Hong et al., 2011; Jiang et al., 2018; Kim, 2007). The STS design considerably improves the transverse load-carrying capacity of the traditional pipe-roofing system by inclusion of high-strength transverse bolts and flange plates between the tubes. Such a system is attractive as it can avoid the use of temporary support during excavation.
The key design parameter of the STS is its load-carrying capacity. In STS, the connection between the tubes is the weakest part of the structure, and it is subjected to flexural and shear deformations. The mechanical characteristics of the STS structure are different from those of reinforced concrete structures due to the interaction among the steel tube, the flange plate, and the concrete between tubes, which results in a more complicated mechanical mechanism. This makes prediction of the flexural capacity of the STS structure difficult. Despite these difficulties, only a few investigations on the STS structure are available in the literature.
The stress distribution and deformation of STS structures under vertical load was obtained using ANSYS (Xin et al., 2014). The finite element models (FEM) of STS composition beams are established by ABAQUS, and the influences of parameters such as tube thickness, flange thickness, bolt diameter, the spacing between the tubes and welding of the bottom flange on the flexural behavior were investigated (Jia et al., 2016). The ground deformation behaviors in the cross section were acquired during steel jacking and the changing behaviors of ground deformation with the augment of jacking distance, along with the deformation mechanisms were investigated (Li et al., 2016). Jiang et al. (2017) developed a new ultrasonic computerized tomography (CT) method for damage inspections of an STS structure based on compressive sampling (CS), which indicates that the proposed ultrasonic CT improved by CS has great potential for damage detection.
In addition, Tomii and Sakino (1979) studied the CFST columns under monotonic shear and proposed a practical equation for predicting the ultimate shear capacity of CFST short columns through tests. Han et al. (2007b) proposed the simplified models for predicting the torsion bearing capacity. Nie et al. (2018) proposed a simplified design equation for calculating the coupled B-S-T bearing capacity of CFST short columns based on the regression results of the finite element parametric analysis. A theoretical model for evaluating the lateral strain and confining stress in a concrete-filled steel tube system at various stages of loading is established (Kwan et al., 2016).
In sum, based on the existing literature, some scholars have studied very little, and this is mainly about the effect of key parameters on the flexure of the STS structure and the ground settlement during steel jacking. However, there is a lack of reliable experimental investigations, particularly with the failure process, crack development, and flexural bearing capacity in STS structures, in addition to some key parameter optimizations. Consequently, an experimental program is performed to investigate the flexural capacity of the STS structure, by loading simply supported STS beams, using a two-point loading pattern, to failure. The experiments include testing on nine STS specimens to (1) investigate the flexural behavior of the STS beams under two-point loads in terms of load-carrying capacity, ductility, and failure modes; (2) evaluate the effect of various parameters, including flange thickness, tubes spacing, number of connecting bolts, and concrete’s compressive strength on the performance of the STS beams; (3) proposal of a simple model (CECS 159-2004, 2004) for predicting the flexural capacity of STS composite beams under different transverse connection patterns; and (4) investigate the effect of the diameter of steel bolts and the reinforcement ratio on the load-carrying capacity of the STS beam. The results shed light on the failure process and crack development in STS beams and their load-deflection.
Experimental investigation
Testing program
A total of nine STS composite beams were constructed as a part of this study. The details of the constructed STS beams and the positions of the strain gauges and the displacement transducers are depicted in Figure 1. The thickness and external diameter of the steel tubes were 6 and 219 mm, respectively. The bolt diameter and flange thickness were 10 and 6 mm, respectively.

Details of the STS specimens. (a) Two-point loading pattern. (b) Transverse connection nodes. (c) Cross-sectional B-B. (d) Four-point loading pattern (STS-F8). (e) Arrangement of the strain gauge and displacement transducers.
The test program, summarized in Table 1, was designed to investigate the effect of the main structural components of an STS beam including the compressive strength of the concrete, transverse connection patterns of steel tubes, flange thickness, and the spacing between the tubes on the performance of the beam. As can be seen in Figure 1(a), all specimens were 2719 mm long with an effective span of 2500 mm and a shear span of 750 mm. Specimen STS-F1 was a control specimen reinforced with 5Φ10 mm high-strength bolts in both the tension and compression sides. Transverse connection nodes of the STS structure can be seen in Figure 1(b). Only the bottom flanges were welded in this specimen (Figure 1(c)). Specimen STS-F8 was tested to assess the effect of the loading modes on the flexural behavior of STS specimens. STS-F8 was subjected to a four-point loading with a shear span of 500 mm as shown in Figure 1(d), as opposed to other specimens loaded under a two-point loading pattern. Specimen STS-F7 was used to investigate the influence of the flange thickness on the flexural capacity and stiffness of the STS composite beams. All characteristics and geometrical dimensions of specimen STS-F7, except for the flange thickness, were the same as those of the control specimen. For flange thickness, steel plates of 8 mm were arranged at the same height level, whereas those of the control specimen were 6 mm thick. Five linear variable differential transformers (LVDTs), placed on the mid-span, loading points, and the two supports, were used to record the deflection of the STS specimen in a loading event. The actual displacement at the loading points and mid-span location of specimen were considered as the difference between the loading point displacements and the settlement at supports. To record the strain on the longitudinal reinforcing bolts and the flange steel plate, an electric resistance strain gauge was placed on the surface of each steel bar and flange plate at the mid-span, as shown in Figure1(e).
The tested STS specimens and their features.
Tf: flange plate thickness; L0: distance between the centers of adjacent steel tubes; Db: the spacing of bolts; fc: the concrete compressive strength.
For the connection modes, BFW denotes that the bottom flange was welded, TFW denotes that the top flange was welded, and B means connected by bolts.
To investigate the effect of the tube connection patterns on the flexural capacity of STS beams, specimens STS-F2, STS-F3, STS-F4, and STS-F5 were prepared for comparison with the control specimen. For specimen STS-F2, the steel tubes were connected by welding at the top and bottom flanges, without reinforced bolts. Specimen STS-F3 consisted of tubes connected by high-strength bolts, whereas those of specimen STS-F4 were connected by high-strength bolts and flange plates. Unlike other specimens, the connecting bolts used in the specimen STS-F5 were arranged over the full length of the specimen to prevent the bond failure of the connecting bolts. In addition, the objective of specimen STS-F6 was to evaluate the influence of the spacing between the tubes on the flexural behavior of the STS composite beams. Specimen STS-F9 was fabricated from concrete with a cubic compressive strength of 20 MPa, whereas the others had a concrete with a compressive strength of 30 MPa. All STS specimens were casted and cured under the same conditions.
Descriptions of procedure in manufacture of the STS specimens: (1) the seamless steel tubes are cut according to the experimental design scheme. (2) The steel tubes are drilled in the design location. (3) The steel bolts are placed in between the adjacent steel tubes. (4) The adjacent steel tubes are connected through flanges by welding. (5) Concrete is poured into the inside and outside steel tubes. (6) The manufacture of the STS specimens is completed (Figure 2).
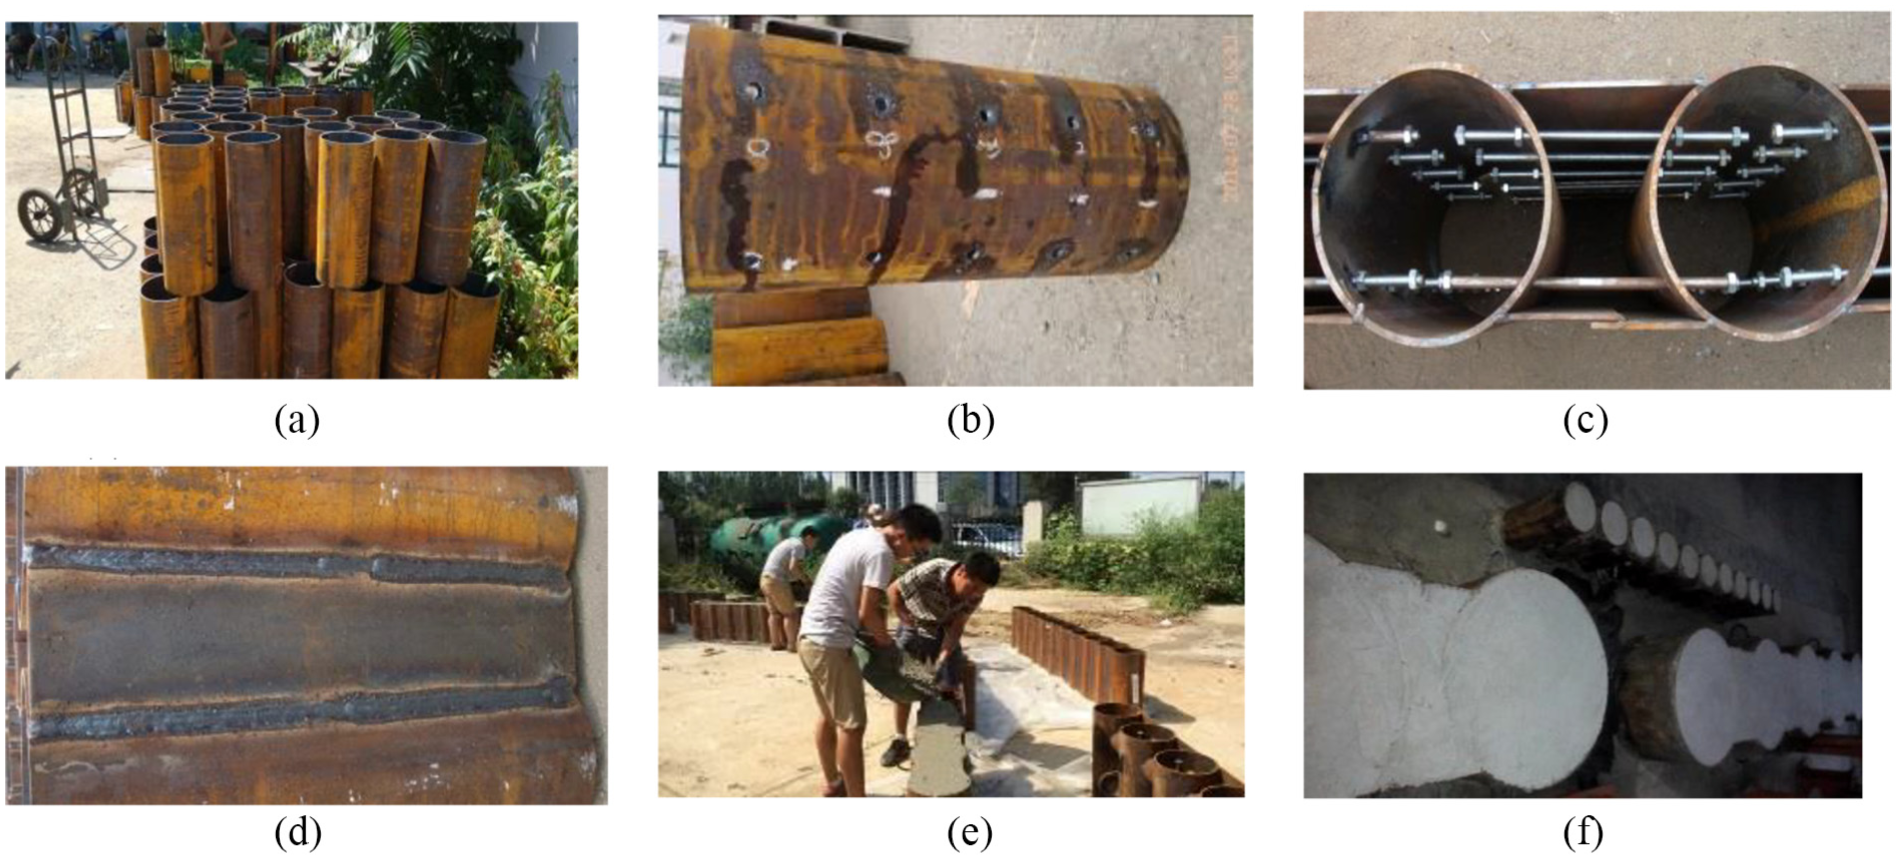
Processing of the STS specimens. (a) Cutting the steel tubes. (b) Drilling holes. (c) Assembling the steel bolts. (d) Welding the flanges. (e) Pouring concrete. (f) STS specimens are completed.
Material properties
Ready-mix concrete was used to fabricate the STS specimens. The average concrete cubic compressive strength (fcu) was obtained by testing six 150 mm concrete cubes for each batch of the ready-mix concrete based on GB/T 50081. The average concrete’s compressive strength was 20 MPa for specimen STS-F9, and the corresponding value for the other specimens was 30 MPa. The mechanical properties of the steel tubes, steel plates, and bolts are summarized in Table 2.
Mechanical properties of the STS beams.
Types of steel is Q235.
Test procedure
Except for specimen STS-F8, all the STS specimens were tested under a two-point bending. The static load is applied by a universal testing machine (UTM) to the specimens through a steel spreader beam, as shown in Figure 1(a) and (d). The load is used in two stages, the load is applied step by step at a rate of 0.2 kN/s for STS specimens until the bottom flanges reach the yield strength, whereas the loading rate for STS specimens is 0.1 kN/s per step for the rest loading. A load cell with a capacity of 4000 kN was connected to the loading device to reduce measurement errors. Vertical deflections at the mid-span, both ends, and loading points are measured by 100-mm capacity LVDTs. The strain distributions of the tubes, bottom flanges, and bolts are measured by 5-mm electrical resistance strain (ERS) gages. Concrete in compression and tension at the mid-span are measured by 70 mm ERS gages. The data are recorded using the static strain testing system (DH3816 N).
Test results and discussions
Modes of failure and cracking patterns
Typical failure modes of all tested specimens are depicted and compared in Figure 3. It was observed that all the STS specimens failed in flexure. In the early stage of the load application, all STS specimens were in an elastic state and no cracking was observed. Cracking started to occur along the interface between the steel tubes and the concrete in the mid-span at the level of 10%–17% of the measured peak load. As the applied load was increased, more flexural cracks appeared within both the pure bending and the shear regions of the beam and the existing cracks were propagated toward the loading points with increasing width. The yielding of the bottom flange and connecting bolts began at the level of 80%–90% of the recorded peak load. During the loading, the crack propagation of the STS specimens occurred slowly due to the constraining effect of the steel tube and flange plate. Typical crack patterns at different loading stages are plotted in Figure 4. As seen in this figure, the cracks mainly occurred in the pure bending regions of the specimen, propagating approximately diagonally or vertically from the bottom flange to the top flange. The flexural failure of all STS specimens was initiated by yielding of the bottom flange followed by the sudden rupture of the bottom flange and bolts, with crushing of the concrete. However, for specimen STS-F3, which had tubes connected only by lateral bolts, the failure happened due to sudden rupture of the connecting bolts without crushing of the compressive zone concrete. In the process of loading, no obvious signs of bond failure between the reinforcing bolts and concrete were found in any of the specimens. As can be seen from this figure, the cracks were developed mainly along the interface between the tubes and concrete in the region between the tubes. Several cracks were also formed along the interface between the tubes and the core concrete inside the tubes because of the tensile effect of the flange plate on the tubes. The propagation of the crack patterns was similar in all the tested STS specimens. However, the crack distribution at the two surfaces of the STS specimens were different for all the tested specimens. This is, however, mainly because of the ground effects on the bottom concrete during curing, as all the STS specimens were placed vertically on the ground during concrete curing (Table 3).
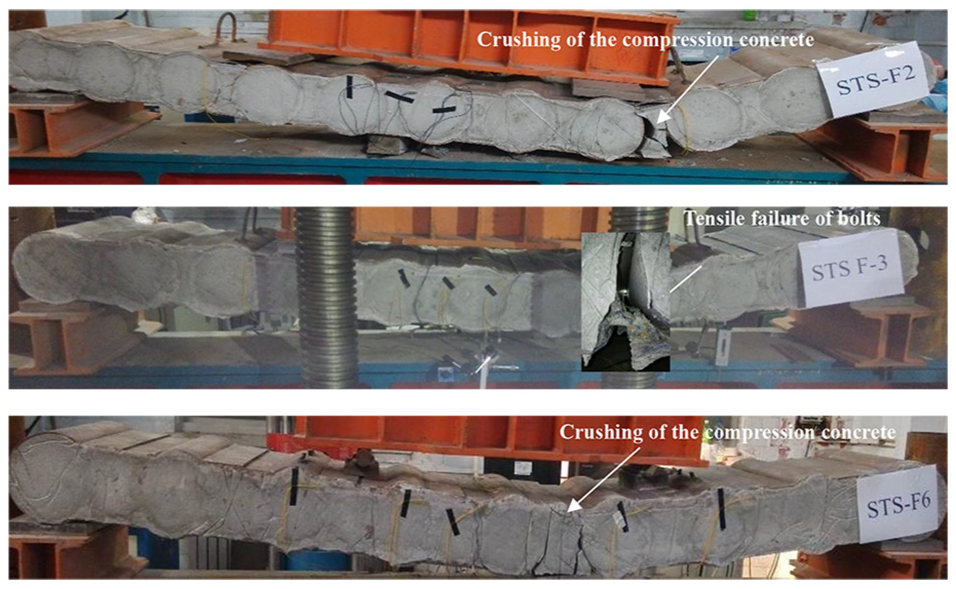
Typical failure modes of the tested specimens.
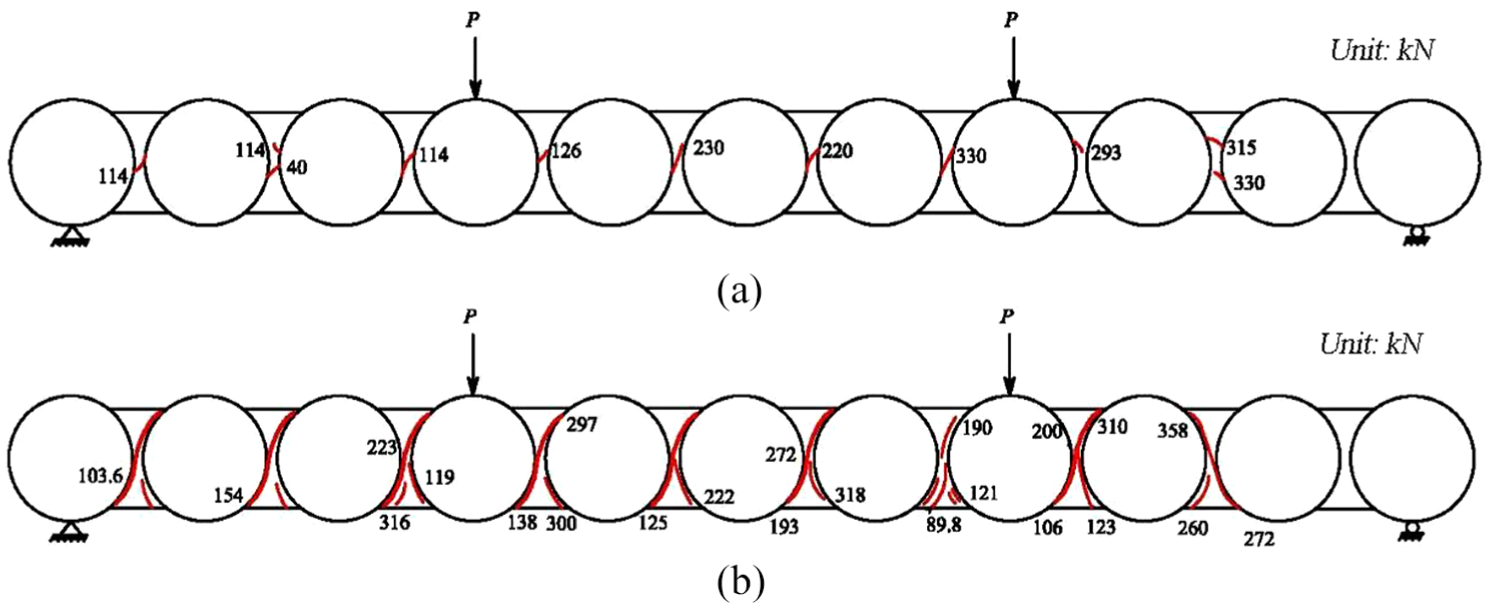
Typical crack development of the STS specimen (numbers denote the applied total loads at which cracks formed). (a) Top surface of the specimen STS-F1. (b) Bottom surface of the specimen STS-F1.
Summary of the test results.
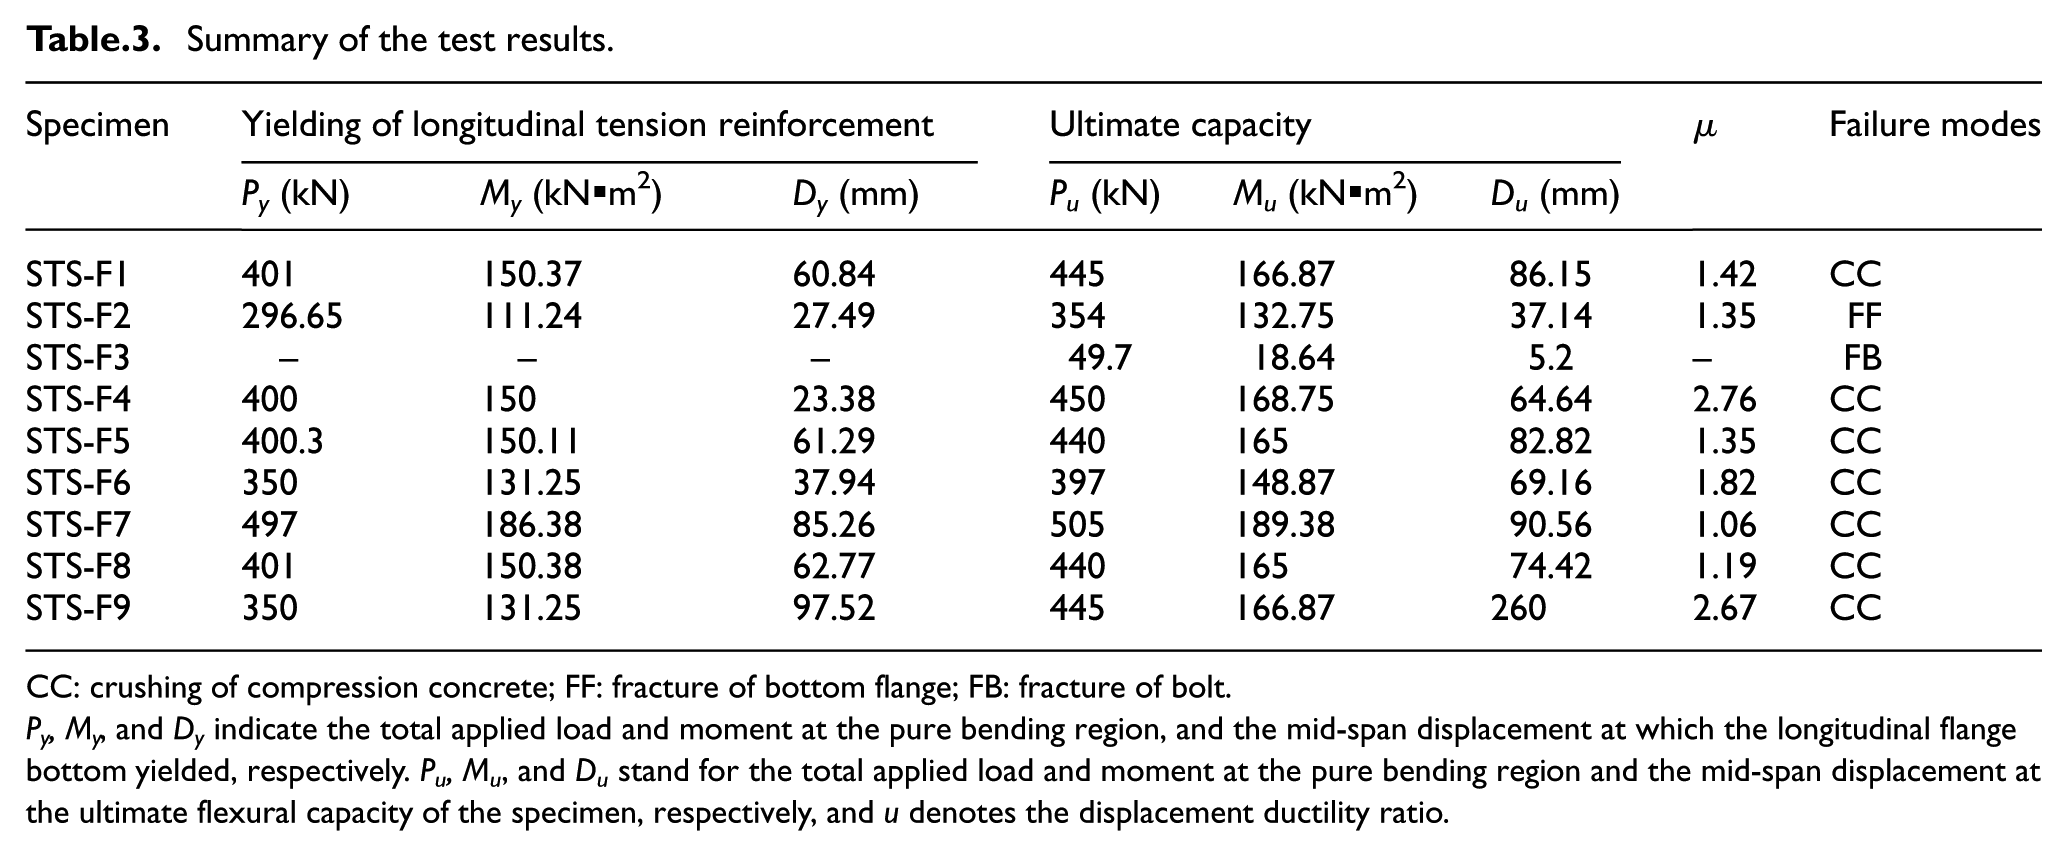
CC: crushing of compression concrete; FF: fracture of bottom flange; FB: fracture of bolt.
Py, My, and Dy indicate the total applied load and moment at the pure bending region, and the mid-span displacement at which the longitudinal flange bottom yielded, respectively. Pu, Mu, and Du stand for the total applied load and moment at the pure bending region and the mid-span displacement at the ultimate flexural capacity of the specimen, respectively, and u denotes the displacement ductility ratio.
Load versus strain
Taking specimens STS-F1 and STS-F5, the applied load versus strain curves obtained from the tests are shown in Figure 5. As can be seen from the figure, the load versus strain curves of the flange plates display a linear relationship in the early stage of the load application. When the loads are increased to 78.6%–98.4% of the ultimate bearing capacity, the bottom flanges of the specimens reach the yield strength, which is manifested as the sudden strain increase in the curves. For the high-strength bolts, the strain value increases almost linearly up to the failure of the beam. The strains in the concrete and high-strength bolts follow a similar linear trend as the flange in the early stage of the load application, before showing a sudden increase at failure, and when the loads reach the ultimate bearing capacity, the compressive strain of the concrete reach the ultimate compressive strain. This is because diagonal cracks with bending-shear appear in the early stage. During the subsequent loading, the cracks are developed and the failure pattern changes from shear failure to flexural failure.
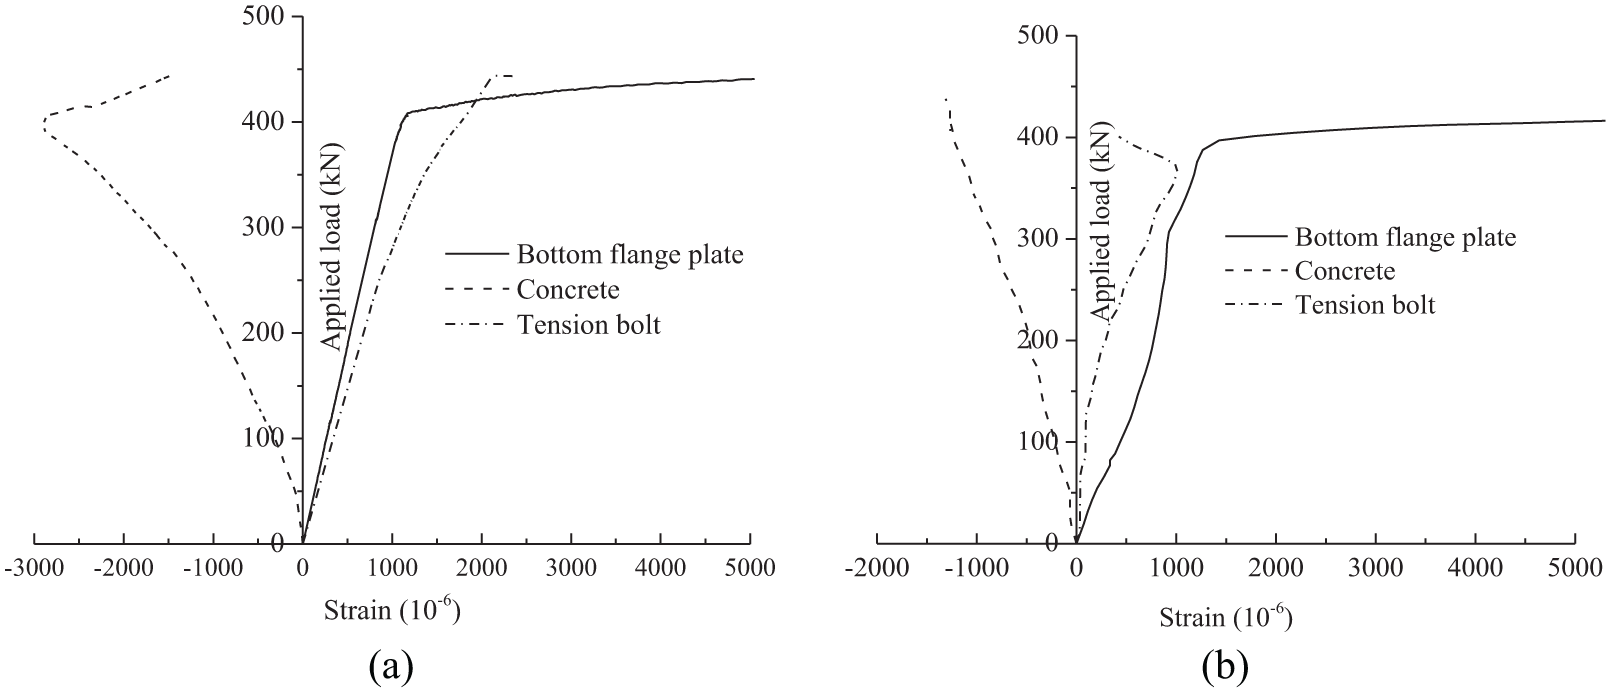
Applied load versus strain curves. (a) STS-F1. (b) STS-F5.
Parametric study
The applied load versus the mid-span deflection curves obtained from the tests are shown in Figure 6. As can be seen from these figures, the load–deflection curve of the STS specimens can be divided into three stages: an elastic stage, an elastic-plastic stage, and a strength stage. In the early stage of loading, specimens were in a low stress level condition, and the stresses in the concrete, steel tubes, and flange plates were small, and therefore the specimens displayed an elastic behavior. With further loading, cracks started to develop at the middle span of the specimens, resulting in the reduction of flexural stiffness. This is the main reason that specimens exhibited an elastic-plastic behavior in this stage. The applied load was then increased to the yielding load, after which a hardening behavior was observed.
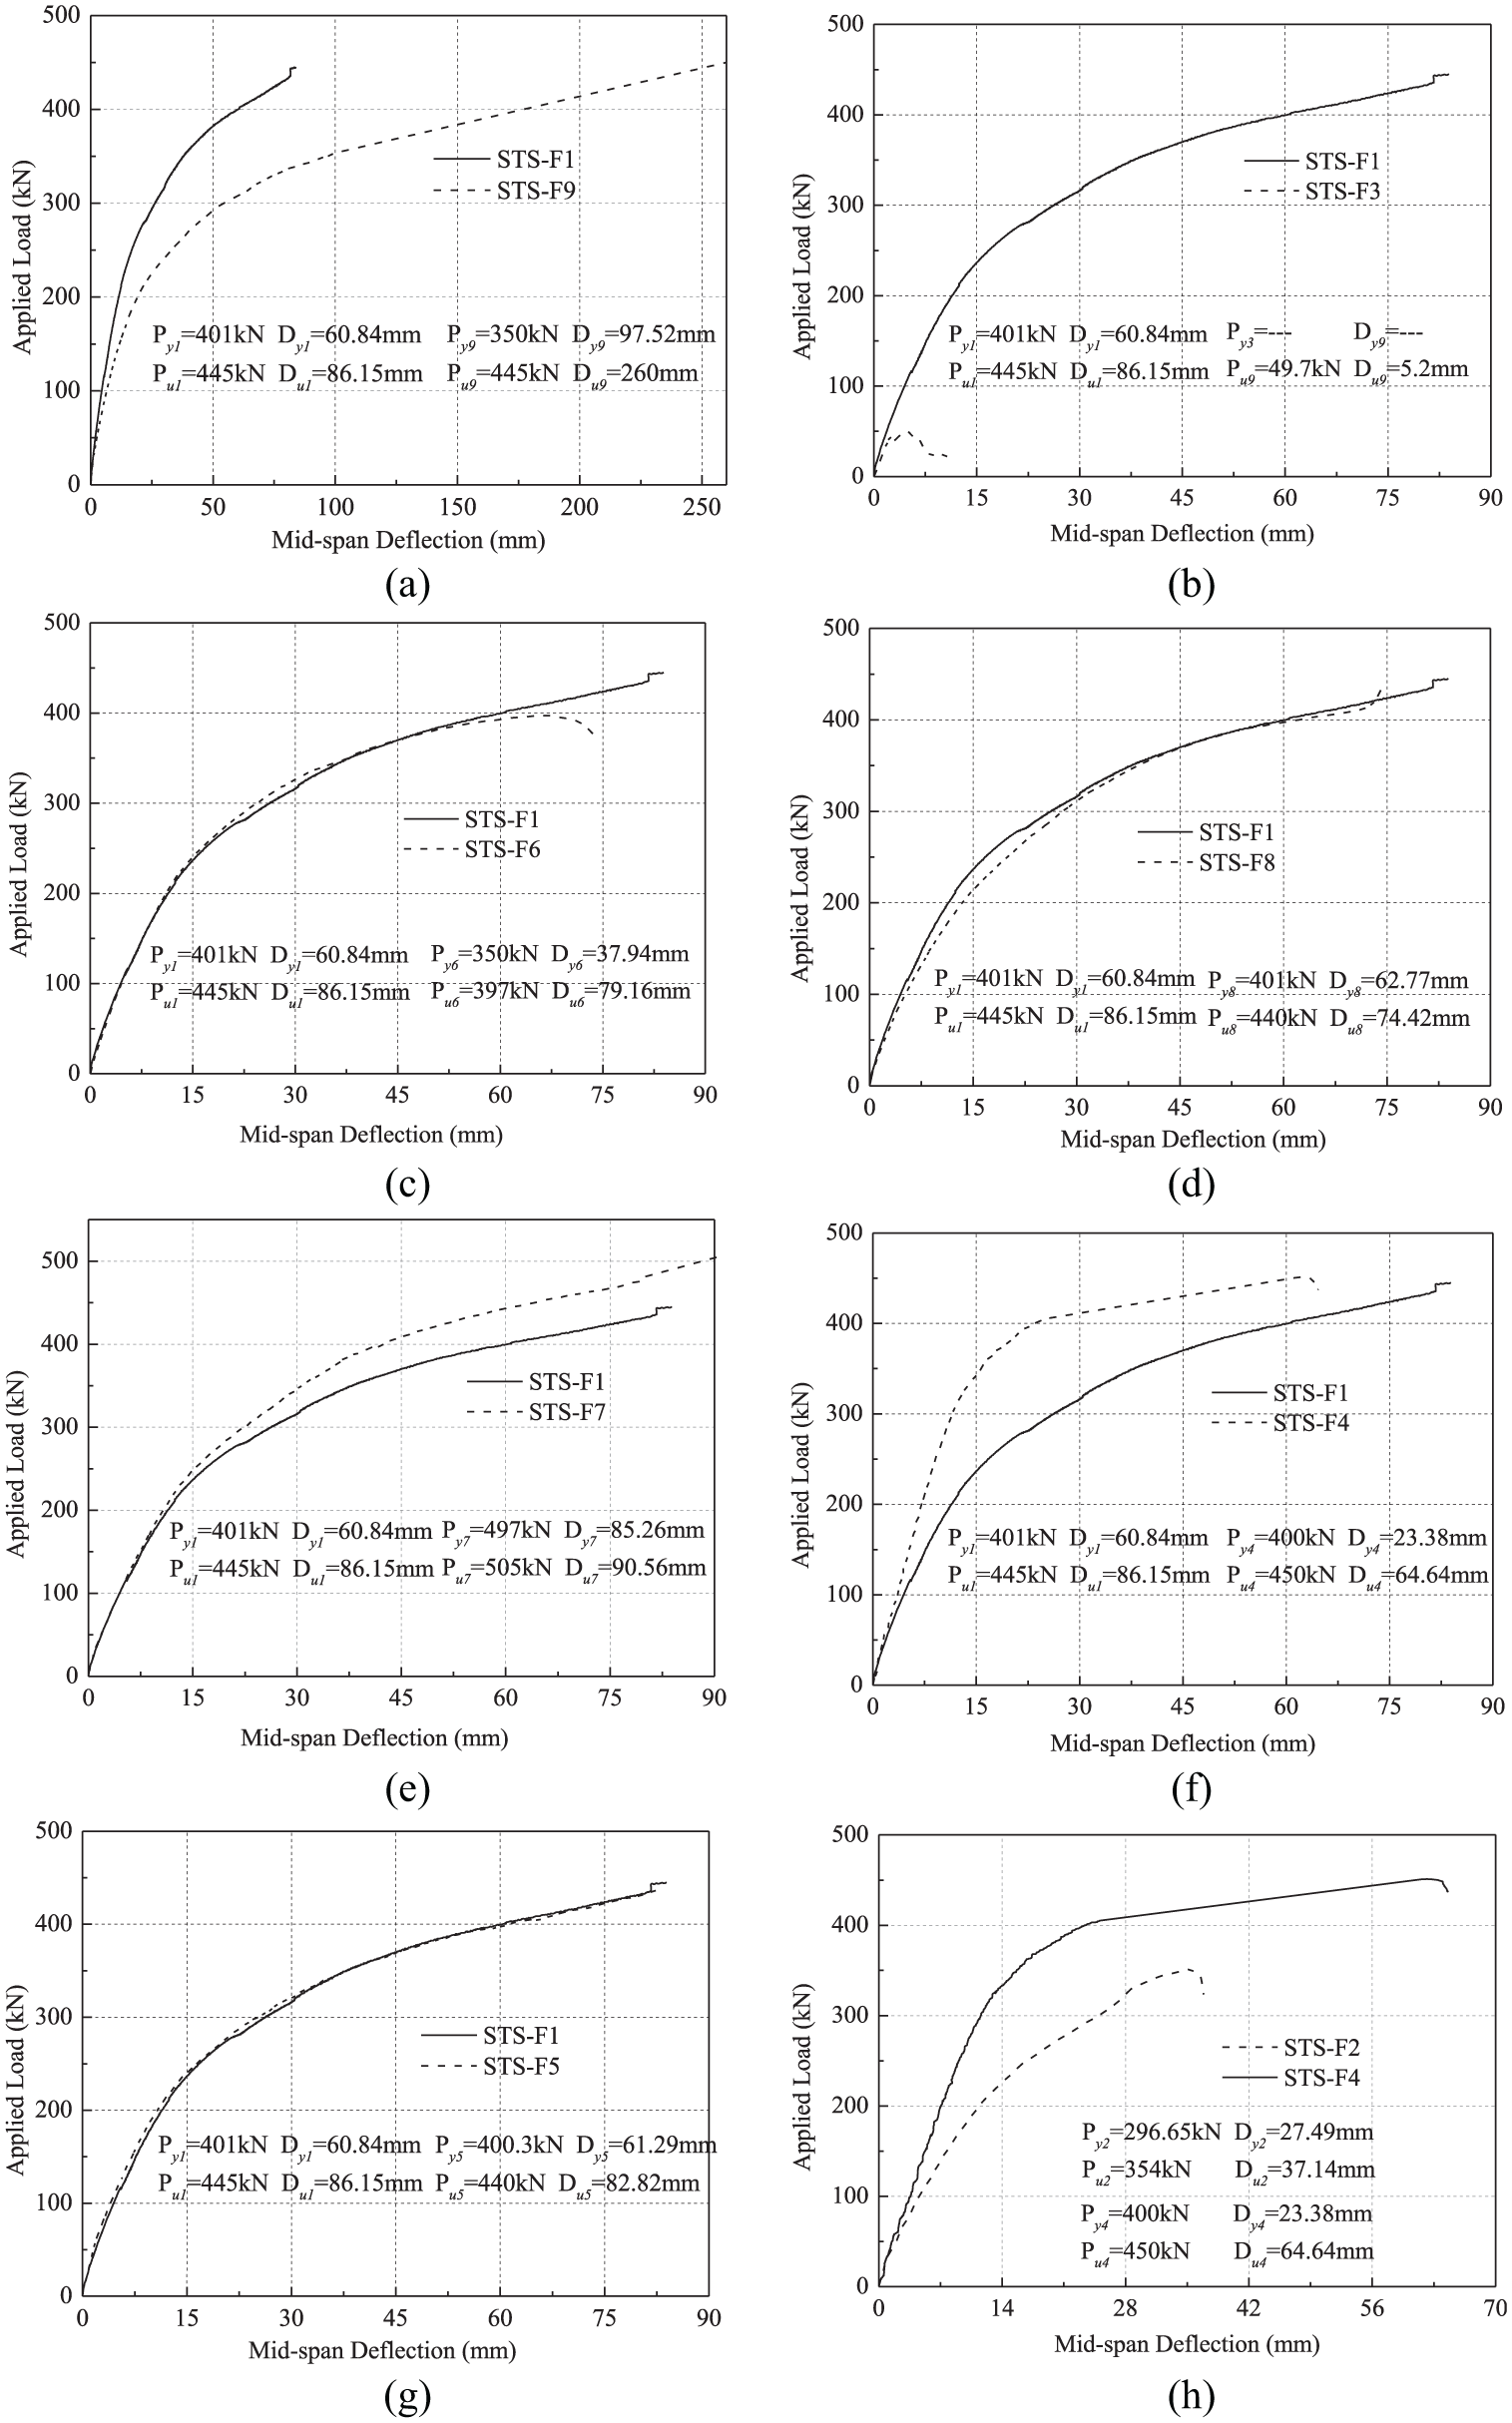
Effect of the key parameters on the load-deflection behavior of STS beams. (a) Compressive strength of the concrete. (b) Welding the bottom flanges. (c) Spacing between the tubes. (d) Loading mode. (e) Flange thickness. (f) Welding the top flange. (g) An extended length of connecting bolts. (h) Transverse connecting bolts.
Effect of the compressive strength of the concrete
The effect of the concrete’s compressive strength on the flexural capacity of the STS beams was studied by comparing the load versus mid-span deflection curves of specimens STS-F1 and STS-F9. The measured peak load at specimens STS-F1 and STS-F9 were 445 and 440 kN, respectively, indicating that use of a concrete with lower compressive strength had a limited effect on the load-carrying capacity of STS beams in this case. However, as seen from Figure 6(a), the effect of using a lower strength concrete on the load–deflection curve is pronounced. Mid-span deflection corresponding to the peak load of specimens STS-F1 and STS-F9 were 82.44 and 260 mm, respectively, showing that the stiffness of STS composite beams can be significantly improved by using a higher strength concrete.
Effect of welding the bottom flanges
The effect of welding the bottom flange steel plates on the load carrying capacity was investigated by comparing the test results of specimens STS-F1 and STS-F3. The applied load versus mid-span deflection is plotted for these specimens in Figure 6(b). From this figure, it is observed that the load–deflection curve is almost linear up to the peak load for specimen STS-F3, when brittle failure suddenly occurs. For specimen STS-F1, the behavior starts linearly and then gradually deviates from the initial linear trend as the specimen deflections increase. Despite the welding of the bottom flange steel plates in specimen STS-F1, the two specimens initially demonstrated similar load-deflection characteristics, up to the inception of flexural cracking in specimen STS-F3. This is due to the behavior of the un-cracked beam being mainly dependent on the moment of inertia of the gross concrete cross section. With the presence of cracks, the flexural stiffness of beams was mainly determined by the quantity of the reinforcement bars. As seen from Figure 7(b), the recorded peak loads of specimens STS-F1 and STS-F3 were 445 and 49.7 kN, respectively, indicating that the welding of the bottom flange has a significant enhancing effect on the load-carrying capacity of STS specimens.
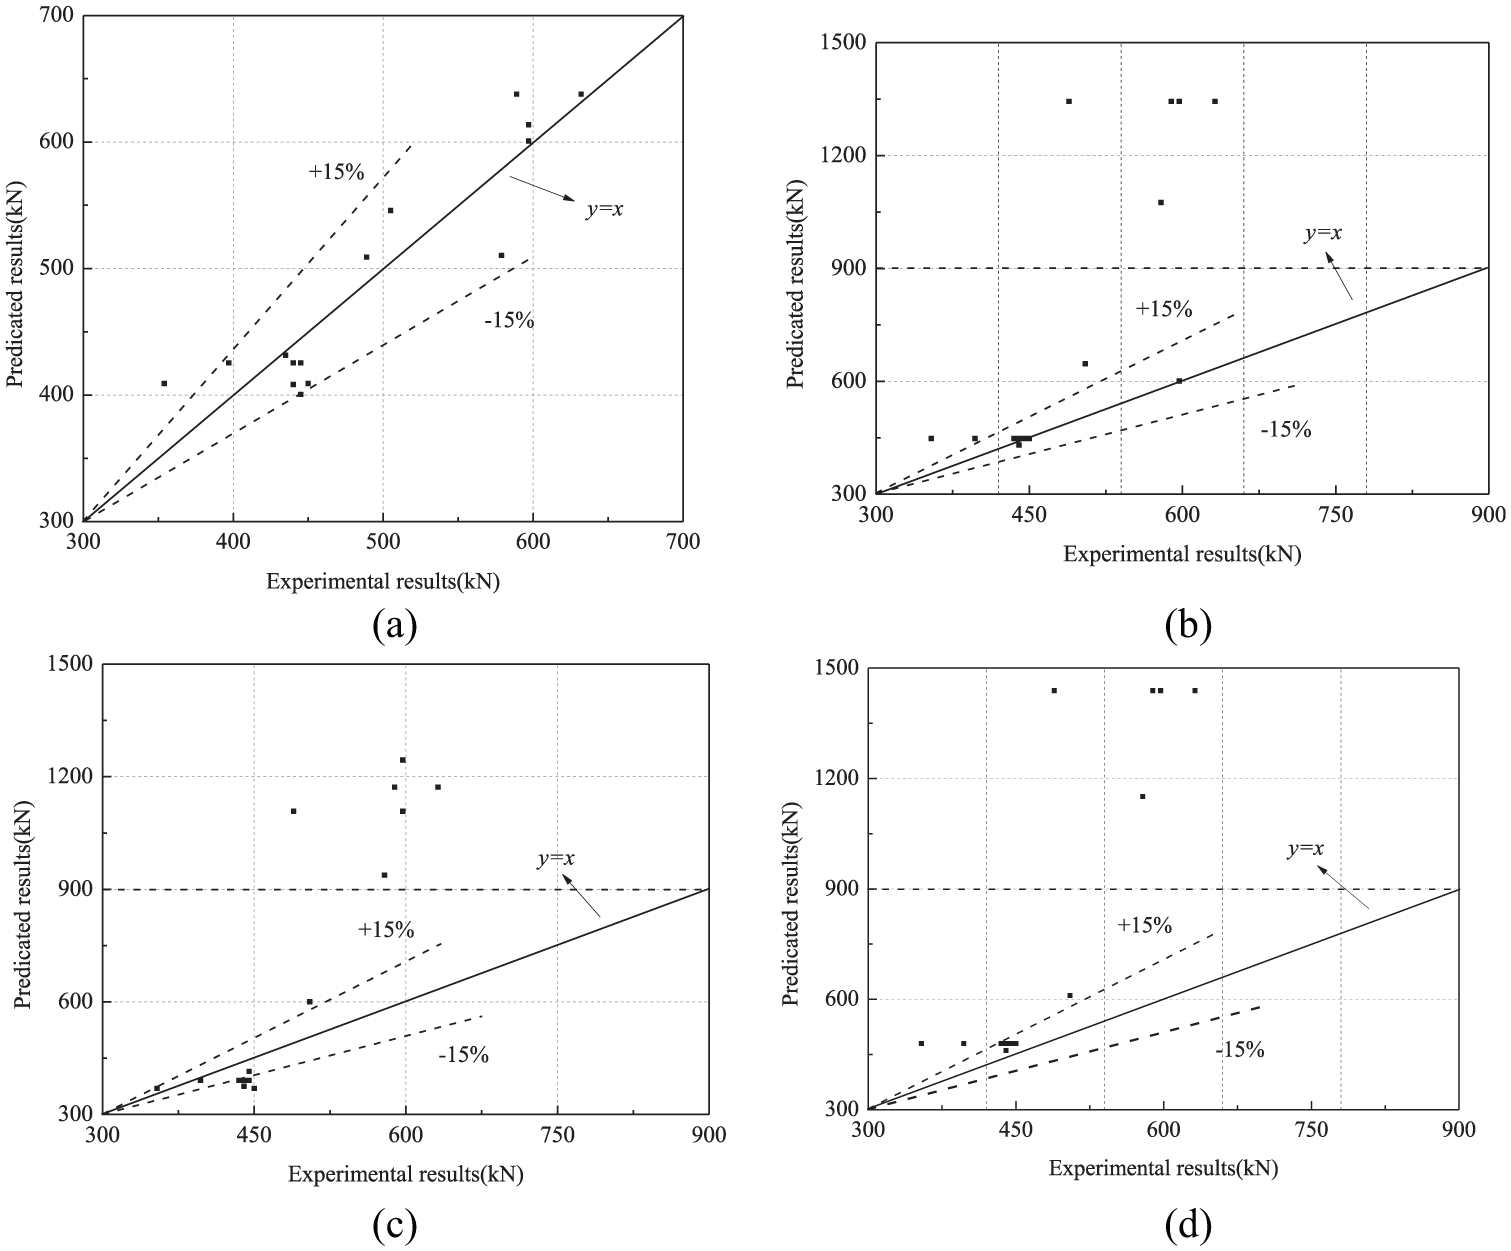
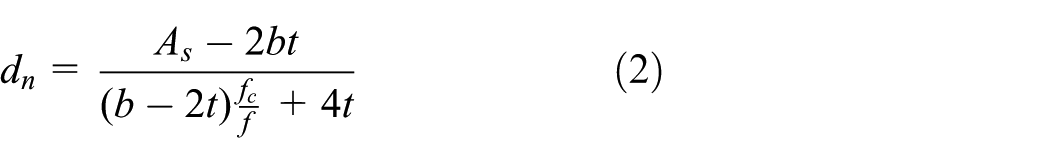
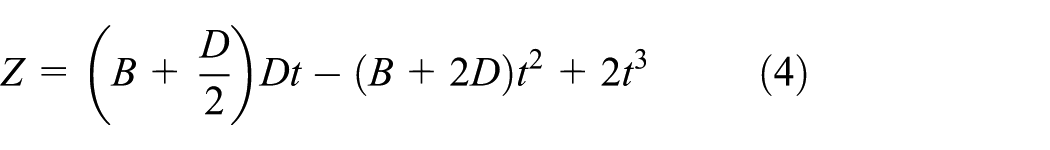
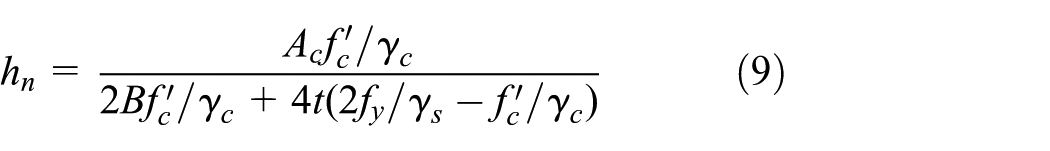
Comparison between experimental results and predicted results of the flexural capacity. (a) CECS159. (b) AISC-LRFD. (c) BS 5400. (d) EC4.
Effect of the spacing between the tubes
The effect of the spacing between adjacent steel tubes on the load–deflection behavior was studied by comparing the test results of specimens STS-F1 and STS-F6. The net spacing of the adjacent tube outer edge was 30 mm for specimen STS-F1, compared with 90 mm for specimen STS-F6. Figure 6(c) indicates that specimen STS-F6 exhibited similar load–deflection behavior to that of specimen STS-F1 at the early stage of loading. The recorded flexural capacity of specimen STS-F6 was approximately 10.7% lower than that of specimen STS-F1. This indicates that while reduction in the spacing of steel tubes can improve the load-carrying capacity, it has a limited effect on the flexural stiffness of the STS beams. The improvement in load-carrying capacity is probably because the smaller spacing of steel tubes restricts the dilation of the concrete between the steel tubes, resulting in a higher yield load.
Effect of loading mode
In real applications, an STS structure is often subjected to uniform loading applied by the overburden earth pressure and ground surcharge. To investigate the effects of loading modes on load-carrying capacity and flexural stiffness of STS beams, specimen STS-F8 was tested subjected to a four-point loading pattern to simulate more uniform loading compared with the control specimen. As depicted in Figure 6(d), the two specimens exhibited similar load–displacement behaviors up to a failure loads. The measured peak load of specimen STS-F8 was only 1.1% smaller than that of specimen STS-F1. It is concluded that the two-point loading mode adopted in the majority of the tests can represent the behavior of the STS under uniform loading with adequate accuracy.
Effect of the flange thickness
The impact of the flange thickness on the load–deflection curve was investigated by comparing the test results of specimens STS-F1 and STS-F7. As can be seen from Figure 6(e), after occurrence of cracks, the flexural stiffness of specimen STS-F7 was higher than that of specimen STS-F1, showing that the flange thickness has a significant effect on enhancement of the flexural stiffness of STS specimens. The flexural capacity of the specimen STS-F7 was 189.3 kN·m, which is approximately 13.5% greater than that of specimen STS-F1.
Effect of welding the top flange
The effect of welding the top flange steel plates on the load–deflection behavior of STS specimens was studied by comparing the test results of specimens STS-F1 and STS-F4. From Figure 6(f), it is observed that the initial stiffness of the specimen STS-F4 was enhanced, compared with the stiffness of STS-F1, by welding the top flange. For the specimen STS-F4, local buckling of the top flange was observed when the applied load reached approximately 400 kN. After the local buckling of the top flange, specimen STS-F4 endured an apparent degradation of flexural stiffness, compared with specimen STS-F1, which showed a smaller decrease in the flexural stiffness. On the other hand, the flexural capacity of specimen STS-F4 was only around 1% greater than that of specimen STS-F1. It is, therefore, concluded the welding of the top flanges has a limited effect on the flexural capacity of STS beams, but it is effective in improving the flexural stiffness of STS specimens.
Effect of an extended length of connecting bolts
To investigate the effect of bolt patterns on the flexural behavior of STS beams, the test results for specimens STS-F5 and STS-F1 are compared. As illustrated in Figure 6(g), the two specimens exhibited similar load–displacement behaviors up to failure loads. The measured peak load of specimen STS-F5 was only 1.1% smaller than that of specimen STS-F1, showing that the connection of bolts has a negligible influence on the flexural capacity and stiffness of the STS composite beams.
Effect of transverse connecting bolts
The impact of transverse connecting bolts on the load–deflection curve was investigated by comparing the test results for specimens STS-F4 and STS-F2. Figure 6(h) shows that specimen STS-F4 exhibited greater flexural stiffness than specimen STS-F2. The obvious improvement in flexural stiffness is mainly because specimen STS-F4 had a greater cross-sectional area in reinforcement ratio than specimen STS-F2. However, the ultimate load capacity of STS-F2 was approximately 21% smaller than that of specimen STS-F4, showing that the transverse connecting bolts have a significant effect on the load-carrying capacity and stiffness of the STS structure.
Verification of the simplified models
Five simple models for predicting the flexural capacity of STS composite beams under different transverse connection patterns are tested here against the experimental results. They are as follows.
First, the Chinese code for “Technical Specification for Structures with Concrete-filled-rectangular Steel Tube Member” (CECS 159-2004, 2004), a simple equation is provided for estimation of the ultimate flexural capacity of an STS composite beam

where
Second, the American code for “Load and Resistance Factor Design Specification for Structural Steel Building” (AISC-LRFD, 1999), a simple equation is provided for estimation of the ultimate flexural capacity of an STS composite beam

where
Third, the British code for “Steel, concrete and composite bridges—Part 4: Code of practice for design of concrete bridges” (BS 5400-4, 1990), a simple equation is provided for estimation of the ultimate flexural capacity of an STS composite beam

where
Finally, in the Europe code for “Composite Slabs with Profiled Steel Sheeting” (EC-4, 2004), a simple equation is provided for estimation of the ultimate flexural capacity of an STS composite beam


where
The above-mentioned equations have been used to predict the ultimate flexural capacity of the STS beams tested (Zhao et al., 2016) in this study, as shown in Figure 7. It can be observed that all of the four simple equations can predicate the flexural bearing capacity of the specimens, however, the equation on CECS 159-2004 is more suitable for the STS composite beam. The deviation between the experimental values and the predicated values is within 15% except for specimen F2. Therefore, the simple model (CECS 159-2004, 2004) for predicting the flexural capacity of STS composite beams under different transverse connection patterns is provided.
Optimization of key parameters
Due to the limitations and cost of the laboratory experiments, it is difficult to investigate the influence of all the key parameters such as flange thickness and tube thickness on the ultimate bearing capacity of STS specimens. This article will, therefore, employ a FEM to study the influence of some of the key parameters on the ultimate bearing capacity of the STS beams, and to determine the optimum flange thickness to tube thickness ratio.
Numerical modeling
The three-dimensional finite element method was adopted in this section to simulate the control experiment (STS-F1 and STS-F7). For the simulations, the ABAQUS software (version 6.12) was used to establish the FEM. Four-node shell elements with reduced integration points were used to represent the tube and flange. Eight-node solid elements were used to model the concrete. Truss elements were used to simulate the bolts. The surface-to-surface contact was used to simulate interaction between the tube, flange, and concrete through both shear stress and normal stress. The interface interactions were simulated by hard contact in the normal direction, and by the penalty function method with a friction factor of 0.3 in the tangential direction (Jia et al., 2016).
As for the constitutive model of the materials, the elastic-perfectly plastic model is used to analyze the stress–strain relationship of bolts, steel tubes, and the concrete between the steel tubes (GB50010-2010, 2010). As the inner concrete of steel tubes is constrained by the steel tubes, the strength of the concrete is improved compared to the common concrete; the constitutive model presented by Linhai Han is used to simulate the stress–strain relationship (Han LH, 2007).
The comparison between the numerical and test results is shown in Figure 8. As can be seen from this figure, the numerical results are in excellent agreement with the experimental results.

Comparison between numerical results and experimental results. (a) STS-F1 (Zhao et al., 2016). (b) STS-F7.
Analysis of the additional parameters
Effect of the diameter of steel bolts
The five models are established to study the influences of the diameter of steel bolts on the mechanical behavior of STS specimens, and the diameter of steel bolts are selected at 8, 9, 10, 11, and 12 mm.
The effect of the diameter of steel bolts on the load-carrying capacity was investigated by comparing the results of numerical models STS-DB1, STS-DB2, STS-DB3, STS-DB4, and STS-DB5. The applied load versus mid-span deflection is plotted for these specimens in Figure 9(a). From the figure, the applied loads of the above-mentioned models are 398.9, 406.4, 414.4, 423.7, and 433.7 kN, respectively. The results indicate that the applied load increases linearly, and it has a limited effect on the flexural bearing capacity of the STS beams, as shown in Figure 9(b). Meanwhile, the fitting equation is obtained.

The relationship between the applied load and the diameter of steel bolts. (a) The change in the parameter. (b) The parameter fitting.
Effect of the reinforcement ratio
The five models are established to study the influences of the diameter of steel bolts on the mechanical behavior of STS specimens, and the reinforcement ratios are selected at 0.54, 0.72, 0.90, 1.08, and 1.26. The reinforcement ratio is the ratio of the area of reinforcement to that of the whole section, as shown in Figure 1(c)

where ρ is the reinforcement ratio, ASis the ratio of the area of reinforcement, and A is area of the whole section.
The impact of the reinforcement ratio on the ultimate bearing capacity was studied by comparing the numerical results for specimens STS-RR1, STS-RR2, STS-RR3, STS-RR4, and STS-RR5. The applied load versus mid-span deflection is plotted for these specimens in Figure 10(a). From the figure, the applied load of the above mentioned models are 397.1, 405.9, 414.4, 422.2, and 430.3 kN, respectively. The results indicate that the applied load increases linearly, and it has a limited effect on the flexural bearing capacity of the STS beams, as shown in Figure 10(b). Moreover, the fitting equation is obtained.
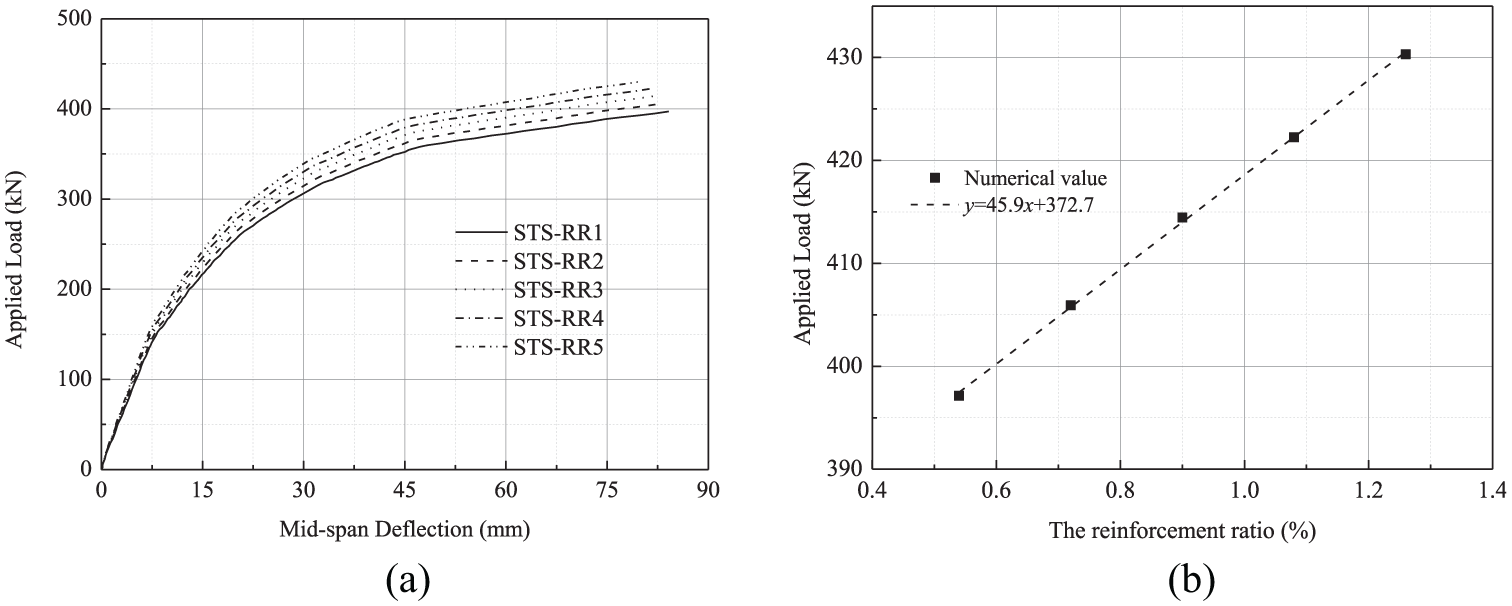
The effect of flange thickness and tube thickness on the ultimate load capacity. (a) The change in the parameter. (b) The parameter fitting.
Conclusion
This article presents an experimental study of the flexural behavior of STS beams. Nine simply supported specimens of STS beams with different characteristics in terms of flange thickness, tube thickness, and reinforcement arrangements were tested to failure under two-point and four-point loading patterns. The following conclusions can be drawn from the experimental test results:
Diagonal cracks were formed in the middle beam span at approximately 10%–17% of the measured peak load of the specimens. With further loading, more flexural cracks appeared in both the pure bending and shear regions and the existing cracks extended toward the loading point. The yielding of the bottom flange and connecting bolts began at roughly 80%–90% that of the peak load. The flexural failure was initiated by the yielding of the bottom flange followed by the sudden rupture of the bottom flange and connecting bolts, with crushing of concrete.
The flexural capacity of the STS beams was decreased significantly if the bottom flange was not welded. Therefore, it is very important to guarantee the welding quality of the flange plates in construction sites, or the actual capacity of the STS structure will be far below the design value.
The experimental results indicated that concrete’s compressive strength may have a limited effect on the flexural capacity of STS composite beams. However, concrete with lower compressive strength gives rise to a degeneration of flexural stiffness and an increase in the ductility of STS beams.
Increase in flange plate thickness leads to increase in the load-carrying capacity and the flexural stiffness of STS beams. Within the range of the variations adopted in this study, extension of the connecting bolts, welding of the top flanges, and change in the spacing of the steel tubes have shown insignificant effects on the load-carrying capacity and the flexural stiffness of STS beams.
A simple model (CECS 159-2004, 2004) for predicting the flexural capacity of STS composite beams under different transverse connection patterns is provided. With the diameter of the steel bolts and the reinforcement ratio increasing, the applied load increases linearly, but they have a limited effect on the flexural bearing capacity of the STS beams.
Footnotes
Declaration of Conflicting Interests
The author(s) declared no potential conflicts of interest with respect to the research, authorship, and/or publication of this article.
Funding
The author(s) disclosed receipt of the following financial support for the research, authorship, and/or publication of this article: The research work described in this paper was supported by the Fundamental Research Funds for the Central Universities (Grant No. N160106006) and the National Natural Science Foundation of China (Grant No. 51578116, 51878127). The fifth author was supported by the Tianjin Science and Technology Project (Grant No. 17ZXGDGX0050) and the National Natural Science Foundation of China (Grant No. 51808351).