
Abstract
Existing research on the widely used concrete-filled steel tubes is mainly focused on static or cyclic loading, and the studies on effects of high strain rate are relatively rare. In this article, seven stub concrete-filled steel tubular columns with square section were tested under both static and impact loads, using a large-capacity drop-weight testing machine. The research parameters were variable height of the drop-weight and different load types. The experimental results show that the failure modes of the concrete-filled steel tube columns from the impact tests are similar with those under static load, characterized by the local buckling of the steel tube. The time history curves of impact force and steel strain were investigated. The results indicate that with increasing impact energy, the concrete-filled steel tube stub columns had a stronger impact-resistant behavior. The dynamic analysis software LS-DYNA was employed to simulate the impact behaviors of the concrete-filled steel tube specimens, and the finite element results were reasonable compared with the test results. The parameter analysis on the impact behavior of concrete-filled steel tube columns was performed using the finite element model as well. A simple method was proposed to calculate the impact strength of square concrete-filled steel tube columns and compared favorably with experimental results.
Introduction
Research on concrete-filled steel tubular columns shows excellent load-carrying capacity and deformability along with good construction merits (Guo et al., 2007; Han et al., 2012; Varma et al., 2002). In this system, the prefabricated steel tubes can serve as formwork for concrete and provide axial load-carrying capabilities for upper-level construction. Many researchers investigated the behavior of concrete-filled steel square tubes under axial static load during past decades and demonstrated their excellent structural performance (Han et al., 2005; Li et al., 2018; Lu et al., 2015; Mao and Xiao, 2006; Teng et al., 2007, 2018). Several models and design codes have also been developed to predict the compressive behavior of concrete-filled steel tube (CFT) columns (Anderson, 2014; Sakino et al., 2004; Tao et al., 2011; Zhang et al., 2005).
When the CFT system is used in high-rise buildings, subway stations, or bridge piers, it may be subjected to high strain rate dynamic loads, such as impact or blast (Briaud and Hunt, 2006; Mohan and Sharma, 2011; Wardhana and Hadipriono, 2003). In an early study, Prichard and Perry (2000) performed CFT impact experiment using a drop hammer apparatus. The CFT columns were shown with a superior performance under impact load. Shan et al. (2007) used high-speed gas gun to investigate the impact responses of CFTs and carbon fiber–reinforced polymer (CFRP)-confined CFTs. Xiao and Shen (2012) used a drop-weight machine to test 25 CFT stub columns and CFRP-confined CFT circular stub columns under different impacting energy levels. Various test results were recorded in this study and indicated that different impact effects can affect the failure patterns of specimens. Besides the gas-gun test and the drop hammer test, Xiao et al. (2009) and Huo et al. (2009) also used split Hopkinson pressure bars (SHPB) to investigate the fundamental dynamic behaviors of CFTs under high stain rate axial load. Deng et al. (2012) tested the flexural behaviors of CFTs, post-tensioned CFTs (PTCFTs), and steel fiber–reinforced CFTs (FRCFTs) by drop hammer facility. The test results indicated that the use of pre-stressing strands and steel fibers significantly restrained the concrete tension cracks in the PTCFT and FRCFT specimens, respectively. Wang et al. (2013) researched the lateral impact behaviors of concrete-filled steel tubular by experiment and finite element analysis (FEA) mode. The finite element (FE) model showed a reasonable agreement with the test results.
Based on research literatures, the CFT systems have a superior dynamic load resistance compared with conventional reinforced concrete elements or hollow steel tubes. However, based on the opening literature search, the study on square or rectilinear CFT stub columns under axial impact load is rare.
In the current study, the impact resistance of square concrete-filled steel tubular stub columns was investigated through drop-weight testing under variable impact energy through adjusting the drop-weight height. Moreover, an FEA model is developed to analyze the response of square CFT columns under axial impact loading. In addition, the axial resistances under impact load are compared with those from static experiments. A formula to determine the increased dynamic strength of square CFT columns is also proposed.
Experimental program
A total of seven CFT specimens were prepared and tested. The test matrix included one CFT column under axial static load and six CFT columns under axial impact load. As shown in Table 1, the parameters under investigation were variable impact energy by means of different drop heights and two load types. All the specimens had identically a length of 800 mm, while the width of square steel tubes was 300 mm. The thickness of the steel tubes was 6 mm, and thus the sectional width-to-thickness ratio was 50. The properties for all the specimens are listed in Table 1. Two 10-mm steel plates were capped on both ends of the stub columns to distribute the applied load uniformly over the concrete and steel.
Test matrix and main results.

SEA: specific energy absorption; CFE: crush force efficiency; DIF: dynamic increase factor.
Designation of specimen names: CFT: concrete-filled tube; D and S denote dynamic and static, respectively; the number after D denotes the height of impact in meters; the last number is the serial number of the specimen.
Material properties
Ready-mix concrete with design strength of 30 MPa was used for filling the steel tubes. To determine the concrete properties, plain concrete cylinders with a diameter of 150 mm and a height of 300 mm were cast and cured in molds, a condition similar to the related specimens. The average compressive strength and the average corresponding elastic modulus were 33.9 MPa and 2.56 × 10⁴ MPa at 28 days, respectively.
Tensile test on steel coupons which were cut from the same original steel tube was also conducted. The average values of elastic modulus, yield strength, and ultimate strength were 2.03 GPa, 433 MPa, and 533 MPa, respectively.
Specimen fabrication
The steel tubes were made by welding two 6-mm-thick folded C-shaped steel sections at a local factory. Two 10-mm-thick steel plates were placed and welded at both end sides with a hole on one side plate for filling concrete. Then, the tubes were concrete-filled with compaction using vibrator to consolidate the concrete during casting. After 28 days curing in room temperature, the concrete-filled tube columns were tested.
Testing facility and method
The test was conducted using the high-capacity drop-weight equipment at the Ministry of Education Key Laboratory of the Hunan University. The maximum drop height of the equipment reaches up to 16 m. The hammer head weighs 442 kg and can be stacked with additional thick steel plates to increase the hammer mass up to 1000 kg. In this study, the impact energy inputs were realized by adjusting the drop heights with a constant hammer mass of 996 kg. The shape of the impactor plays a significant role to the impact force and the impact contact surface. Thus, it was designed to have a smooth flat bottom. The test set-up is shown in Figure 1. A ball support was used to ensure the hammer hit the specimens vertically. In this study, the impact force of the specimens was measured by the load transducer placed at hammer and the specimen support. Before testing, the specimen was placed on a stiff steel pedestal bolted to the foundation by high-strength steel bolts. Four steel bars as stoppers were placed at the bottom of the specimen to avoid rebounding from the pedestal after the impact. A high-speed video camera, which was set to capture 500 frames per second, was connected with a computer in front of the test machine. A laser trigger device was used to switch on all the instrumentation recordings when the released hammer started to pass the location approximately 0.1 m above the top of the specimens. This trigger can also record the passing time allowing the detection of the impact velocity. The data acquisition system recorded data at a sampling rate of 100 kHz.
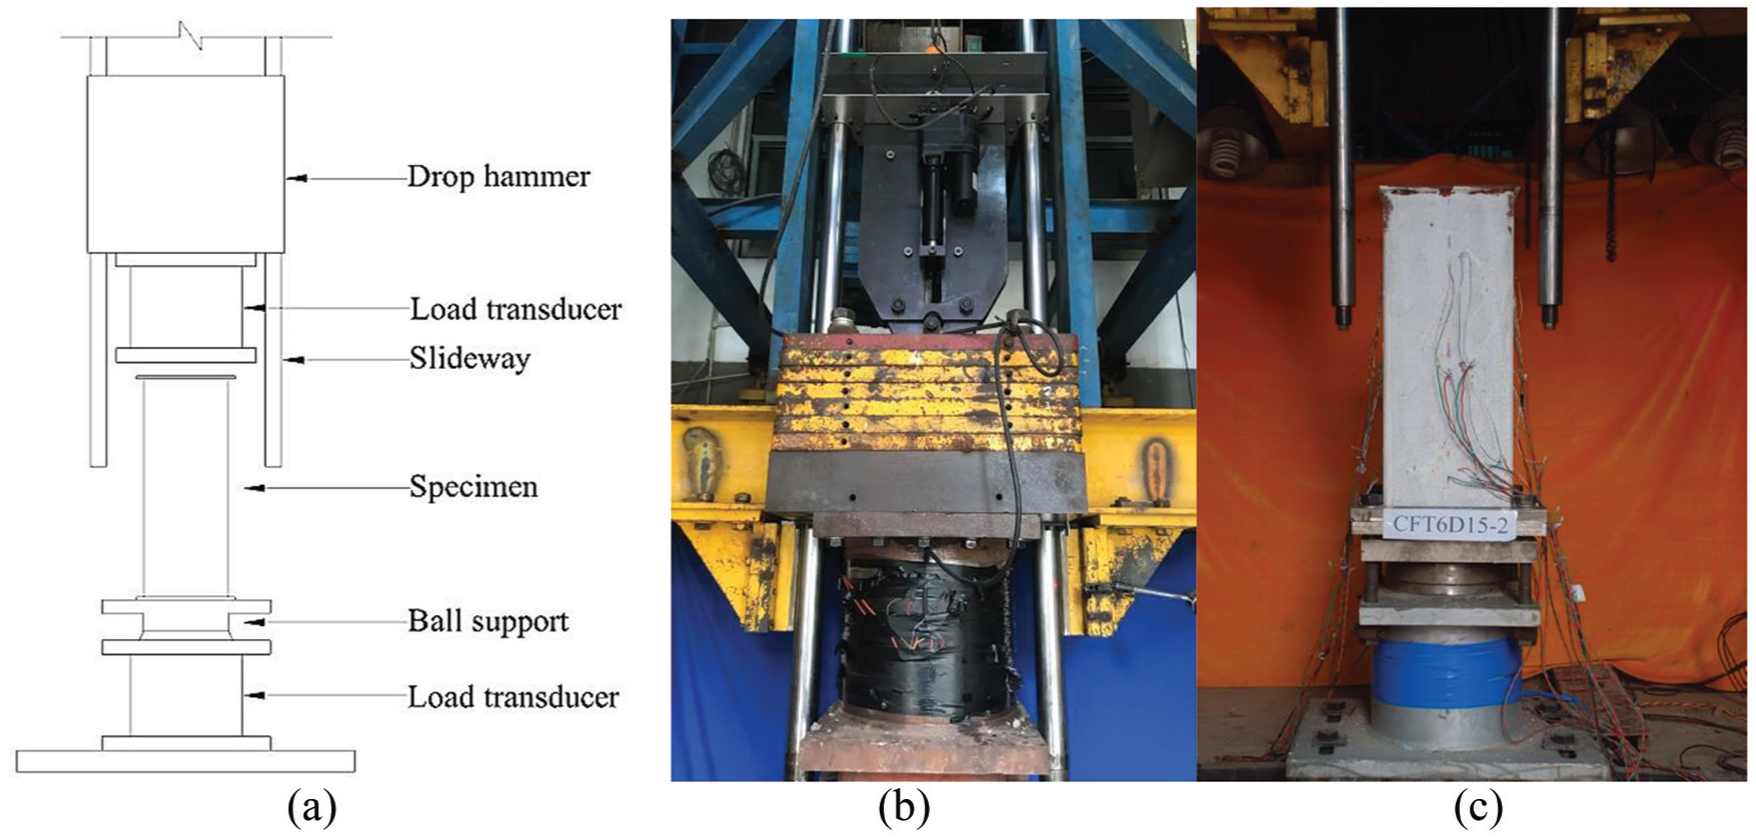
Impact test setup: (a) schematic view, (b) drop hammer, and (c) actual setup.
As shown in Figure 2, for each specimen, 12 transverse strain gauges and 12 axial strain gauges with a gauge length of 5 mm were installed at the top, middle, and bottom portions at four sides of the specimen, respectively, to record the transverse and axial strains of the specimen.
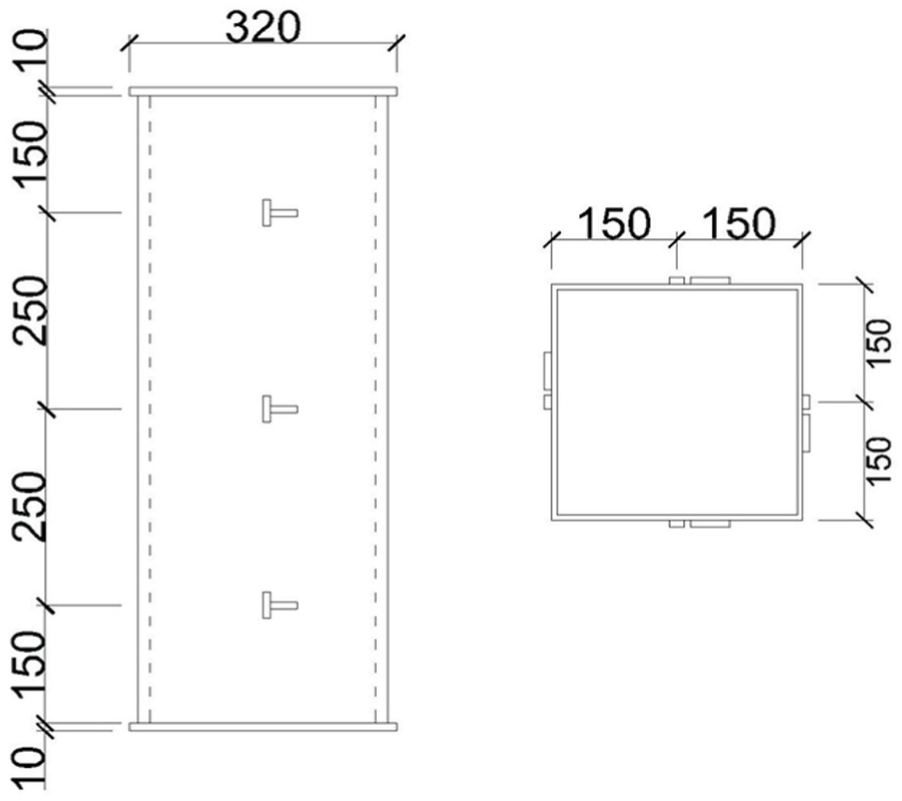
Locations of strain gauges (mm).
Experimental results and analysis
The measured data were processed after testing, and the main results are summarized in Table 1. It is clear that compared with static peak load, the CFT specimens have significantly enhanced peak load under impact load.
Axial static strength of CFT specimens
One stub CFT was constructed and tested under axial static compressive load to understand the static behavior of CFT columns. The load–axial deformation curve of CFT specimen under axial compression load is shown in Figure 3. The curve can be generally divided into four stages: elastic stage, elastic–plastic stage, descending stage, and steady stage. The axial load and deformation curves exhibit that the axial load drops relatively sharply by around 40% after reaching its peak load. At the elastic stage, the confinement of the steel tube was not activated, so the steel tube and concrete beard the load, respectively. With the load progressing, the lateral strain of the concrete increased obviously, resulting in the increase in the confinement lateral pressure by the steel tube. Once the steel tube was activated to confine the concrete, the curve went to the elastic–plastic stage, in which the micro-cracks formed in the concrete and led to the lateral expansion of the infilling concrete. After this stage, the curve showed a sudden failure due to the local buckling of the steel tube and entered the descending portion. Because of the confinement action of steel, the static response of the specimen was relatively ductile after the descending stage. The experimental result of the specimen obtained from static axial compression is also summarized in Table 1. It is clear that the concrete-filled steel tubes showed a great ductility under axial static load.
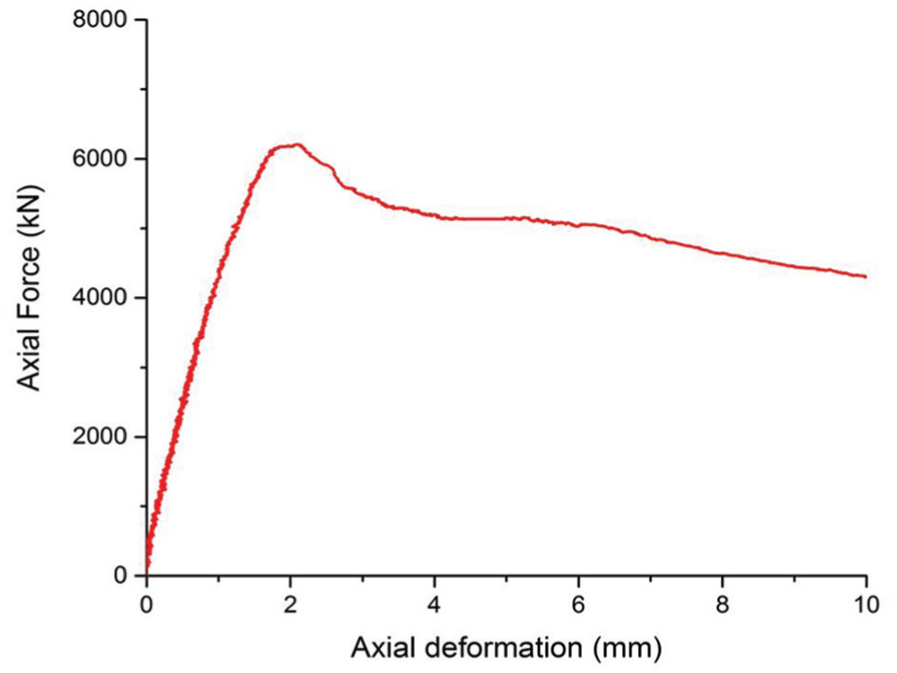
Static axial compressive force–deformation curve of CFT columns.
Impact process
All impact processes of specimens were recorded by a high-speed video camera. The typical impact process of CFT columns under 10 and 15 m drop height is shown in Figures 4 and 5, respectively. It can be observed from these figures that, no visible crack occurred at the corner of steel tubes during the entire process. As shown in Figure 4, at 2 ms, the local buckling was initiated near the impact end of the steel tube, while in the middle portion, the 45° Reuda’s lines were apparent on the surface of the steel tube. With an increase in time to 4 ms, the initial bulge was sustainably sharpened which led to the white putty powder peeled off from the steel tube and the 45° Reduda’s line propagated toward to the bottom end of the columns. At the time around 6 ms, the hammer rebounded and leaved the specimen. For the CFT column subjected to impact from 15 m height in Figure 5, the whole impact process was similar to that of 10 m. However, with the increased drop height, the bulge was more sharpened and the 45° Reuda’s lines were clearer and more near the bottom side of the columns.
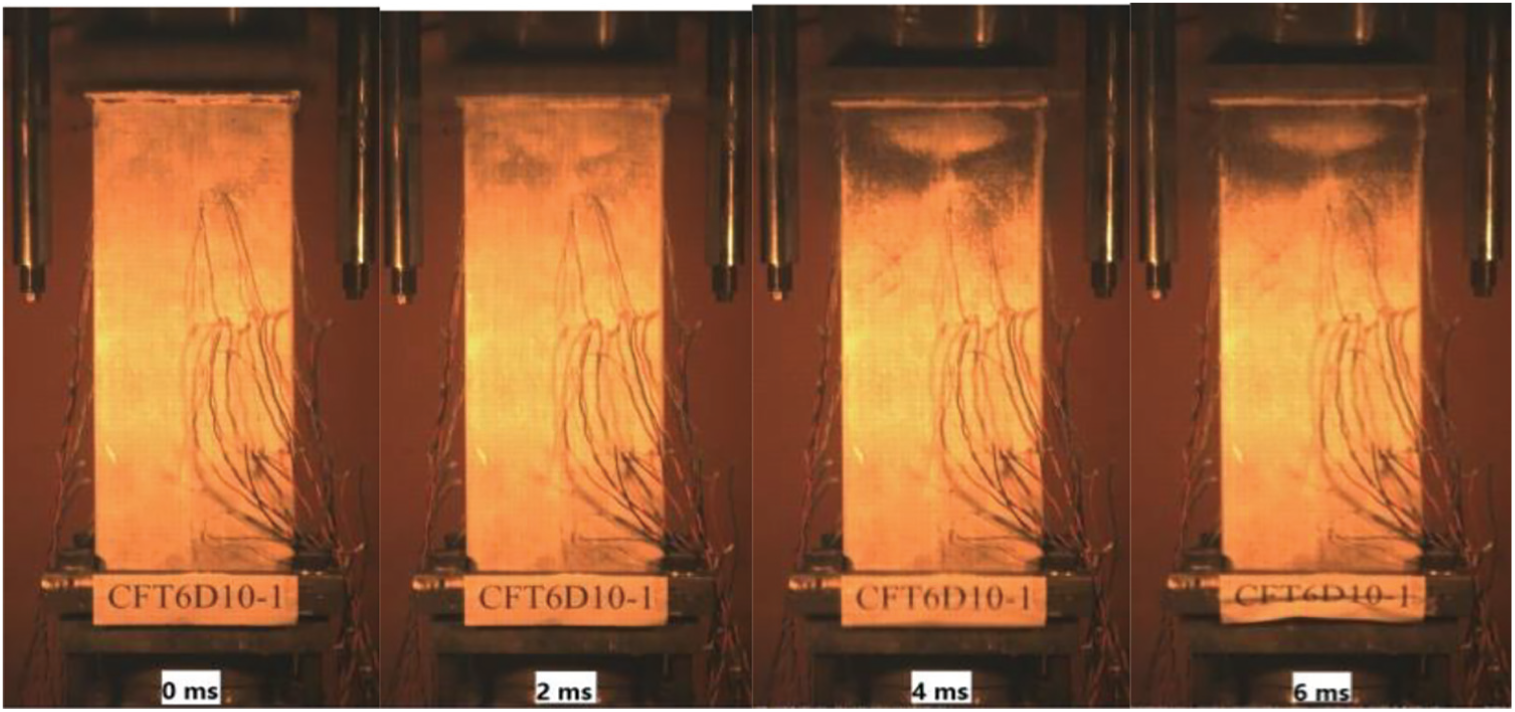
Impact failure process of CFT under 10 m drop height.
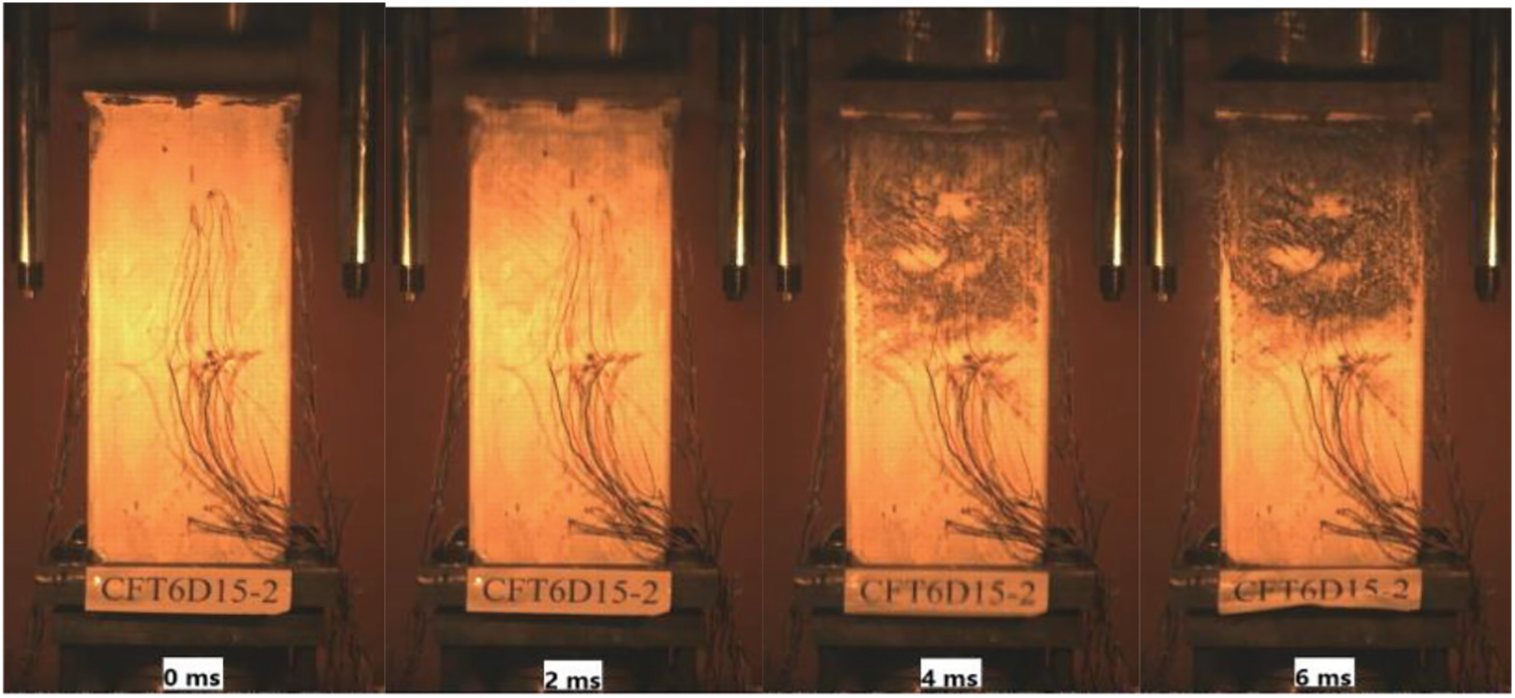
Impact failure process of CFT under 15 m drop height.
Failure patterns
The failure patterns of the tested specimens were also investigated in this study. After the impact tests, half of the steel tube of the specimen was cut off to expose the failure patterns of the core concrete for better observation. Figure 6 shows the final conditions of typical CFT specimens and the corresponding core concrete. In general, all specimens showed a local buckling failure pattern near the upper impact end. At the same time, more 45° Reuda’s yield lines appeared at the middle portion of those specimens under 15 m drop height due to the increase in impact energy. As shown in Figure 6, all visible cracks were marked by black lines. When the drop height was 10 m, the concrete at the upper side was fully crushed while the crack developed to the middle portion. On the other side, the crack lines of core concrete were denser under 15 m drop height. The comparison of failure modes between two drop heights showed that with the increase in impact energy, the steel tube and the inner core concrete have a relative more sign of damage. It has to be mentioned that both steel tubes and infilling concrete on the low side were perfectly visible which means the CFT columns have a superior performance on the impact-resistant capacity than traditional concrete columns.

Failure patterns of steel tube and core concrete: (a) steel tube under 10 m drop height, (b) core concrete under 10 m drop height, (c) steel tube under 15 m drop height, and (d) core concrete under 10 m drop height.
Impact force and displacement time histories
The impact force–time histories of the drop hammer and the support force were recorded using dynamic force transducers. The main peak values are summarized in Table 1, whereas Figures 7 and 8 show the impact force versus time history curves of the CFT columns at both ends under different drop heights. It can be found that the impact force at the impact end and the bottom end of the specimens are not identical, with the peak impact force of the support being smaller than that of impact end. This difference may be resulted from the fact that when the hammer impacted the specimens, a part of the impact energy is accelerated to the specimen, which generates inertia force. The difference in peak impact load at two ends was reduced when CFT columns were under lower drop height. In this study, the impact resistance of test specimens was measured using the records at the bottom end (Pham and Hao, 2017). The shapes of impact force–time histories of two drop heights are quite similar. These curves can generally be divided into four stages according the sequence of time which are the sudden ascending stage, the sudden descending stage, the relatively stable plateau stage, and the attenuation stage. However, it can be found from the figures that the CFT under 15 m drop height showed a sharper ascending stage and a longer stable stage than that of CFT under 10 m drop height. Under 10 m drop height, the average peak impact force of the specimens is 8121 kN with an impact duration of about 4.6 ms. However, the average impact force under 15 m drop height was around 8778 kN with a 5.2-ms impact time. The average mean load is defined as average impact force during the whole impact time. It can be found from Table 1 that the specimens under two drop heights had a similar mean force which is around 3200 kN. The experimental results show that with the increasing drop height of the impact hammer, the maximum impact load tended to increase, while the mean load did not change significantly although the duration of impact force extended.
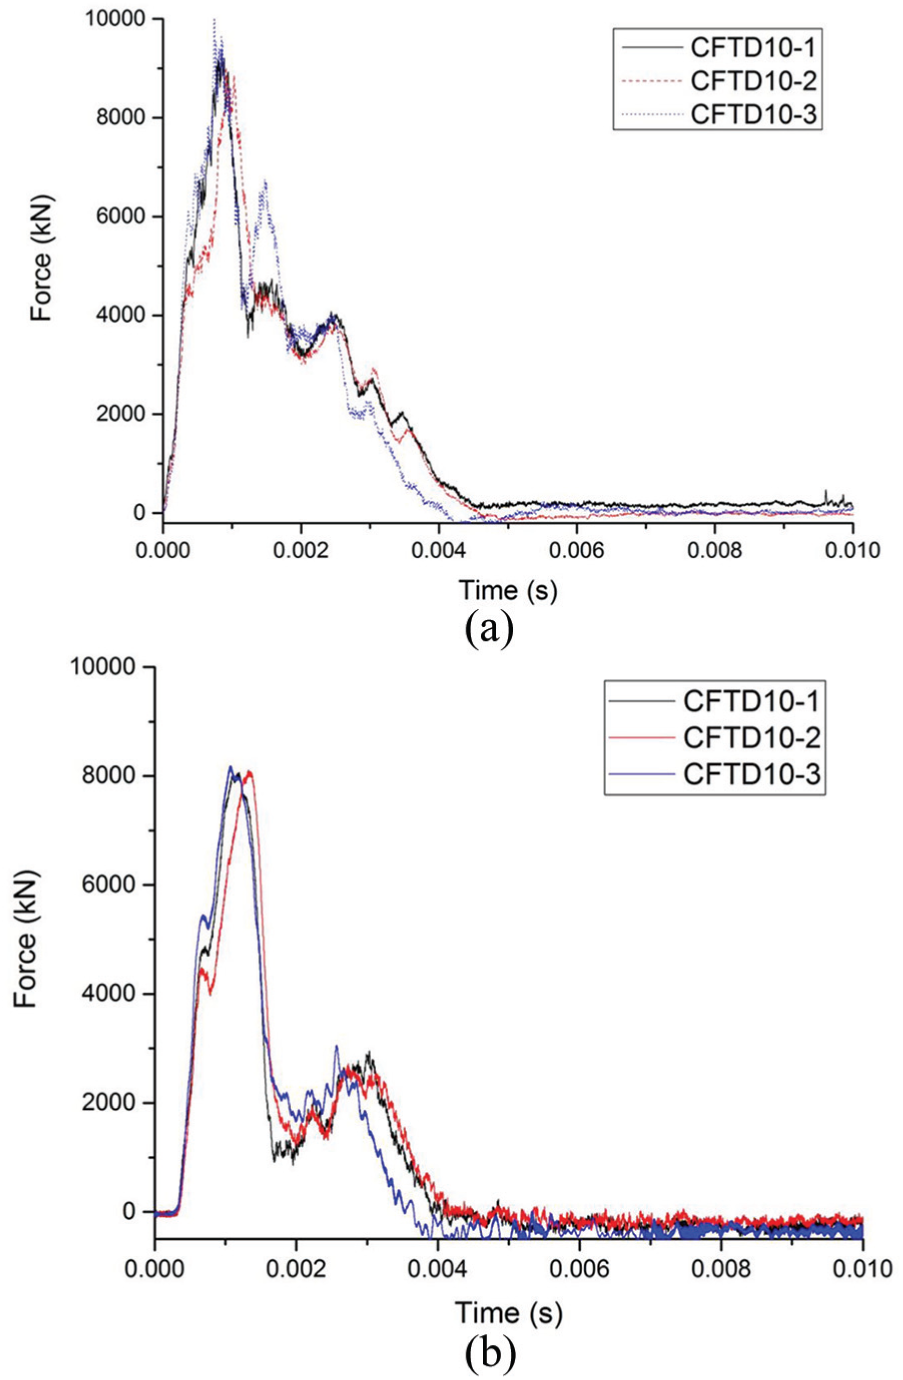
Time history of impact load under 10 m drop height: (a) up hammer and (b) support force.
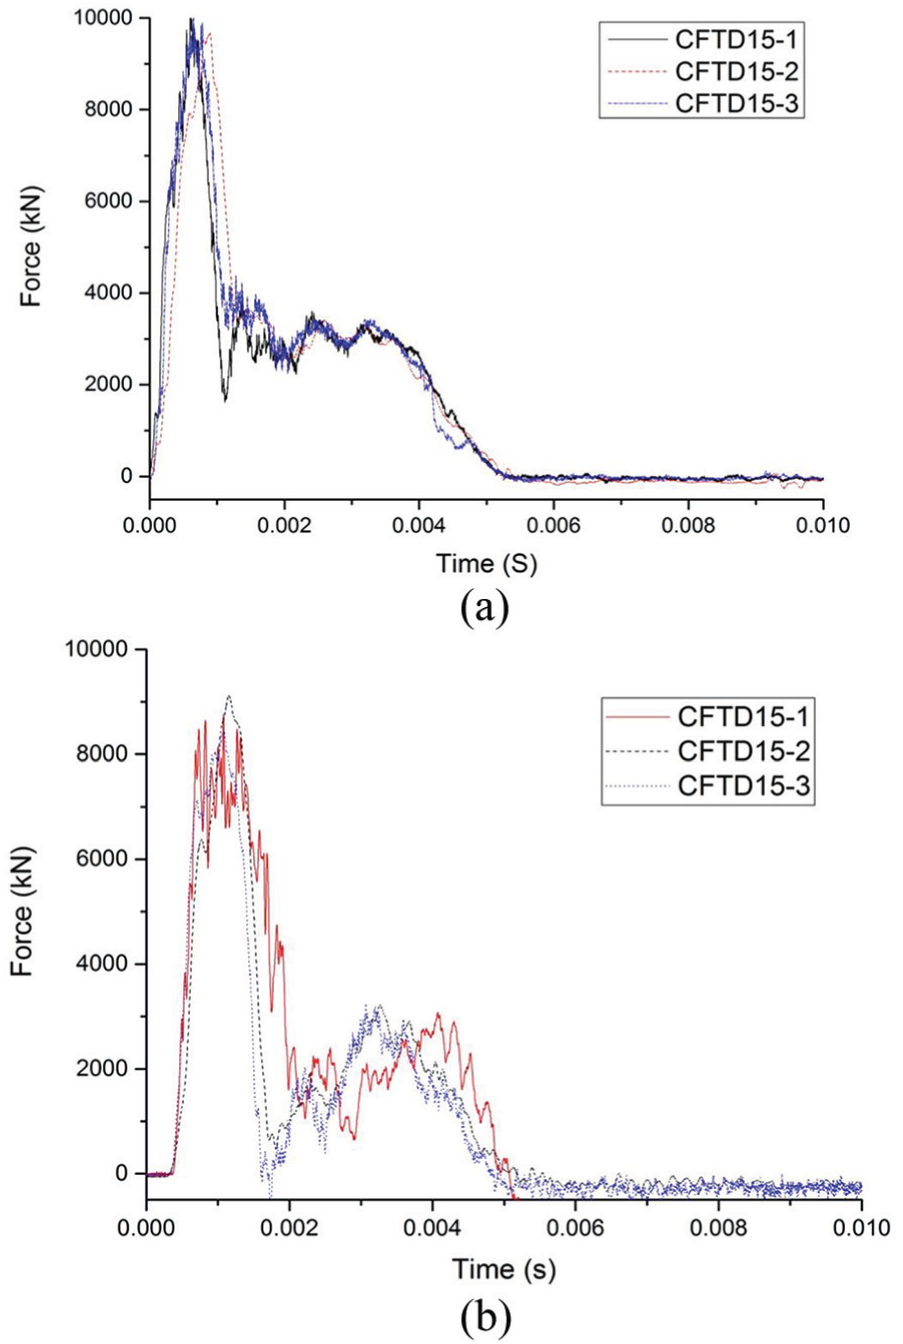
Time history of impact load under 15 m drop height: (a) up hammer and (b) foundation supporter.
The axial impactor displacement time histories under two drop heights are shown in Figure 9. In this study, the impactor displacement time histories were calculated from the twice integrations of the impact force time histories after divided by mass of impactor. As exhibited in Figure 9, the increased input energy leads to increased axial deformation of specimens. Under 10 m drop height, the axial displacement time histories increased to the peak value in approximately 3 ms, while under 15 m drop height, the peak time is approximately 4 ms. After peak displacement levels, all the curves are followed by a slight decrease, probably being attributable to the rebound of impactor.
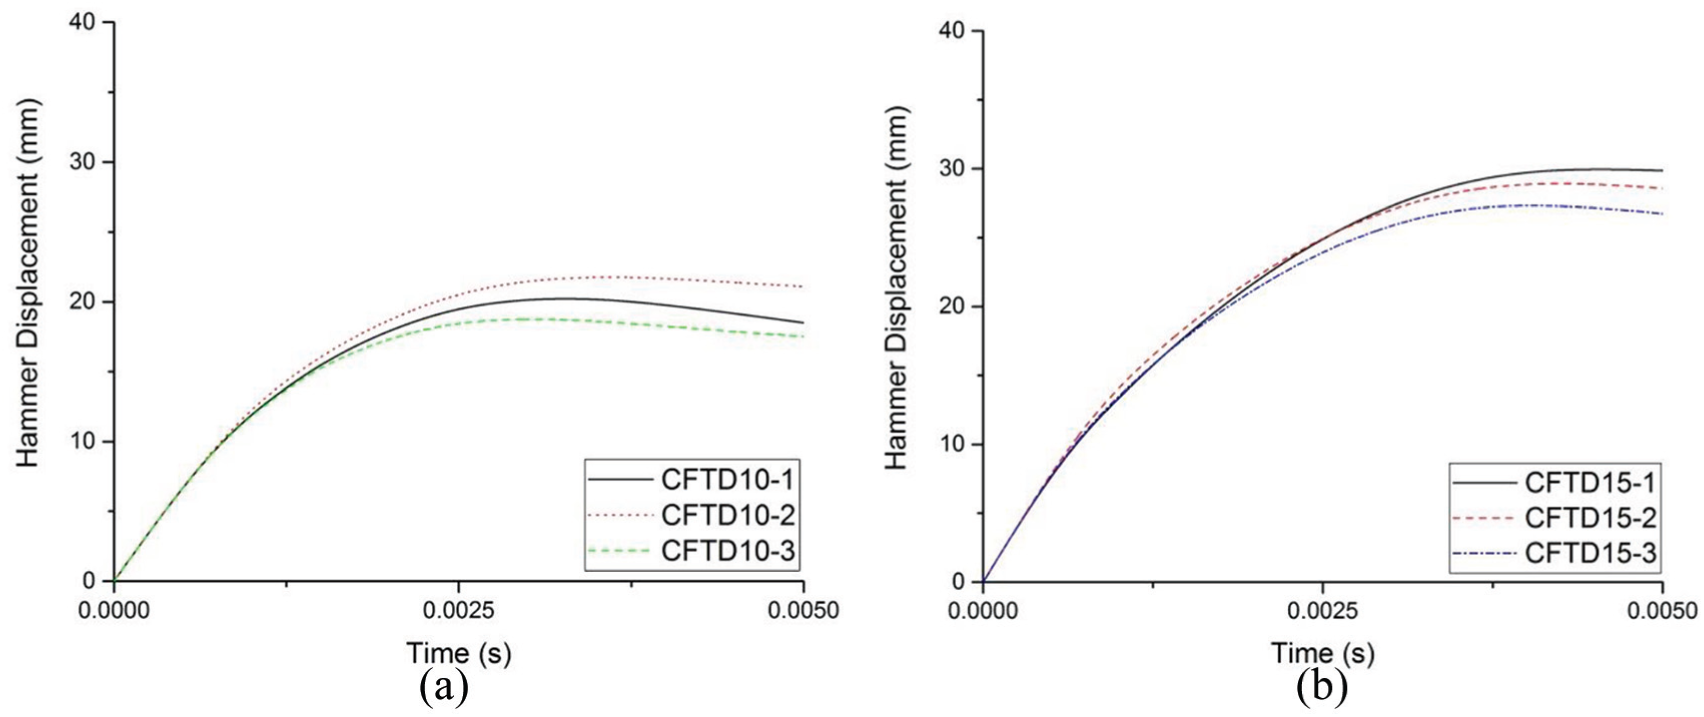
Axial displacement time histories under two drop heights: (a) 10 m and (b) 15 m.
Steel tube strain time histories
The residual strain was considered as a key index of the damage degree to the specimens under impact load. During testing, the strain of steel was monitored by several strain gauges attached along the specimen. The time histories of strain response of typical specimens subjected to two drop height are shown in Figure 10. The vertical strain and transverse strain were the average value of four strain gauges at the same height in the four faces. From a closer observation, after the hammer impacted the upper end of the specimens, the vertical and transverse strain stared to respond subsequently from upper side to bottom side because of the transmission of the stress wave. The peak value of transverse strain gauges from three portions was different and reduced from the impact end to the bottom end, indicating that the axial deformation and lateral confining pressure were not uniform along the specimens. It can be observed that the specimen under 15 m drop height had larger peak strains and residual strains at all three locations than that of 10 m height, indicating the increase in absorbed energy and residual strains with the increase in the impact energy.
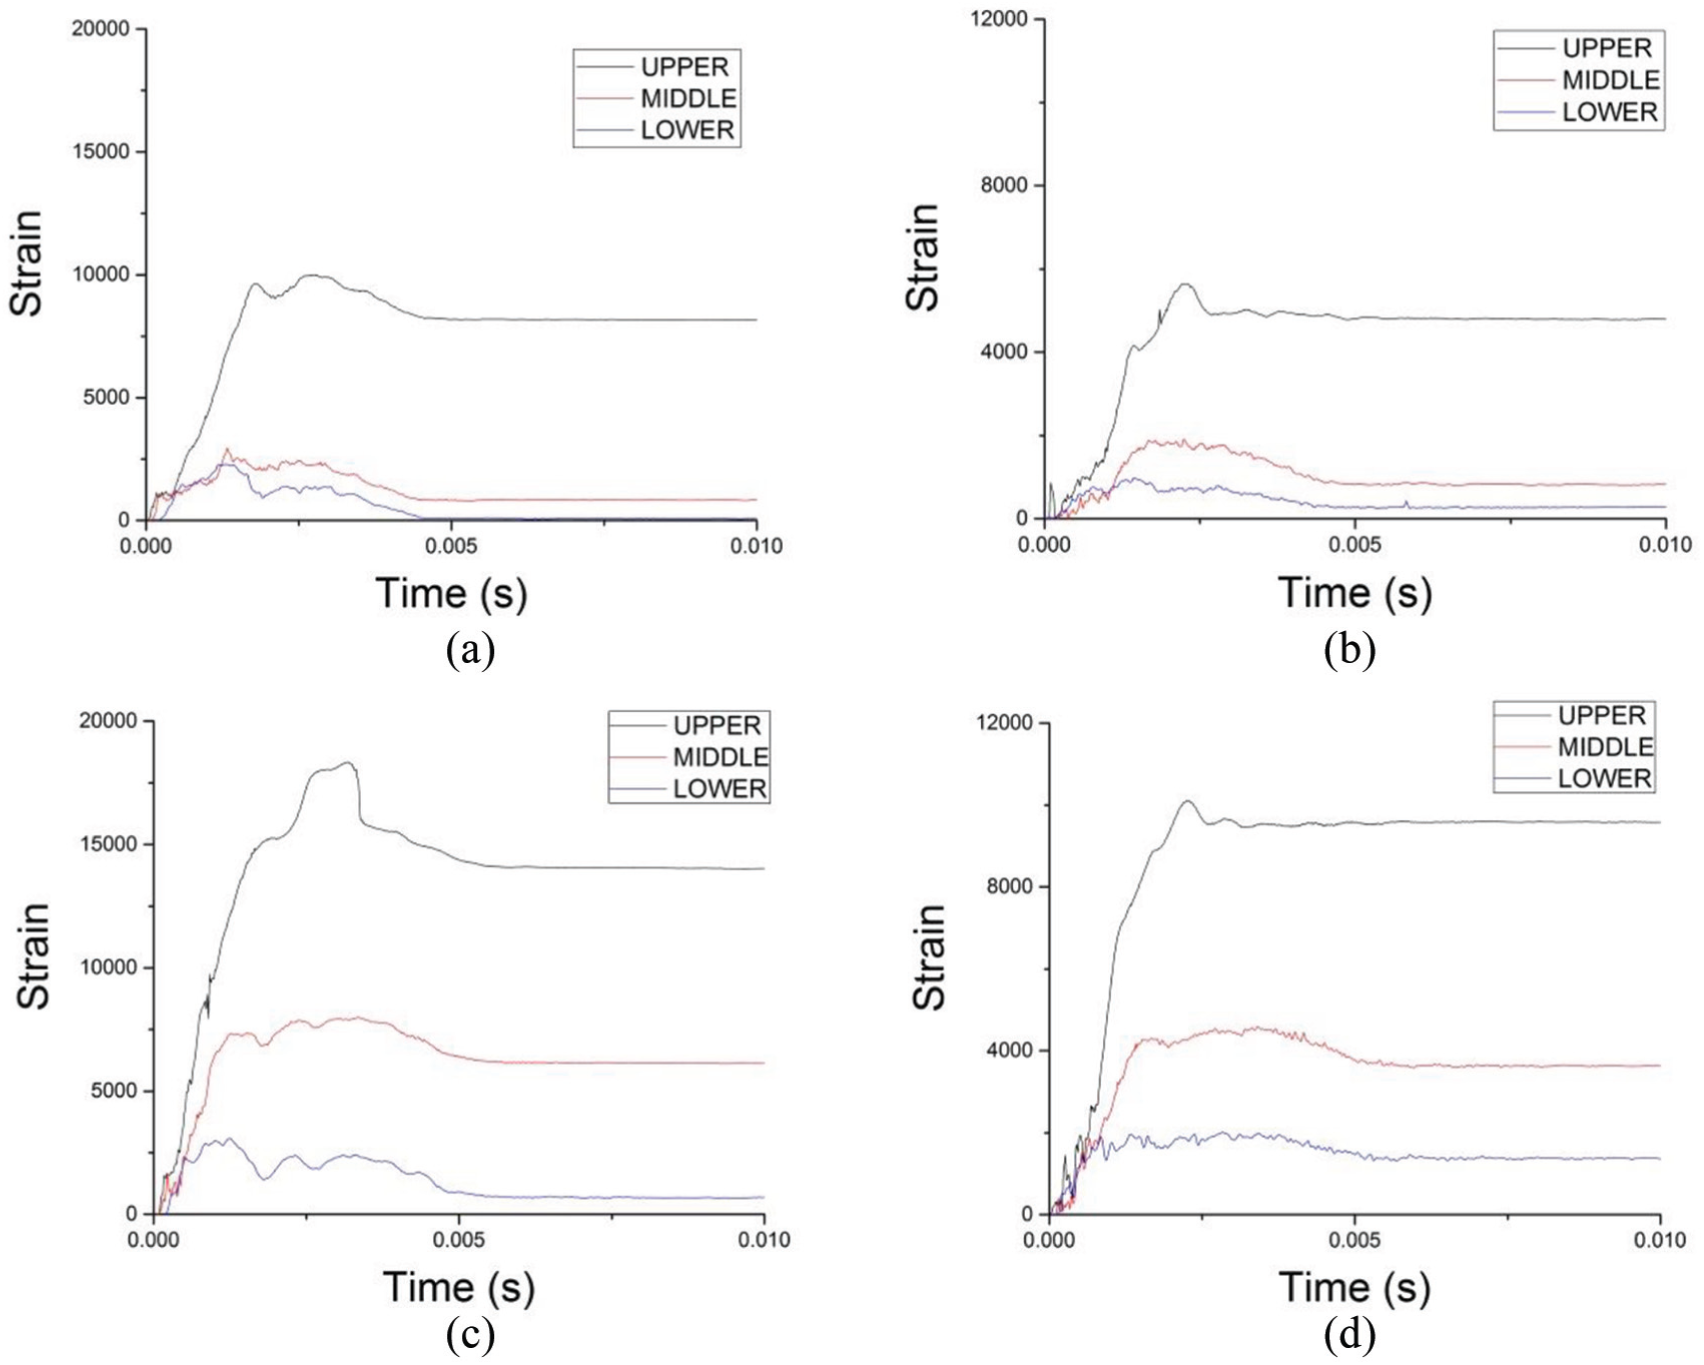
Time histories of steel tube strains: (a) vertical strains of specimens with 10 m drop height, (b) transverse strains of specimens with 10 m drop height, (c) vertical strains of specimens with 15 m drop height, and (d) transverse strains of specimens with 15 m drop height.
The axial residual strain is an indicator of the damage degree of CFTs after impact. Figure 11 shows the relationships of the measured average axial residual strains and the input impact energy. The horizontal axes indicate the input energy which are normalized by the energy corresponding to the yield point under static loading, whereas the residual strains are normalized by the static yield strain of steel tube as vertical axes. In general, the damage degree is not identical along the length of columns. The closer the position to the impact end, the higher the residual strains measured, means higher damage degree of the columns. In addition, although the input energy increased, the lower ends still have relative small residual strains which shows that the CFTs have a superior axial impact resistance capacity.
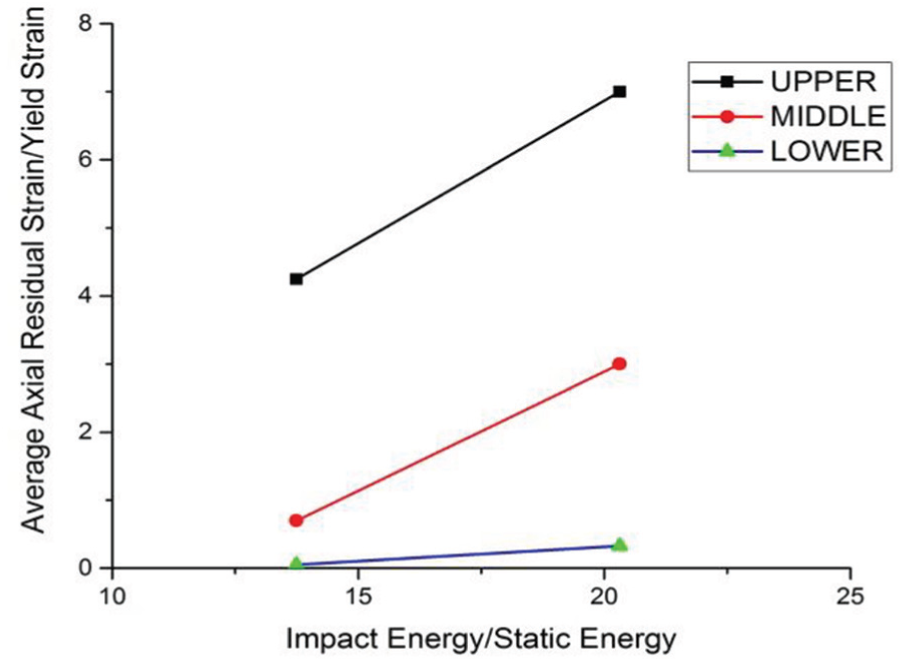
Average axial residual strain and impact energy relationships.
Energy absorption
Two parameters are applied for the determination of the energy absorption characteristics of CFTs.
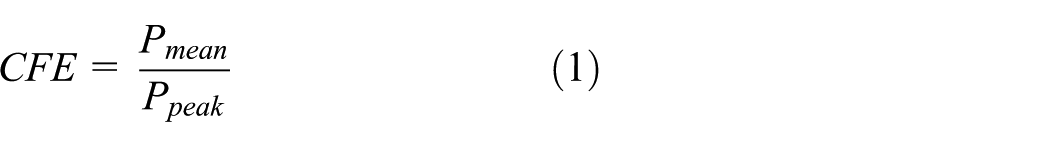
Crush force efficiency (CFE) is an important parameter to evaluate the load consistence, the higher value of CFE, and the better load consistence which means better energy absorption capacity. The CFE is defined as
where
Another key parameter is specific energy absorption (SEA) which is the energy absorbed per unit mass of the specimens, given as follows
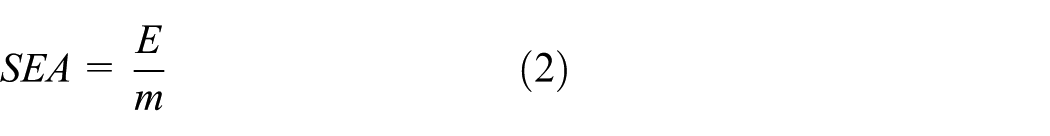
where E is the input energy and m is the mass of the columns. In this study, all specimens were assumed to be 209 kg identically. The detailed results of energy absorption capacities for all CFTs are listed in Table 1.
As it is shown in Table 1, the values CFE of CFTs are generally the same with the increased input energy, while the SEA shows an increased trend. Therefore, CFT columns have a superior energy absorption capacity in terms of specific energy absorption or CFE.
FE simulations
Nonlinear FE method based on the FE software LS-DYNA (Hallquist, 2003) was employed to perform numerical simulations of the square CFT stub columns under impact load and to verify/validate model using the results of the mechanical behaviors obtained from the experimental study.
Description of FE model
To observe the buckling behavior of the steel tube, shell elements were used to model the steel tube while other parts of this test were set as solid elements. In addition, the drop hammer and support foundation were simulated by rigid solid elements. The model is shown for the mapping mesh in Figure 12.
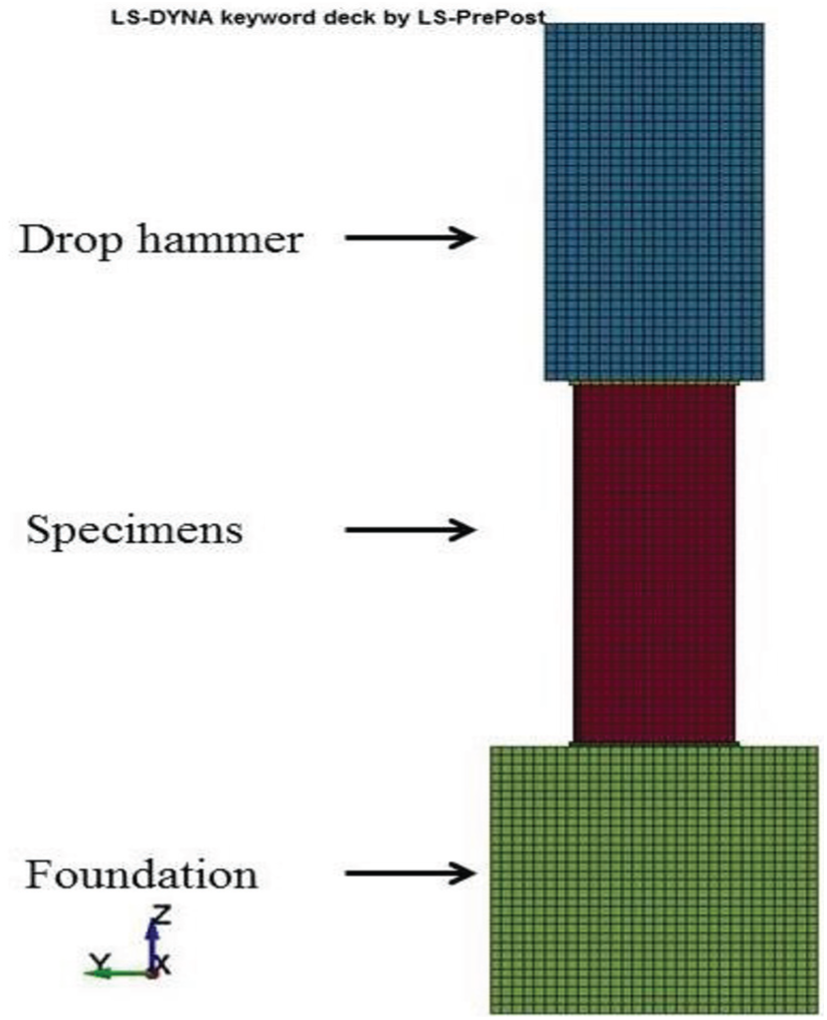
FE model and meshing.
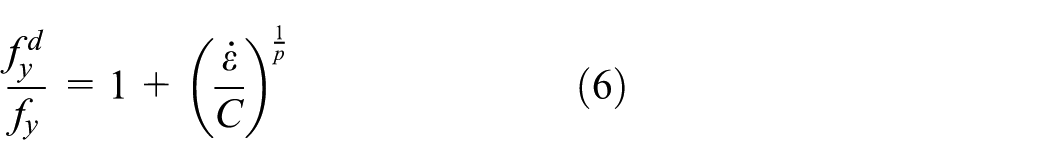
The material model (MAT_PIECEWISE_LINEAR_PLASTICITY) was used for the steel tube. The elastic modulus, yield strength, and ultimate strength from the coupon test obtained in this experimental program were used for the stress–strain model of the steel. Poisson’s ratio of the steel tube was assumed to be 0.3. In this model, Cowper–Symonds model was used to calculate the strength of steel under different strain rates. Singh et al. (2013) obtained Cowper and Symonds’ (1957) material parameters for mild steel in the strain rate from 5 to 750 s−1 and recommend the constant C and P to be 301 s−1 and 2.4639, receptively.
Various material models are available in LS-DYNA to simulate concrete materials. Because the confined concrete properties using the continuous surface cap model (type MAT_CSCM_CONCRETE) exhibited good agreement with the experimental results collected in previous studies by Murray (2007) and Murray et al. (2007), it was chosen for this study. This model combines the failure surface with the hardening compaction surface using multiplicative formulation. All input parameters are the date obtained material characteristic test.
The AUTOMATIC_TIED_SHELLEDGE_TO_SURFACE was used to simulate the contacts between steel tube and two end plates. In addition, all contacts in this model use AUTOMATIC_SURFACE_TO_SURFACE with a friction coefficient of 0.25 (Hu et al., 2003). The boundary conditions used in this model replicated the test conditions by fully fixing the bottom end of the support foundation and giving the hammer a 15.6-m/s initial velocity which is measured from the 15-m impact test.
Verification
Figure 13 illustrates the failure modes with Von Mises stress contours of concrete and steel tube. It can be observed that the concrete at the corner has a higher stress than other part of section because of the confining effect of the steel tube. The FE model can generally predict the local buckling of the steel tube and the failure mode of the CFT specimens well.

Failure mode with Von Mises stress contours: (a) concrete and (b) steel tube.
The comparison between the FE and test impact force–time curves for CFT column at both ends under 15 m drop height load is shown in Figure 14. In general, the impact force–time histories of the FE model capture the trend and shape of the experimental curves well.

Comparison between the predicted and the tested impact force–time history curves: (a) impact force measured for drop hammer and (b) reaction at lower support.
Axial deformation is a key index of energy absorption capacity. As the vertical strains are varied along the steel tube height, the axial deformation of the middle 500 mm of CFT column is assumed to be the integration of average value of vertical strain gauges affixed on the specimen surfaces. Figure 15 shows the comparison of experimental deformation and FE deformation of the middle 500 mm. The simulations appear to be reasonable as the results being capable of capturing the overall shapes of the deformation time histories.
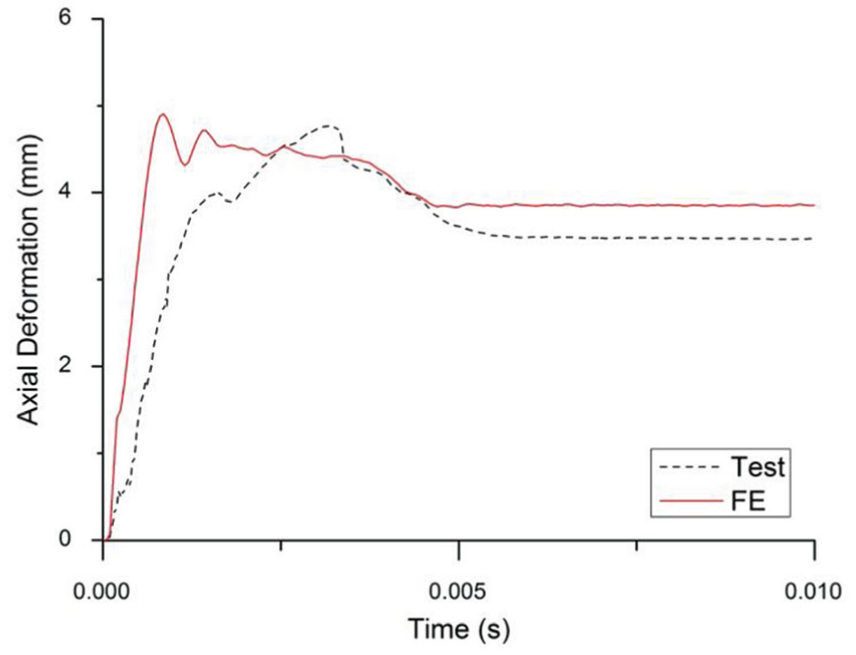
Comparison of simulated and experimental axial deformation time histories.
Discussions
Specimen CFTD15-1 of this study is selected as a typical example for the discussions. The time history of energy dissipation in the steel tube, infilled concrete, and impactor is shown in Figure 16. It can be seen that the energy dissipated by the steel tube and the infilled concrete account for 55% and 43% of the total impact energy, respectively, which means the impact energy was mainly dissipated by the steel tube and infilled concrete in the whole impact process. The rest 2% of the impact energy was consumed as hourglass energy.
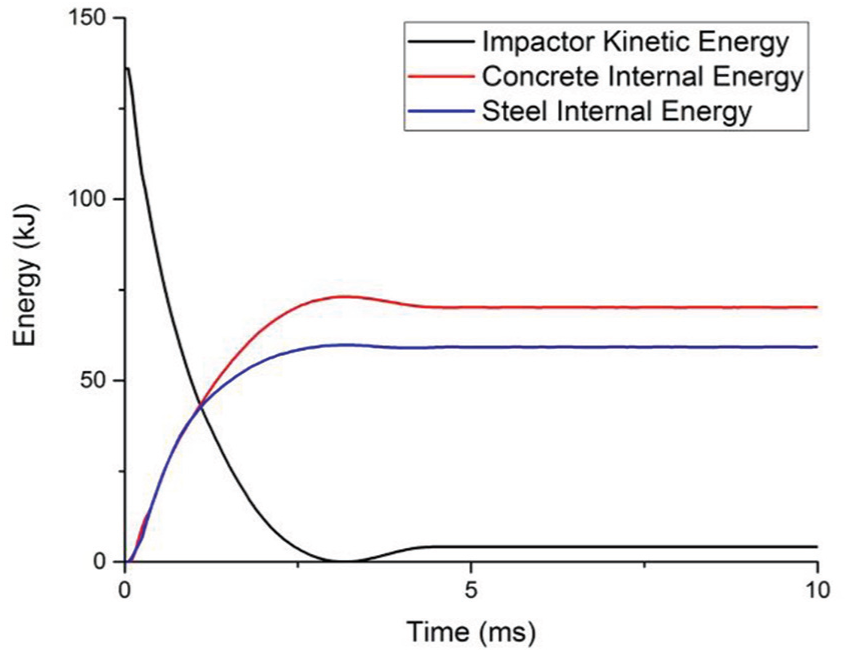
Energy dissipation of the outer steel tube, infilling concrete, and impactor.
The plastic strain of the steel tube is shown in Figure 17. It can be seen that when the impact load reaches the peak load, the plastic deformation only appears in the impact area with a relatively small value. Then, the value of plastic strain develops dramatically and mainly concentrates in the impact end. However, the rest of parts of the member almost have no plastic strain. When the impact process nears to complete, the plastic strain distribution has no obvious change, with only elastic recovery deformation.
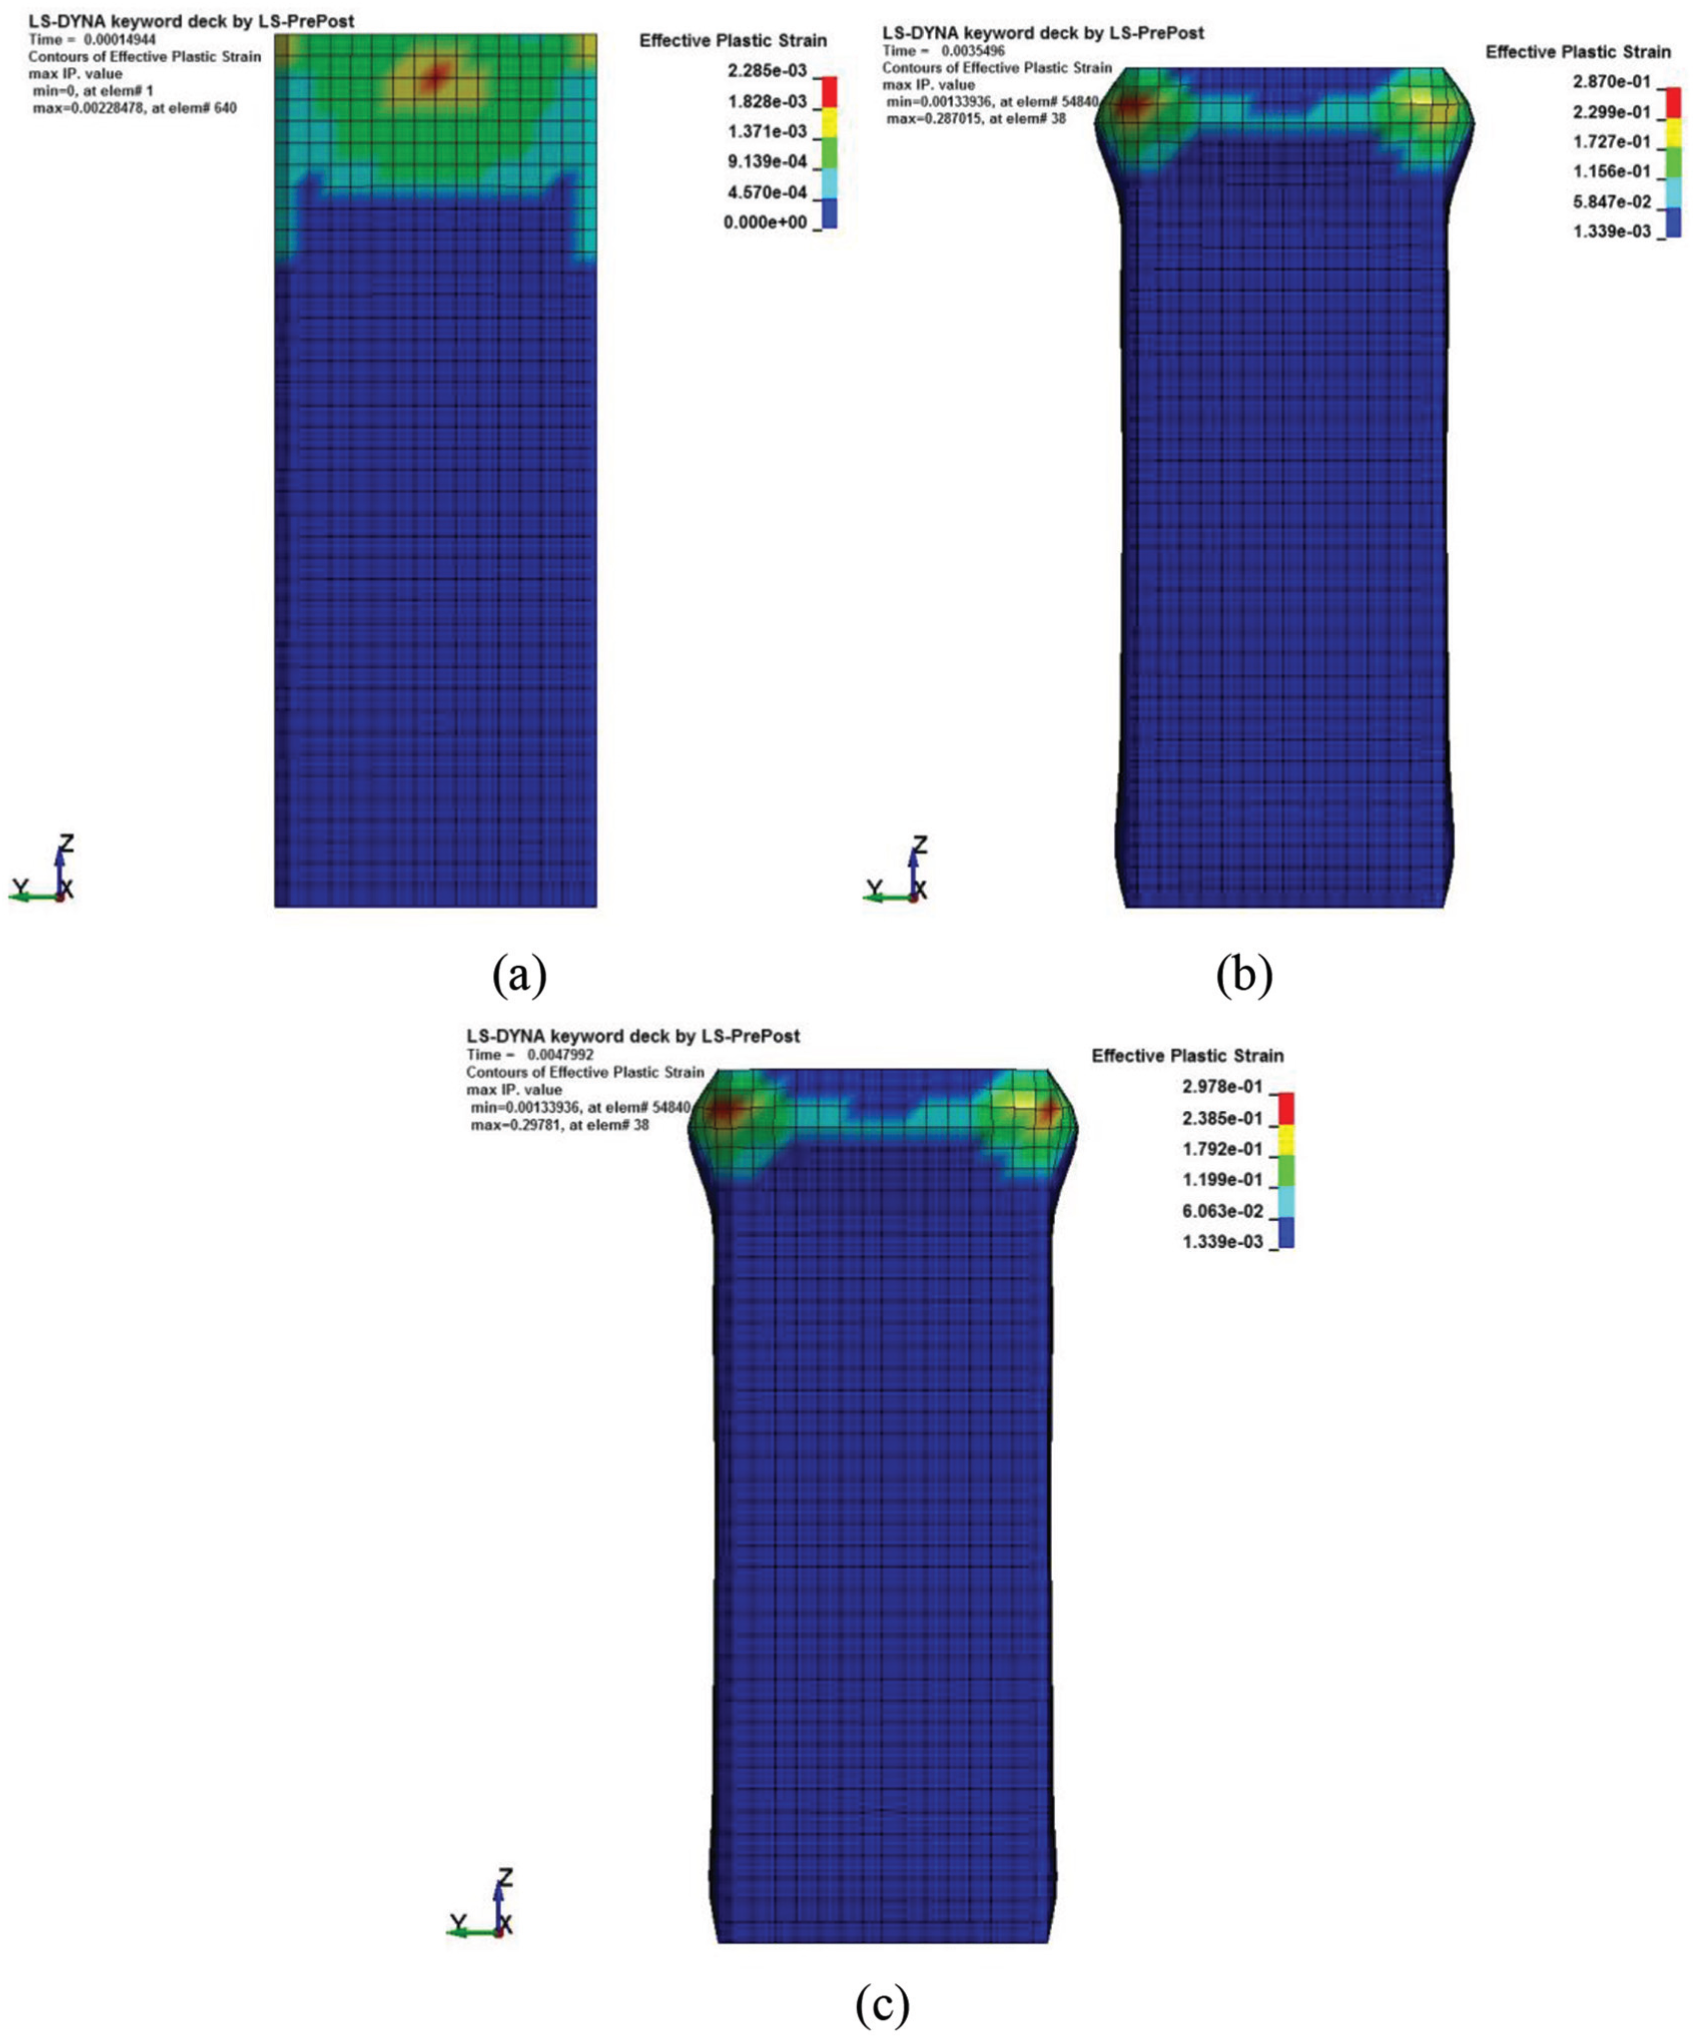
Plastic strain of the steel tube at (a) peak load, (b) end of stable stage, and (c) end of attenuation stage.
Parametric study
Detailed parametric studies are conducted to observe the effect of different governing parameters on the behavior of CFT columns subjected to axial impact load. The parameters considered in this work are impact velocity and impact mass.
The initial velocity of drop hammer is varied to investigate the effect of impact velocity on the CFT stub columns. The constant impact mass is set as 500 kg, while the initial velocity of drop hammer in this study is selected as 10, 20, and 30 m/s. Figure 18 shows the time–history curves of impact force under different impact velocities. It can be observed that the CFT column with highest impact velocity experiences maximum peak impact load and longest impact duration time. This occurs because with the increase in impact velocity, the steel and concrete experience higher strain rate, leading to higher response strength. The impact duration time is increased with the increase in impact velocity as well as because of the increased impact energy.
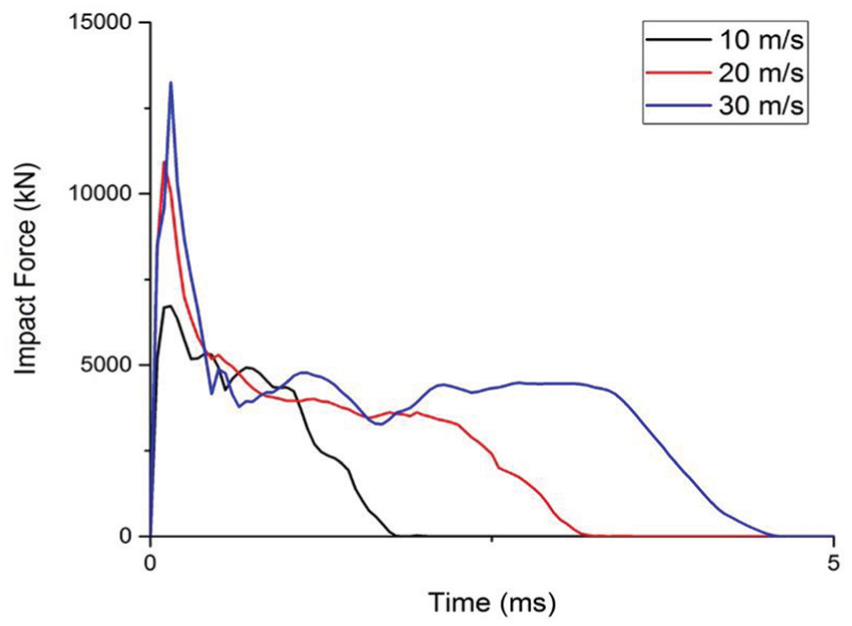
Effect of impact velocity on the time histories of impact force.
The effect of impact mass is studied by varying the mass from 500 to 1000 and 2000 kg, respectively, to consider the different impact mass, while the impact velocity is fixed at 10 m/s. Figure 19 presents the time histories of the impact force corresponding to different masses. The initial peak forces of CFT columns are almost insensitive for varying mass because unlike varying the impact velocity, the strain rate here is constant. Thus, the strain rates’ increment effect on the initial peak loads is not significant. At the same time, the impact duration time increased with the increase in hammer mass because of the increase in impact energy.
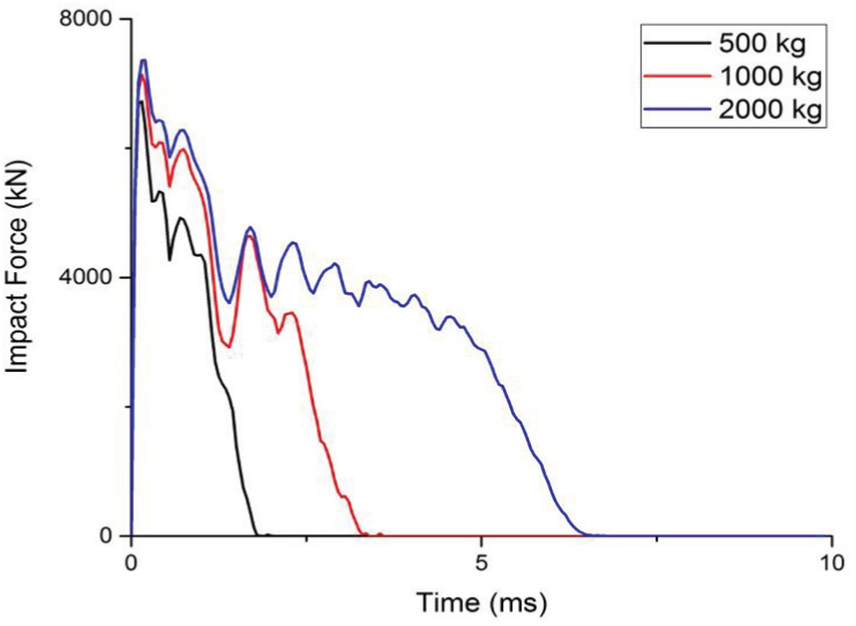
Effect of impact mass on the time histories of impact force.
In general, when the impact energy is higher, the time–history curves of impact force keep constant after peak forces are more prominent. This may be due to that with the increase in impact energy, the column experiences large axial displacement with longer time duration, thus more plastic deformations in the column.
Calculation of axial peak load
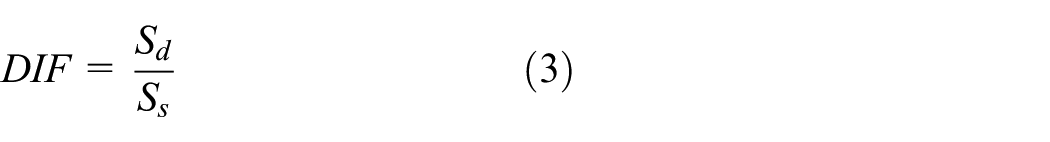
Based on the test results of the impact loading and static loading on CFT columns, the dynamic axial strength can be estimated using the dynamic increase factor (DIF). The DIF is defined as
where
For all CFT specimens under different drop heights, the DIFs are calculated and listed in Table 1. In this study, the static peak load is used as the static peak load of CFT specimen which is 6528 kN. As shown in Table 1, for specimens subjected to 10 m height impact, the average DIF is 1.25, whereas the DIF increases to 1.34 for specimens with a drop height increased to 15 m.
When a concrete-filled steel tube is subjected to axial compression, the infilling concrete expands laterally. The steel tube prevents this expansion leading to passive confining pressure to the concrete. Such confinement effect is typically pronounced in circular columns with increased loading capacity. However, for square CFT columns, the following simple additive equation of the strengths of steel and concrete sections can be used in predicting the peak load under axial compression (Sakino et al., 2004)

in which, As and Ac are the cross-sectional areas of steel tube and concrete, respectively.
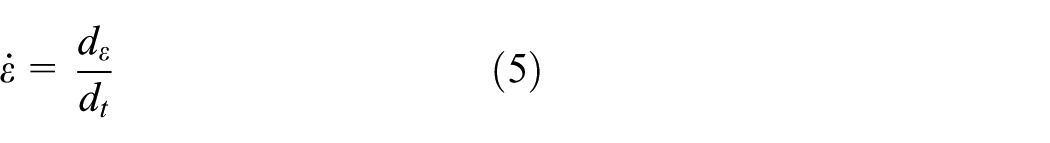
The compressive strength of CFT columns under static loads can be calculated with the previous equations. The concrete and steel are both strain rate insensitive materials. The strength of these materials increases under high strain rate loading. The average strain rate applied on the specimen in this study can be calculated as
where
The yield strength of steel under different strain rates was calculated with Cowper and Symonds’ (1957) parameters, as shown in equation (3)
where
The CEB-FIP model (Beton, 1991) recommends the dynamic compressive strength of concrete as

where
Based on these equations, the following formula is suggested to determine the axial load impact resistance of CFT columns

To validate the calculating method for impact resistance of CFT columns, the predicted peak load using equation (8) is compared with the test results obtained in this study and is shown in Figure 20. The calculation of static model as defined by equation (2) is also shown in Figure 20 for comparison. Because the impact force at impact ends contains the inertia force, the support reaction force was used for comparison of theoretical calculation. In can be seen in Figure 20 that the proposed model is reasonable in predicting the axial impact load capacity of stub CFTs.
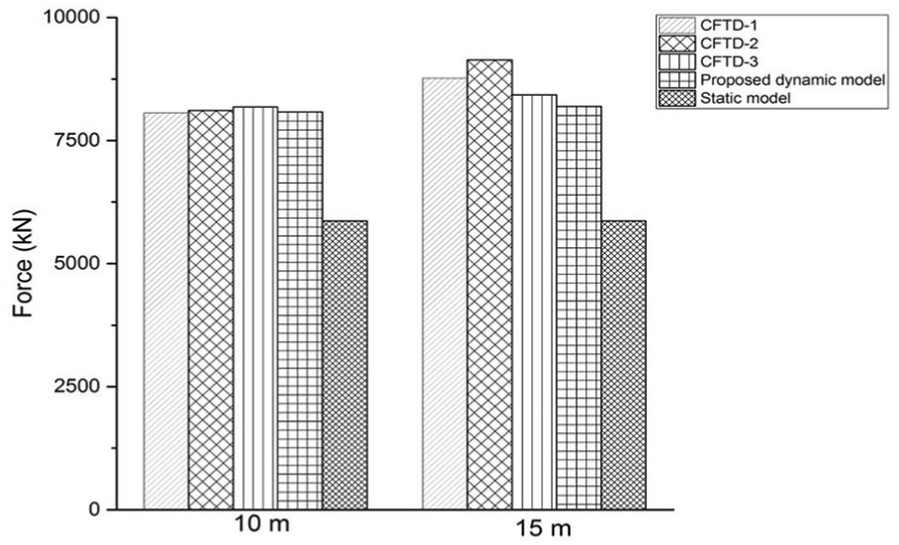
Performance of the proposed model.
Conclusion
In this article, a series of CFT square stub columns were tested under static and impact loads with different impact energy for two drop-weight heights. Based on the experimental results and the FE analyses, the findings in this study can be summarized as follows:
The failure of both steel tube and infilling concrete occurred at the impacting end of the specimen. The lower portion showed the signs of yielding on the tube and cracks in the concrete. With increasing impact energy input, the damage of CFT specimens after test also increased.
The CFT square stub columns had a superior performance in impact resistance characteristics. The increase in impact energy appears to extend the impact duration time rather than significantly increase the impact force. This column system also has a superior energy absorbing capacity by calculating its CFE and SEA parameter.
The dynamic analysis program LS-DYNA was employed to simulate the impact behaviors of the CFT stub columns in this study. The predicted failure modes, impact force time histories, and the impact duration time were in good agreement with the experimental observations. Then, the FE model was used to perform a detailed analysis, including the stress and strain distributions and energy dissipations. Finally, from the parametric study, the impact force is shown sensitive to impact velocity other than the impact mass. The duration time is sensitive to impact energy.
Based on the experimental results, a calculation formula is proposed for obtaining the material strength of the CFT stub columns under axial impact load. The proposed formula shows a good correlation with the experimental results.
Footnotes
Acknowledgements
Help provided by the staffs of the Ministry of Education Key Laboratory of Building Safety and Energy Efficiency is warmly appreciated.
Declaration of Conflicting Interests
The author(s) declared no potential conflicts of interest with respect to the research, authorship, and/or publication of this article.
Funding
The author(s) disclosed receipt of the following financial support for the research, authorship, and/or publication of this article: The research reported in this article was carried out under the support of the National Natural Science Foundation Key Project (NSFC 51438010).