



Abstract
In this article, the optimum performance-based seismic design of steel frames is performed using the novel constraint control method. This method is based on a simple concept generally used by the engineers in structural design. In this method, the most conservative member sections are initially selected and by gradually reducing the size of the sections through controlling the problem constraints, the solution tends to an optimum design. The capacity curve of the structure is evaluated through static nonlinear analysis and used for the seismic assessment, and the structural weight is optimized by controlling relative displacement constraints at performance levels of operational, immediate occupancy, life safety and collapse prevention. The performance and efficiency of the proposed algorithm in solving for optimum performance-based seismic design are assessed through solving three benchmark problems. The results show that using constraint control method drastically reduces the number of structural analyses required to reach a solution, compared to the more commonly used metaheuristic optimization methods, while producing comparable optimum solutions. For this reason, the constraint control method is found to be particularly suitable as an optimizer for solving solution-extensive problems, such as performance-based optimum design of structures.
Keywords
Introduction
Intrinsically, humans try to use their limited resources to the fullest, that is, reaching the best results using the minimum energy. This is also the aim in different branches of science and engineering. In design and construction of structures, the engineers attempt to proceed with minimum equipment and cost, within the required safety levels. Initial attempts at optimum design lead to classic algorithms such as linear planning (LP), nonlinear planning (NLP) and dynamical planning (DP) (Hillier and Lieberman, 1967). Later, other algorithms, mainly based on natural phenomena (heuristic and metaheuristic methods), such as genetic algorithm (GA), ant colony optimization (ACO), particle swarm optimization (PSO) and harmony search (HS) algorithms, have been developed and shown to be suitable for structural design optimization (Dorigo et al., 1996; Fourie and Groenwold, 2002; Geem et al., 2001; Goldberg, 1989). A large number of different metaheuristic methods for optimum design have been developed, with different efficiencies (Bozorg Haddad and Afshar, 2004; Kaveh and Talatahari, 2010b; Toğan, 2012; Erol and Eksin, 2006). The current trend is on improving the performance of existing metaheuristic methods by adding certain new features or by hybridizing two or more different methods, combining their best features or by developing new metaheuristic algorithms. Comprehensive reviews on new developments in metaheuristic optimization techniques for engineering problems are given by Saka (2003), Lamberti and Pappalettere (2011) and Saka and Doğan (2012). A major problem with basic metaheuristic algorithms is their general inability to distinguish between a local optima and the global optima. In recent years, a number of techniques have been developed to improve their performance in searching for global optima (Kaveh and Talatahari, 2010a; Maheri and Narimani, 2014; Maheri and Talezadeh, 2018; Maheri et al., 2016, 2017; Safari et al., 2011). However, many of these techniques lead to increased analysis time and effort, which for larger, solution-intensive problems become inhibitive.
Due to these shortcomings, optimization techniques are rarely used by engineers for design purposes. Engineers usually arrive at an optimum design empirically by changing the variables and controlling the constraints. In this article, an alternative optimization algorithm is presented based on the conventional method adopted by the engineers which deals with one answer only – does not require memory for storing data and is not inspired by nature and although simple, is a suitable and efficient method for optimum design of discrete structural systems such as sway frames. The proposed method is termed ‘constraint control method’ (CCM). It is based on numerical search and starts with a conservative design which generally satisfies the problem constraints. Then, through small steps, the solution is gradually improved by changing the variables and ensuring the problem constraints do not exceed the limit states. As the problem constraints approach their limit states, the solution approaches its optimum state. The proposed method achieves the optimal response with far fewer analyses compared to the innovative and metaheuristic methods.
Different methods may be utilized to design a structure. Some of the more recent methods include reliability-based design optimization (RBDO) (Meng et al., 2015; Meng and Zhou, 2018) and performance-based design (PBD). They have been shown to be more cost-effective alternatives to the classical forced-based design (FBD) methods. The PBD method is shown to be particularly useful in seismic design of structures. PBD concepts for seismic rehabilitation of existing buildings, as well as design of new buildings, have been covered by a number of guidelines such as ATC-40 (1996), FEMA-350 (2000), FEMA-356 (2000) and FEMA-273 (1997). The PBD objective is to design the building in such a way that it has a predictable and reliable performance and level of acceptable damage under specified seismic loads. For this purpose, optimizers can provide a very suitable environment. Therefore, optimization techniques have been utilized relatively early for PBD of structures. Earlier works are due to Liu et al. (2003, 2005) in which they presented a GA-based multi-objective optimization method for PBD of steel frame buildings, which included the life-cycle cost. They provided a Pareto optimal design, giving a wide range of valid design alternatives. Fragiadakis et al. (2006) conducted performance-based multi-objective design of steel structures, also considering life-cycle cost. Later, Kaveh et al. (2010) carried out performance-based seismic design of steel frames using the ACO as the optimizer and showed the superiority of this metaheuristic optimizer compared to a standard GA. Gholizadeh et al. (2013) also reported on PBD optimization of steel moment frames using a number of different metaheuristic optimizers, including GA, ACO, HS and ACO, highlighting the superiority of the PSO method compared to other metaheuristics. They minimized the structural weight subject to performance constraints on inter-storey drift ratios at different performance levels. Kaveh and Nasrollahi (2014) later showed that the charged system search (CSS) optimizer is more efficient than the two previously studied GA and ACO optimizers in PBD of steel frames.
As it was stated earlier, using metaheuristic optimizers for PBD of buildings is very costly, rendering their use inhibiting for practical optimum performance-based seismic design of buildings. In this article, the proposed CCM optimization technique, which requires a far less number of analyses than the metaheuristics, is developed and used for PBD of sway steel frames. The efficiency of the CCM in solving such problems is demonstrated through comparing the CCM optimization results with those of a number of metaheuristic optimizers for three benchmark sway steel frames.
The general CCM of optimization
In solving optimization problems, certain problem constraints should generally be satisfied. The optimum answer to a system is reached when these constraints are utilized to their limits. In the proposed method, the problem constraints are transformed into coefficients ranging from 0 to 1, by normalizing each constraint value to its corresponding limit value. They are, therefore, dimensionless so that they could be compared with each other. Based on this assumption, the optimum answer is located on a constraint boundary (gi =1) under the condition that other constraints(g1, …, gnc) are also equal to 1. Figure 1(a) shows the state of gi constraints of a two-variable (X1, X2) problem with three constraints (gk, gm, gn). Also, Figure 1(b) shows the changes in the objective function as the constraints vary. According to the mathematical planning principles (Hillier and Lieberman, 1967), it can be shown that the optimal response lies on one of the intersections of the constraints boundaries, such as points A, B or C in Figure 1(a).

(a) Optimal points for a two-variable (X1, X2) problem with three constraints and (b) changes in the objective function and constraints for one unit of change in the variable.
In the proposed CCM of optimization, first, a certain point of the system at which the constraints have low values is selected. Then, through changing the variables (Xi), controlling constraints (gi) and changing the function value (Z), all the normalized constraints are gradually directed to have values approaching unity at which point the target function (F) is optimized. In each step, all variables are changed by a small increment (ITR). Then, the variable which has the highest decrease in the objective function (Z(X)) and the lowest increase in constraints (gi), compared to the other variables is selected. In order to determine this, a parameter, termed check, is defined. This parameter determines which variable in each stage is selected, as defined in equation (1)


where F is the target function of the problem and Z(X) is the objective function as defined in equation (2). Also, Z0 and g0 are, respectively, the target function and constraints, accepted for the previous step. Then, the maximum of the checks of different variables is selected as the best answer in that step. Another parameter, termed control, in each step is defined as the maximum check value of the previous step. The response in any step is considered to be the best if the check value is greater than the control value in that step.
In addition to gi constraints, in most problems, another set of specific constraints (gs) may also be needed so that a specific range of variables (a, b) could be defined, as follows

It should be noted that gs are not real term constraints, such as gi. They are only used to keep the variables within specified lower (a) and upper (b) limits. If gi or g s constraints become higher than 1 or lower than 0, the target function is penalized based on the following (Pezeshk et al., 2000)

The general procedure for the proposed CCM is as follows:
Determine the target function (F); the number of variables, n; and the problem constraints, gi and gs. Define the ITR value for gradual change of the variables and set the r value (r = 1 for minimization and r = –1 for maximization).
As the start, assign values for different variables, Xi, such that gi constraints are small. Calculate gi and gs.
Evaluate F and calculate Z(X) and Z from equations (2) and (4).
Set XOPT, Z0 and g0 equal to X, Z and g, respectively, and set the analysis number, NA = 1.
Set variable counter j = 0
6. j =j + 1, set X equal to XOPT.
Evaluate X(j) = X(j) − r*ITR and calculate gi and gs, F, Z(X) and Z, then NA = NA + 1.
Calculate check(i) from equation (1).
If check(i) > control, set XOPT, Z0 and g0 equal to X, Z and gi, respectively, and repeat stage 7; otherwise, go to the next step.
If j < n, repeat stage 6; otherwise, calculate control from equation (1).
If control ≥ 0, repeat stage 5; otherwise, terminate the algorithm.
PBD
In the performance-based seismic design of structures, the main objective is to design the structure such that its performance is predictable under certain risk levels. In PBD, in addition to strength, other seismic performance parameters, such as ductility, stiffness and drift, have a profound effect on the performance of the structure. In order to predict the performance of a structure (or structural component) subjected to a certain demand earthquake, its capacity curve should first be established. There are different methods of determining the capacity curve of a system, including nonlinear static (pushover), cyclic or time-history dynamic loading analyses. The pushover analysis method is a practical method which, while being relatively simple, reasonably accurately estimates the seismic performance parameters of the structure and its components, such as ductility, behaviour factor and toughness and can easily be utilized in optimization algorithms.
To determine the capacity curve using the nonlinear static pushover analysis, monotonically increasing forces are applied to a nonlinear numerical model of the structure until the displacement of the control node exceeds the target displacement (force-controlled method); alternatively, monotonically increasing displacements are applied up to the target displacement (displacement-controlled method). In this work, displacement-controlled method is utilized, using the displacement distribution pattern for the fundamental mode, given by FEMA-356 [23], which is suitable for low-rise to medium-rise buildings.
The NEHRP guidelines (1997) indicate that, for a specific earthquake, the building should have enough capacity to withstand a specified roof displacement. This is called the target displacement and is defined as an estimate of the likely building roof displacement in the design earthquake. The guidelines give the following expression to estimate the target displacement, Δ t

where the modification factors C0, C1, C2 and C3 relate, respectively, the spectral displacement and expected maximum elastic displacement at the roof level; the expected maximum inelastic displacements to displacements calculated for linear elastic response; the effects of stiffness degradation, strength deterioration and pinching on the maximum displacement response and the increased displacements due to dynamic second-order effects. Also, Te represents the effective fundamental period of the building in the direction under consideration, calculated using the secant stiffness at a base shear force equal to 60% of the yield force, and Sa is the response spectrum acceleration at the effective fundamental period and damping ratio of the building. The factors C1, C2 and C3 serve to modify the relation between the mean elastic and the mean inelastic displacements (FEMA-356, 2000).
Figure 2 presents global displacement capacities for a number of performance levels. The expected performance levels, generally considered for a building, include (a) operational performance (OP) level, in which it is predicted that the nonstructural components are minimally damaged due to the earthquake so that the building service is constantly carried out; (b) immediate occupancy (IO) performance level, in which the post-earthquake structure retains the pre-earthquake design strength and stiffness and is safe to occupy; (c) life safety (LS) performance level, in which the building will retain at least some of its strength against collapse and should prevent loss of human life; and (d) collapse prevention (CP) performance level, in which the building is expected to experience damage to structural components that weaken it so that it retains little or no lateral resistance against collapse either in part or in full.

Global displacement capacities for different performance levels.
The proposed CCM for optimum PBD
The objective is to decrease structural weight, W(X), in accordance with equation (6), subject to satisfying the constraints,


where X is the design vector, Xi are design groups, ng is the total number of design groups, nm is the total number of members in each design group, ρi is the member-specific weight, Ai is the member cross-sectional area, Lj is the member length and nc is the number of constraints. The weight of each design is penalized (WST), according to equation (8)

In this study, design groups are selected from W-shape steel sections of American Institute of Steel Construction (AISC) table and sorted based on weight per unit length (G) such that the first section is the heaviest and the last section is the lightest.
The general procedure for CCM is to start from the heaviest design associated with the smallest constraint ratios (CRs) (least violating the constraints), and step by step finding a design with the smallest increases in the CRs and the largest reduction in structural weight compared to the design in the previous step. To achieve this, as it was stated in section ‘The general CCM of optimization’, the algorithm is based on two parameters: ‘check’ and ‘control’. In each step, j, and for every design group, i, check(i) is defined as follows

where WST(j) is the penalized structural weight in step j; WOPT is the structural weight of the best solution up to step, j − 1; MCR(k) is the maximum CR within each design group for constraint k; and MCRL(k) is the maximum CR within each design group associated with the best solution up to step, j − 1. The CR is defined as the ratio of any constraint value to the maximum allowable value for that constraint. The control parameter is used to control the check parameter to ensure that a design with the smallest increase in the CRs and the largest reduction in weight is selected. It is defined as the maximum check parameter for all design groups, that is

Since at the start of algorithm, parameter check(i) cannot be evaluated, control parameter is initially set to a large value.
Different steps in the proposed CCM for optimum PBD are as follows:
1. A large number is assigned as the initial value for the control parameter (control = Inf).
2. The largest design variables (the largest W-shaped section permitted for a design group) are assigned to members in all groups. This design is termed X.
3. The structure is then analysed, CRs evaluated and for every constraint, k, the maximum value of CRs,

4. In this stage, to find a new X, one design group from within ng groups of XOPT is randomly selected and for the members of that group a new, smaller, section from the allowed list of W-shaped sections is assigned. Repeat this for all design groups. At any round, the selected design groups in the previous rounds are not selected again. For each design group, repeat stages 5 and 6 and then move to stage 7.
5. In this stage, the structure is analysed and new WST and MCR are calculated using equations (8) and (11), respectively. The
6. If
7. In this stage, the control value is calculated according to equation (10). The solution goes back to stage 4 and it continues until the control = 0. The last XOPT and WOPT are the optimum design and its associated structural weight, respectively.
As it can be noted, this method directs the solution towards the final answer by controlling constraints, or by decreasing the structural weight through small increases in stress and performance level drift ratio towards their limits. Figure 3 presents the flowchart of the algorithm in details.

Flowchart of the proposed CCM algorithm for optimum PBD.
In this study, two sets of constraints are defined for the CCM. The first set (CRs) includes the stress constraints for members undergoing axial force and bending moments due to gravity loads, based on the AISC-LRFD specifications (AISC, 2001) and specified according to equation (12)

In equation (12), Pu is the required axial force and Pn is the nominal axial capacity. Also, Mnx and Mny are nominal bending capacity in x and y directions, Muy and Mux are factored bending moment in x and y directions,
The second set of constraints (CRd) is related to the lateral seismic loading in the form of relative lateral storey displacements (relative drift) at different OP, IO, LS and CP performance levels. In order to calculate the relative drift, the pushover capacity curve for the frame, corresponding to the roof level, is evaluated and used to estimate the storey relative drift (storey = 1, 2, …, ns) for different performance levels (i = OP, IO, LS, CP),

The allowable relative drift values,
Design examples
In order to investigate the efficiency of the proposed constrain control method (CCM) for performance-based optimum design of frames, three two-dimensional (2D) benchmark steel sway frames were selected. These include a three-storey, four-bay frame; a nine-storey, five-bay frame, first PBD by Gupta and Krawinkler (1999) and later optimized by Kaveh et al. (2010) using ACO and GA metaheuristic methods; and a six-storey, three-bay frame, PBD by Gholizadeh et al. (2013).
In the first two benchmark problems evaluated by Kaveh et al. (2010), the expected yield strength of steel material used for column members was taken as
The spectral acceleration, Sa, is calculated for four performance levels of OP, IO, LS and CP corresponding, respectively, to risk levels of 50%, 20%, 10% and 2% probability in 50 years, using the guideline given in FEMA-356 (2000), as is presented in equation (14)

where T is the elastic fundamental period of structure and

Also,
Performance level site parameters.

OP: operational; IO: immediate occupancy; LS: life safety; CP: collapse prevention.
Three-storey, four-bay frame
The geometry, grouping of components and applied loads of this benchmark problem are presented in Figure 4. The applied gravity load on the beams in the first and second stories is taken as follows: W1 = 2.2 kip/ft and in the top floor is considered to be W2 = 1.97 kip/ft. The total seismic weight considered for evaluating the seismic load in the first and second stories is 1054 kips and in the top floor is 1140 kips (Kaveh et al., 2010).

Geometry, element groups and loading details of the three-storey, four-bay frame (Kaveh et al., 2010).
Table 2 presents details of the best design obtained using the proposed CCM. Also listed in Table 2 are the details of the best designs obtained for this frame using the GA and ACO metaheuristic optimization algorithms reported previously by Kaveh et al. (2010). This table shows that the proposed CCM has produced the lightest design, weighing 61.2 kips, which improves on best design using the GA by 10.4% and using the ACO by 3.87%. The total number of analyses performed using the proposed CCM is also compared with those of the two metaheuristic algorithms in Table 2. It can be noted that with only 215 analyses, the CCM is remarkably faster than the GA (6800 analyses) and ACO (3900 analyses). The convergence history of the best design obtained from the proposed CCM solution is compared with that from the ACO method (as the better of the two metaheuristic algorithms) in Figure 5. The speed of convergence of the proposed CCM solution relative to the ACO algorithm is clearly evident in this figure.
Comparison of optimum performance-based designs for the three-storey, four-bay frame.

ACO: ant colony optimizations; GA: genetic algorithm; CCM: constraint control method.

Weight versus number of analyses for the three-storey, four-bay frame.
Figure 6 shows the elements stress ratios in the proposed CCM optimized design. It is noted that the stress constraint is well satisfied in the optimum design. It should also be noted that, although an optimum design should correspond to CRs nearing unity, in this example, the second constraint (PBD) appears to dominate the solution as the stress ratios are below 0.5. This can be seen in Figure 7, in which relative drifts of different stories of the CCM optimum design in OP, IO, LS and CP performance levels are depicted. The relative storey drifts for the OP performance level have approached their specified limits of 0.4%, corresponding to a CR of 1. It can also be observed in this figure that for the CCM optimum design, all drifts are in the allowed range in all stories and for all performance levels. Formation of plastic hinges and relative drifts for different performance levels are also presented graphically in Figure 8. In the optimized structure, the maximum drift CRs for different performance levels, OP, IO, LS and CP, are 1.00, 0.87, 0.28 and 0.19, respectively, and the maximum stress CR is 0.47. It is evident that in this problem, the drift constraint for performance level OP dominates the optimum solution.

The stress ratio for elements of the four-bay, three-storey frame problem.
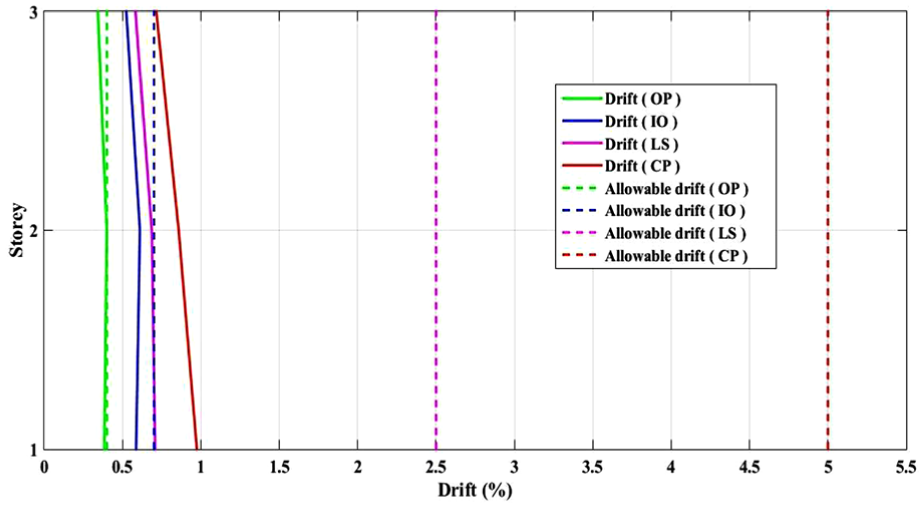
Drift for different performance levels in the three-storey, four-bay frame.

Plastic hinge formation at different performance levels of the three-storey, four-bay frame: (a) OP, (b) IO, (c) LS and (d) CP.
Nine-storey, five-bay frame
Figure 9 shows the geometry, grouping of components and applied loads of the second selected benchmark problem. Similar to the first problem, the applied gravity load on the beams in the first and second stories is taken as follows: W1 = 2.2 kip/ft and in the top floor is considered to be W2 = 1.97 kip/ft. The total seismic weight considered for evaluating the seismic load in the first storey is 1111 kips and for the second to eighth stories is 1092 kips and for the top (roof) storey is 1176 kips (Kaveh et al., 2010).

Geometry, element groups and loading details of the nine-storey, five-bay frame.
In Table 3, details of the best design obtained using the proposed CCM are presented. Also listed in Table 3 are the details of the best designs obtained for this frame using the GA and ACO metaheuristic optimization algorithms reported previously by Kaveh et al. (2010). It can be seen that, similar to the first problem, the proposed CCM has obtained the lightest design. It weighs 323.71 kips, which is 7.22% lighter than the ACO design and 12.75% lighter that the GA method. Also, in Table 3, the total number of analyses performed using the proposed CCM is compared with those of the two metaheuristic algorithms which shows that, with 465 analyses, the CCM is much faster than the GA (11,500 analyses) and ACO (7000 analyses). The convergence history of the best design obtained from the proposed CCM solution is compared with that from the ACO method in Figure 10. The speed of convergence of the proposed CCM solution compared to the ACO algorithm is evident in this figure.
Comparison of optimum performance-based designs for the nine-storey, five-bay frame.

ACO: ant colony optimizations; GA: genetic algorithm; CCM: constraint control method.

Weight versus number of analyses for the nine-storey, five-bay frame.
The elements stress ratios in the proposed CCM optimized design for this problem are plotted in Figure 11. It can be noted that the stress CRs are satisfied, as they are below unity. As it was stated for the first benchmark problem, the reason that the values of this CR are not nearer to unity (they are below 0.6) is that the PBD constraint has again dominated the optimum design process. This can be deduced from Figure 12, in which relative drifts of different stories of the CCM optimum design in OP, IO, LS and CP performance levels are plotted. The relative storey drifts for the OP performance level are all close to their specified limit of 0.4%. Also, all drifts are in the allowed range in all stories and for all performance levels, indicating that this constraint has been satisfied in the optimum design. Formation of plastic hinges and relative drifts for different performance levels are also presented graphically in Figure 13. In the optimum design, the maximum drift CRs for different performance levels, OP, IO, LS and CP, are 1.00, 0.87, 0.30 and 0.28, respectively, and the maximum stress CR is 0.59. It can be noted that in this problem also the drift constraint for performance level OP dominates the optimum solution.

The stress ratio for elements of the nine-storey, five-bay frame.

Drift for different performance levels in the nine-storey, five-bay frame.

Plastic hinge formation at different performance levels of the nine-storey, five-bay frame: (a) OP, (b) IO, (c) LS and (d) CP.
Six-storey, three-bay frame
The geometry and grouping of components of this benchmark problem are shown in Figure 14. The material properties and loading for this problem were given at the start of this section. Table 4 presents details of the best design obtained using the proposed CCM. Also listed in Table 4 are the details of the best designs obtained for this frame using a number of metaheuristic algorithms including GA, ACO, HS and PSO, as reported previously by Gholizadeh et al. (2013). It can be noted that the proposed CCM has produced a design, weighing 25,580 kg, which is lighter than the GA design by 6%, slightly heavier than designs by ACO and HS (1.4% and 2.2%, respectively) and heavier than the PSO design by 7.8%. However, the total number of analyses performed using the proposed CCM (450 analyses) is only a fraction of those needed for the four metaheuristic optimization methods, which range between 6850 and 8600. The convergence histories of the best design obtained from the proposed CCM solution and the ACO method (as the best of the metaheuristic algorithms) are compared in Figure 15, indicating the remarkable speed of convergence of the proposed method.

Geometry, element groups and loading details of the six-storey, three-bay frame.
Comparison of optimum performance-based designs for the six-storey, three-bay frame.

GA: genetic algorithm; ACO: ant colony optimizations; HS: harmony search; PSO: particle swamp optimization; CCM: constraint control method.

Weight versus number of analyses for the six-storey, three-bay frame.
Figure 16 shows the elements stress ratios for the CCM optimum design. It can be seen that in the optimum design, the stress constraint is satisfied in all structural elements. It should also be noted that, unlike the other two benchmark problems, in this example, the stress constrain ratio for a number of elements are close to 1. This indicates that both constraints (stress and PBD) equally affect the optimization process. In Figure 17, relative drifts of different stories of the CCM optimum design in IO, LS and CP performance levels are plotted. The relative storey drifts for the IO performance level in some stories are close to their specified limits of 0.7%, which correspond to a CR of 1. Figure 17 also shows that all PBD constraints have been satisfied in the optimum design. Formation of plastic hinges and relative drifts for different performance levels are also presented graphically in Figure 18. In the optimized structure, the maximum drift CRs for different performance levels, IO, LS and CP, are 1.00, 0.32 and 0.22, respectively, and the maximum stress CR is 0.92. It is noted that in this problem, although the drift constraint for performance level OP still dominates the optimum solution, the stress constraint is also very close to its limit state.

The stress ratio for elements of the six-storey, three-bay frame.

Drift for different performance levels in the six-storey, three-bay frame.

Plastic hinge formation at different performance levels of the six-storey, three-bay frame: (a) OP, (b) IO, (c) LS and (d) CP.
Conclusion
A simple algorithm, termed the CCM, was developed and presented, based on conventional engineering design philosophy, whereby optimum design is achieved gradually by controlling the problem constraints. The performance of the proposed algorithm was evaluated through comparing its optimum designs for three, 2D steel frame benchmark problems with results from some metaheuristic optimization solutions to these problems, previously reported by other investigators. These comparisons lead to the following conclusions:
In all benchmark problems, the proposed CCM leads to a design lighter than the reported metaheuristic optimization solutions, except in the last example (six-storey, three-bay frame) in which it was marginally heavier than the ACO and HS solutions and 7.6% heavier than PSO design.
The main advantage of the simple CCM, compared to other optimization algorithms, is in its remarkable solution speed, requiring only a fraction of the number of structural analyses to reach the optimum solution, compared to all the metaheuristic algorithms. This method is particularly suitable for performance-based seismic design optimization, as each analysis is very time-consuming.
In all three benchmark problems, it appeared that the drift constraint related to the PBD somewhat dominates the forced-based stress constraint, as the latter CRs barely reached unity.
Footnotes
Declaration of Conflicting Interests
The author(s) declared no potential conflicts of interest with respect to the research, authorship and/or publication of this article.
Funding
The author(s) received no financial support for the research, authorship and/or publication of this article.
