




Abstract
Glulam moment-resisting joint composed of inclined self-tapping screws with steel side plates were designed and its nonlinear moment-rotational skeleton curve was predicted by taking nonlinear load (P)–deformation (u) relationships of all moment-resisting components into considerations within step-wise linear calculation process. P-u relationships of all moment-resisting components were estimated by the fundamental shear joint tests or appropriate empirical relationships, and they were approximated by the tetra polygonal line curves or bi-linear curves. The extended Normalized Characteristic Loop model, which was originally developed for reinforced concrete construction, was applied to describe the hysteresis loops. For predicting failure load, the design equations for a mechanical joint loaded with inclination to the grain direction were applied. Three replications of T-shaped beam-column joint specimens were fabricated using Canadian spruce glulam beam and column. Connections of steel plates to glulam members were all composed of full-threaded inclined self-tapping screws. Static push-pull cyclic loading tests were conducted and observed behaviors were compared with step-wise linear analytical results. Agreements between predicted nonlinear behaviors and observed ones were good on the whole.
Keywords
Introduction
Glulam moment-resisting joint
Moment-resisting joint (MRJ) is now popular for constructing glulam portal frame structures. Although the first effective connecting method for glulam portal frames were nails with steel gusset plates (Buchanan and Fairweather, 1993; Komatsu, 2017), driftpins with insert steel gusset plates were preferably used in Japan due to its aesthetic outlook and better fire endurance performance (Komatsu, 2017; Komatsu et al., 1991). In addition to these conventional connection methods, glued-in-rod (GIR) connection (Riberholt, 1986) also became popular (Buchanan and Fairweather, 1993). Due to its excellent structural, aesthetic and fire-endurance performances, GIR connection became one of the most popular methods for constructing glulam constructions in the world.
Engineered use of self-tapping screw
Use of self-tapping screw (STS) is a new trend in recent research field on timber engineering. There are two different roles for the use of STS. Blaß and Schmid (2001), Blaß and Bejtka (2004), and Bejtka and Blaß (2005, 2006) proposed a lot of practical methods for reinforcing weak points of timber using STS. Another interesting use of STS is to utilize its higher stiffness and strength performance of “inclined tensile shear joint.” This excellent performance was first reported by Blaß and Bejtka (2001), Bejtka and Blaß (2002) and Kevarinmäki (2002). After these pioneering researches, extensive researches on timber-to-timber tensile shear joint performances have been published up to today (Brandner et al., 2018; Frese and Blaß, 2009; Girhammar et al., 2017; Jockwer et al., 2014; Pirnbacher et al., 2009; Ringhofer et al., 2015; Tomasi et al., 2010). Research, however, on the performance of timber-to-steel inclined STS joint was, so far as we know, only one given by Krenn and Schickhofer (2009).
Research purpose
In our study, we paid our attention to the excellent performance of timber-to-steel inclined STS joint with referring to the previous researches (Bejtka and Blaß, 2002; Kevarinmäki, 2002; Krenn and Schickhofer, 2009). We expected the tensile inclined STS to play a role as the tensile-resisting component for the glulam beam-column MRJ. While for the compressive-resisting component, we expected the contributions from the compressive inclined STS joint and the contact of glulam on the steel base plate. Consequently, the main purpose of this study is to verify the analytical procedures applied to the glulam beam-column MRJ specimens whose joint performances were not only largely different between the tensile side and compressive side of the beam member but also having large nonlinearities. We used three replications of the glulam beam-column MRJ specimens in this study.
Descriptions of the MRJ developed in this article
Figure 1 shows a perspective view of the MRJ beam-column joint designed in this study. For the beam-side joint, referring to the results of Krenn and Schickhofer (2009), 45° inclined STS joints with steel side plates were used for resisting against moment. A large cross-sectional steel dowel was employed for resisting against the shear force in the beam member.
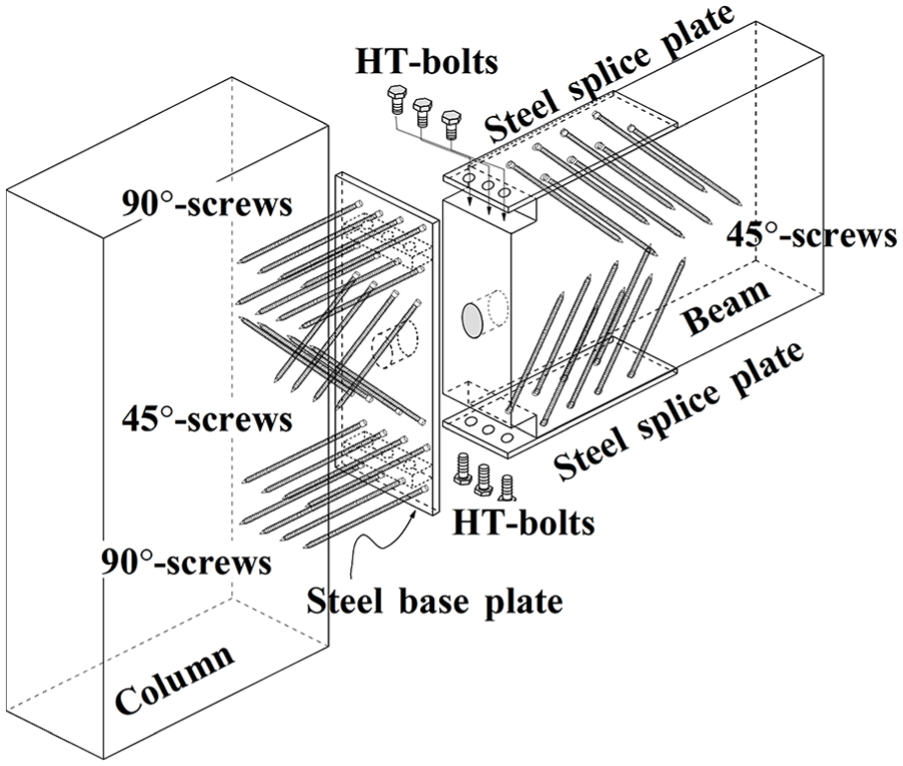
Perspective view of glulam beam-column MRJ designed in this study.
For the column-side joint, ordinary 90° STS joints were used for resisting against moment because they can take the maximum pull-out value at 90° (EC-5, 2008; Hübner et al., 2010). While at the middle of column-side joint, 45° inclined X-shape STS were used for resisting against the shear force in the column member. We considered the following moment-resisting components such as the tensile and compressive forces due to the inclined STS joints, contact force of beam end-grain surface to the steel base plate and that of column side-grain surface to the steel base plate.
Experiments
Configuration of beam-column joint
Figure 2 shows the configuration of beam (120 mm × 362 mm) to column (180 mm × 360 mm) joint designed in this study. This configuration was determined mainly considering the size of STS available. For the steel plates composing Π-shaped jig, SS400 steel plates of 10 mm thickness were used. For the connecting parts between splice plate and base plate, SS400 steel plates of 12 mm thickness were used and they were welded to each other with the right angle. Over-size of all lead holes for the STS was 1 mm. Connections between steel plates were done using M16 High Tension (HT) bolts by introducing torque of 300 Nm, in accordance with manufacturer’s instruction (Nippon Steel Bolten Corporation, 2019).

Configuration of beam-column joint used in this research (unit: mm).
Materials
Glulam
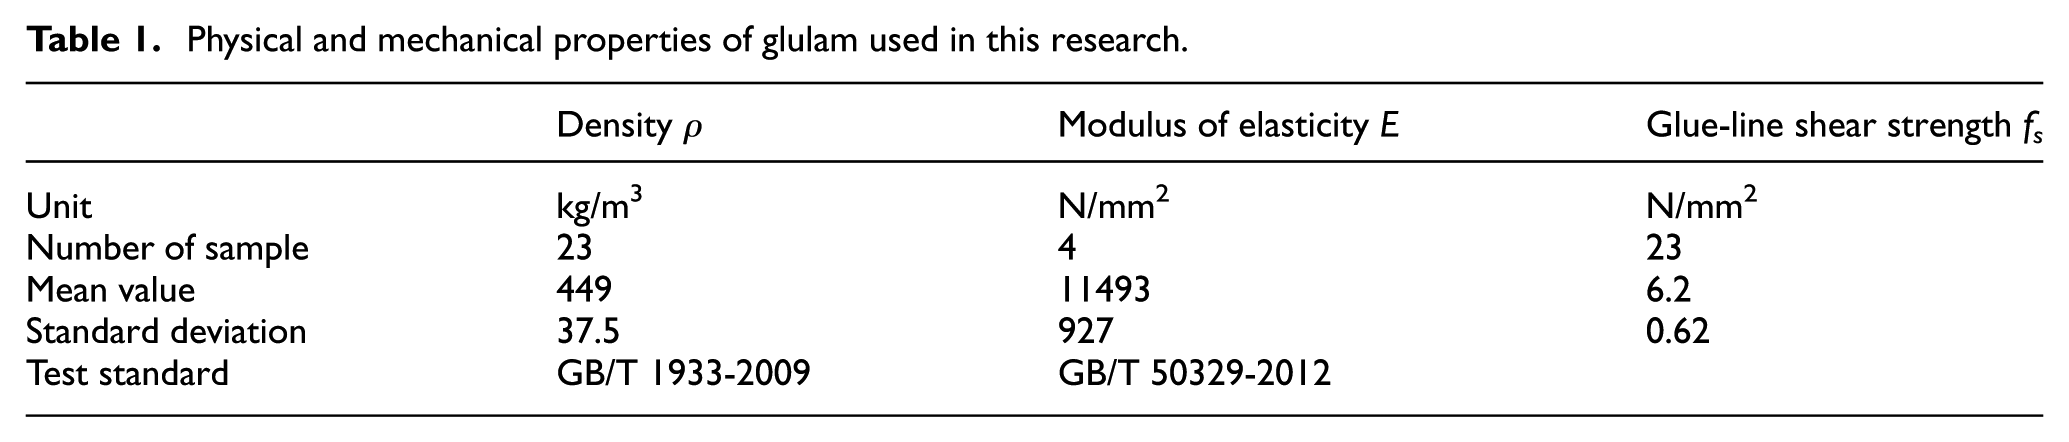
Glulam used in this study was produced in a Chinese glulam company in accordance with Chinese production standard (GB/T 26899-2011, 2011) using imported Canadian spruce (Piceag lauca (Moench) Voss) lamina. The category of the glulam was the “same-grade composition” structural glulam (GB/T 26899-2011, 2011). Physical and mechanical properties of glulam used are shown in Table 1. All these values were measured by the authors.
Physical and mechanical properties of glulam used in this research.
Screw
In this study, STS made of carbon steel, which is electrogalvanized with trivalent chromium, having 1000 kN/mm2 of yielding strength (Rothoblaas SRL, 2019), was used. Figure 3 shows the profiles of the STS used in this study.
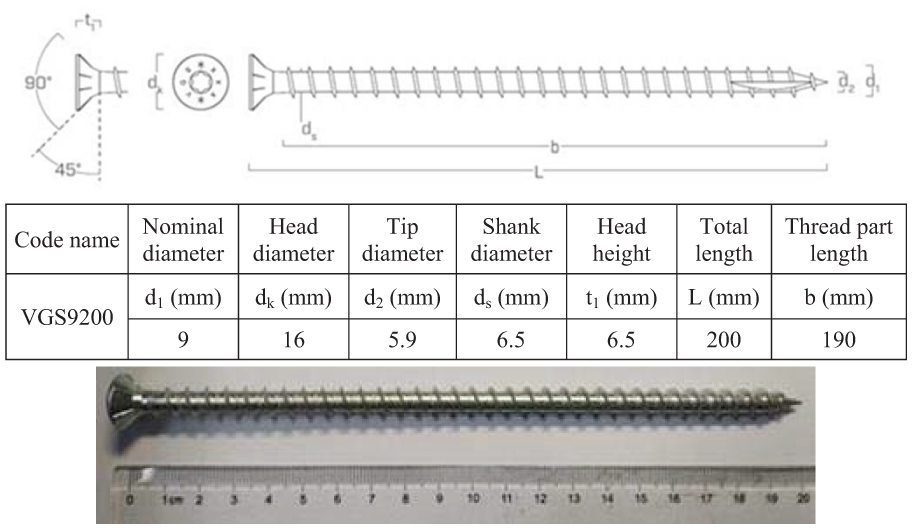
Full-threaded STS used in this study (Rothoblaas SRL, 2019).
Beam-column joint test
Test set-up
Figure 4 shows the test set-up of the beam-column joint specimen and locations of deflection measuring device (AD1 to AD3 and RD1 to RD5). The aims of each deflection measuring devices were explained in Figure 4. Horizontal load was applied by an oil jack having a maximum capacity of 250 kN and a maximum stroke of 500 mm. Movement of oil jack was controlled automatically in accordance with an assigned loading protocol shown in section “Loading protocol,” which was preliminarily inputted into the computer of the testing machine (YAW-250J).
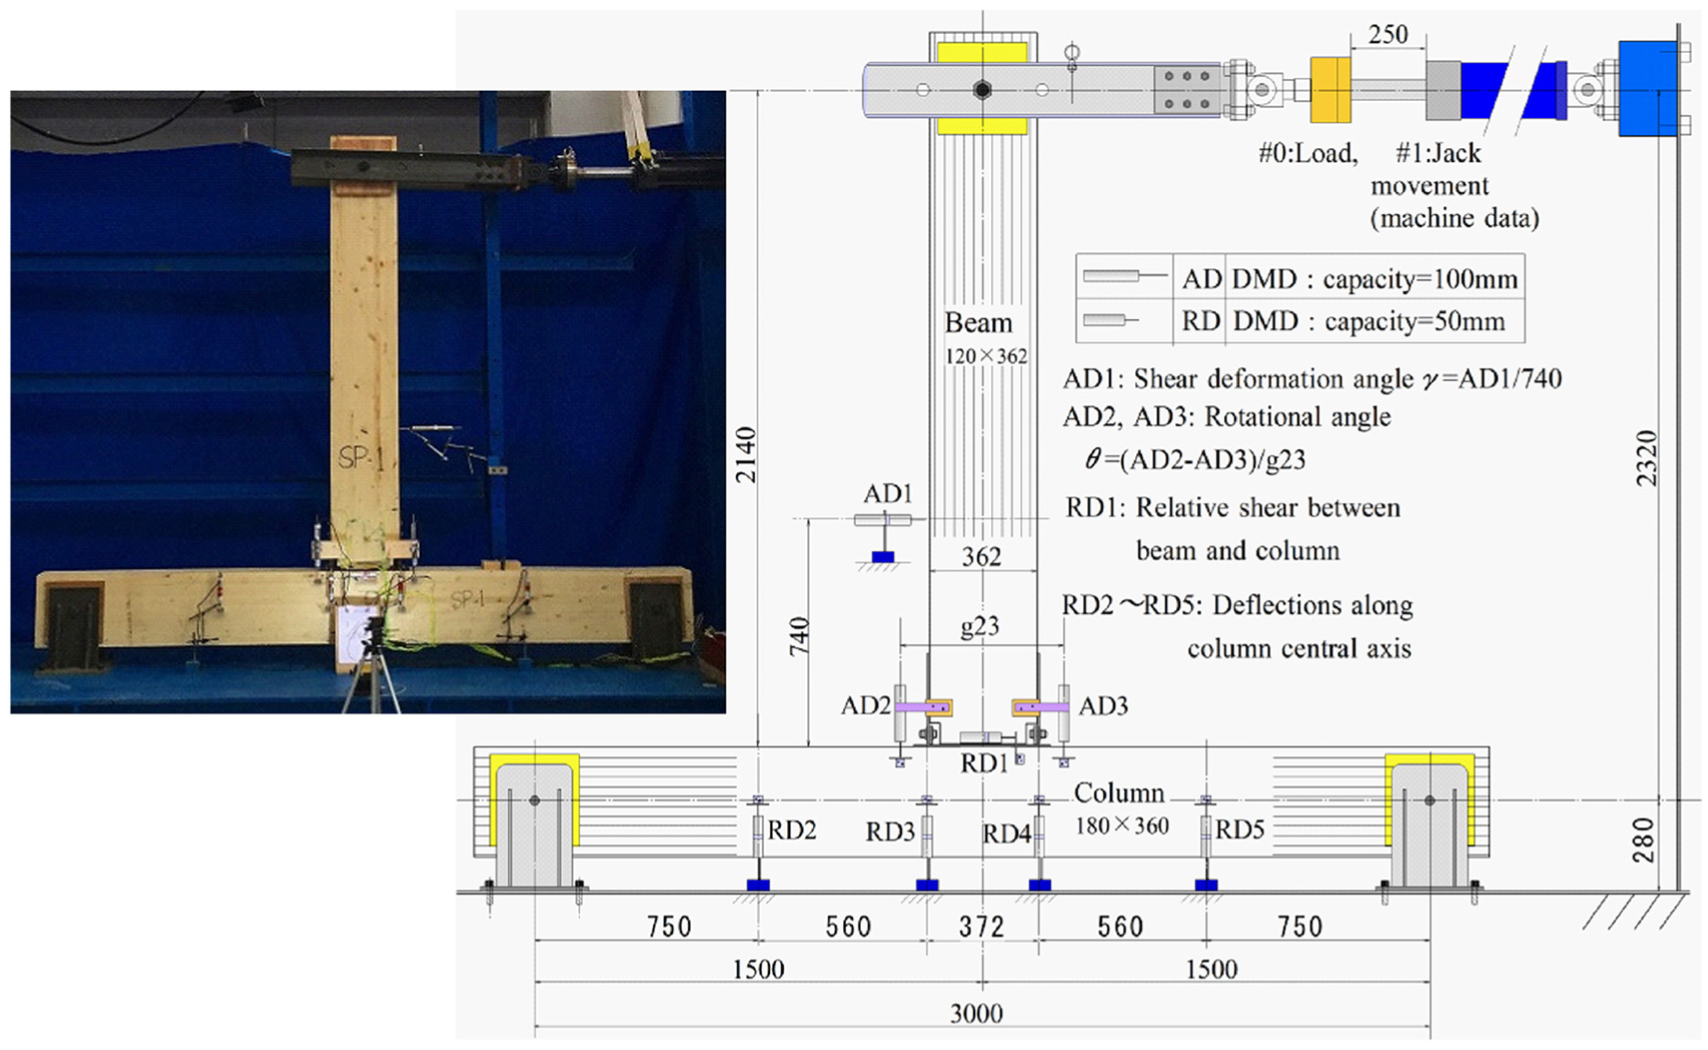
Test set-up and locations of measuring devices on beam-column joint specimen (unit: mm).
Loading protocol
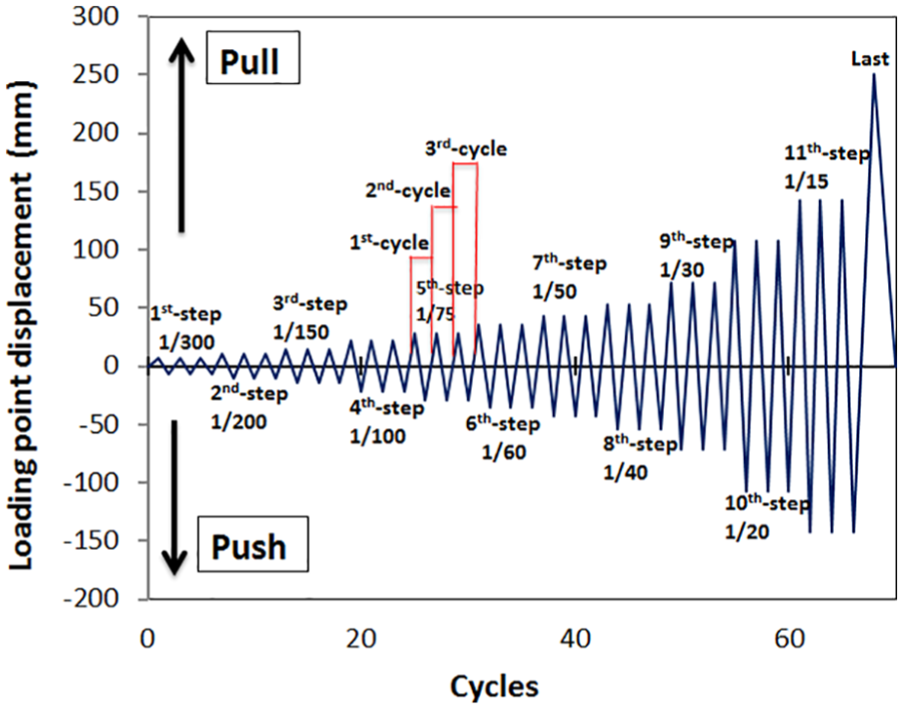
Pull-push cyclic load was applied statically in 11 incremental deformation steps with three repeated cycles in the same peak shear deformation angle (γ = δ/H) where δ was loading point displacement, H was distance between loading point and rotation point (2140 mm).
Figure 5 shows the loading protocol expressed by the loading point displacement (δ). At the last 12th step, after pull-load was applied until Pmax, loading was continued until it dropped lower than 80% of Pmax, afterwards oil jack was returned back to the neutral position. This loading protocol was refereed to that assigned by Japan Housing and Wood Technology Center (2008).
Loading protocol.
Fundamental joint test on STS
After the main experiments of the MRJ were finished, fundamental joint tests of STS were carried out using the same species of glulam, STS, and steel plates used in the main experiments. Figure 6(a) to (c) show the outline of the fundamental joint tests.

Fundamental joint test (unit: mm): (a) tensile shear joint test, (b) compressive shear joint test, and (c) withdrawal test (90°).
Fundamental shear joint test on inclined STS glulam-steel plate joint
One pair of symmetrically allocated 45° inclined STS was penetrated into glulam block through the 10 mm thick steel side plates having inclined lead holes with 1 mm over-size than the outer diameter of the STS as shown in the photo of Figure 6(a) and (b). Glulam block was fixed tightly to the steel base beam of the automatic electric testing machine (SUNSI–UTM5105: Max capacity of 150 kN) using eight high-strength steel rods. Pull load was given to the both steel side plates, so that a relatively stable shear loading condition was obtained. Load was measured by a load-cell (YBY-50 kN) put on the crosshead. Relative slip deformations between glulam and steel plates were measured using four deflection-measuring devices (YWC-100 mm) set at four corners of the test specimen. Load-slip relationships were recorded using a data logger (TDS-530). Crosshead speed was 2 mm/min for all tests. Three replications were provided for these shear joint tests, respectively.
Withdrawal test of STS Penetrated perpendicular to the grain of glulam
Withdrawal property of STS penetrated perpendicular to the grain of glulam was estimated using Canadian spruce glulam made in Japan at Research Institute for Sustainable Humanosphere (RISH), Kyoto University, Japan as shown in Figure 6(c) using a universal testing machine (INSTRON-100 kN). Load was measured by a load-cell (INSTRON-100 kN) and withdrawal deflection was measured using a pair of deflection measuring devices (CDPM-50 mm). The load-deflection relationship was recorded using a data logger (TDS-530). The penetrating depth of the STS was 95 mm (half of the full length: 190 mm). Five replications were provided and cross-head speed was 2 mm/min.
Analyses
Mechanical model
Assumption
In this study, following assumptions were set out:
It will be the better to consider the effect of stiffness of steel base plate into the mechanical model; however, such approach will be quite sophisticate and make it difficult to solve nonlinear behavior by step-wise linear calculation method; therefore, in this study, we selected an approximate mechanical model in which the steel base plate was assumed to behave like a rigid plate by neglecting its partial deflection as the “next best choice.”
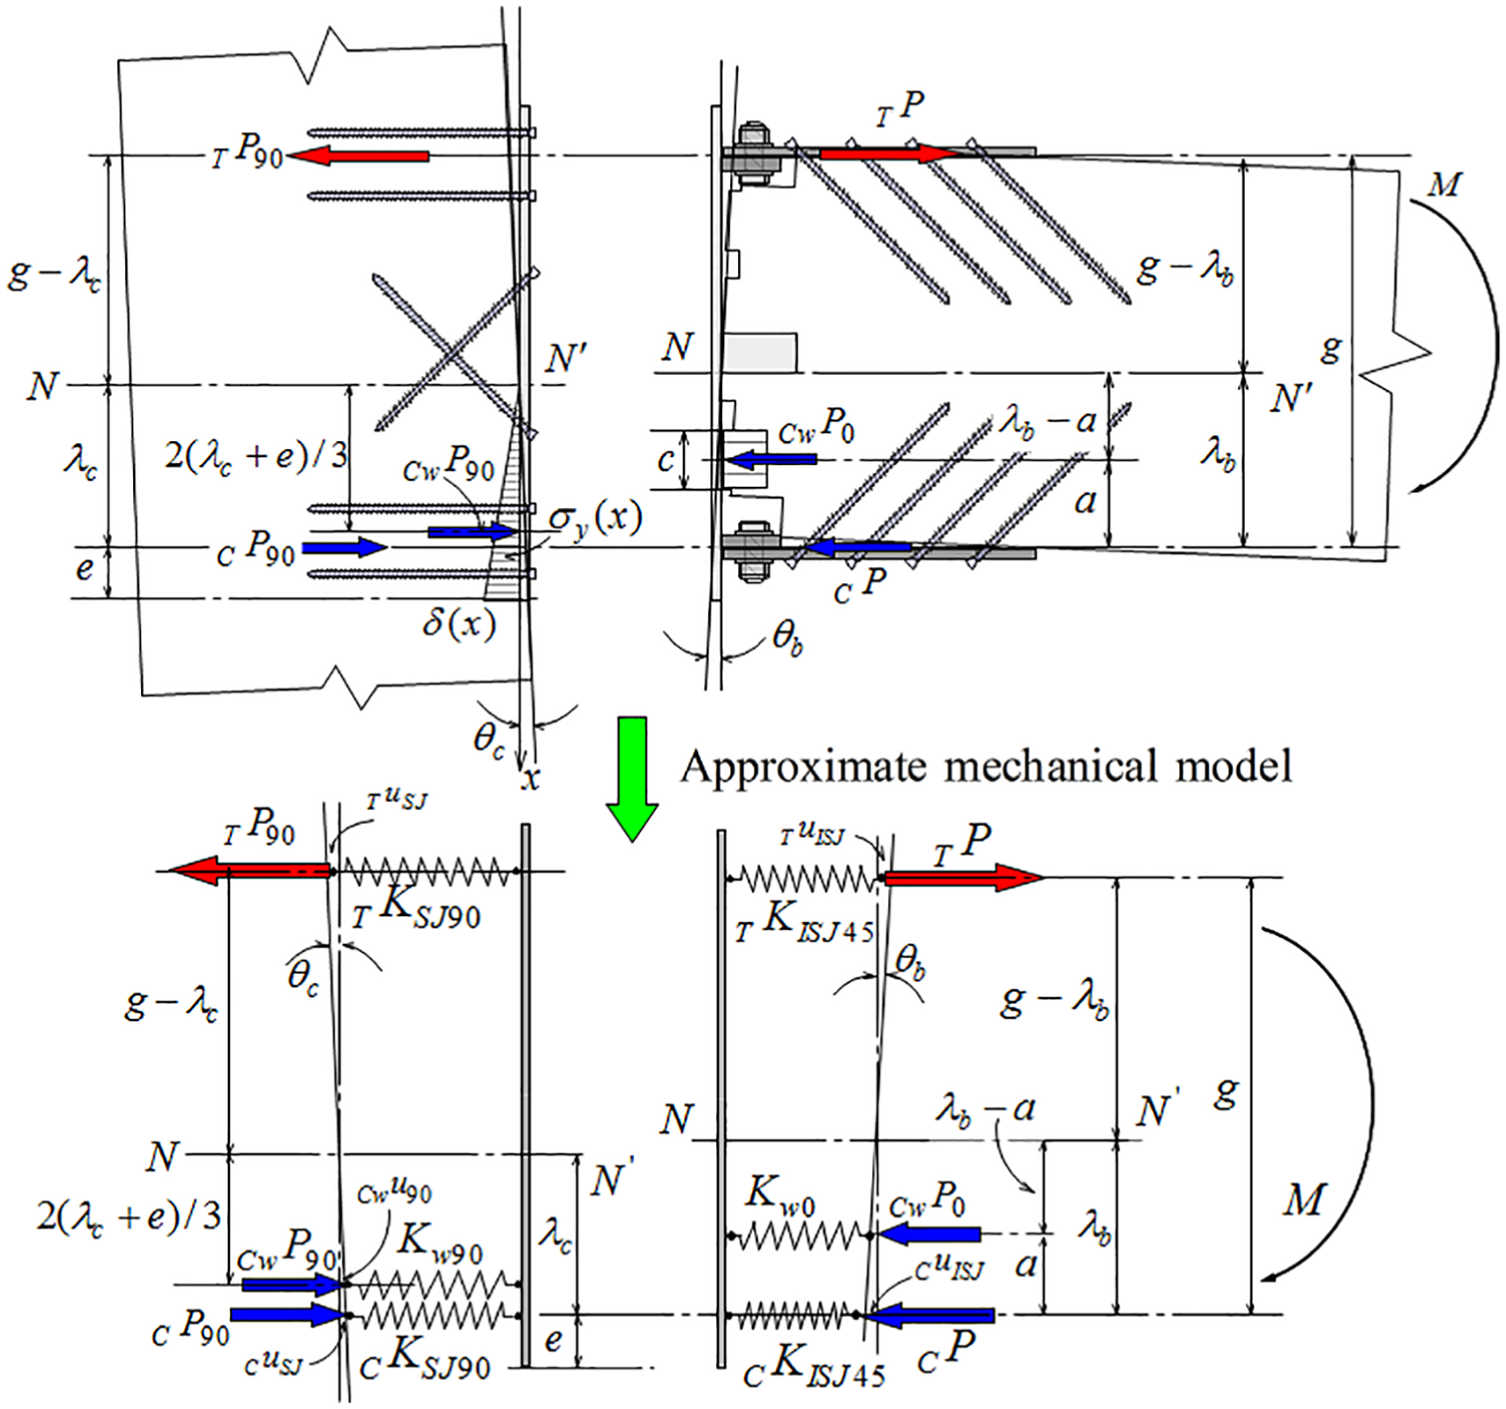
Judging from video observation on the experiments, contact at tensile and compressive sides of the end-grain surface of beam to the steel base plate (length “c” in Figure 7) can be assumed as “even contact,” and that at the middle part of beam-end can be neglected.
Contact of steel base plate to the side-grain surface of column can be assumed as “triangular rotational contact,” based on the preliminary analysis under the material constants and geometrical conditions given in this study.
Effect of X-shaped STS on the moment resistance can be neglected.
Mechanical model of beam-column joint.
Based on the above-mentioned assumption, a mechanical model of the beam-column joint was proposed as shown in Figure 7.
Location of the neutral axis at beam-side
The inclined screw groups inserting both in tensile and compressive sides have generalized Hooke’s laws shown in equations (1) and (2)


Relationships among the rotational angle, the distance from neutral axis to the axial forces, and the corresponding deformations are given in equations (3) and (4)


Substituting equations (3) and (4) into equations (1) and (2), we get equations (5) and (6)


The compressive stress at end-grain surface of the beam can be assumed to be proportional to the compressive deformation via special embedment constant as shown in equation (7)

The embedment coefficient of timber parallel to the grain

A resultant compressive force due to “even contact” assumption is estimated in equation (9)

The compressive resultant force, corresponding compressive deformation, and geometrical relationship for the “even contact” are consequently expressed in equation (10)

Taking the equilibrium equation among

Taking the equilibrium equation among the internal moments and external moment, we can obtain the rotational rigidity of beam-side joint as shown in equation (12)

Location of the neutral axis on column-side joint
STSs inserting perpendicular to the grain on both tensile and compressive side of the column member have generalized Hooke’s laws shown in equations (13) and (14)


The resultant compressive force corresponding to the “triangular rotational contact” is derived as shown in equation (15)

Embedment coefficient of timber perpendicular to the grain

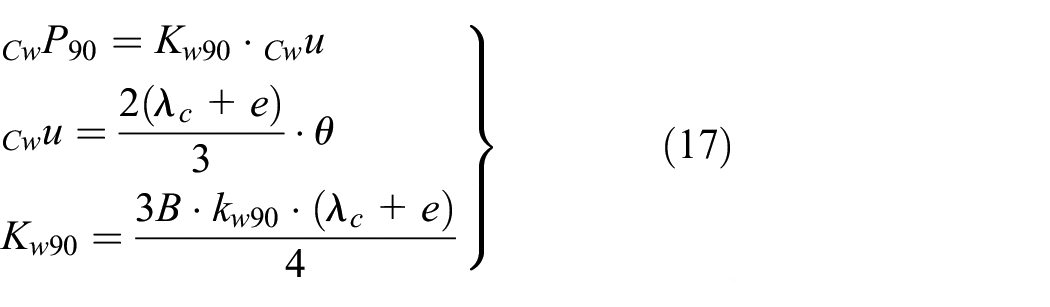
Consequently, Hooke’s law for the compressive resultant force and corresponding compressive deformation is expressed in equation (17)
Taking the equilibrium equation among

Taking the equilibrium equation between the internal moments and external moment, we can obtain the rotational rigidity of column-side joint as shown in equation (19)

Total rotational rigidity of beam-column joint
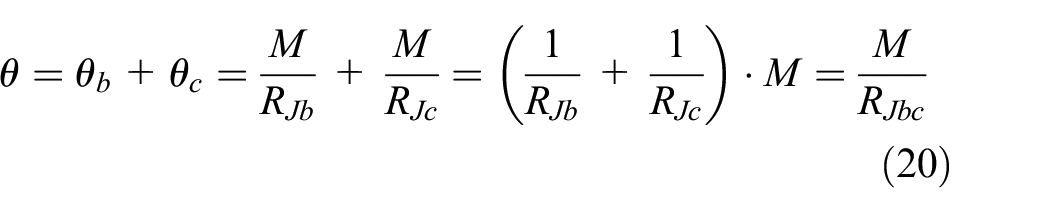
The total rotational angle between beam and column is a sum of the each rotational angle, hence

Hysteresis loop
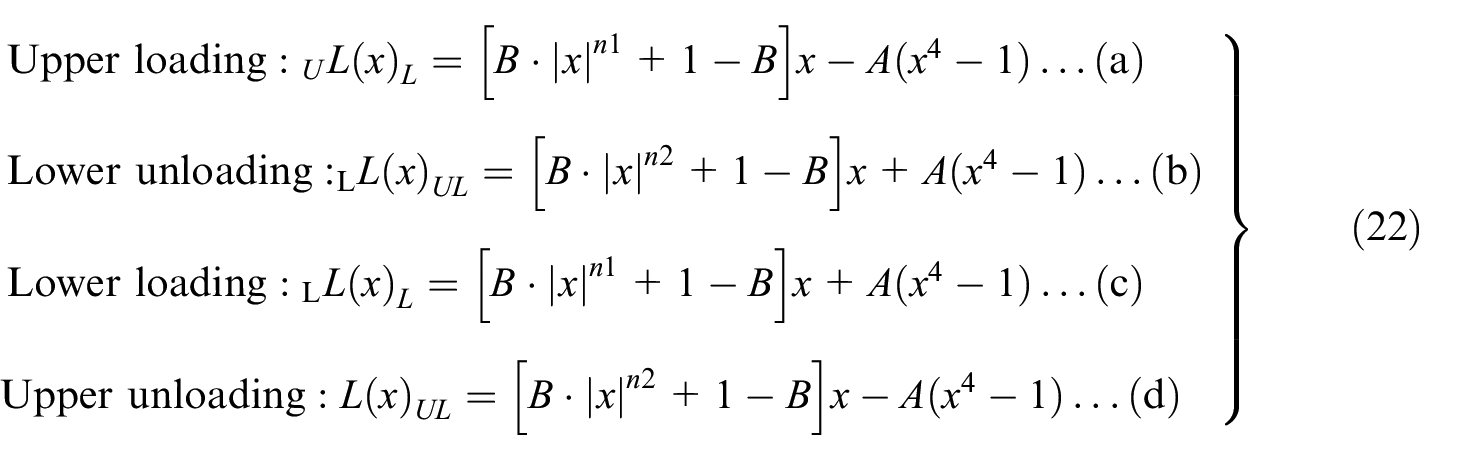
Hysteresis loops of MRJ specimens were approximated by the Normalized Characteristic Loop (NCL) model which was originally proposed by Tani et al. (1972) for expressing hysteresis loops of reinforce concrete structures. Recently, Matsunaga et al. (2009) extended NCL model successfully also to the wooden post and beam shear wall structures. They proposed the functions to be used in the extended NCL model as shown in equation (22)
where
Figure 8 shows examples of normalized loops described based on the rules of extended NCL model. Parameter “A” indicates the values of
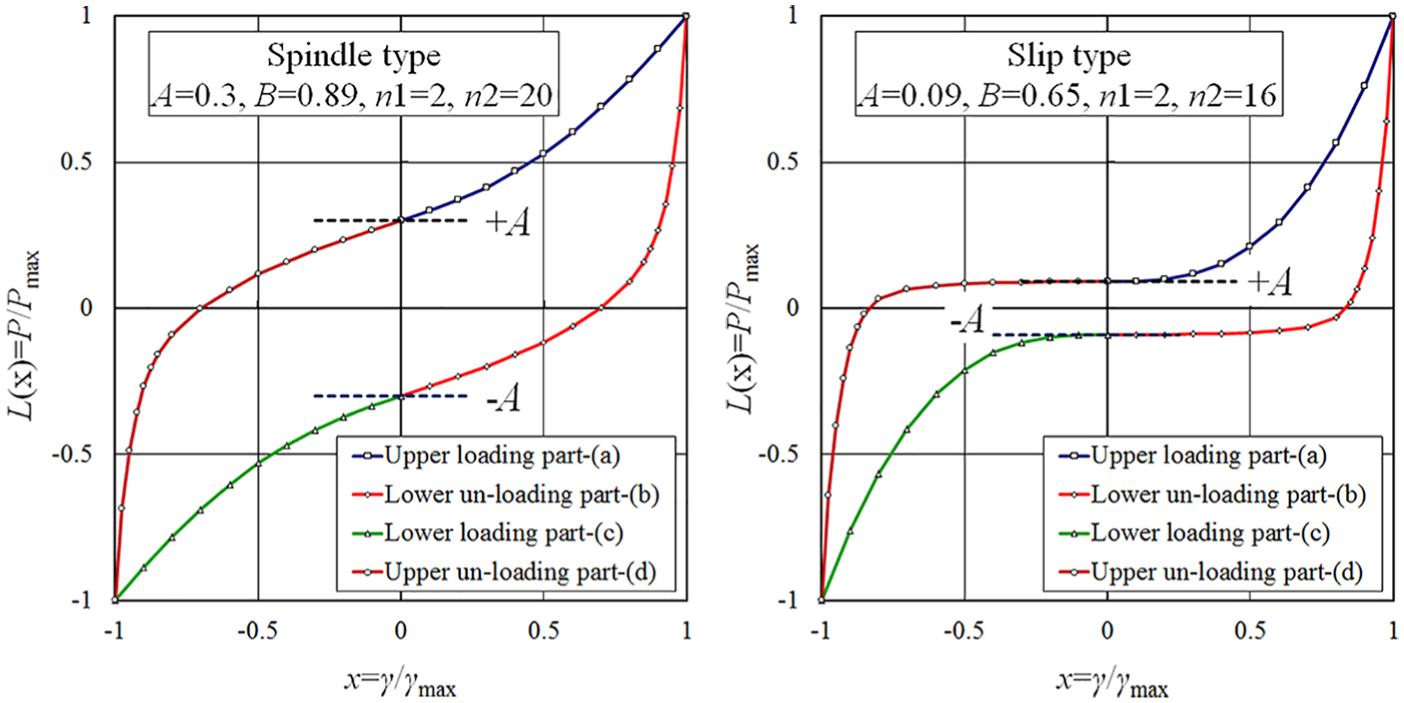
Typical loops drawn based on the rule of the extended NCL model.
Results and discussion
Results of fundamental joint tests
Figure 9(a) and (b) show the results of fundamental shear joint tests on the inclined STS joint, and Figure 9(c) shows the results of withdrawal test of STS penetrated perpendicular to the grain of glulam.
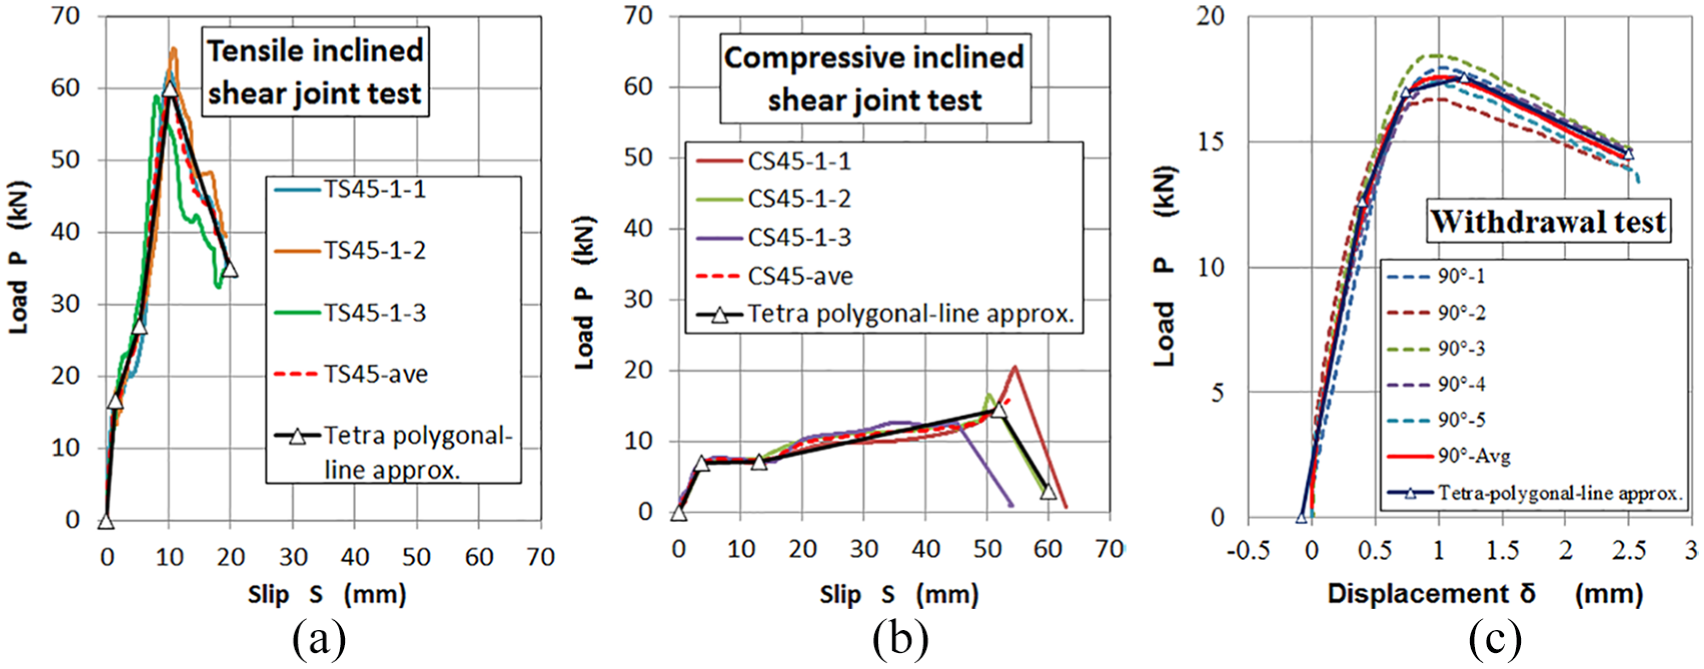
Results of fundamental joint test and tetra polygonal line fitting situations: (a) results of tensile inclined shear joint test, (b) results of compressive inclined shear joint test, and (c) results of withdrawal test.
Figure 10(a) and (b) show the failure modes of tensile shear joint and compressive shear joint, respectively. From Figures 9(a) and 10(a), it is clear that STS did not deform so much and was likely to be pulled out relatively smoothly in the case of tensile shear joint. The first slightly crooked point at about 17 kN in Figure 9(a) might correspond to a small-scale bending at about 1/3–1/4 point of shank from the screw head, afterwards monotonic pullout was likely to be kept until the maximum load. On the contrary, from Figures 9(b) and 10(b), it is clear that STS deformed remarkably in the case of compressive shear joint. The first clear crooked point at about 7 kN in Figure 9(b) might correspond to the fatal bending at about 1/4 point of shank from the screw head, afterwards the second bending might occur at the point closer to the screw head, which might correspond to the final load rising before the maximum load. In the case of withdrawal test, typical smooth pullout behavior was observed as can be seen from Figure 9(c).
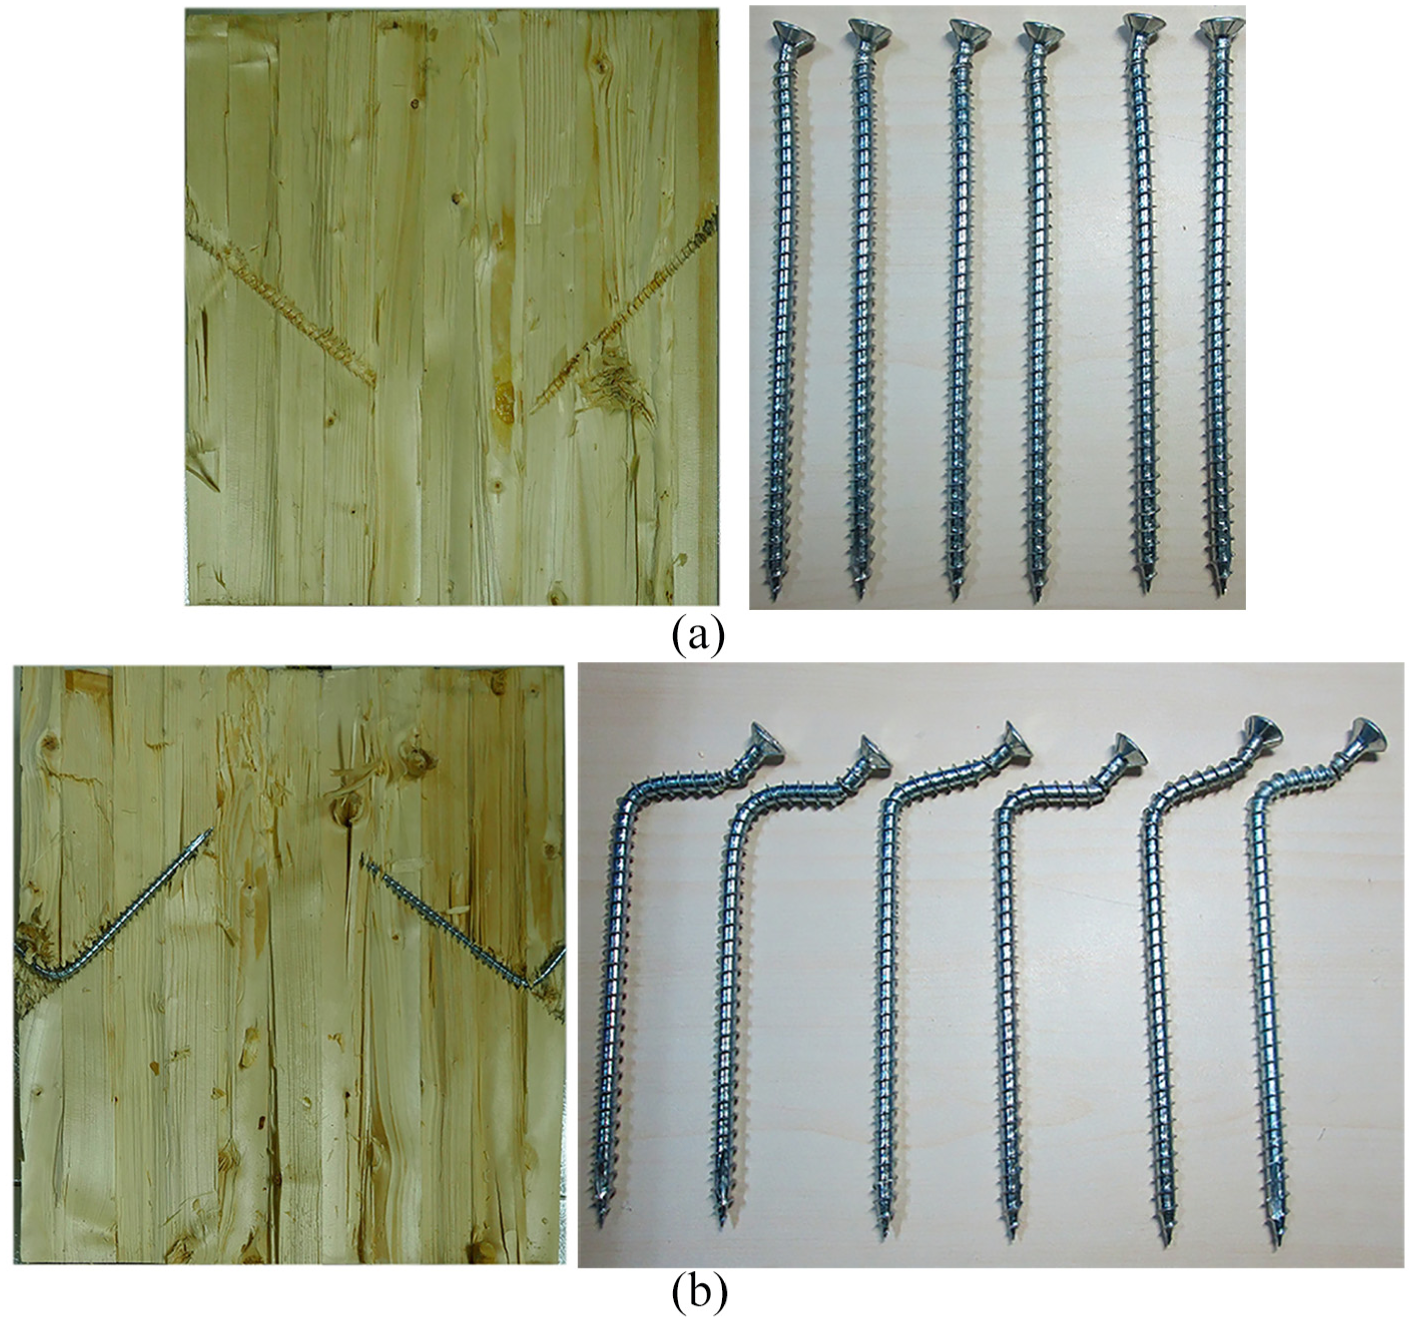
Failure modes of inclined screwed glulam-steel plate shear joint tests: (a) tensile shear joint (focuses in the glulam and deformed screws) and (b) compressive shear joint (focuses in the glulam and deformed screws).
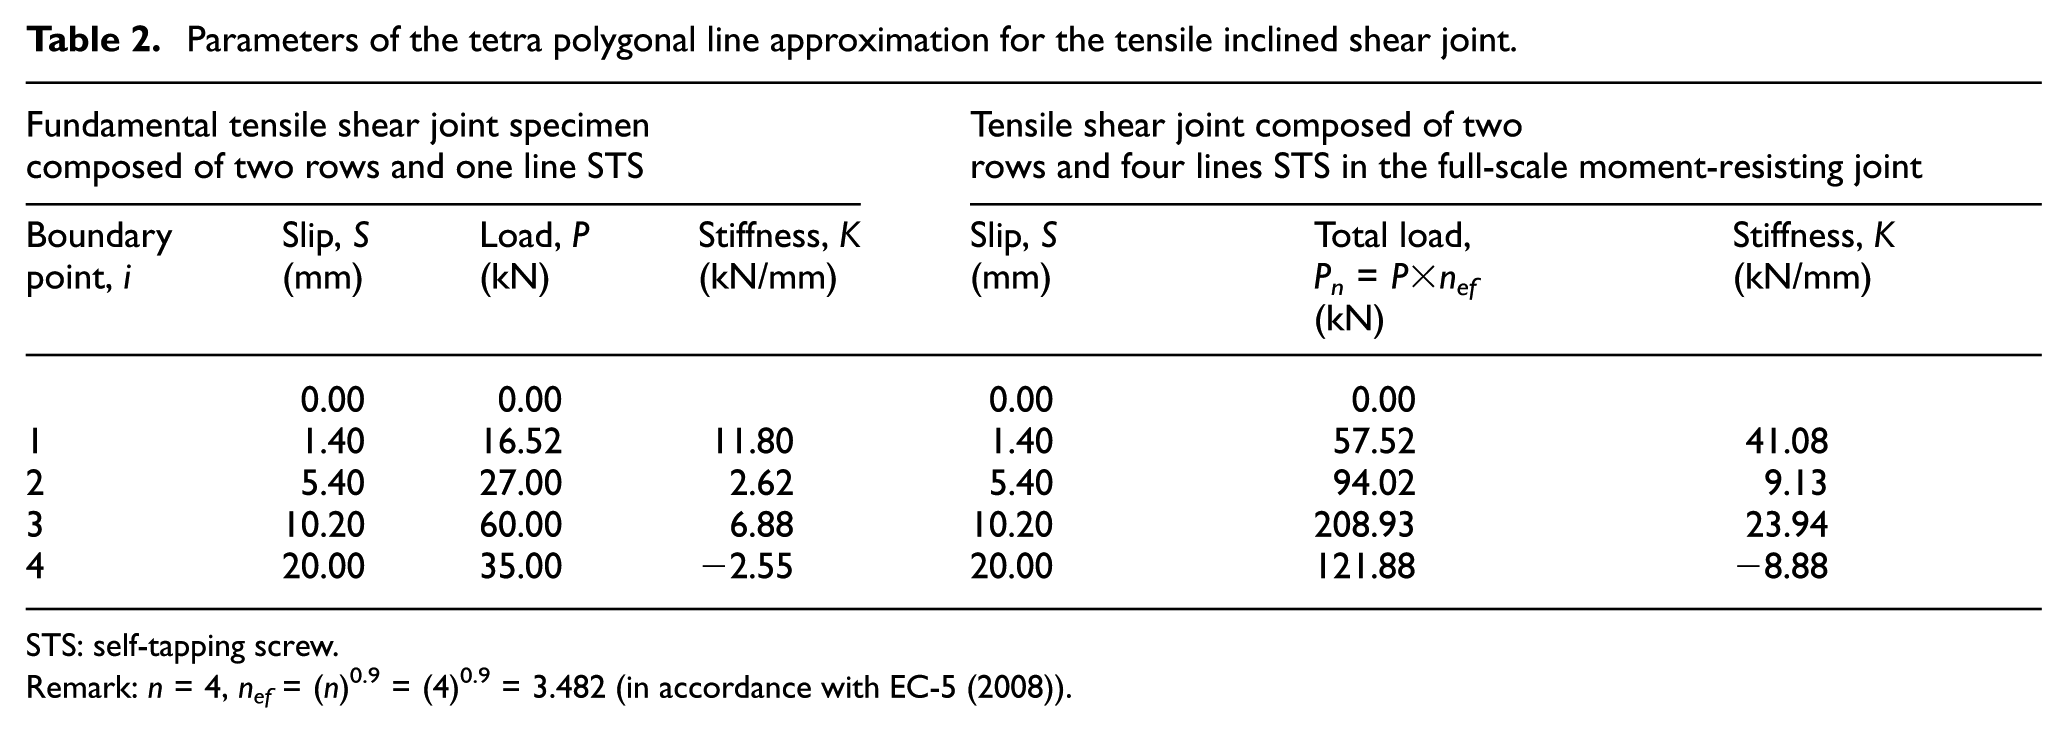
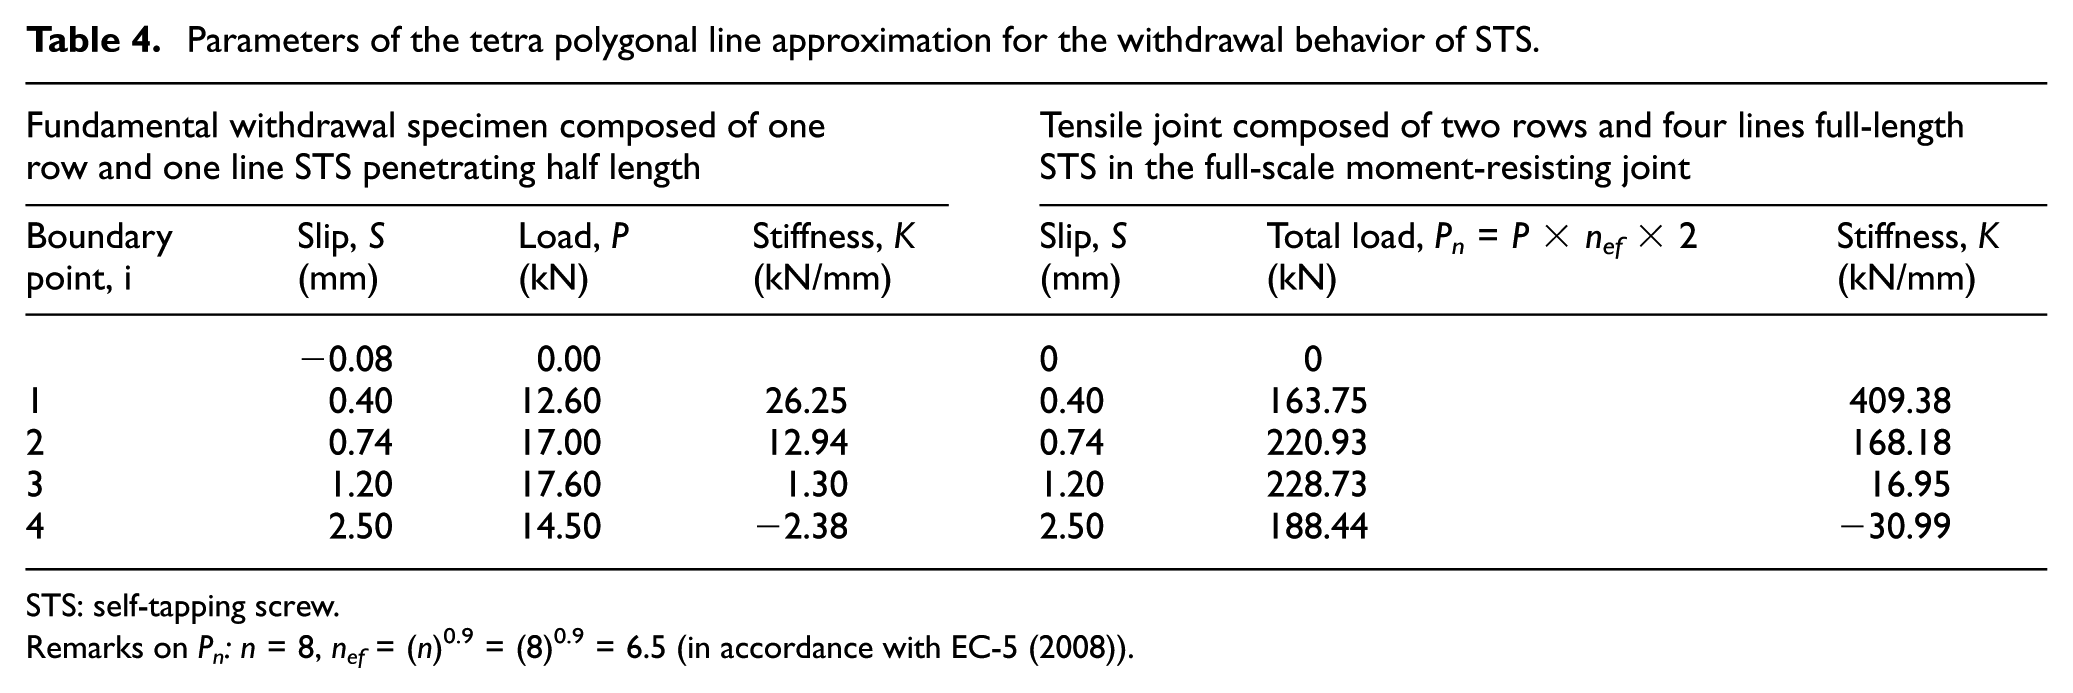
For predicting the skeleton curve of the moment-rotational relationships of the full-scale beam-column joint specimens, data obtained by the fundamental joint tests were approximated by tetra polygonal lines as shown in Figure 9 (solid lines with markers). Tables 2 to 4 show parameters composed of each tetra polygonal line with which stepwise linear calculations are to be executed in the section “Calculation methods.”
Parameters of the tetra polygonal line approximation for the tensile inclined shear joint.
STS: self-tapping screw.
Remark: n = 4, nef = (n)0.9 = (4)0.9 = 3.482 (in accordance with EC-5 (2008)).
Parameters of the tetra polygonal line approximation for the compressive inclined shear joint.

STS: self-tapping screw.
Remark: n = 4, nef = (n)0.9 = (4)0.9 = 3.482 (in accordance with EC-5 (2008)).
Parameters of the tetra polygonal line approximation for the withdrawal behavior of STS.
STS: self-tapping screw.
Remarks on Pn: n = 8, nef = (n)0.9 = (8)0.9 = 6.5 (in accordance with EC-5 (2008)).
In each table, left-hand side columns indicate the basic values estimated by the fundamental shear joint tests, and the right-hand side ones correspond to the performance of the actual joints in the full-scale specimen evaluated by considering the effective numbers nef (EC-5, 2008) of STS. As a common remark for these three tables, “boundary point” means the four points consisting of each tetra polygonal line. In Table 4, the reason why “total load” is multiplied by 2 is that the penetration depth of full-threaded STS in the fundamental withdrawal tests was half of the full effective length.
For the partial embedment of glulam, we assumed that stress (σ)–deformation (u) relationship of the embedment on the glulam surface had a bilinear form in which initial slope was estimated by equations (8) or (16), and the secondary slope was estimated as 1/8 of the initial slope in accordance with the empirical rule used in the standard (AIJ standard, 2009). Only the push-in capacity of STS was not evaluated by the experiment but it was assumed to be the same as that of withdrawal capacity in accordance with the suggestion of Bejtka and Blaß (2006) except for the final load-decreasing region. In this study, as a kind of “spring-back effect” was expected in some extent if the partial compression region has sufficient end-distance; therefore, we assumed that the load would be kept as it is for a particular time period after maximum load.
Calculation methods
Calculation of the skeleton curve
Stepwise linear calculations for predicting the skeleton curves were done using the rotational angle increment of 0.0001 rad based on the equations shown in the section “Mechanical model.” In each incremental step, all deformations corresponding to the moment-resisting components were checked whether they exceeded the “boundary point” values shown in Tables 3 and 4. If some deformation exceeded ith “boundary point,”ith stiffness was replaced by (i + 1)th stiffness, afterward the location of the neutral axis and the total resisting moment were re-calculated. This calculation process repeated until the maximum target rotational angle.
Analyses on the observed loops for estimating NCL parameters
In order to estimate the parameters for the extended NCL model, moment-rotational angle data observed in the full-scale experiments were analyzed and divided into individual 34 closed loops (11 steps × 3 repeated cycles + last return loop) in each specimen. NCL parameters were identified using the second cyclic data of each three cyclic loops because the first cyclic data involved partly skeleton curve data. Figure 11(a) to (d) show a several comparison between the observed closed loops (blue plots) and estimated NCL curves (solid red-curve).

Comparison between the observed closed loops (plots) and estimated NCL curves (solid curve). (a) θ =1/200 rad, A = 0.502, B = 0.550, n1 = 2.0, and n2 = 7.0; (b) θ =1/100 rad A = 0.400, B = 0.700, n1 = 1.2, and n2 = 12.0; (c) θ =1/60 rad, A = 0.200, B = 0.960, n1 = 1.9, and n2 = 9.0; and (d) θ =1/40 rad A = 0.080, B = 1.000, n1 = 2.5, and n2 = 8.0.
It can be seen from Figure 11 that hysteresis loop gradually changes from the spindle shape to the slip or/and pinching shape as the rotational angle increases. In this study, discrete values of NCL parameters estimated by the above mentioned loop analyses were directly used in the calculations for predicting hysteresis loops of the moment-rotational angle relationships.
Calculation of hysteresis loops combined with skeleton curve data
Figure 12 explains the calculation process of hysteresis loops. The circled number put near the plots in Figure 12 corresponds to those put in front of the following equations. Alphabets put after the equations correspond to those in equation (22). In the first cycle of any steps, “Skeleton Curve Data” obtained theoretically in the section “Calculation of the skeleton curve” is to be used partly or in the whole.
First cycle of the first step.
1.
2.
3.
4.
Third cycle of (i – 1)th step.
5.
6.
7.
8.
First cycle of ith step.
9.
10.
11.
12.
13.
14.
where
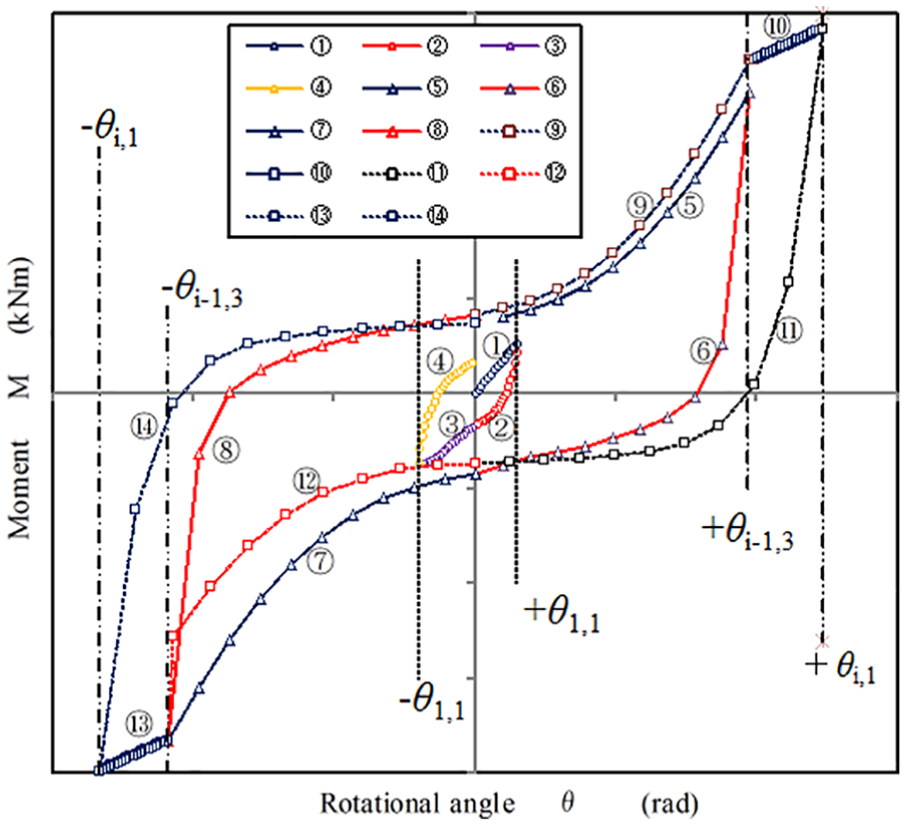
Schematic explanation on the calculation process of hysteresis loops.
Results of hysteresis loops predicted with theoretical skeleton curve data
Figure 13(a) to (c) show comparisons between predicted results (dotted line) and observed ones (solid line). On the whole, agreements between predictions and observations seem good. The extended NCL model could give better predictions for the nonlinear behaviors of glulam MRJ specimens subject to static push-pull cyclic load. In the SP1 specimen, however, some extent of discrepancy between predictions and observations was observed in push region (minus region). This reason is not clear rigorously but a few errors on the setting of vertical location of loading jig and a miss loading till 1/100 rad before the formal experiment might have effects on these errors.

Comparisons between the predicted results and the observed ones. SP1 to SP3 are specimen code names of the full-scale MRJ specimens tested.
Throughout three test results shown in Figure 13(a) to (c), it was confirmed that there were a few crooking points on the moment-rotational angle skeleton curves. According to our analyses, the first yielding moment at around 17 kN m was brought mainly by the first crooking point of both tensile inclined STS joint and compressive inclined STS joint in the beam-side joint. The second one at around 38 kN was brought by the second crooking point of both compressive inclined STS joint and yielding of end-grain surface beam member. Consequently, no pullout failure from tensile inclined STS joint occurred within the material properties and geometrical conditions provided in these experiments.
Failure phenomena
Figure 14(a) to (c) show failure phenomena of each test specimen. All specimens finally failed by splitting of column member which seemed to start from the top-point of tensile STSs penetrated perpendicular to the grain of column member.
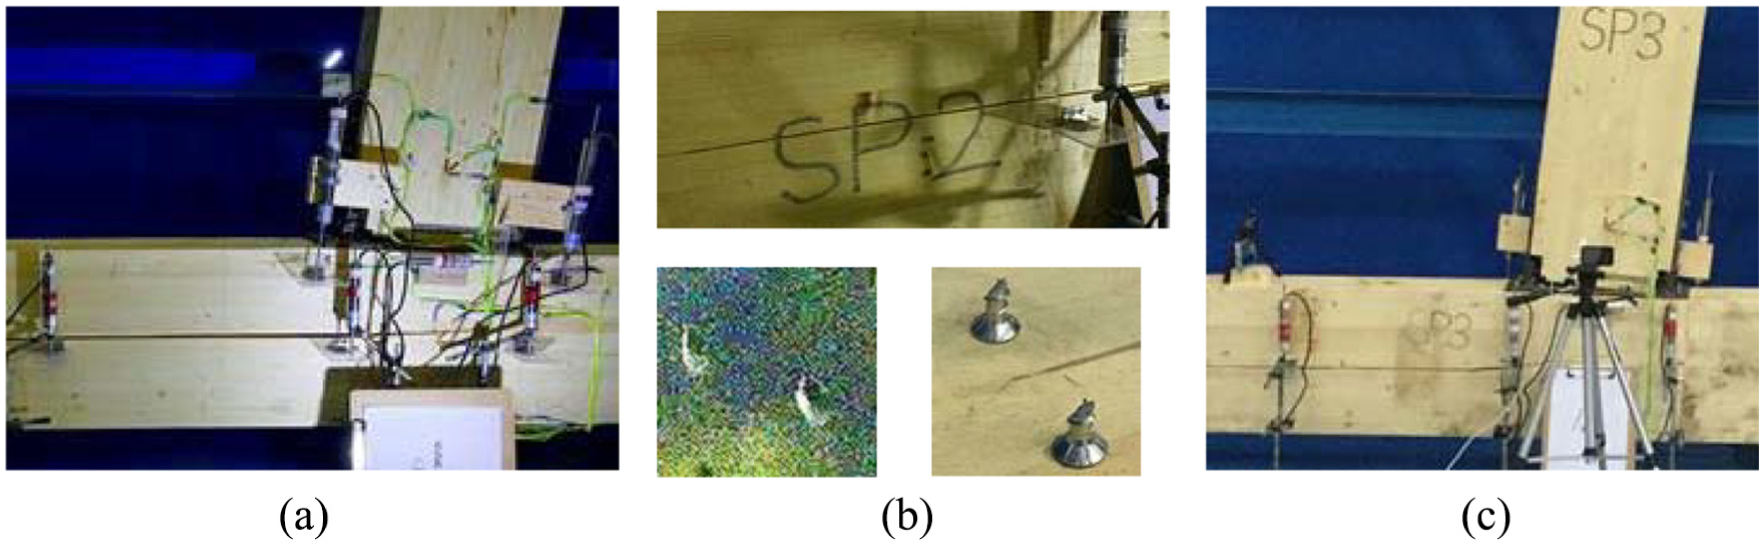
Failure phenomena of each test specimen: (a) SP1-splitting from top points of STS, (b) SP2-head tear-off afterward splitting, and (c) SP3-splitting from top points of STS.
Only on the SP2 specimen, heads of two screws were first torn-off at about 1/20 rad as shown in the lower photos in Figure 14(b), afterward splitting failure occurred quite the same as the cases in other two specimens. This kind of splitting failure might be understood as a result due to the stronger multiple STSs joint against the weaker timber load carrying capacity that is similar to the situation of tensile mechanical joint loaded inclined to the grain direction.
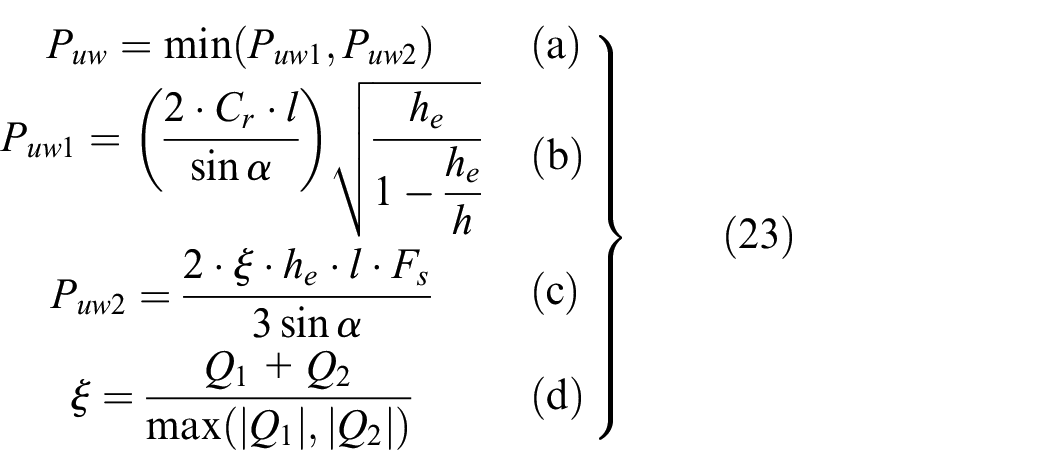
Figure 15(a) illustrates the situation occurred in the MRJ specimen subject to the tensile force T perpendicular to the grain. While Figure 15(b) shows a mechanical joint subject to α-degree inclined tensile force P to the grain direction that is assigned in the AIJ standard (2009), and equations 23(a) to (d) give predictions for the ultimate load carrying capacity P
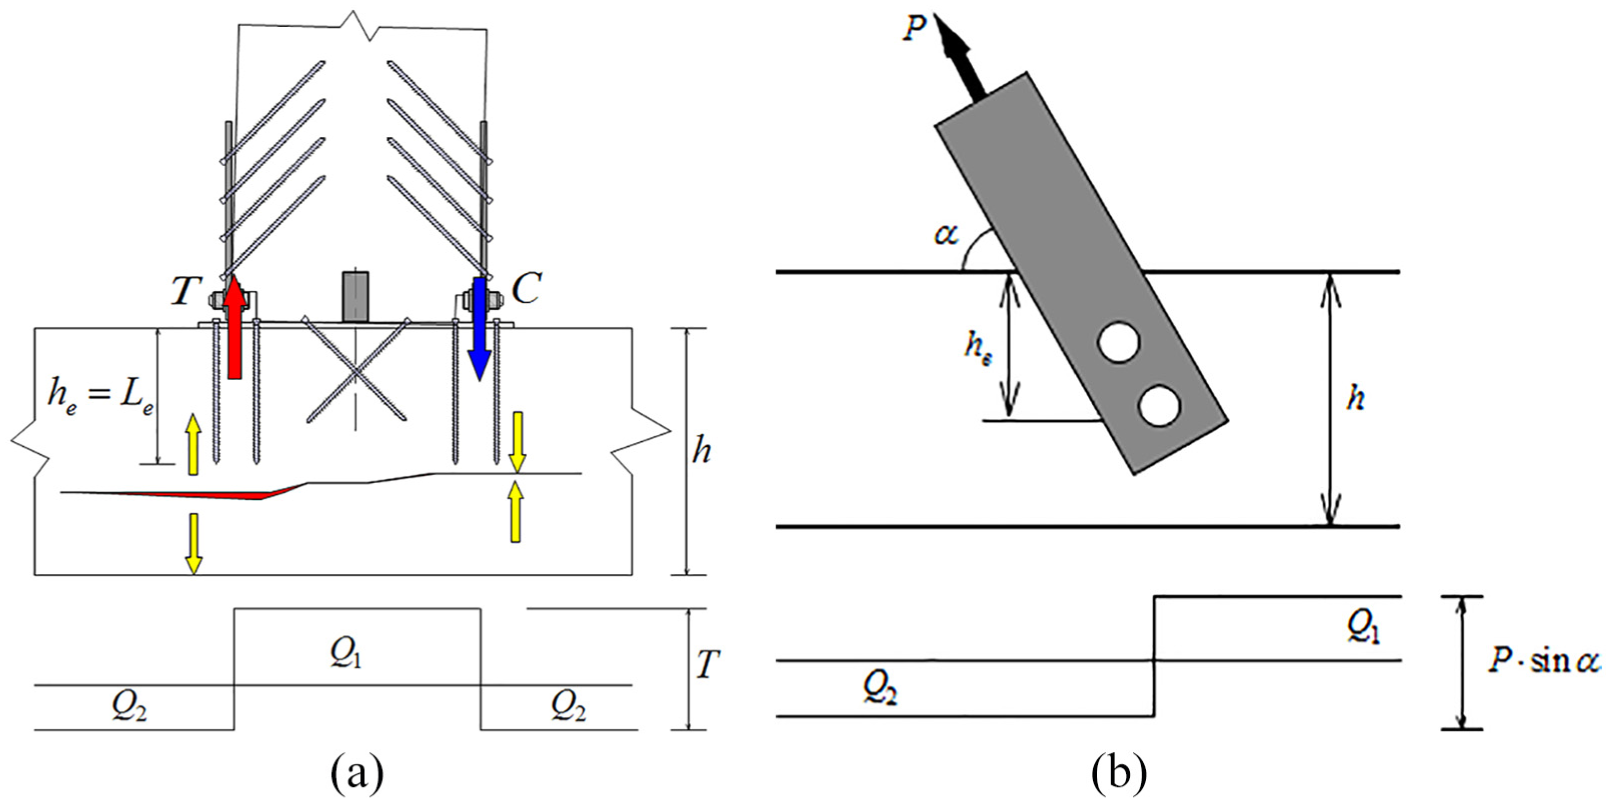
Situation of mechanical timber joint subject to tensile force inclined to the grain: (a) situation of the test specimen subject to T and (b) situation assigned in AIJ standard (2009).
The

Considering the geometrical size of the beam-column joint specimen (L is column length of 3 m, hb is beam depth of 0.362 m) as well as material constants, equations (23) and (24) gave the following results




While the incremental stepwise linear calculation in the section “Calculation of the skeleton curve” gave a regression equation between moment M and tensile force T as M = 0.5233 × T. From this equation, the moment at T = 96.33 kN was predicted as Mpredict = 0.5233 × 96.33 = 50.38 kN m. On the contrary, observed maximum moments were Mobs1 = 49.06 kN m, Mobs2 = 48.20 kN m, Mobs3 = 50.80 kN m and average value was Mobs-ave = 49.35 kN m. Therefore, theoretical prediction gave almost the same value as that of observed Mpredict/Mobs-ave = 50.38/49.35 = 1.02.
Conclusion
This study aimed to predict nonlinear behaviors of glulam beam-column MRJ specimens based on the mechanical model for the skeleton curve and the extended NCL model for hysteresis loops. From the comparisons between experimental results of three replications and analytical results, the following points were concluded:
The tensile shear joint consisted of glulam and steel side plate with inclined STS showed excellent initial stiffness and maximum load carrying capacity with less ductility. On the contrary, the compressive shear joint consisted of glulam and steel side plate with inclined STS showed inferior initial stiffness and maximum load carrying capacity with better deformability compared with tensile joint.
Moment-rotational behaviors of the test specimen showed typical slip-type hysteresis loop as the rotational angle increased.
The skeleton curve of the specimens could be predicted well by the incremental step-wise linear calculation method, in which load–deformation relationships of all moment-resisting components were assumed by tetra polygonal lines or/and bi-linear lines.
Extended NCL hysteresis model of each test specimen was consisted of parameters identified from the second cycle data of the each step observed in the experiments. Combining with the theoretical skeleton curve data, the whole nonlinear behaviors of the test specimens could be described well similar to those of observed.
Maximum load carrying capacities of test specimens could be predicted well by applying the design equations for the tensile mechanical joint loaded with inclination to the grain direction.
Footnotes
Appendix 1
Acknowledgements
Full-threaded STS used in this research were bought with preferential price from Rothoblass®, Italy. The Authors would like to express their sincere thanks to this support.
Declaration of Conflicting Interests
The authors declared no potential conflicts of interest with respect to the research, authorship, and/or publication of this article.
Funding
The author(s) disclosed receipt of the following financial support for the research, authorship, and/or publication of this article: This work was supported by the Special Fund for National Natural Science Foundation of China (Project No. 31670566).
