
Abstract
After an explosion, determining the remaining capacity of a structure to resist a progressive collapse can provide valuable information for emergency operations and decision makers. Condition assessments after a blast are commonly performed with a visual inspection. However, visual inspections can be time-consuming and involve putting additional personnel into harm’s way. Analytical blast analyses can estimate a structures post-blast condition, but to achieve a high level of accuracy these analyses can be time-consuming and require information regarding the blast event which may not be available at the time. This presents a need for a threat independent post-blast analysis method, which can assess for the post-blast structural condition without requiring personnel to enter the structure. The alternate path method has been used to design buildings to resist a progressive collapse; however, it does not incorporate damage outside of element failure making it unsuitable for post-blast condition assessments. Model updating using modal properties from vibration measurements has been used in structural health monitoring to estimate damage on structures, but it has not been applied to post-blast structures. In this article, a method to estimate the remaining elemental structural capacity of a post-blast structure, called the adaptive alternate path analysis, is presented. This method involves using the alternate path method to assess an updated numerical model, which incorporates the buildings’ structural damage. To demonstrate the impact of incorporating additional damage beyond elemental failure on a structure’s capacity, a simulated study is presented using simulated stiffness reductions. A blast simulation is then used to show the capacity of the updated numerical model to represent the post-blast structure and the improvements gained over using the original model. The presented methodology can be used to assess a structures potential for progressive collapse after a blast, leading to safer emergency operations.
Keywords
Introduction
Progressive collapse occurs when a local structural failure or damage event leads to an extensive or complete failure of a structure, disproportionate to the initial damaging event (Krauthammer et al., 2002). After the Ronan Point apartment collapse in 1968, Murrah Building bombing in 1995, and the World Trade Center collapse in 2001, among others, analysis of the progressive collapse of structures has become an important area of research (Department of Defense (DoD), 2013; Krauthammer et al., 2002). Different types of extreme events can lead to a progressive collapse, including explosions, earthquakes, fires, or impacts from vehicle crashes (Gamaniouk, 2014). Should a structure not suffer a progressive collapse immediately after an event, the ability to quickly assess its residual structural capacity would be beneficial for emergency responders and structural stakeholders, to determine safe emergency operations and monitor for further structural degradation.
In order to design buildings to resist a progressive collapse, guidelines have been developed such as presented by the US DoD in the Unified Facilities Criteria (UFC) 4-023-03 (DoD, 2013). One of the methods for the design of structures to resist progressive collapse in UFC 4-023-03 is the alternate path (AP) method. The AP method is used to design a structure to resist a progressive collapse, by determining whether the structure is capable of developing alternate load paths to compensate for the removal of critical elements. This is performed by determining whether the removal of critical structural elements will likely cause a progressive collapse and, if so, then re-designing the structure to resist the removal of the elements. Various researchers have studied the AP method. Marjanishvili and Agnew (2006) researched the differences between the results from the AP method using linear static, nonlinear static, nonlinear dynamic, and linear dynamic analyses, finding that the evaluation criteria for the linear analyses were not conservative when compared to nonlinear analyses. McKay et al. (2012) studied the dynamic and nonlinear increase factors for the AP method, proposing new methods for selecting the linear static load increase factor and the nonlinear static dynamic increase factors. While the AP method is useful for the design of structures to resist a progressive collapse, it is not used to assess the capability of a structure to resist a progressive collapse after a blast has occurred.
A drawback in the AP method for analysis of structures after a blast is that it does not consider damage beyond failure to members adjacent to the one to be removed, which could lead to significant changes in the structures’ resistance to a progressive collapse (Fu, 2013; Tsai, 2012). An example of the impact of additional damage on the progressive collapse of a structure is the analysis by Kazemi-Moghaddam and Sasani (2015) on the Murrah Federal Building for the sudden removal of column G20 to simulate the bombing of the structure. They showed that the building would have resisted a progressive collapse with only the removal of the G20 column, determining that there must have been more damage caused by the blast than just the column failure. The incorporation of the post-blast condition of the structure is important for the development of a successful progressive collapse assessment methodology.
Structural health monitoring (SHM) has the capability to determine the current condition of a structure. Using measurements taken after the blast event, model updating can be performed to develop an updated numerical model, which estimates the effect of the structural damage from the blast. Examples of model updating to assess structural damage include the work by Wang et al. (1997), who iteratively updated a numerical structural model using the error in the analytical frequency response function (FRF) using a model sensitivity matrix to detect damage and validated their method on a three-bay plane frame structure. Begambre and Laier (2006) used a modified particle swarm optimization algorithm to minimize the error between the measured and analytical FRF for damage detection. Yun et al. (2009) employed a two-stage damage detection approach, where the damage was first localized by sensitivity to changes in the residual force vector and then quantified using a Genetic Algorithm (GA) using an objective function based upon the normalized flexibility matrix variations. Subsequently, Yun et al. (2010) used system equivalent reduction expansion process (SEREP) expansion to account for missing sensors and used the residual force vector sensitivity matrix to locate damage and a steady-state GA using the Frobenius norm of the error between the measured and updated numerical models’ flexibility matrices as the objective function to quantify it. While the quantification of various types of damage to civil structures using SHM is well researched, little research has been performed applying damage detection methods to post-blast structures.
A modified version of the AP method is presented in this work, called the adaptive AP analysis, to determine the remaining elemental capacity of a damaged post-blast building by combining model updating and the AP method. For the adaptive AP analysis, a numerically updated model of the post-blast structure is developed using experimental measurements, which incorporates the damage from the blast event into the model. An analysis is then performed, based upon the AP method, on the updated numerical model to determine the remaining elemental capacities of the post-blast structure. Since progressive collapse occurs after a local structural failure, when additional elements cannot transfer additional loads, if the remaining elements are nearing their capacity and therefore potential failure, it can be determined that a progressive collapse may be about to occur. Therefore, the authors use the exceedance of elemental capacity as a measure of potential for progressive collapse.
In this article, the methodology for the adaptive AP analysis is presented. Numerical simulations are used to demonstrate the impact additional damaged elements have on the remaining elemental capacity, and a numerical demonstration of the adaptive AP analysis after a blast event is shown. The presented methodology can be used for monitored critical infrastructure after a blast has occurred, to determine information regarding their structural condition which can be assisted in facilitating safe emergency operations.
Methodology
To determine the remaining elemental capacity of a post-blast structure, the adaptive AP analysis is proposed. The adaptive AP analysis utilizes an updated numerical model of the post-blast structure to incorporate additional elemental damage into the AP method. In this work, the numerical model is updated using a two-phase damage localization and quantification method developed by the authors (Eskew and Jang, 2017). The adaptive AP analysis is then performed on the updated numerical model. The methodology for the two-phase damage localization and quantification, the adaptive AP analysis, and a description of the numerical models used in this article is presented in the following section.
Two-phase damage localization and quantification
For completeness, the two-phase damage localization and quantification method developed by the authors (Eskew and Jang, 2017) is summarized in this section. An initial model is updated by first localizing potential damage locations and then quantifying an estimate of the damage at the localized parameters using a GA. The parameter localization is performed by comparing the analytical stiffness matrix to an experimentally updated stiffness matrix, generated using the efficient model correction (EMC) method (Wu and Loh, 2013).
The EMC method is a direct model updating technique using a transformation matrix (

where

where
A similar substitution is performed with the natural frequencies
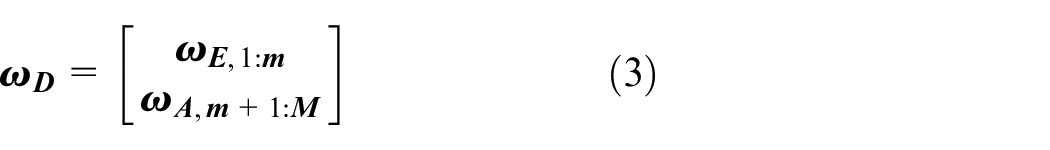
where
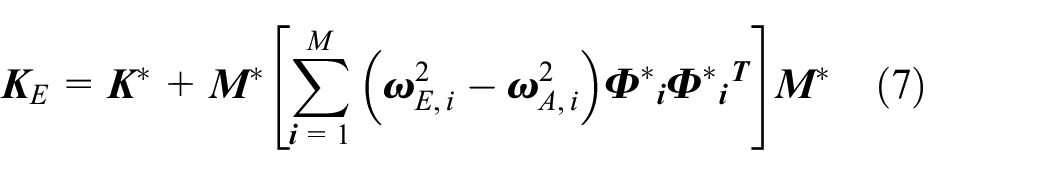
The transformation matrix is used to create a modified stiffness (
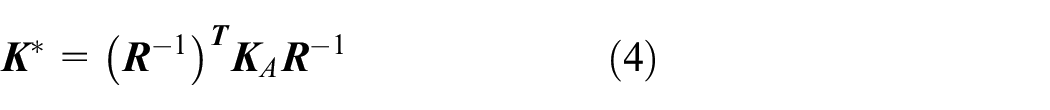


where
An updated experimental stiffness matrix (
To localize potential damage locations, the diagonal members of the experimental stiffness matrix are compared to their counterparts on the analytical stiffness matrix using the equation shown below
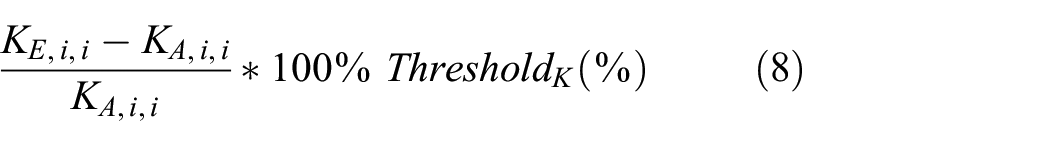
where i is the ith degree of freedom (DOF), and ThresholdK is the threshold for the damage identification. If the difference at the diagonal value of a DOF between the experimental and analytical stiffness is below a threshold percentage, the DOF is identified as a potential damage location. The identified DOFs are then used as updating parameters in GA to quantify the estimated damage.
The damage quantification is estimated through optimization of the potential damage parameters on the analytical model, to reflect the experimental measurements. The optimization occurs by minimizing the objective function (J), as shown below
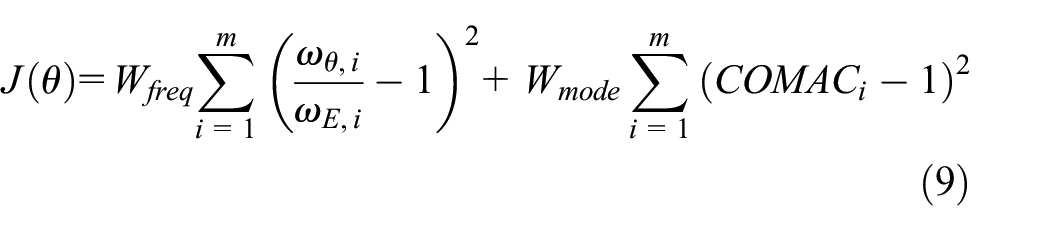
where θ is the optimization parameter, Wfreq and Wmode are the weights for the natural frequency and mode shapes, respectively, and COMAC is the coordinate modal assurance criterion
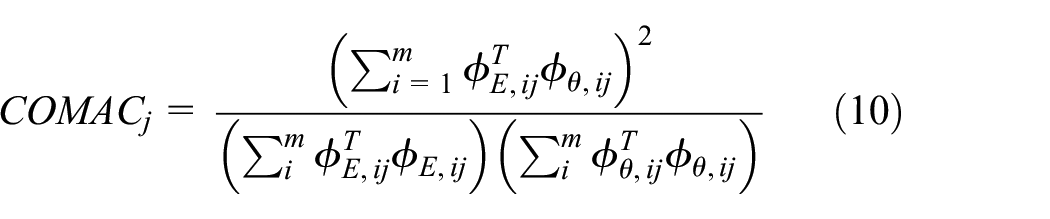
where j is the jth DOF, ϕE is the unity normalized experimental mode shape from the monitored DOF, and ϕθ is the unity normalized mode shape from the updated model for the monitored DOF. In this article, the natural frequency and mode shape weights were set at 10 and 1, respectively, to show the higher confidence in the measured natural frequencies (Li et al., 2009b).
The optimization was performed using a GA, a metaheuristic method to find near-optimal solutions to optimization problems. The GA begins by randomly generating an initial population of chromosomes, or sets of solutions for the individual optimization parameters, each of which are evaluated using the objective function shown in equation (9). A percentage of the chromosomes with the fittest or minimum objective function values are chosen as parents for the next generation. Using the pool of parent solutions, the next generation of solutions, or children, are generated using the crossover function such that

where ParentA and ParentB are randomly selected chromosomes from the parent pool, and β is a random value from 0 to 1 which is used to determine the portion of each parent the child solution consists of (Haupt and Haupt, 2004). To maintain population diversity and avoid local minima, a proportion of the children are subjected to a mutation function or random additions or subtractions within a range of values to randomly selected parameters within the population of children.
A final solution is determined to have been reached when the GA converges, which is defined as when the overall fittest objective function over all of the iterations has not decreased by more than a threshold value over a specified number of iterations. This procedure is then repeated, since the use of random variables means that the GA may not converge to the near-optimal solution every time. The framework for the GA procedure is shown in Figure 1.
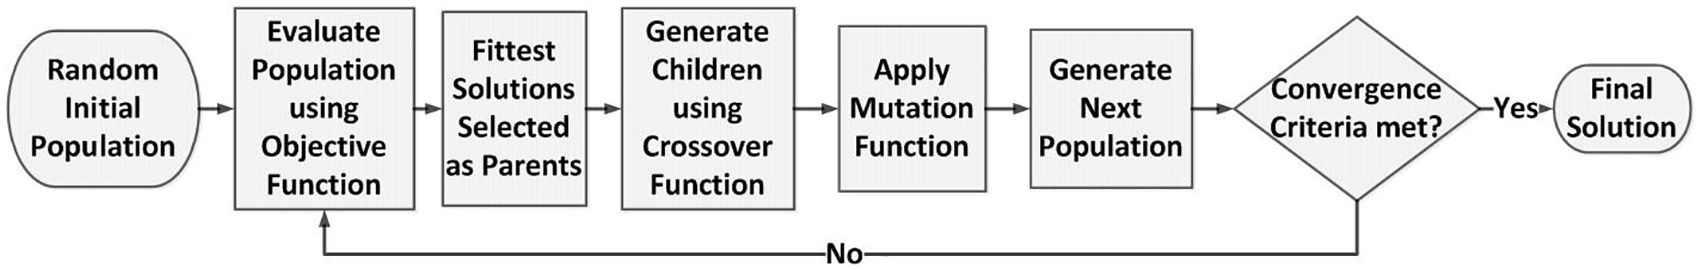
Genetic algorithm framework.
Adaptive AP analysis
To determine the remaining elemental capacities after the blast event, the novel adaptive AP analysis was developed. The adaptive AP analysis uses the previously described updated numerical model from the post-event structure to calculate the remaining elemental capacities and determine whether a progressive collapse is likely to occur. This is done using the same procedure used in the AP method to determine the structural response of the updated numerical model with the removal of severely damaged elements. The maximum element responses are then compared to design acceptance criteria for the respective elements, to determine their remaining elemental capacity. As progressive collapse occurs when structural elements cannot transfer the additional loads after the failure of critical structural members, whether the remaining structural elements are nearing their capacity is used in this article as the progressive collapse failure criteria for the structure.
The AP method involves removing structural elements and determining whether their removal will cause a progressive collapse to occur. In the adaptive AP analysis, elements which have likely failed due to the blast event are also removed from the updated numerical model. Removal of elements occurs when the estimated damage from the model updating exceeds a threshold limit, which in this article is set at 80% damage (Shi et al., 2010). Elements which have an estimated damage greater than the threshold are removed from the model using the nonlinear dynamic method described in UFC 4-023-03 (DoD, 2013). Following the removal of failed elements from the numerical model, the response of the numerical structure to the specified structural loads is simulated until the maximum displacement has occurred. When the numerical simulation has been completed, the elemental capacities are determined based upon each element’s maximum absolute response. In this article, the authors only examined elements with plastic deformation, as they were most likely to have critical remaining elemental capacities.
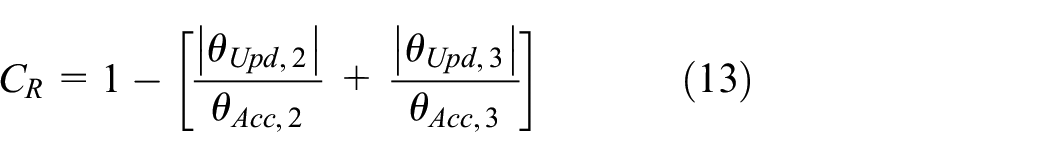
The remaining elemental capacity is calculated by comparing the element’s maximum response to its design acceptance criteria. For beam elements, in this work, only strong axis rotation was possible due to diaphragm restraints, so the remaining elemental capacity (CR) is calculated as follows
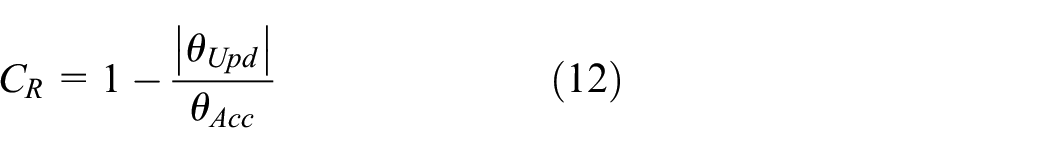
where θUpd is the plastic hinge rotation from the adaptive AP analysis after column removal, and θAcc is the plastic hinge rotation of the acceptance criteria.
For column elements, two interaction equations are utilized to determine the remaining elemental capacities, depending upon whether the column is deformation-controlled (Pupd/Pc ≤ 0.5) or force-controlled (Pupd/Pc > 0.5) per the American Society of Civil Engineers (ASCE) 41 definitions (ASCE, 2007), where P is the axial load, from the adaptive AP analysis after column removal and Pc is the axial compressive load capacity. For deformation-controlled columns, which exhibits a ductile response, the remaining capacity is determined from the plastic hinge rotations in both local DOFs, using the interaction equation shown below
where the subscripts, 2 and 3, represent the weak and strong axis rotation. For force-controlled hinges, which present a brittle response, the remaining elemental capacity is dependent upon the forces and moments at the hinge, using the interaction equation shown below
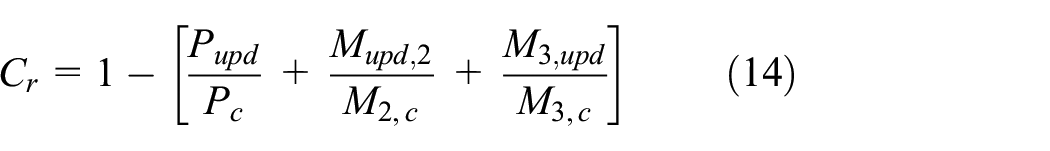
where M2 is the column moment in the weak axis, M2, c is the column moment capacity in the weak axis, M3 is the column moment in the strong axis, and M3, c is the column moment capacity in the strong axis. The acceptance criteria for nonlinear plastic hinges of steel elements can be found in UFC 04-023-03 Table 5-2 (DoD, 2013) and chapter 5 of ASCE 41 (ASCE, 2007), with the acceptance criteria for the life safety condition governing the columns and the collapse prevention acceptance criteria governing the flexural beams. Since the failure of additional elements is used as the criterion for progressive collapse in this work, the minimum elemental remaining capacity governs the potential for a progressive collapse to occur for the structure. In this way, a structure level assessment of the likelihood of a progressive collapse can be determined.
Numerical model
To demonstrate the adaptive AP analysis, a structural model was developed in SAP2000 (Computers & Structures Inc., 2016). The numerical model is a modified version of the steel frame structure in Appendix E of UFC 04-023-04, which was used to demonstrate the AP method (DoD, 2013). The structural model consisted of four floors, which were each 14-ft 8-in (4.5 m) tall and nine 30-ft (9.1 m) bays along its width. The interior bays of the structure were two bays which were 44 ft (13.4 m) and 36 ft (11.0 m), respectively, and the end bays consisted of three bays which were 25 ft (7.6 m), 30 ft (9.1 m), and 25 ft, respectively. The member sections were chosen from the re-designed structure found in UFC 04-023-04 Appendix E (DoD, 2013), after the nonlinear dynamic analysis. Diaphragm constraints were applied to model the behavior of the floors. Additional modifications to the example structure included removal of the bracing elements and changing the column-to-foundation connections from pinned to fixed connections. Plastic behavior was modeled for the elements, based upon ASCE 41, using two P-M2-M3 hinges for each column, and three M3 hinges for each beam (ASCE, 2007). A screen view of the structural model from SAP2000 is shown in Figure 2.

UFC modified structure.
While the SAP2000 software has been frequently used with the AP method, the software has limitations in simulating blast events. Therefore, in order to provide a more representative simulation of potential damage which could occur from a blast event on the modeled structure, an equivalent numerical model was developed in the finite element software Abaqus 6.13.2 (Dassault Systemes-Simulia, 2013). In the Abaqus numerical model, each structural member was modeled as a beam element, with sections determined using their respective I-beam dimensions, and the transverse shear stiffness was specified by the elastic material properties. The column–foundation connections were modeled using the fixed boundary condition. To create the diaphragm constraint, the joints and frames on each floor were coupled with the center of the structure for the two horizontal translation DOFs and the vertical rotation DOF. The model utilized A992 steel for the elements, with an elastic modulus of 4,176,000 ksf (200 GPa), a density of 15.2297 lbs/ft3 (244 kg/m3), and Poisson’s ratio of 0.3.
The response of the steel elements to the blast was modeled with a Johnson–Cook material model. The Johnson–Cook material model was chosen because it has been frequently used to model steel under high strain rates, such due to blast loads (Ding et al., 2013; McConnell and Brown, 2011; Seidt et al., 2007). In the Johnson–Cook model, the plastic material stress is calculated as follows
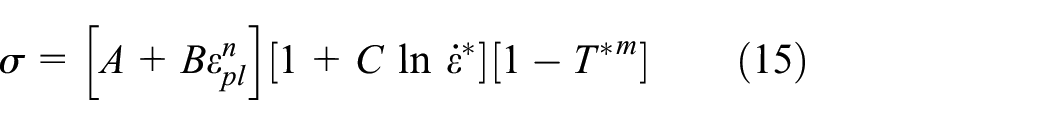
where A is the yield stress, B and n control the strain hardening, C is a strain rate constant, m is a material constant, εpl is the equivalent plastic strain, T* is the homologous temperature, and
The structural damage caused by the blast was determined using the Johnson–Cook damage index. Elemental damage (D) was determined as the accumulated plastic strain over the fracture strain, using the following equation

where ε f is the equivalent fracture strain, calculated as follows

where D1, D2, D3, D4, and D5 are material constants, and σ* is the effective stress (Johnson and Cook, 1985).
The material properties used to represent A992 steel, as used by McConnell and Brown (2011), are shown in Table 1. To allow the structure to settle after the application of the structural loads and before the blast loads were applied, 50% Rayleigh mass damping was used. Minor variations existed between the SAP2000 and Abaqus numerical models, but differences in natural frequencies for the first 12 modes were approximately 1% or lower. Therefore, it was determined that the Abaqus model would provide a representative assessment of the potential damage which would be caused by a blast event to the structure represented in the SAP2000 model.
Johnson–Cook material model parameters (McConnell and Brown, 2011).

The blast simulation was performed using the conventional weapons effects (CONWEP) model (Hyde, 1988). CONWEP is a set of equations for the pressures developed from an explosion based upon empirical data, which are built into Abaqus as an incident wave interaction. The CONWEP model is used to generate pressure loads equivalent to those produced from a specified explosion, based upon its charge equivalent trinitrotoluene (TNT) weight, detonation location, and the type of explosion. To provide a surface for the loads to be applied on, steel cladding was modeled on one side of the frame structure. The cladding was modeled using elastic, undamped shell elements with the density, Poisson’s ratio, and Young’s modulus previously described for the frame elements. Each cladding segment covered one bay of the model and was modeled using homogeneous shell elements with a thickness of 0.36 in (0.9 cm), which was chosen to create a mass equivalent to the cladding design loads. An explicit analysis was used to simulate the structures’ response to a blast. The simulation began with the structural loads being applied using a ramp loading over the course of 5 s, with the structure allowed to settle for an additional 5 s. At the 10th second, the blast initiated, with the pressure loads applied to the exterior of the cladding. The structural response to the blast loads was then simulated for 5 s, to ensure that the maximum responses were determined.
The structural response to a blast was simulated in Abaqus; however, the adaptive AP analysis was performed using the SAP2000 software. To develop the numerical model of the post-blast building in SAP2000, the damage from the blast simulation was introduced through modifications of the material properties of the damaged elements, proportional to their Johnson–Cook damage index from the blast simulation. Various researchers have used different damage indices to simulate damage by modifying material yield stress, the elastic modulus, and the shear modulus (Ding et al., 2013; Li et al., 2009a; Ribeiro et al., 2016; Shen and Dong, 1997; Xue, 2007). In this article, damage was introduced as reductions in the material elastic modulus (E), shear modulus (G), yield stress (σy), and ultimate stress (σult) corresponding to the elemental damage index, as shown below


where the subscript D indicates the damaged material. The damaged structural model, incorporating the elemental material reductions proportional to the blast damage, was then used to represent the post-blast structure in the adaptive AP analysis.
Impact of damaged elements on remaining capacity
In the original AP method, the assessment regarding whether the building can resist a progressive collapse is performed via the removal of critical elements to simulate their failure. While element removal is useful for a design methodology, after a blast event multiple instances of damage with varying magnitudes can occur, and the initial model with the element removal no longer represents the post-blast structure. Utilizing updated numerical models, which incorporate additional damage beyond elemental failure can provide a more accurate assessment of the building’s remaining capacity. To show the impact of incorporating additional damage into the analysis, remaining elemental capacities were calculated for five different damage scenarios using the numerical model described in the “Numerical model” section. For each scenario, the fifth column on the first floor (element 21 in Figure 3) was removed to simulate elemental failure. Additional damage was then applied to elements near element 21, to simulate additional potential damage from a blast event and the remaining elemental capacities were determined. In order to determine how the presence of damage at different locations impacted the remaining elemental capacity, the additional applied damage was kept at a constant 50%, which was chosen to ensure that the additional damage would present a clear impact on the remaining elemental capacity. A more realistic damage scenario is presented in the “Post-blast analysis” section.
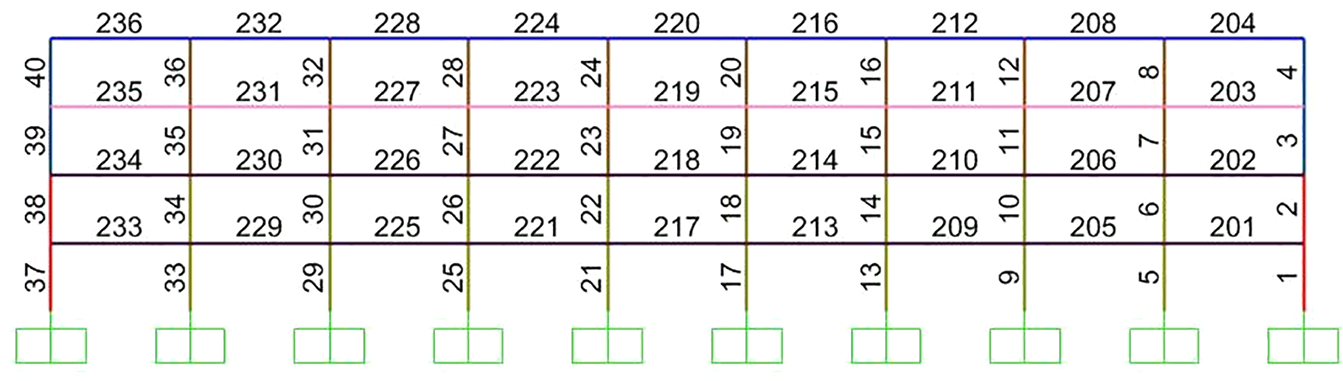
Element numbering.
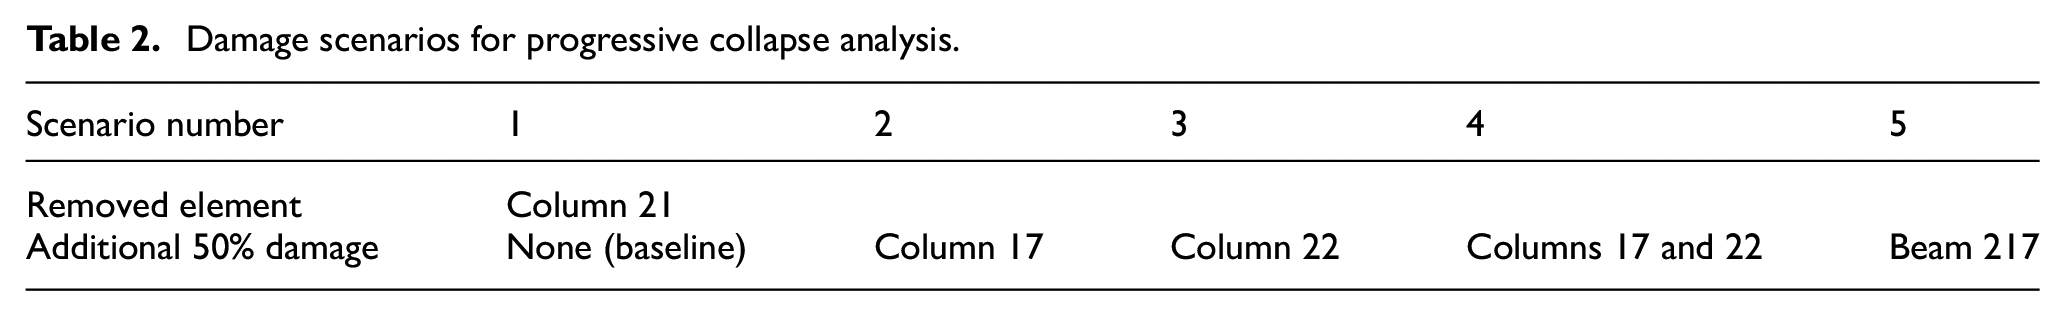
In scenario 1, no additional damage beyond the removal of element 21 was applied, providing a baseline assessment of the structures’ remaining elemental capacity for the removal of element 21. For scenario 2, 50% damage was applied to element 17, a column adjacent to element 21, to demonstrate the impact of damage to adjacent columns on the remaining elemental capacities. In scenario 3, 50% damage was applied to element 22, the column directly above the removed element, to show the impact of damage to columns connected to the failed element. For scenario 4, 50% damage was applied to elements 17 and 22, to show the impact of multiple instances of additional elemental damage on the remaining elemental capacities. Finally, in scenario 5, 50% damage was applied to element 217, a beam connected to the removed element, to demonstrate the impact of additional damage to a nearby beam. The five scenarios are summarized in Table 2.
Damage scenarios for progressive collapse analysis.
For each of the scenarios described, a numerical model was developed, and the minimum remaining elemental capacity for each scenario determined using the adaptive AP analysis, described in the “Adaptive AP analysis” section. In scenario 1, the minimum remaining elemental capacity was calculated as being 80.89% at element 221, providing a baseline for comparison.
In scenario 2, with the addition of 50% damage to the adjacent column, the minimum remaining elemental capacity was calculated as being 33.11% at element 17. The addition of damage to element 17 caused an increase in the moments applied to the column, leading to a force-controlled response, causing the reduced elemental capacity.
For scenario 3, with the addition of 50% damage to the column above the removed element, the minimum remaining elemental capacity was determined to be 80.77% at elements 217 and 221. The minimal change in remaining elemental capacity was due to the negligible change in load transfer with the added damage, therefore inducing only a slight change in the remaining elemental capacities.
In scenario 4, which combined the added damage from scenarios 2 and 3, the minimum remaining elemental capacity was determined to be 29.11% at element 17. While the additional damage in scenario 3, to the column directly above the removed element, did not significantly impact the structures’ load transfer, when coupled with the damage from scenario 2, to the column adjacent to the removed element, a change in load distribution occurred due to the damage in element 22, leading to an increase in the moments applied to element 17. The added moments on element 17 lead to the reduced elemental capacity, showing the increased impact of multiple instances of additional damage.
Finally, for scenario 5, with the addition of 50% damage to one of the beams connected to the removed element, the minimum remaining elemental capacity was determined to be 66.35% at element 222. The additional damage to the beam adjacent to the removed element caused a significant change in the load transfer, causing a decrease in the remaining elemental capacity. The minimum remaining elemental capacity for each of the scenarios is summarized in Figure 4.

Minimum remaining elemental capacity for each damage scenario.
In general, the additional damage beyond the failure of element 21 impacted the structures’ minimum remaining elemental capacity. In scenario 2, damage to the column on the base, near the failed column, lead to a 47.78% reduction in the minimum remaining capacity from scenario 1, as the governing element changed from beam 221 to column 17. While damage to the column directly above the failed element, in scenario 3, did not cause a drastic change in the elements’ capacity, when coupled with additional damage to columns on the structures’ base, it lead to a larger reduction in the minimum remaining elemental capacity, as shown by the 4% decrease in minimum elemental capacity from scenario 2 to 4. In addition, when damage was applied to the beam element in scenario 5, a significant change in load transfer occurred leading to larger hinge rotations and a 14.54% reduction in minimum remaining elemental capacity. A comparison of the difference in minimum remaining elemental capacity for each scenario in comparison with the baseline assessment is shown in Table 3. The presented scenarios highlight how additional damage to elements which have not yet failed, as can occur from a blast event, can significantly impact the remaining elemental capacity of a structure. Therefore, it is important to incorporate additional structural damage beyond element failure into the assessment of the condition of a structure after an explosion.
Impact of damage on minimum remaining elemental capacity.

Post-blast analysis
The adaptive AP analysis can be used to assess the remaining elemental capacity of a structure after a blast, providing an assessment of its potential for a progressive collapse. By utilizing updated numerical models, the damage to the post-blast structure is incorporated into the analysis, providing an accurate assessment of the buildings’ current structural condition. To demonstrate the capability of the updated numerical models in the adaptive AP analysis to represent a post-blast structure, a blast simulation using the refined finite element model, described in the “Numerical model” section, was performed in Abaqus with the results used to create a representative post-blast damaged structural model in SAP2000. Using vibration parameters from the damaged numerical model, an updated numerical model was generated using the methods described in the “Two-phase damage localization and quantification” section and used in the adaptive AP analysis to calculate the remaining elemental capacities. These values are compared to the remaining elemental capacities determined from the original post-blast damaged structural model and the original undamaged numerical model with the failed element removed, to show the capability of the updated numerical models to better represent the post-blast structure.
Blast simulation and post-blast damage
A numerical simulation of a blast was performed in Abaqus on the model of the structure. The simulation utilized a surface blast with an equivalent TNT weight of 1775 lbs (805 kg), located in line with column 21 at a standoff distance of 5 ft (1.5 m) from the exterior of the structure, as indicated in Figure 5 by the explosion icon.
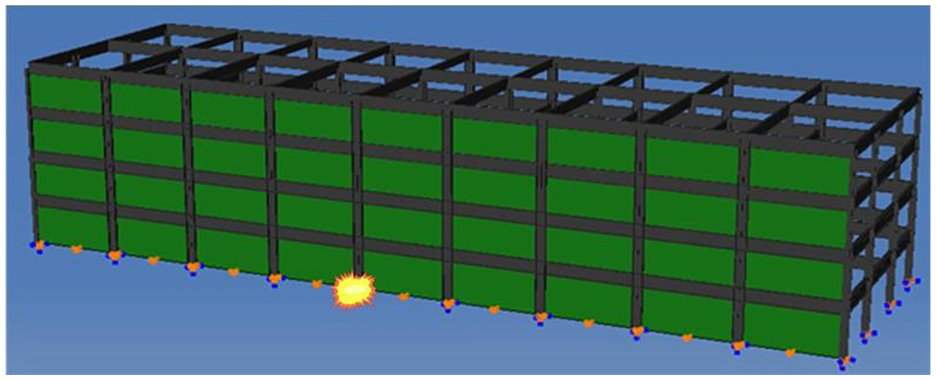
Simulated blast location.
Once the Abaqus blast simulation was completed, the maximum Johnson–Cook damage index per column was identified. The calculated damage indices were then used to create a post-blast numerical model in SAP2000, which incorporated the representative blast damage to the structure. In creating the damaged numerical model in SAP2000, if the maximum damage index of a column was below 10%, the damage was neglected due to its minor impact. If the maximum damage index was above 80%, the element was selected for removal. The damage to all of the columns with a maximum damage index in between 10% and 80% was incorporated into the damaged SAP2000 model, using equations (18) to (21). From the results of the blast simulation, the maximum damage indices of the columns 17, 22, 25, and 26 are between 10% and 80%, and the maximum damage index of the column 21 was over 80%, meaning that it was removed in the damaged SAP2000 model. The damage identified from the blast simulation is summarized in Table 4.
Damage in post-blast SAP2000 model.

Using the damaged SAP2000 structural model, the remaining elemental capacities were calculated using the adaptive AP analysis, with the removal of column 21 and additional identified damage in Table 4, to provide an assessment of remaining elemental capacities of the damaged post-blast structure. From the analysis, it was determined that the minimum remaining elemental capacity for the damaged structural model was 6.7%, occurring at element 25. The natural frequencies and mode shapes from the damaged SAP2000 structural model were then used for the numerical model updating.
Updated numerical model
Using the natural frequencies and mode shapes from the damaged SAP2000 structural model as the measurements, an updated numerical model was generated based upon the original structural model condensed to the displacement DOF using the methodology described in the “Two-phase damage localization and quantification” section, to represent the post-blast structure. A total of 38 modes were used as the measurements in the model updating, thereby attaining a modal participation factor over 90% to ensure accurate damage estimation (He et al., 2013). The maximum natural frequency utilized in the model updating was 38.27 Hz, and the modal participation ratio for the modes used in the model updating exceeded 92%.
The model updating was performed using the two-phase localization and quantification method developed by the authors. In the localization, a stiffness threshold of −0.1% was used, to reduce false positives due to the limited number of modes utilized. The quantification was performed using the previously described GA, using the parameters shown in Table 5.
Quantification GA parameters.
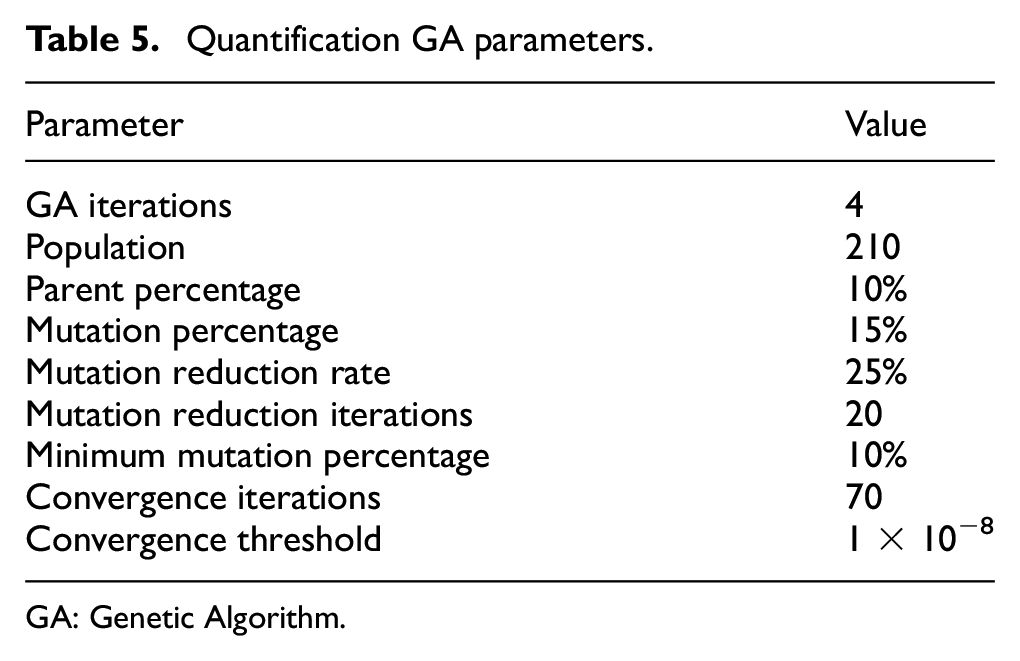
GA: Genetic Algorithm.
The results of the localization and quantification are shown in Figure 6. In total, seven columns were localized as potential damage locations (columns 17, 18, 21, 22, 25, 26, and 27). The estimated damage from the quantification is plotted above the damage locations, as the yellow bars. The corresponding actual damage from the damaged structural model is plotted in blue, next to the estimated damage. Columns 18 and 27 were falsely localized as damaged columns; however, the estimated damage at the false locations was minor, and the damage estimates at the actual damage locations were very close to the actual values, with the maximum difference between the actual and estimated damage being under 6.5%.
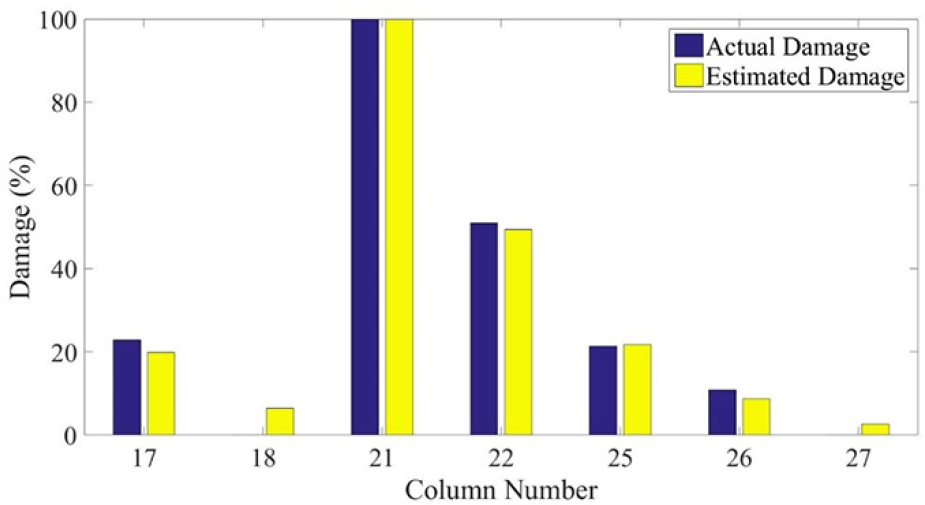
Quantified elemental damage.
In the model updating, the localized damage was well matched with the actual damage locations in the SAP2000 damaged model, and the estimated damage from the quantification produced values very close to the actual damage. The minor errors are likely due to the use of the reduced numerical model and the limited natural frequencies used in the model updating. Nonetheless, the model updating correctly identified column 21 as having failed as the estimated damage was at 99.99%, and the damage to the other columns was very accurate with the error between the estimated and actual damage for columns 17, 22, 25, and 26 being 3.01%, 1.58%, 0.38%, and 2.24%, respectively. The damaged columns were correctly localized from the damaged structural model, and their damage levels were successfully quantified. The adaptive AP analysis was then performed using the updated numerical model.
Adaptive AP analysis
In the previous section, the SAP2000 numerical model was successfully updated using the measurements from the damaged structural model. The updated numerical model was then used to calculate the remaining elemental capacities using the adaptive AP analysis. As the damage to column 21 was greater than 80%, it was removed in the adaptive AP analysis.
From the structural response after column 21 was removed, the remaining elemental capacity for each element where plastic rotation occurred was determined. The same procedure was used to calculate the remaining elemental capacities from the damaged structural model and original structural model with only column 21 being removed. The remaining elemental capacities from the updated, damaged, and original numerical models are shown in Figure 7, where the yellow bars represent the remaining elemental capacity calculated from the updated model, the blue bars represent the remaining elemental capacity calculated from the damaged model, and the red bars represent the remaining elemental capacity calculated from the original model with the removal of column 21. Figure 7(a) represents the remaining elemental capacities for the column elements, and Figure 7(b) represents the remaining elemental capacities for the beam elements. For the updated and damaged numerical models, the maximum difference between the remaining elemental capacities was under 3% occurring at element 17. The minimum remaining elemental capacity for the updated model was 7.03% occurring at element 25, which was the same element where the minimum remaining elemental capacity occurred for the damaged model with a remaining capacity only 0.33% higher. In comparison, while the original model produced accurate remaining elemental capacity estimations for the beam elements, no plastic hinges formed on the columns. With the inclusion of the damage, the columns showed the largest reductions in remaining capacity occurred, leading to the 74.19% difference between the minimum remaining elemental capacities between the original and the damaged models.
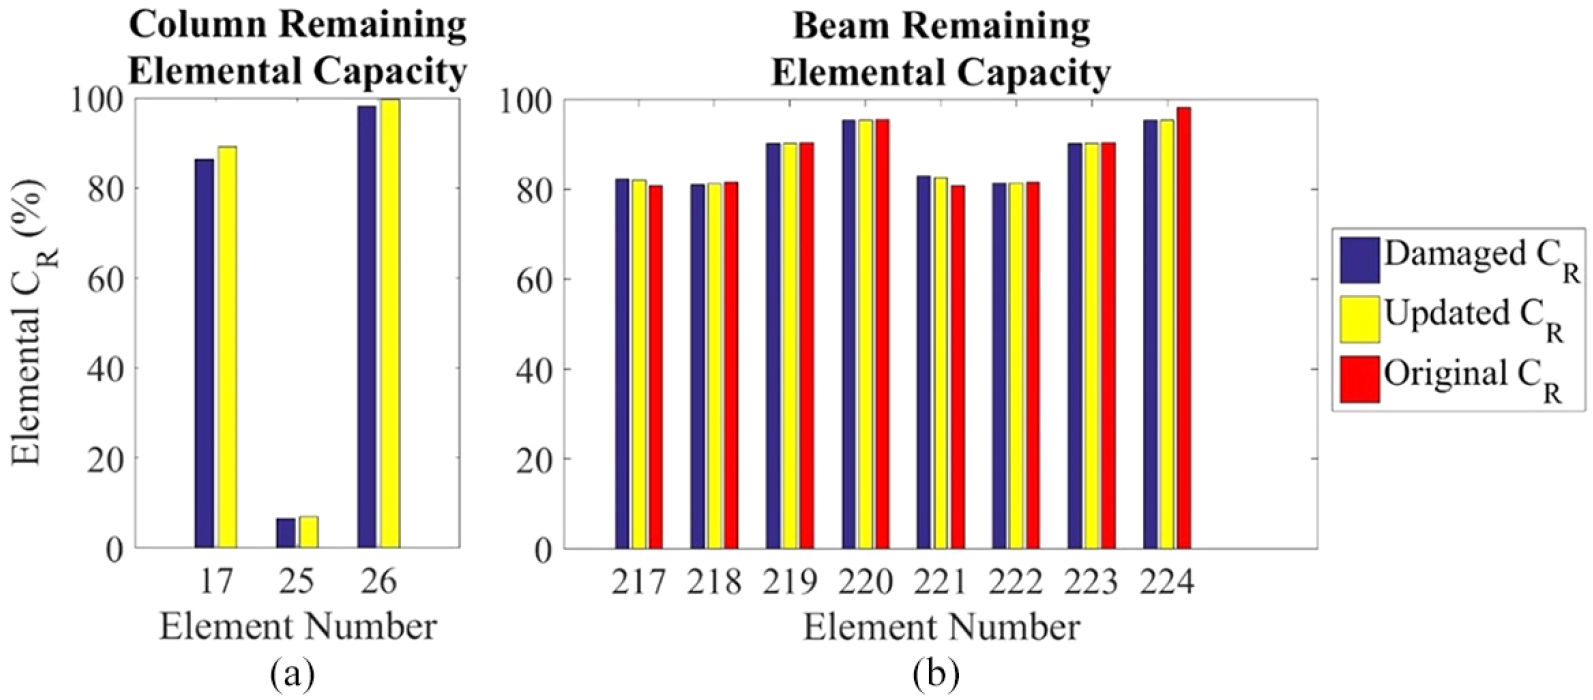
Remaining elemental capacities from damaged, updated, and original models: (a) columns and (b) beams.
The close match between remaining elemental capacities for the updated and damaged structural models, and the large difference between the minimum remaining elemental capacities for the original and damaged models, shows the benefit of using the updated numerical model to assess the structural condition of the post-blast building. The updated numerical model, generated using experimental measurements from the post-blast structure, can create an accurate estimation of the remaining elemental capacity of the building without requiring any information regarding the blast event itself. The estimated remaining elemental capacities from the post-blast updated model can provide accurate information on if a progressive collapse is imminent, which can be used by emergency responders and structural stakeholders to accurately determine safe courses of action after a blast, while limiting risk to themselves and the public at large.
Conclusion
This article presented a new post-blast structural assessment method, the adaptive AP analysis. The adaptive AP analysis is a threat independent method which can be used to estimate the remaining elemental capacity of a structure after a blast has occurred and determine whether a progressive collapse is likely to occur. The methodology utilizes numerical model updating to incorporate the damage to the structure into the AP analysis. The incorporation of damage from the blast into the analysis, beyond element failure, was shown to lead to significantly lower remaining elemental capacities. This was particularly true for ground floor columns and beams, which saw large reductions in the minimum remaining elemental capacity with the introduction of additional damage. Validation of the accuracy of the remaining elemental capacity estimation using the updated numerical models was performed, using damage determined from a numerical blast simulation. An updated numerical model of the post-blast damaged structure was then generated, using the two-phase damage localization and quantification methodology, and the adaptive AP analysis was performed. The low error between remaining elemental capacities from the updated model and the damaged model, and the large error in the column remaining capacity estimates between the original model and damaged model, shows how the incorporation of the updated model can provide an accurate assessment of the post-blast structure with significant improvements over the use of the original numerical model. The minimum remaining elemental capacities, determined using the adaptive AP analysis, can be used after a blast event to determine whether elements on the post-blast structure are near failure, which could signal an imminent progressive collapse. This information can be used to determine safe courses of action in terms of evacuation assistance and operation logistics after a blast, giving the emergency personnel the ability to engage in life-saving actions with the lowest risk to their own safety. Future recommended research on this topic includes using validated blast simulations to present more realistic damage scenarios, experimental validation of the adaptive AP analysis, incorporation of damage to the element connections and plastic deformations into the model updating, and modification of the adaptive AP analysis to provide a system-level analysis.
Footnotes
Acknowledgements
This material is based upon work supported by the Department of Education under the Graduate Assistance in Areas of National Need program (Award Number P200A140212, Program Director: Prof. Michael Accorsi). The generous support is gratefully acknowledged. The views and conclusions contained in this document are those of the authors and should not be interpreted as necessarily representing the official policies, either expressed or implied, of the US Department of Education.
Declaration of Conflicting Interests
The author(s) declared no potential conflicts of interest with respect to the research, authorship, and/or publication of this article.
Funding
The author(s) received no financial support for the research, authorship, and/or publication of this article.