




Abstract
The objective of this article is to present finite element modelling protocols and validation studies for the new cold-formed-steel-framed shear walls sheathed with steel sheet and gypsum boards. In this model, the nonlinear behaviours of the tapping screw connectors are represented by employing the ‘Pinching4’ material along with ‘zeroLength’ elements. The constitutive relationship parameters of the ‘Pinching4’ material were determined based on experimental data from the self-tapping screw connector shear test performed by the authors. The proposed procedure is implemented to generate the analytical specimens of seven full-scale cold-formed steel shear walls in the OpenSees platform. The load–deformation relationships, hysteresis curves and skeleton curves are compared with the test results performed by the authors. The results show that the finite element models can accurately simulate the shear characteristics of the new cold-formed steel shear walls. Finally, the effects of steel sheet thickness, stud thickness, sheathed material and height-to-width ratio of walls on the shear resistance were investigated.
Keywords
Introduction
Cold-formed steel (CFS) structure has been widely used in residential buildings due to its efficient fabrication, reduced site work, short time of construction and good structural performance (Liu et al., 2018; Yu, 2010; Yu and Chen, 2011). The CFS-framed shear wall with steel sheathing is the main load-bearing and anti-lateral force component of CFS building (Chen et al., 2019; Peterman and Schafer, 2014; Shakeel et al., 2019). Due to the complex construction of CFS shear walls, many experimental studies have been conducted to determine the shear performance of such shear walls. Tarpy (1980) first conducted experimental research on CFS shear wall. Tarpy performed a series of loading tests on CFS wallboards, and studied the effects of sheathing materials, configurations and anchoring methods on the shear capacity of the CFS wall. Through experimental research, it is found that the damage threshold load level is highly dependent upon the exterior sheathing. Therefore, extensive research studies on the influence of the sheathing material were performed (Abu-Hamd, 2019; Balh et al., 2014; Fülöp and Dubina, 2004; Mohebbi et al., 2015). The research studies found that double-layer sheathing can significantly improve the energy dissipation, shear strength and elastic stiffness compared to single-layer sheathing. Jiang and Ye (2018, 2019) studied the effect of the CFS shear wall on the seismic performance of steel-sheathed CFS buildings. The results showed that preventing buckling of steel sheets is an effective way to improve the seismic performance of structures.
Most scholars mainly study the mechanical properties of CFS shear walls, but steel is not a kind of fire-resistant material. The fire resistance limit of an unprotected steel structure is only 10–20 min (Ye et al., 2015). Therefore, the fire prevention of CFS shear walls is also especially important. Attari et al. (2016) and Lu et al. (2016) found that the fire resistance of CFS walls mainly depends on the wallboards on both side of the CFS studs. Therefore, the gypsum board is selected as the outer-layer wallboard in this study due to its good fire resistance.
In addition to the experimental investigation, numerical simulation and a simplified theoretical model are also important for studying the shear performance of CFS-framed walls (Selvaraj and Madhavan, 2019; Usefi et al., 2019). SAP 2000 software, ANSYS software, ABAQUS software and OpenSees software are the main platforms used by most scholars to build numerical models of CFS shear walls.
The main advantage of using SAP 2000 software to build models is its user-friendly graphical interface and its widespread use in civil engineering. Fiorino et al. (2018) presented detailed finite element (FE) models to simulate the nonlinear hysteretic behaviour of the CFS shear wall in SAP 2000 software. The use of link element in their study showed good performance. However, considering the whole response curves, the numerical predictions were not accurate due to underestimations of the dissipated energy. A more simplified modelling approach using an equivalent orthotropic shell element in SAP 2000 software was presented to simulate the behaviour of CFS shear wall sheathed by wood sheathing by Martínez-Martínez and Xu (2011). The overall mechanical behaviour of the shear wall is considered by adjusting the equivalent properties of the shell element. Zhou et al. (2010) developed a detailed FE model considering the geometric large deformation and materials nonlinearity of CFS shear wall with wood sheathing in ANSYS software. They compared performance of the models with the result of monotonic test on shear wall. In the study, they modelled the frame and sheathing with the shell181 element and used coupling methods to deal with the sheathing-to-steel connections that allowed only rotation in connections, restricting any translation.
In order to increase the accuracy of the simulation, some scholars have established detailed models using ABAQUS software or ANSYS software. Niari et al. (2015) presented detailed FE models for CFS shear walls with double-sided steel sheathing in ABAQUS software for simulating the monotonic response. The four-node S4R shell element with reduced integration was selected to model the CFS frame and sheathing, whereas steel sheet-to-panel connections were modelled with mesh independent fasteners, which were verified with the experimental result on individual connection test. Telue and Mahendran (2004) also developed a detailed FE model of CFS wall with wood sheathing in ABAQUS software. The ABAQUS four-node S4R5 shell with reduced integration was used to simulate the CFS frame, and the B31 beam elements were used to model the screws between tracks and studs.
The detailed FE models can simulate the dynamic response of CFS shear wall, but it cannot be used for whole building modelling due to their high computational complexity. Kechidi and Bourahla (2016) developed an equivalent truss model in OpenSees software for the CFS shear wall with steel sheathing and wood panel. They used the rigid truss elements in an X configuration with an equivalent simple nonlinear zeroLength element in the mid of truss elements having user-defined material to simulate the wall behaviour. The kind of modelling tip they used leads to a considerable reduction in terms of elements number of the CFS shear wall. The model simulates the response characteristics of the CFS shear wall, such as strength and stiffness degradation, as well as pinching effect. A modelling approach was presented by Shamim and Rogers (2013) for CFS shear wall with flat steel sheathing in OpenSees software. The nonlinear truss elements in an X configuration and an elastic wall frame were used to simulate the wall response under dynamic loading. In particular, the Pinching4 material (Lowes et al., 2003), which can model the pinched hysteretic response typical of CFS shear wall, was used in their studies. Their models were able to accurately reproduce the shear strength and displacement time history and hysteretic response of the dynamically tested shear walls.
To sum up, OpenSees software is an accurate and efficient computing platform for modelling the dynamic response of CFS shear walls. To analyse the shear behaviour of the new CFS-framed shear wall sheathed with steel sheet and gypsum boards (Feng et al., 2019), a numerical model is established in the OpenSees software (version 2.4.5) to simulate the hysteretic behaviour of the shear wall under a horizontal reciprocating load. The numerical analysis results are compared with the test results of seven full-scale shear wall specimens (Feng et al., 2019; Xu, 2017). Finally, the impact of the parameters of the shear wall on shear resistance is studied.
Test procedure
Test setup
The shear performances of seven full-scale CFS-framed shear wall specimens were tested in the Structure Laboratory of Southeast University (Feng et al., 2019; Xu, 2017). The test setup is shown in Figure 1.

Test setup.
The test setup consisted of a reaction frame, an electro-hydraulic servo program-controlled testing system and a data acquisition system. A 50-T hydraulic servo actuator was used for horizontal loading, and the horizontal loading was passed to the top of the shear wall through the top beam. The bottom loading beam was fixed to the ground using anchor bolts to prevent slipping of the bottom beam. The lateral roller supports on both sides of the top beam were used to simulate the constraints of the floor to the top beam and prevent out-of-plane instability of the shear wall.
Detail of test specimens
The details of test specimens and the loading methods used in the test are shown in Table 1.
Specifications of specimens.

S: steel sheet; G: gypsum board; C: cycle reciprocating loading; M: monotonic loading.
The form of no. is ‘height of the specimens-thickness of steel studs-thickness of steel sheet-loading type’; the size is ‘height × width’.
The typical construction of CFS-framed shear walls consists of C-shaped CFS frames nested in and screwed to U-shaped steel tracks at the top and bottom. A track is usually fastened to the structural slab with power-actuated fasteners (PAFs) and is used to align the vertical steel studs. The sheathed boards on both sides of the wall, which consist of a gypsum board on one side and a gypsum board (the surface layer) and a steel sheet (the bottom layer) on the other side, are attached to the steel studs and tracks with tapping screws placed at regular intervals (Figure 2). The purpose of this study is to develop a well-designed but computationally efficient procedure to model CFS-framed shear walls sheathed with steel sheet and gypsum boards. To this end, various combinations of materials and elemental specimens provided in the OpenSees library have been thoroughly studied.

Typical CFS-framed shear wall.
The proposed analytical model
FE method model
The FE models are based on the results of CFS-framed shear wall tests (Feng et al., 2019; Xu, 2017) and have been appropriately simplified, as shown in Figure 3. The specifications of the FE models are the same as those of the test specimens, as shown in Table 1. It is found from these tests that the out-of-plane deformation of the steel sheet of a shear wall can be suppressed by gypsum board, but the constraint is weak. In addition, the sheathed gypsum boards are broken due to cracking long before shear wall damage. Therefore, the external restraint of the gypsum board on the steel sheet and the in-plane stiffness of the gypsum board are simplified by setting the material constitutive relations of the screw connectors.

Finite element model.
Two rows of tapping screws with a spacing of 100 mm on the edge column of the specimen are simulated as one row of tapping screws with a spacing of 50 mm, and the screw connectors are simulated with a zeroLength element. The vertical steel studs are connected to the top and bottom beams by the anti-pulling parts at the corners of the shear wall so that the connections between the edged steel studs and the tracks are simulated as fixed joints. The connections between other steel studs and the tracks are simulated as hinge joints. The upper and lower tracks are, respectively, connected to the top and bottom beams by M18 fixing bolts. Therefore, the bottom track and the bottom beam are set as rigid connections at the bolts, that is, the relative displacement of the two members is completely limited. The top track is set as a rigid body.
Elements
The nodes are arranged at the joints of the tapping screws in the model. The steel studs and tracks are modelled using ‘displacement-based beam’ elements, which are connected to each other by nodes. The ‘ShellMITC4’ four-node element is used to model the steel sheet. Due to the bilinear isoparametric formula combined with the modified shear interpolation method, the simulation effect of the bending behaviour of the thin plate is improved. The shell element with ‘J2 Plasticity’ material is used to simulate the steel sheet. The zeroLength element connects two nodes, one on the steel stud and the other on the steel sheet, to simulate self-tapping screws. The tapping screws at the connections between the steel studs and steel sheets on both sides are simulated by two zeroLength elements to link one node on the steel stud to two nodes on both sides of the steel sheet, as shown in Figure 3.
Materials
Steel
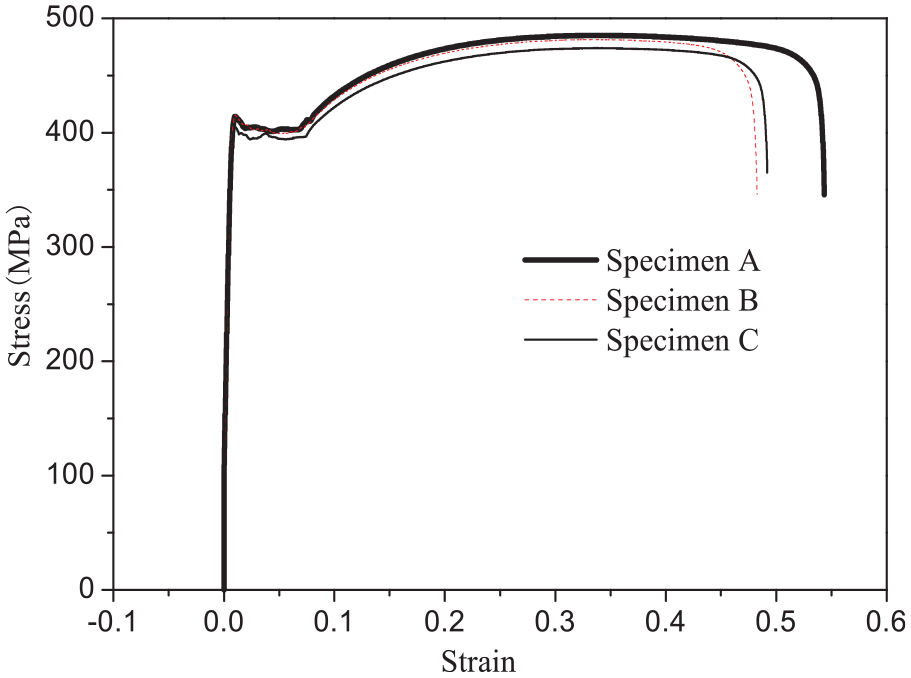
The material properties of Q345 CFS are based on previous test results (Ye et al., 2013), as shown in Figure 4. The shell element is used to simulate the steel sheet, and the J2 Plasticity material with a simple elastoplastic constitutive relation is adopted. The material meets the Von Mises yield criterion and isotropic strengthening principle. The elastic modulus is 2.04 × 10⁵ MPa, the yield strength is 336.9 MPa, the ultimate strength is 447.3 MPa and the Poisson ratio is 0.3.
Stress–strain curve of Q345 steel.
Material of self-tapping screws
The nonlinear behaviours of tapping screws are represented by employing the constitutive relations of Pinching4 material, which enables the simulation of complex pinched force hysteresis responses accounting for degradations under cyclic loadings. As shown in Figure 5(a), the constitutive relations include the skeleton envelope curve, unload–reload path and failure criterion, wherein the skeleton envelope curve is multilinear and the unload–reload path is tri-linear. Sixteen parameters describe the skeleton curve in the positive (ePdi and ePfi) and negative (eNdi and eNfi) directions. If the skeleton curves in the positive and negative directions are assumed to be symmetric, only eight parameters need to be defined. As shown in Figure 5(a), these eight parameters are determined by the test results of the tapping screws derived at Southeast University (Ma, 2018), where ‘1’ is the elastic point, ‘2’ is the yield point, ‘3’ is the peak point and ‘4’ is the failure point. The unload–reload path of the constitutive relations of Pinching4 requires six parameters. If the paths of forward and reverse loads are symmetric, only three parameters need to be defined, including the ratio of reloading/maximum historic deformation rDisp (P–N), the ratio of reloading/maximum historic force rForce (P–N) and the ratio of negative (positive) unloading/maximum (minimum) monotonic strength uForceP (N). In addition, the energy dissipation and damage types of the constitutive relations need to be determined by two parameters.
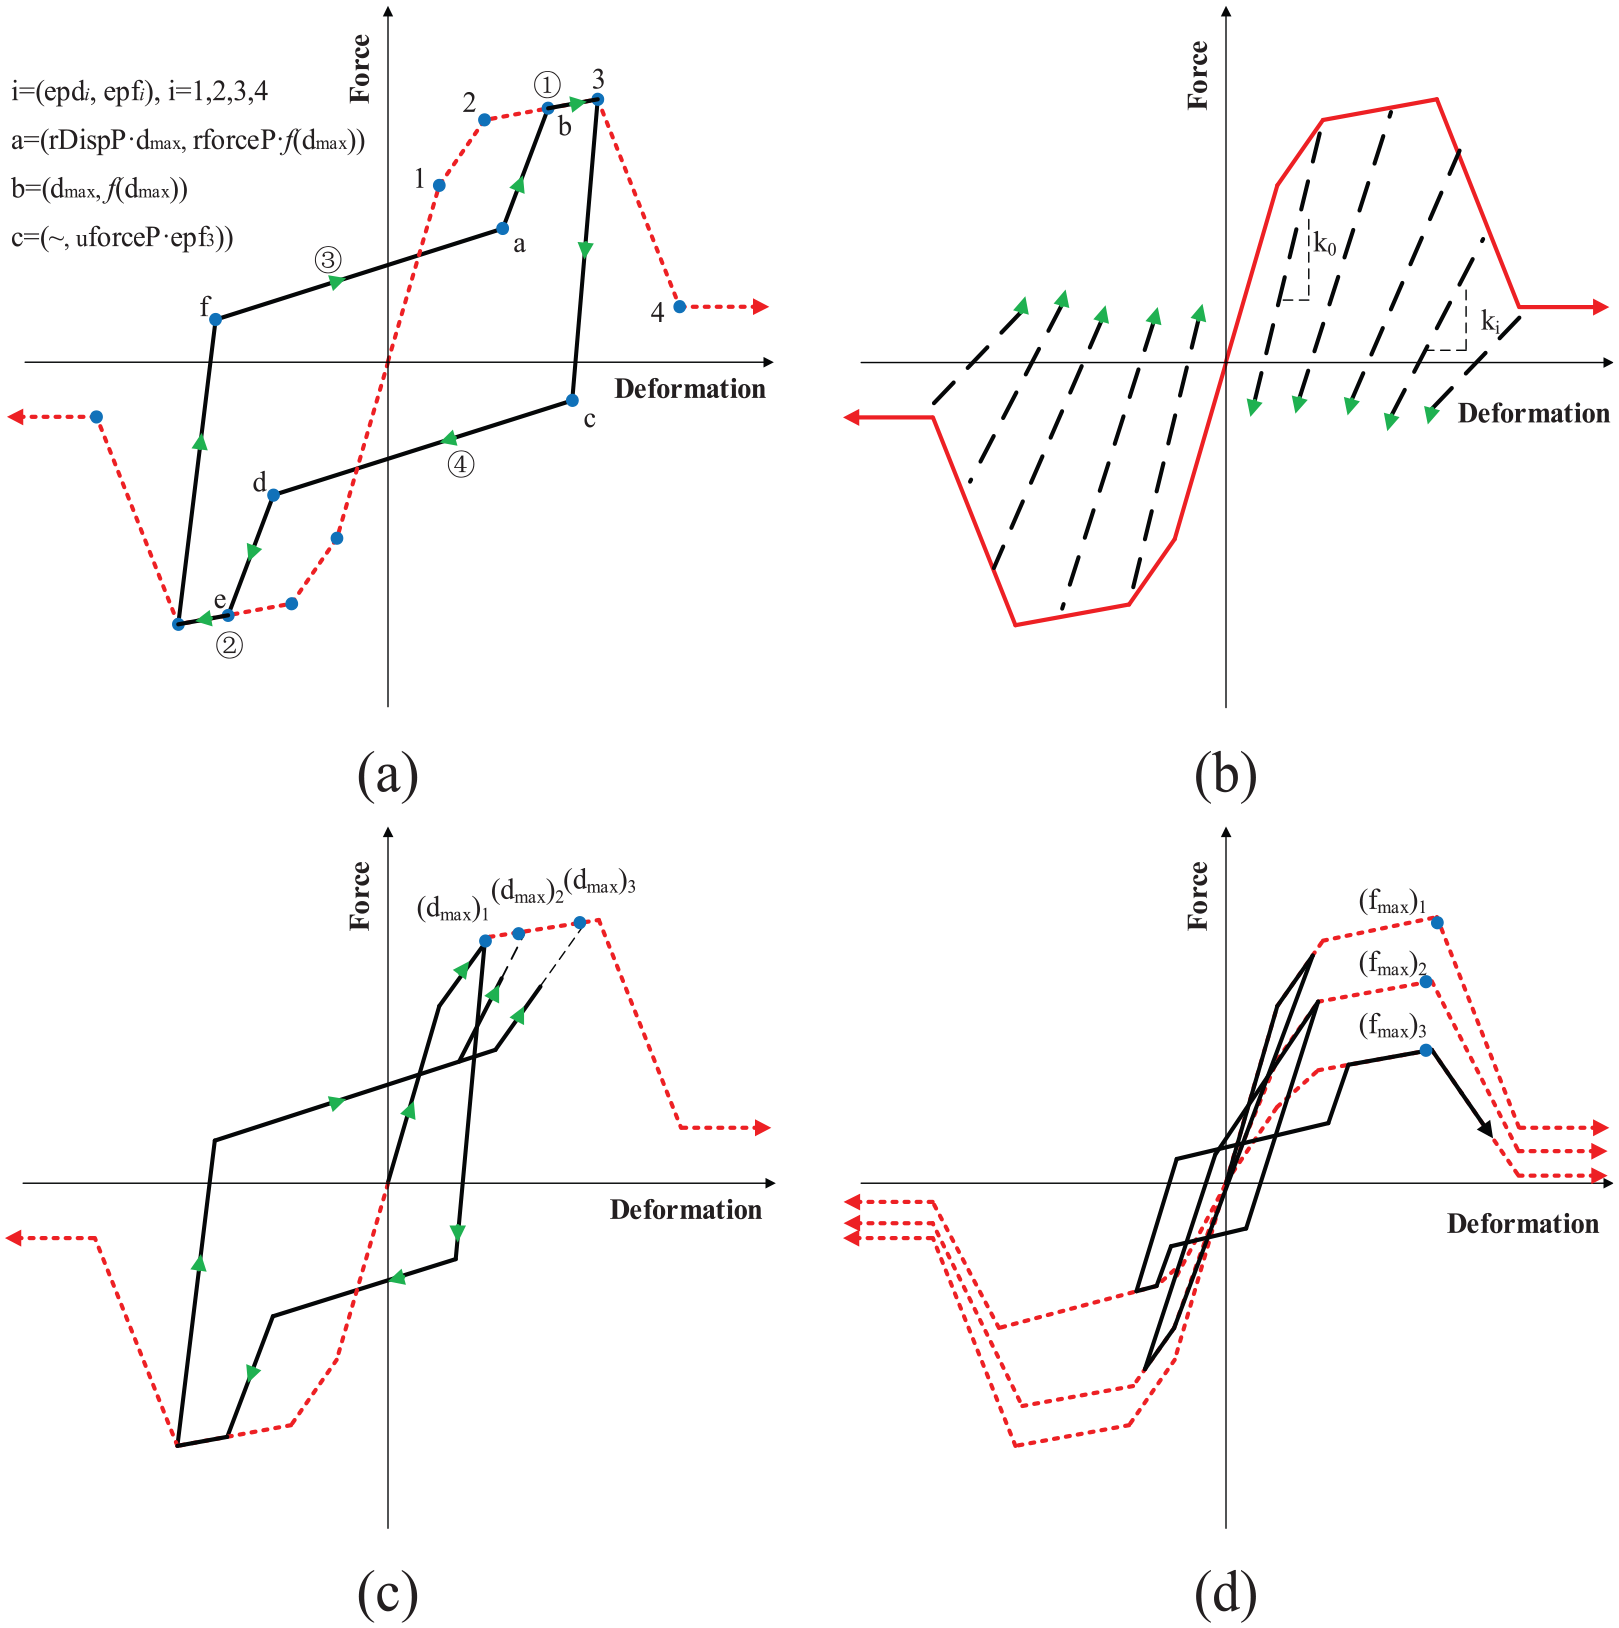
Material constitutive relations of Pinching4: (a) skeleton curve and unload–reload path, (b) unloading stiffness degradation, (c) reloading stiffness degradation and (d) strength degradation.
The definition of the failure criterion in the constitutive relations of Pinching4 materials includes unloading and reloading stiffness degradation as well as strength degradation, as shown in Figure 5(b) and (c). A total of 15 parameters are used to describe the failure criterion, which assumes that the stiffness and strength are degraded depending on the loading history. The formulas for the unloading stiffness, reloading stiffness and strength deterioration are as follows



where



where
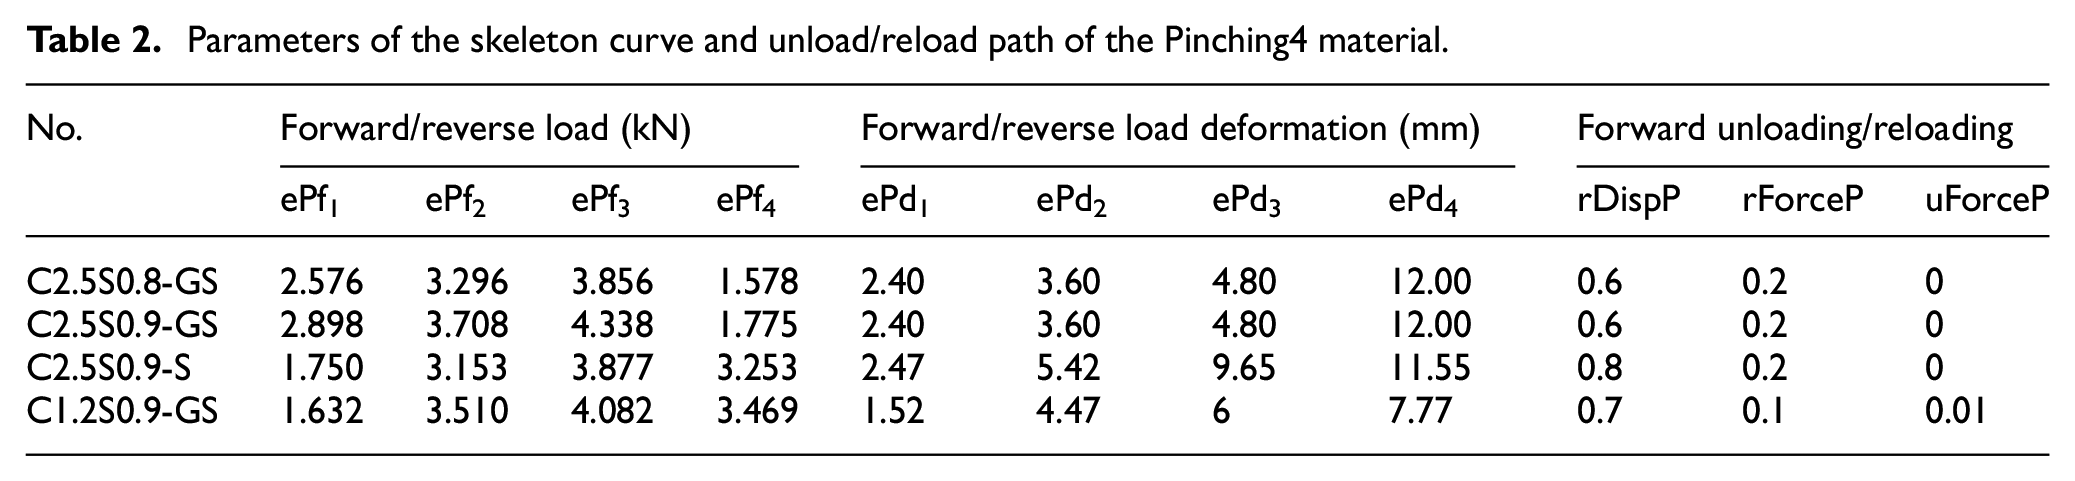
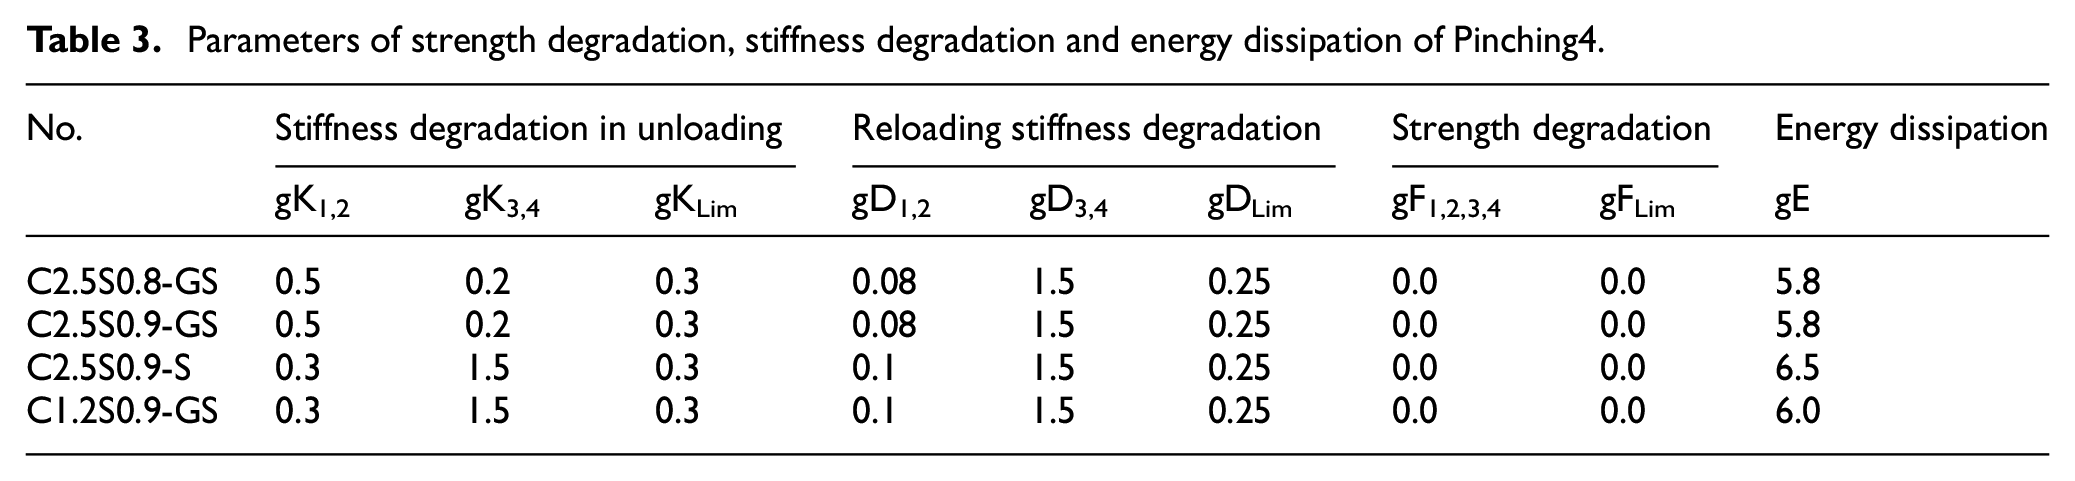
The parameters of the Pinching4 material constitutive relations of the self-tapping screw connectors with different specifications involved in the FE model are determined according to the experimental data (Ma, 2018). The constitutive relations of the self-tapping screw connectors are compared with the test results (Feng et al., 2019; Xu, 2017), as shown in Figure 6. Due to the defect of the test device, the steel sheet in the connector is subjected to different degrees of buckling under cyclic loadings, resulting in asymmetrical hysteresis curves. This defect is ignored, and it is assumed that the hysteresis curves of forward loading and reverse loading are symmetric. The comparison of the constitutive relationship of self-drilling connectors with the experimental data is shown in Figure 6. Since the shear test was not performed on the tapping screw connectors sheathed with a 0.9-mm-thick steel sheet, the load value is determined by multiplying the load value of the connectors sheathed with a 0.8-mm-thick steel sheet by 1.125, and other parameters are determined in the same manner. The constitutive relations of each connector are shown in Tables 2 and 3, where ‘Cxx’ represents the thickness of the steel studs and track and ‘Sxx’ represents the thickness of the steel sheet. ‘G’ refers to the gypsum board, and ‘S’ refers to the steel sheet. For example, ‘C1.2S0.9-GS’ represents a self-tapping screw connector with 1.2-mm-thick steel studs and tracks, a 0.9-mm-thick steel sheet and a 12-mm-thick gypsum board. It is worth noting that due to the defects of the test setup, the steel sheet of the connectors will be subjected to different degrees of buckling under cyclic loading, resulting in asymmetrical hysteresis curves. However, in this article, this defect is ignored, and the hysteresis curves of forward loading and reverse loading are assumed to be symmetric.
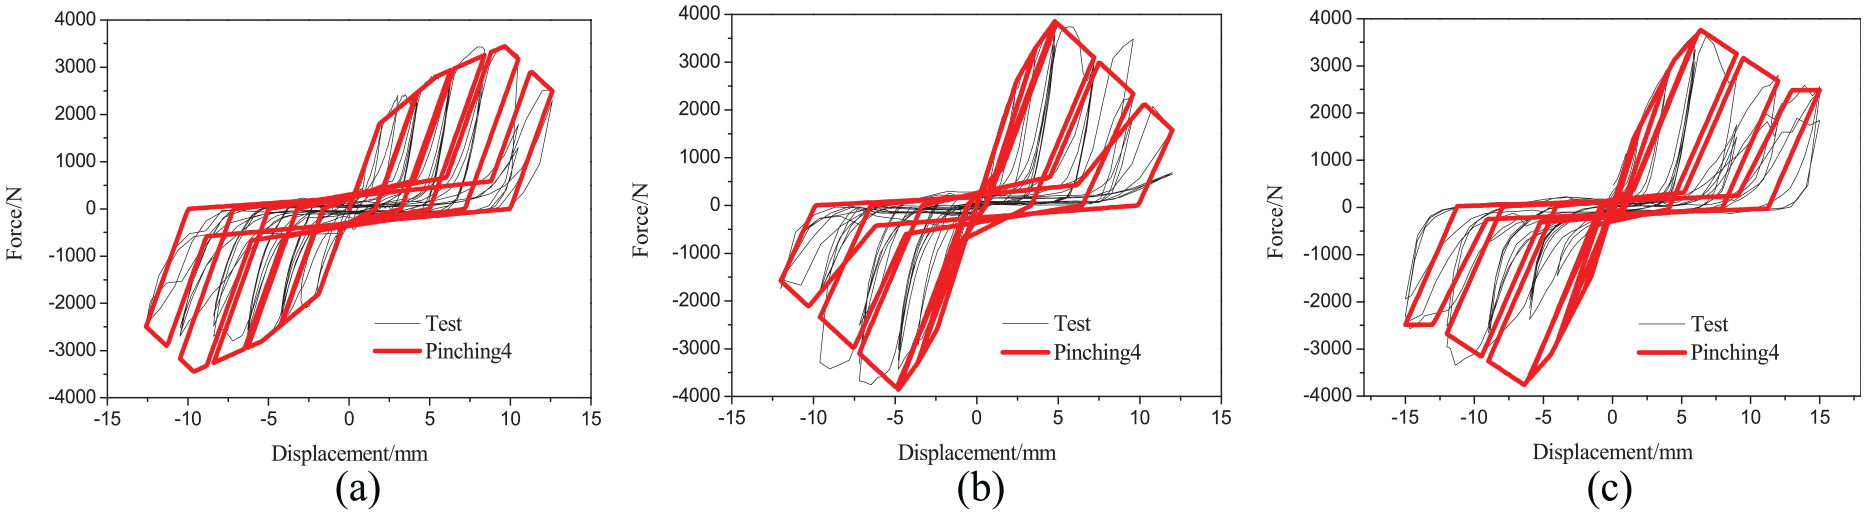
Hysteretic data and Pinching4 constitutive relations: (a) D-150-C2.5V25CLS8G12-0G2S, (b) D-150-C2.5V25CLS8G12-2G2S and (c) D-150-C1.2V25CLS8G12-2G2S.
Parameters of the skeleton curve and unload/reload path of the Pinching4 material.
Parameters of strength degradation, stiffness degradation and energy dissipation of Pinching4.
Boundary conditions and loading
As shown in Figure 3, the nodes on the tracks and steel studs are restricted such that they cannot deform in relation to the Z axis and cannot rotate in relation to the X and Y axes. Therefore, the tracks and steel studs will have only in-plane deformation. However, the nodes on the steel sheet are not constrained to ensure their free deformation. All degrees of freedom of the nodes at the fixed point of the bottom track are constrained. The tracks-to-steel studs fixed connections are defined by coupling all the degrees of freedom of two nodes on the tracks and steel studs, and the tracks-to-steel studs hinge connections are defined by coupling two nodes along the X and Y directions. The top track is defined as a rigid body, so the nodes on it are coupled to the loading points along the X and Y directions. The cyclic displacement loads are applied at the loading point, which is located at the end of the top track, and the direction of the load is parallel to the X direction. In the programme, cyclic loading is applied by inputting the displacement of each order.
Data processing
Since there is no visual interface for preprocessing and post-processing, it is inconvenient to analyse and process data using the OpenSees software. Therefore, the hysteresis curves and skeleton curves of the shear wall are obtained by outputting the data of the horizontal loads and displacements of the loading points and then processed by the OriginLab software. Since the load–deformation curves of the tapping screws obtained in the test (Ma, 2018) do not have a distinct yield point, the feature points and characteristic parameters should be obtained according to Specification of Testing Methods for Earthquake Resistant Building (JGJ 101-96, 1996) as follows.
The parameters (Fy, δy, Fm, δm, Fu, δu and μ) used to characterize the typical load–deformation behaviour of the screw connectors are indicated in Figure 7, where Fm is the ultimate load, δm is the relative displacement corresponding to Fm, Fu = 0.85Fm is the destructive load, δu is the relative displacement corresponding to Fu, Fy is the yield load and δy is the relative displacement corresponding to Fy. The yield load Fy is determined as follows: a horizontal straight line labelled L1 is made through the highest point of the load–displacement curve, and a straight line labelled L2 is made through the coordinate origin of the load–displacement curve. Two areas denoted as S1 and S2 are surrounded by Line 1, Line 2 and the load–displacement curve. Make the areas of S1 and S2 equal by adjusting line L2, which intersects L1 at point A. A vertical straight line is made through point A, which intersects with the load–displacement curve at point B. The load corresponding to point B is the yield load Fy, and the corresponding displacement is the yield displacement δy. According to technical specification for low-rise cold-formed thin-walled steel buildings (JGJ 227-2011, 2011), Fs = Fm/L is the shear strength, where L is the width of the shear wall specimen. The ratio of shear strength to displacement angle when the specimen is moved to 1/300 rad is defined as the lateral stiffness of the shear wall specimen, which is termed K300.
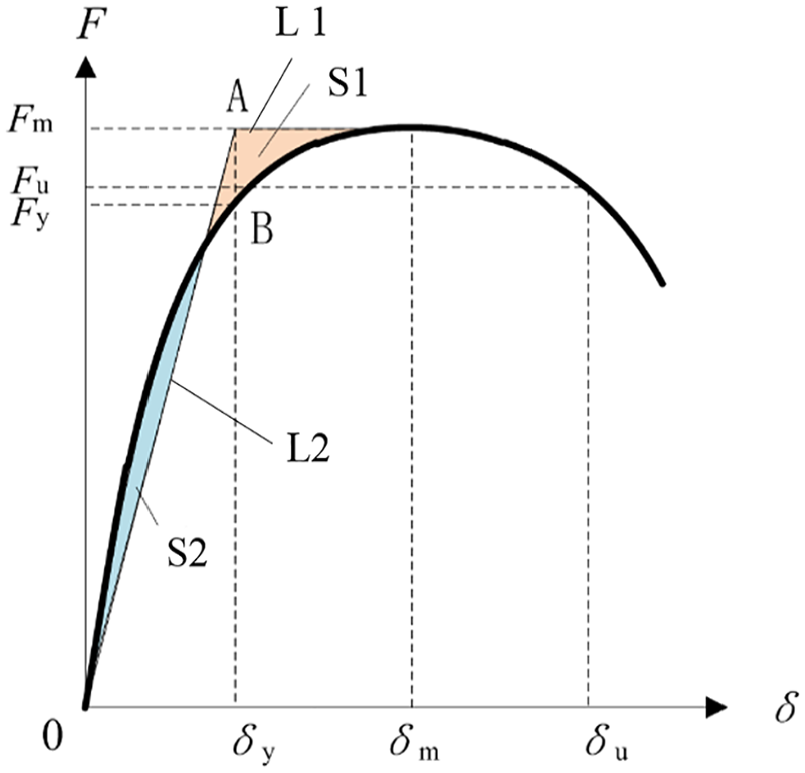
Parameters for load–displacement plot.
Analysis of results
The numerical simulation analysis results of the CFS-framed shear walls are compared with the test results, as shown in Figure 8. The data obtained from the skeleton curves are shown in Table 4.
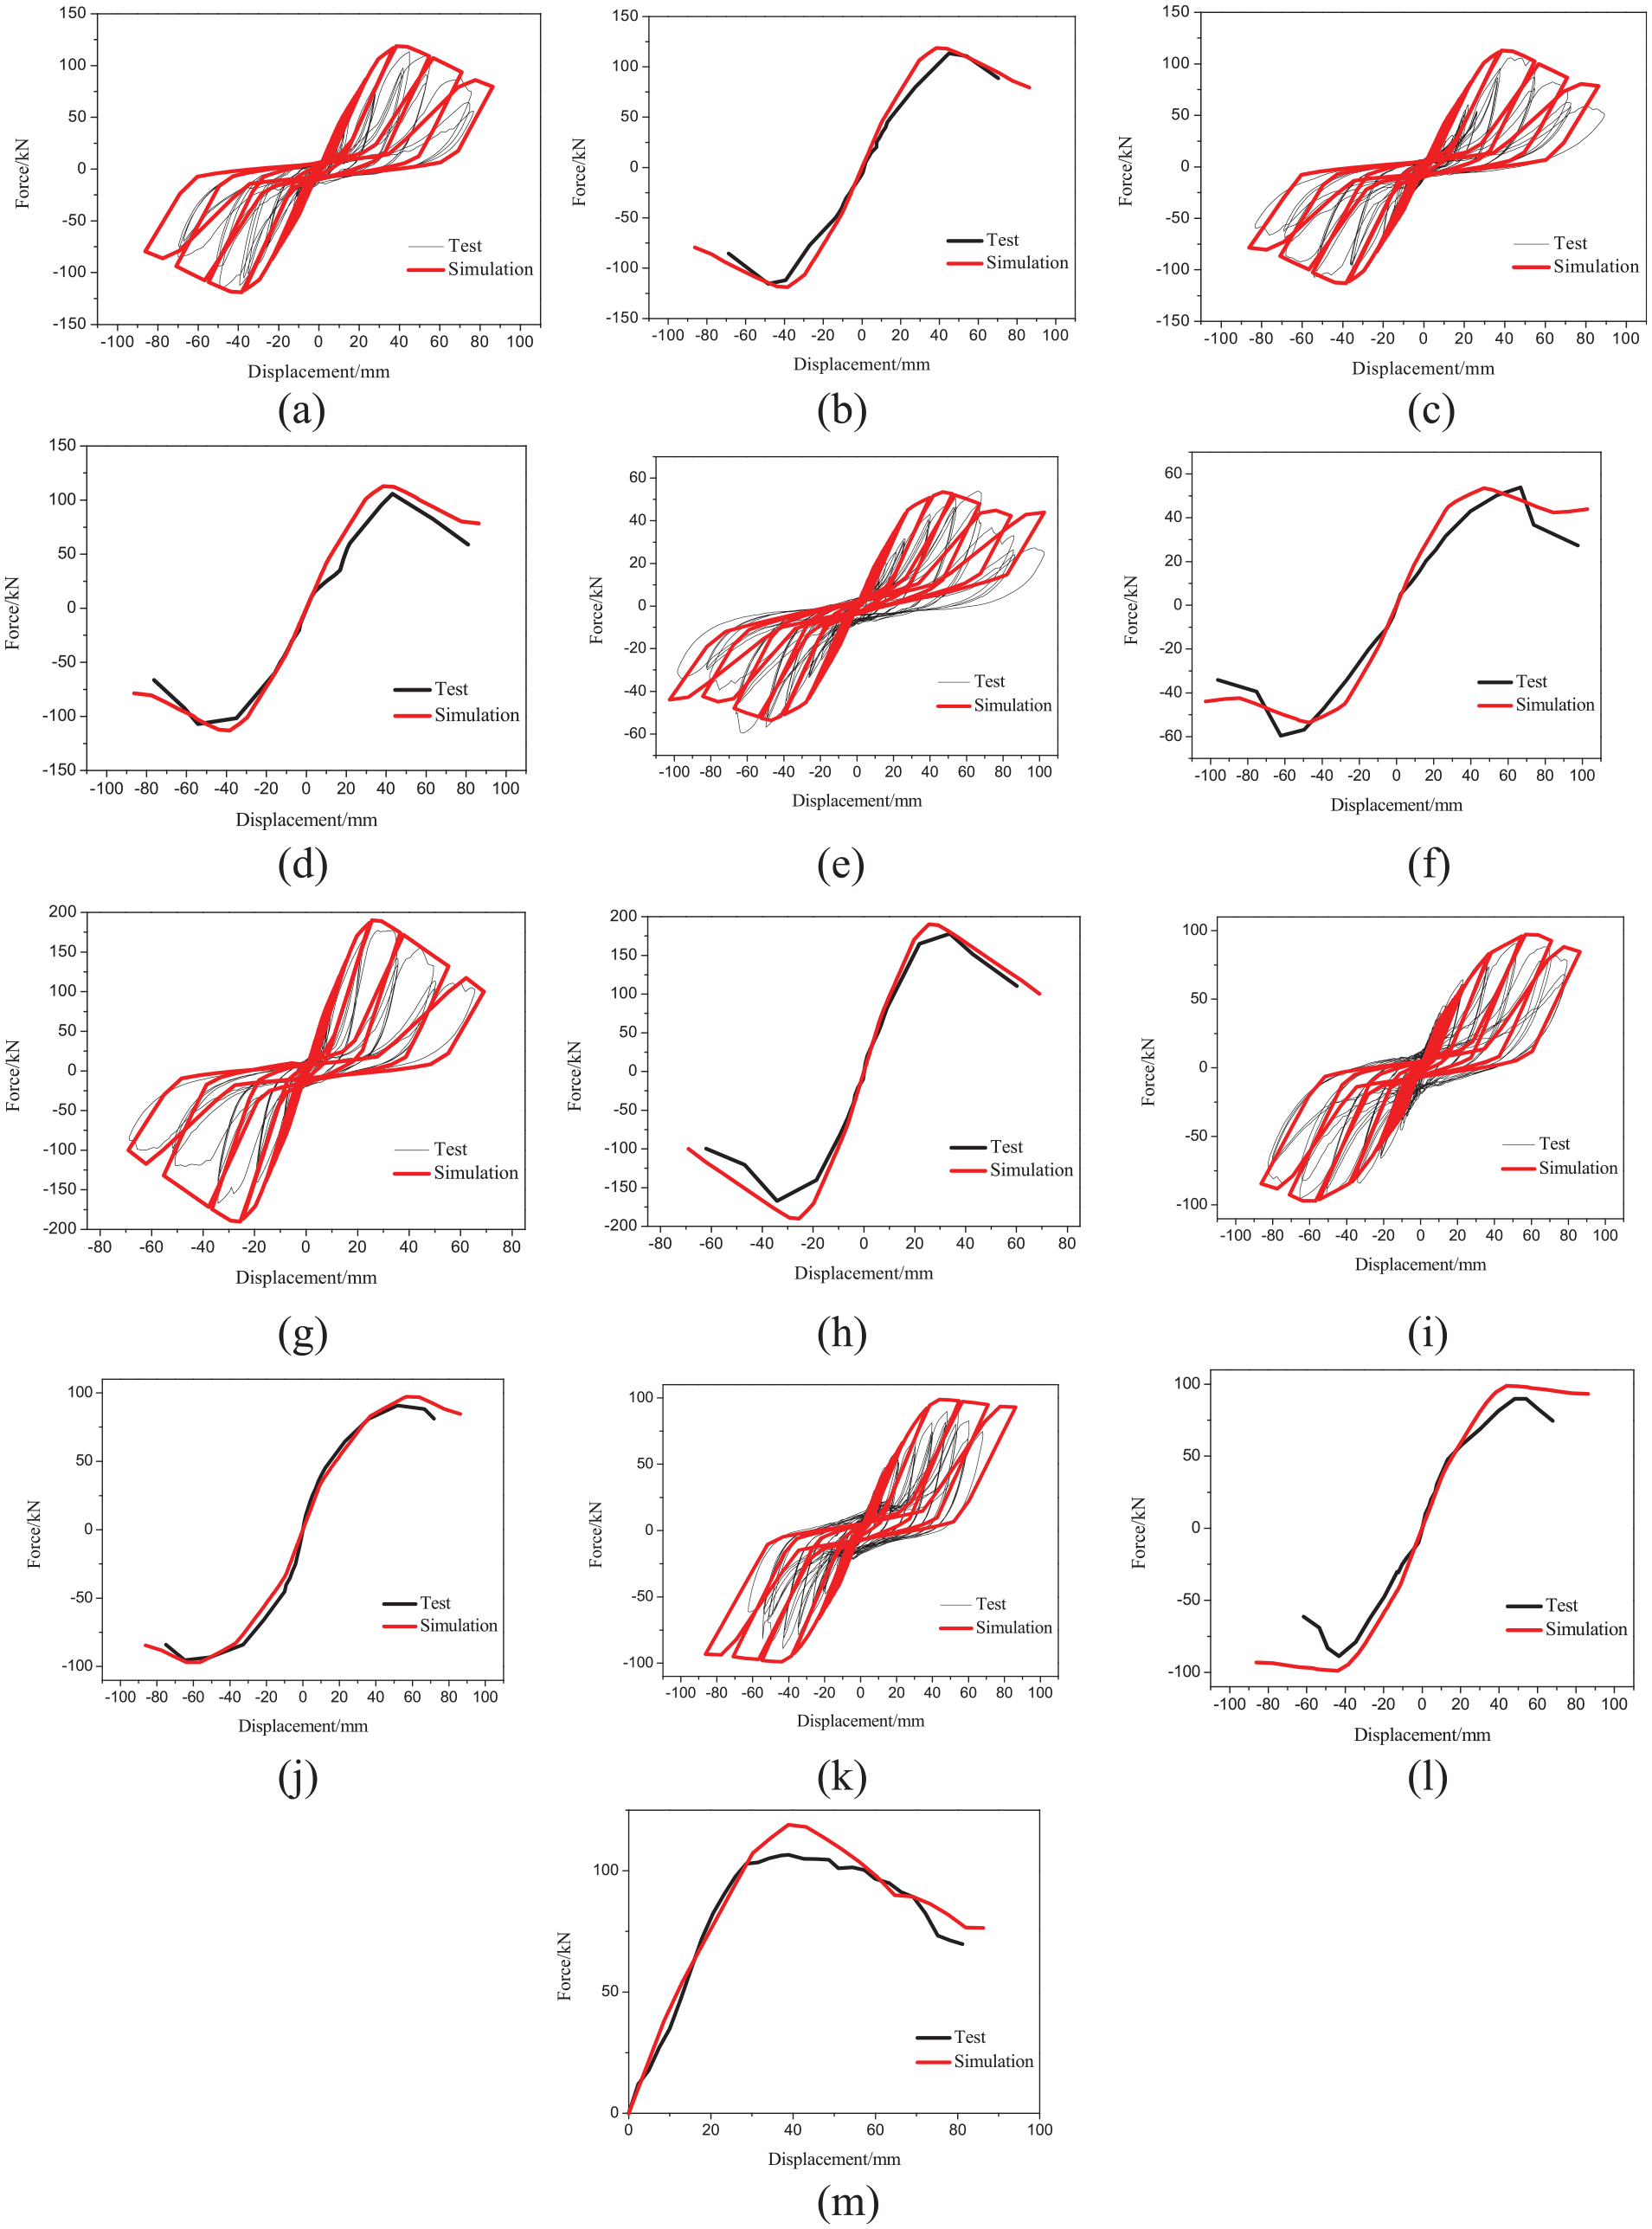
Load–displacement curves: (a) hysteretic curves of 24-25-09-C, (b) skeleton curves of 24-25-09-C, (c) hysteretic curves of 24-25-08-C, (d) skeleton curves of 24-25-08-C, (e) hysteretic curves of 12-25-08-C, (f) skeleton curves of 12-25-08-C, (g) hysteretic curves of 36-25-08-C, (h) skeleton curves of 36-25-08-C, (i) hysteretic curves of 24-25-09-C-S, (j) skeleton curves of 24-25-09-C-S, (k) hysteretic curves of 24-12-09-C, (l) skeleton curves of 24-12-09-C and (m) load–displacement curves of 24-25-09-M specimen.
Comparison of feature points of skeleton curves.

δy: yield displacement; Fy: yield load; δm: peak displacement; Fm: peak load; Fs: shear strength, K300: lateral stiffness; TR: test result; SR: simulation result.
It can be seen from Figure 8 and Table 4 that the hysteresis curves and the skeleton curves obtained by numerical simulation are consistent with the test results, showing obvious pinch effects and stiffness degradation. The ratio of the yield load from the numerical simulations to that of the test results ranges from 1.01 to 1.18, and the ratio of the peak load from the numerical simulations to that of the test results ranges from 0.99 to 1.11, which verifies the accuracy of the numerical simulation method.
In addition to the 24-25-09-C-S specimen, the loading stiffness of the numerical simulation of other specimens is larger than that of the test specimen, which leads to the difference between the numerical simulation and the test results. The ratio of the yield displacement of the numerical simulation to the test results ranges from 0.67 to 1.13, and the ratio of the peak displacement of the numerical simulation to the test results ranges from 0.71 to 0.89. In addition, the unloading stiffness of the FE model of the shear wall is different from the test results. This is because the unloading stiffness of the Pinching4 constitutive model, which defines the material properties of tapping screw connectors, is determined by the loading stiffness, not by the test. This leads to the unloading stiffness of the hysteresis curve of the connectors in the numerical simulation not being fully consistent with that of the test. The descending section of the skeleton curve of the numerical simulation results of the 24-12-09-C specimen is smoother than that of the test results. This is because the material constitutive relation of the C1.2S0.9-GS connector used in the model has relatively small failure displacement and a large failure load.
As shown in Figure 9, it can be found that the shape of the last two hysteresis curves is different from the shapes of previous hysteresis curves. In the process of reloading, the hysteresis curve is basically a straight line from the reloading point to the peak point in the penultimate hysteresis loop, while the stiffness of the hysteresis curve suddenly decreases in the last hysteresis loop. The reason is that during the reloading process, the stress of the steel sheet reaches the yield strength, which leads to a decrease in the overall stiffness of the shear wall specimen.
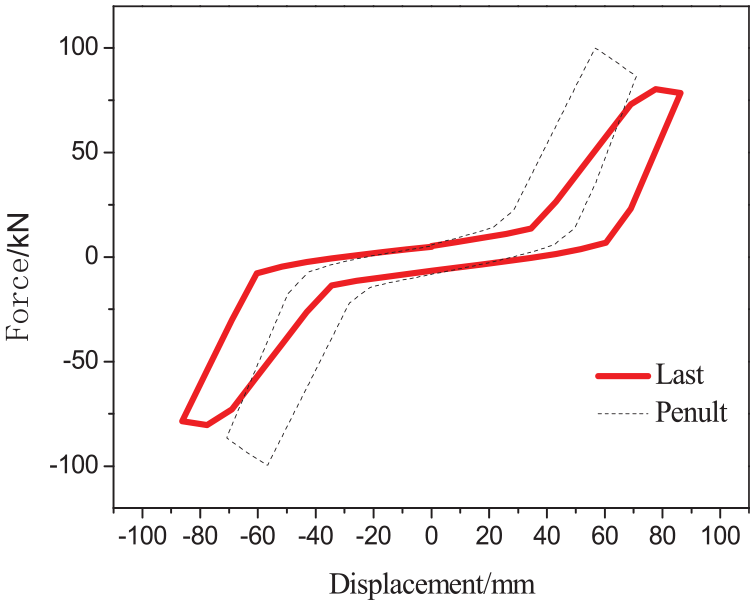
Comparison of hysteresis loops.
Analysis of influencing factors
To investigate the influence of the steel sheet thickness, steel stud thickness and height-to-width ratio of the shear wall on the shear performance, the skeleton curves of different specimens are compared.
Thickness of steel sheet
The skeleton curves of shear wall specimens numbered 24-25-09-C and 24-25-08-C are compared, as shown in Figure 10(a). With the thickness of the steel sheet increasing from 0.8 to 0.9 mm, the shear strength of the specimens increased by 11.5 mm, and the lateral stiffness increased by 6 mm. This shows that the shear performance of the shear wall can improve drastically by increasing the thickness of the steel sheet.
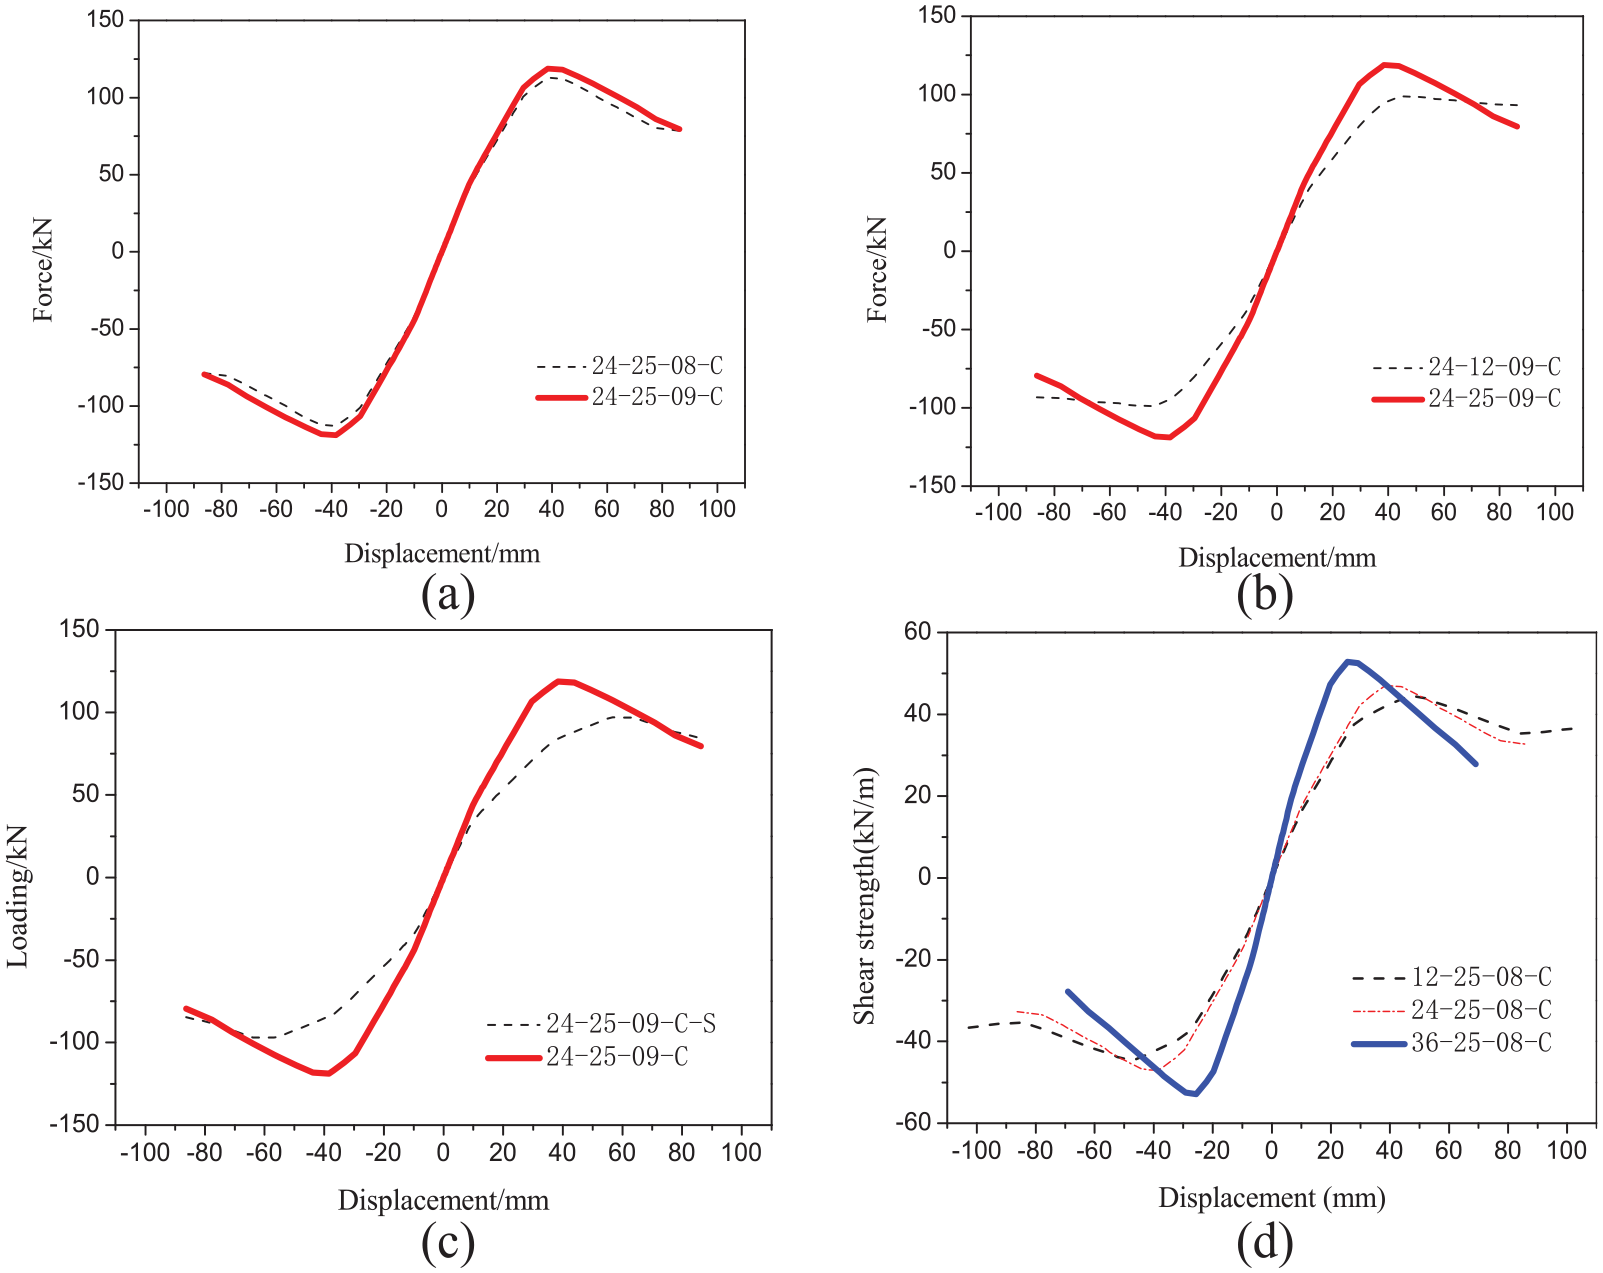
Skeleton curves of shear walls with different factors, (a) different thickness of steel sheet, (b) different thickness of steel studs, (c) different sheathed wallboard and (d) different height–width.
Thickness of steel studs
The skeleton curves of the specimens numbered 24-25-09-C and 24-12-09-C are compared, as shown in Figure 10(b). When the thickness of the steel studs increases from 1.2 to 2.5 mm, the shear strength of the specimens increases by 20.3%, and the lateral stiffness increases by 23.1%. Therefore, the shear performance of the shear wall can be improved effectively by increasing the steel stud thickness.
Sheathed material
The results of the skeleton curves of the specimens numbered 24-25-09-C (sheathed with steel sheet) and 24-12-09-CS (sheathed with steel sheet and plasterboard) are shown in Figure 10(c). It can be seen that the shear strength of the specimen sheathed with steel sheet and gypsum boards increased by 22.2%, and the lateral stiffness increased by 28.8% compared to that sheathed with a steel sheet.
Since the gypsum board is not directly simulated in the specimens, the effect of the gypsum board is reflected in the hysteretic performance of the self-tapping screw connectors. It can be seen that the gypsum board can improve the shear performance of the shear wall by affecting the performance of the connectors.
Height-to-width ratio
The shear strength curves of specimens 12-25-08-C, 24-25-08-C and 36-25-08-C are compared in Figure 10(d). It can be seen that the ratio of the shear strength of the three specimens is 1:1.05:1.18, and the ratio of lateral stiffness is 1:1.08:1.68. It is shown that as the height-to-width ratio decreases, the lateral stiffness and shear strength of the specimens increase gradually, which means that the shear properties of the shear walls are improved.
Conclusion
The FE model was proposed to simulate the shear performance of the new CFS-framed shear wall sheathed with steel sheet and gypsum boards in OpenSees software. The numerical simulation results are compared with the test results, and the influence of different factors on the shear performance of the shear walls is investigated. The conclusions are as follows:
The tapping screws are simulated by the zeroLength element with the Pinching4 constitutive relations, which can simulate the pinch effect and the degradation characteristics of the strength and stiffness.
The load–displacement curves of the numerical simulation are in good agreement with those of the test results. The obvious pinch effect and stiffness degradation phenomenon are shown in the hysteresis curves. Except for individual specimens, the error between the peak loads of the simulation results and the test results ranges from −10% to 12.9%, which shows the effectiveness of the numerical simulation method in this article.
The shear resistance of the shear wall increased with increasing thickness of the steel sheet and thickness of the steel studs, while the shear resistance of the shear wall decreased with increasing height-to-width ratio of the wall.
Footnotes
Authors’ Note
Ying Ma is now affiliated with Wuxi Vanke Co., Ltd., Wuxi, Jiangsu Province, China.
Declaration of Conflicting Interests
The author(s) declared no potential conflicts of interest with respect to the research, authorship and/or publication of this article.
Funding
The author(s) disclosed receipt of the following financial support for the research, authorship and/or publication of this article: This research was financially supported by the National Natural Science Foundation of China (grant no.: 51978151, 51538002), the Scientific Research Foundation of Graduate School of Southeast University (grant no.: YBPY1963), and the Priority Academic Program Development of the Jiangsu Higher Education Institutions (grant no.: CE02-2-5).
