
Abstract
In this article, the factors affecting the friction coefficient between a box culvert’s sidewalls and surrounding soil and the box culvert’s mechanical behavior during the jacking process in construction were studied with an engineering example in Guangdong province, China. First, the principal factors that affected changes in the friction coefficient and its law were analyzed with self-development model testing. Second, in combination with 3D finite element simulation, both the stress and strain laws of a box culvert’s different parts were studied by considering changes in jacking distance, soil thickness, and drag reduction material. The results showed that with increasing jacking distance, both the curves of stress and strain on the roof and floor with jacking distance exhibited an “armchair” shape, while the web had a “trapezoid” shape as the box culvert was jacked into the subgrade. Both the thickness and characteristics of the cover soil on top of the box culvert had an essential influence on the stress and strain values of the box culvert’s structure. Water content’s effect on the friction coefficient decreased gradually when the water content exceeded its plastic limit. The optimal ratio of cement slurry to soil was approximately 1:4 in the project. It is also suggested that a paraffin and engine oil mixture can be used as a drag reduction material when jacking a box culvert.
Introduction
The underground facilities that are essential elements of urban infrastructures are used in a wide range of applications in underground structures, including subways and highway tunnels (Kunieda et al., 2014). As one type of underground structure, reinforced concrete (RC) box culverts are used widely as efficient and cost-effective drainage in expressways (Acharya et al., 2016a), and they often bear a combined load attributable to lateral and vertical earth pressure and vehicle pressure (Bennett et al., 2005). If the terrain an expressway traverses is relatively flat, the box culverts are buried at shallow depths. Their own weight and vertical and horizontal soil pressure and wheel loads are the major loads applied to a culvert (Acharya et al., 2016a).
The friction coefficients between a RC box culvert and a mixture composed of thixotropic slurry and clay have an important influence on the reasonable selection when planning jacking used to place a culvert. The amount of soil pressure on the RC box culvert depends on the physical properties of the surrounding soil and the friction coefficient between it and the soil (Xiao et al., 2005). Katona (1983) recommended a simple friction-contact element model that can simulate the frictional slippage between two bodies mating initially at a common interface, applied it to the buried culvert problem, and found that the model behaves properly. Feng et al. (2007) found that a mixture of paraffin and engine oil (PO) reduces the friction coefficient between the bottom of the box culvert and concrete slide plate effectively, and the amount of water in the soil surrounding the culvert has an effect on the friction between soil and the side wall of box culvert. Kang et al. (2008) discussed the frictional forces acting on the box culvert’s sidewalls and suggested that they should be considered when calculating stresses on the floor slab. Hong et al. (2015) suggested that the friction coefficient between a box culvert and surrounding soil increases as the soil’s water content decreases and recommended a mixture of paraffin wax-engine oil as a drag reduction material when jacking box culverts.
At present, the majority of existing studies has focused on the vertical earth pressure on a culvert installed under a high embankment. Zhang et al. (2015) studied the vertical earth pressure on a box culvert and suggested that its coefficient achieves its maximum value at a specific backfill height and then decreases with increasing height. Moreover, some researchers have addressed the variation in the vertical earth pressure on a box culvert with theoretical analyses or field tests. Dasgupta and Sengupta (1991) discussed the distribution of the vertical earth pressure on a box culvert with a combination of numerical simulations and a field test. Bennett et al. (2005) reported that vertical earth pressure is associated with the height of the backfill based on the vertical load on a concrete box culvert. Weng et al. (2008) researched the variation in vertical earth pressure on a culvert with a high embankment using a centrifugal model test.
As box culverts are backfilled with soil, the stress and deformation of structural concrete has to be considered. Acharya et al. (2016b) investigated the vertical pressure on a low-fill culvert roof under static traffic loading and found that the intensity of the vertical pressure on the top slab of a box culvert decreased gradually with an increase in the concrete pavement’s thickness, fill depth, and culvert span, and the span’s influence was greater at a greater fill depth (You et al., 2001). Kang et al. (2008) investigated the effect of the significant forces and found that act on a box culvert’s sidewalls, but the culvert’s bottom slab had little effect. The structure of RC box culverts consists of top and bottom slabs and sidewalls. The sidewalls are designed usually to resist bending deformation attributable to the combination of axial thrust and the vertical loads and shear associated with the lateral loads, while the top and bottom slabs are designed to resist the bending moment with large shears attributable to vertical loads (Maekawa et al., 2016). Previous research has shown that the safety factor against failure in shear is greater than that in flexure (Laupa et al., 1954). Most current research has been confined to the mechanism of a RC box culvert’s shear failure. Yee et al. (2004) investigated the shear behavior of a precast RC box culvert, and the results revealed that the analytic methods they developed could be used to predict the dynamic load distributions. The results suggested as well that the analytic methods used yielded reasonable predictions of moment distributions. Based on the investigations mentioned above, Garg et al. (2007) summarized a system to predict a concrete box culvert’s failure behavior attributable to shear force. Garg AK, et al. (2007) assessed the shear capacity of precast RC box culverts when load was applied at the free spigot end and suggested that free culvert ends are adequate in shear without the use of edge beams. Garg and Abolmaali (2006) investigated the shear behavior of single- and double-orifice RC box culverts with a small span using full-scale tests, and their results showed that failure cracks in the box culvert are triggered by the combined effects of expansion of shear cracks and bond and arching actions.
The excessive deformation of RC box culverts overburdened because of shallow soil affects their normal function adversely. Frederick and Tarhini (1989) discussed the strain distribution and deflections of RC box culverts under highway loading by testing scale models. The strain variation across the width of the box culvert slab was nearly uniform, and the top slab behaved similarly to a wide beam. Boulanger et al. (1989) investigated the influence of factors such as span and thickness of overburden on the design requirements of nondeformed and deformed box culverts. The factors included largely load-induced deformations, in-place deformed geometries, and recent improvements. Kunieda et al. (2014) evaluated the mechanism of long-term excessive deformation of shallow RC box culverts and suggested that increased vertical earth pressure on the top of the culverts may accelerate long-term deformation. Acharya et al. (2016a) investigated the deflections of a low-fill culvert roof under roadway sections of concrete pavement, concrete shoulder, and unsurfaced fill comprehensively with a quantitative study and field study of a low-fill box culvert and suggested that the culvert’s deflection beneath the pavement section was one-third to one-half times less than that beneath the unsurfaced section.
The stress–strain behavior of a low-fill box culvert structure during the jacking construction process is complex and demonstrates varied performance in different parts of the culvert (top and bottom slabs and sidewalls) along the direction of jacking attributable to the influences of jacking force, overburden pressure, and frictional resistance between the culvert and soil (Guo, 2014., Guo and Feng, 2018). The considerable deflections of the top/bottom slab and sidewalls have been proven to affect the load exerted on the top slab of a RC box culvert (Kim and Chai, 2006). However, their study focused on traffic loading and soil movement’s effect on a low-fill box culvert’s structure.
Kunieda et al. (2014) found that a culvert’s deflections are induced by traffic loading transferred onto the roof of a low-fill culvert, and the magnitude of the roof’s deflection increases from the concrete pavement to the concrete shoulder to unsurfaced fill. Acharya et al. (2016c) studied the deflections of a low-fill concrete box culvert under different combinations of static and traffic loads and found that the maximum deflections were 0.6 and 0.41 mm and the traffic load acted as a concentrated load distributed over a limited area on the culvert.
Pu et al. (2007) researched the stratum displacement during jacking construction of an over-sized shallow-buried box culvert based on a combined analysis and comparison of results measured on-site and with numerical simulation results and summarized the stratum movement patterns. Huang et al. (2009) analyzed soil displacement variation in the process of jacking on an over-sized shallow-buried box culvert and suggested that the mix settlement of the pavement does not follow the direction of the axis and is located on front of the excavating face. Dasgupta and Sengupta (1991) studied the effects of the soil–structure interaction on the pressure distribution on the top slab by conducting full-scale laboratory tests on RC box culverts and observed a reduction in the pressure.
In this study, a field test was conducted to measure the force and deflections of the different parts of a low-fill-RC box culvert under three conditions of static loads (different jacking distance, depth of cover soil, and drag reduction methods). On the basis of an example of a jacking project on a shallow soil covered, very long box culvert in Guangdong province China, the stress–strain on different parts and the influence of the range of box culvert jacking construction were analyzed via finite element numerical simulation under conditions of different jacking distances and soil thickness. This study summarizes the variation in the stress–strain of a RC box culvert as well as the variation in the friction coefficient between a box culvert’s soil matrix and sidewalls. The work above is unique, as it has been investigated rarely on the same box culvert as is presented in this article. Therefore, the study is expected to add new knowledge to the design and construction of RC box culverts under different conditions subjected to jacking loading.
Project
The project site is located on line K33 + 772, a highway culvert with a slope of 3‰ that is used for dredging flow. The area is hilly with a terrain that varies dramatically. The box culvert (shown in Figure 1) has a single hole with a rectangular cross section, a total length of 90 m, height of 2.2 m, base elevation of 1.0 m (with a 1.6 m × 1.5 m section size), 0.3 m roof, 0.4 m bottom plate, 0.3 m web, 0.15 m × 0.15 m chamber size, and 0.1 m × 0.1 m lateral cut angle. The average soil covering is 3.6 m. Jacking construction was used for this project because of its low cost, short construction time, and minimal effect on the surrounding environment. The working pit for jacking construction was 9.6 m long and 5.0 m wide. The side walls used mortar rubble M7.5, the back wall was C50-RC, and the gap between the back wall and the mountains was filled with M7.5 mortar rubble.
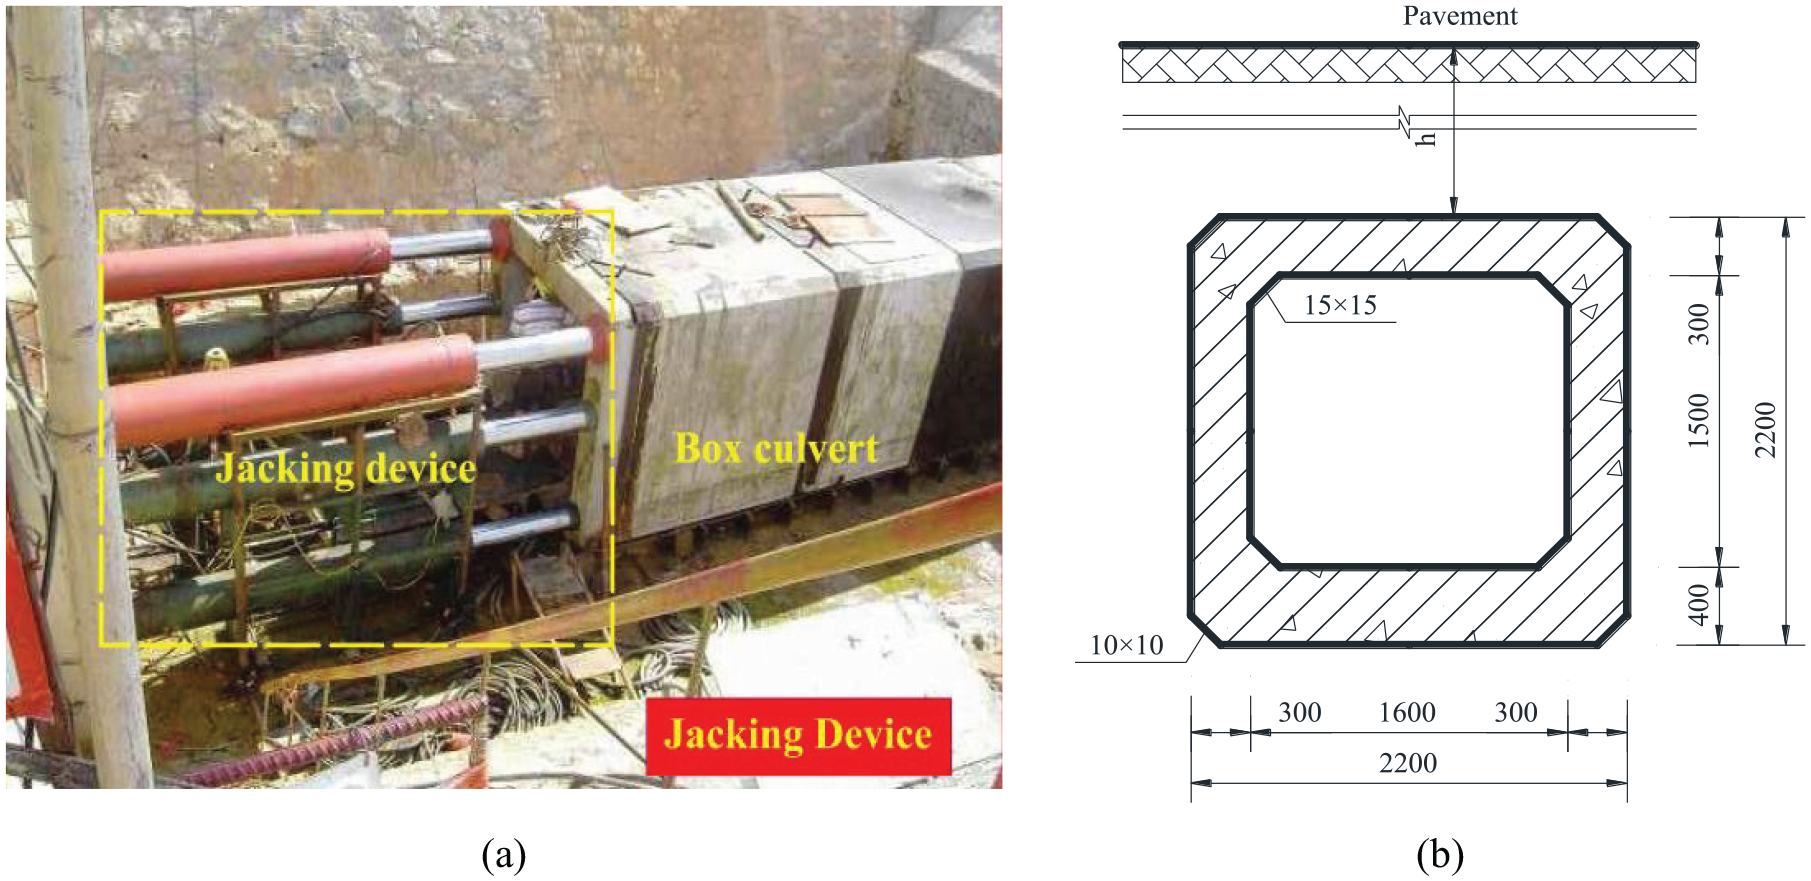
Combined with the jacking construction examples of the box culvert: (a) Based on project case of jacking box culvert. (b) Geometric size of the box culvert structure.
Test model design and finite element modeling
Test model device design
The test model was designed with the geometric similarity constant Cl = lm/lp = 1/5. The testing device (shown in Figure 2) consisted of an A specimen (shown in Figure 3(a)) made from steel mold-filled concrete with C50, the same as the actual engineering and B specimen (shown in Figure 3(b)) made from steel mold-filled soil with different water content and was designed to study the friction coefficient between the outer walls of the culvert and the surrounding soil. The load applied to the top and sides of the B specimen was provided by jacks installed in horizontal and vertical directions. The vertical loads applied to the specimen top were divided into four levels (20, 30, 40, and 50 kN) to simulate the earth pressure exerted on the culvert’s top and sides. A 50 kN horizontal load attributable to actual working conditions was applied to the specimen’s sides. The friction coefficient between the outer walls of the box culvert and surrounding soil was defined as the ratio of horizontal to vertical load measured in situ. In order to reduce the error of test data, three same specimens were made under each working condition.
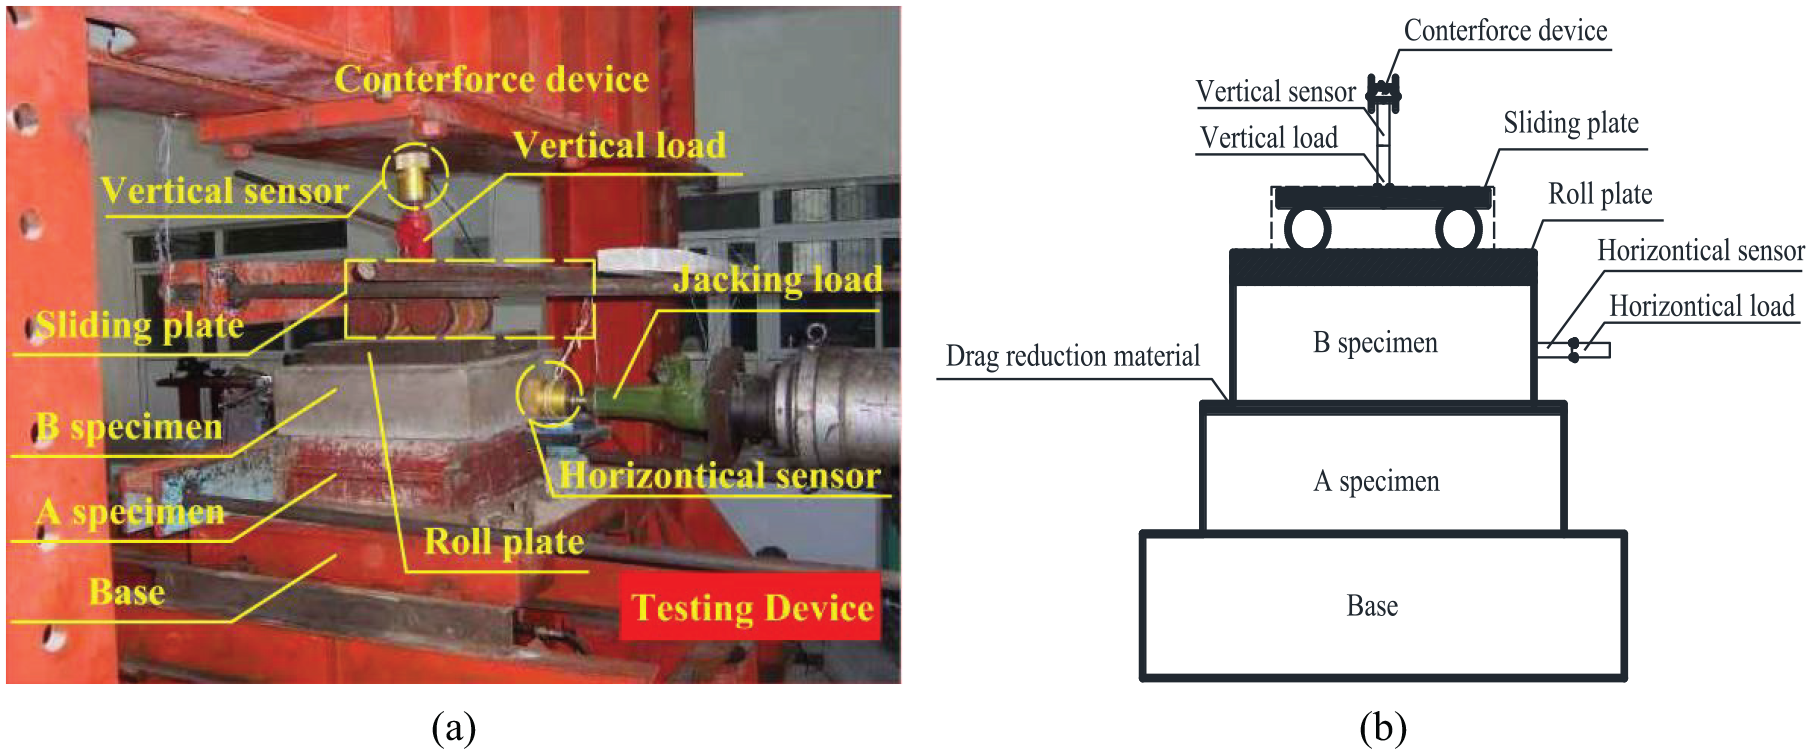
Test device design for the friction coefficient between the culvert and surrounding soil: (a) self-designed indoor model testing device and (b) working principle of testing device (Hong et al., 2015).

The test molds for making A and B specimens: (a) the mold for A specimen and (b) the mold for B specimen.
Test scheme design
As the culvert surrounding the soil is injected with different slurry, or the culvert sidewalls are brushed with different drag-reducing agents, the friction coefficient between the sidewalls and the soil differs significantly during the jacking construction of the box culvert, which Jing’s (2008) findings and this project demonstrated. The five test conditions shown in Table 1 were designed to analyze the variation law of the friction coefficient with the content of water and cement slurry in the soil and the friction factors influenced by drag reduction material types.
Test scheme of friction coefficient.
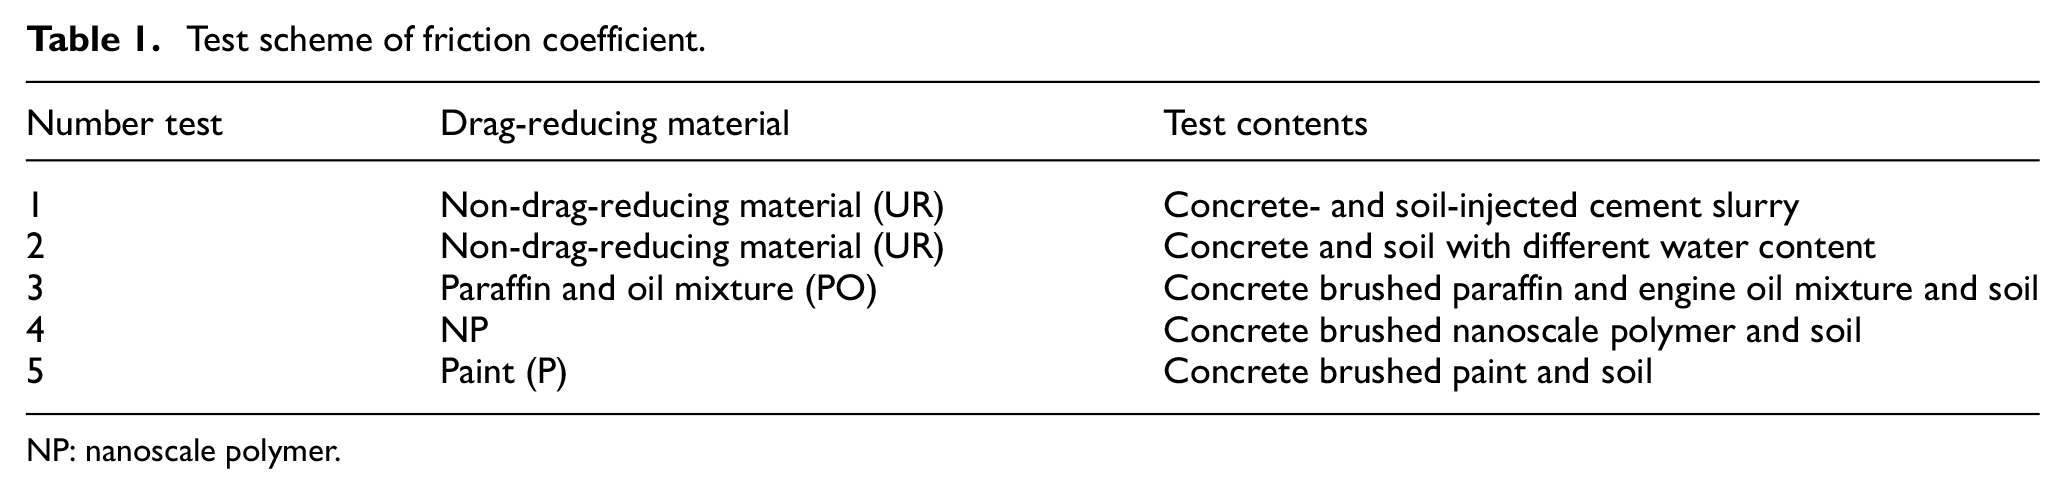
NP: nanoscale polymer.
Test program design
This article developed a specific study protocol for the test (as shown in Figure 4) and designed the test model carefully to avoid the effects on the test results of complex test procedures and using many instruments and to conduct the experiment smoothly and obtain precise test results.
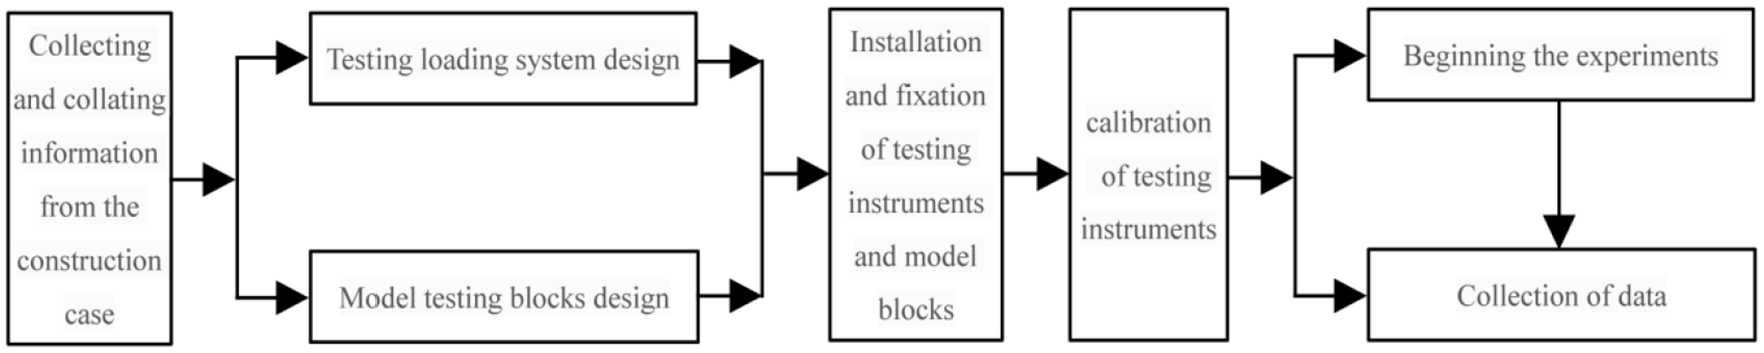
Test model program.
Establishing the finite element model
Based on both the box culvert’s stress and strain performance in this project during the process of jacking construction, the finite element model (FEM) of a shallow soil-buried and very long box was established by Marc finite element software, in which the culvert’s structure size is shown in Figure 1(b). The embankment’s upper width was 80 m, the slope 1:1.5, and the foundation depth was two times greater than the embankment thickness. Eight nodes of parametric solid elements were selected for the simulation model, and the contact units between the box culvert and the soil mass were made dense.
The box culvert and soil were combined to facilitate a reasonable interaction using the interface unit of Marc software to simulate the friction between the box culvert’s surface and the surrounding soil that resulted in a discontinuous contact model element between the two. In accordance with the actual situation, a 0.2 m displacement load was applied uniformly to the side end of the box culvert to simulate jacking the box culvert 0.2 m. The displacement of the front end of the culvert decreased with increased jacking distance from the box culvert, and the decrease was caused primarily by overcoming friction. When a displacement load was applied from the end of the first step to the second step, the jacking force increased gradually, reached its peak at the end of the second step, and then decreased gradually.
Determination of finite element parameters calculated
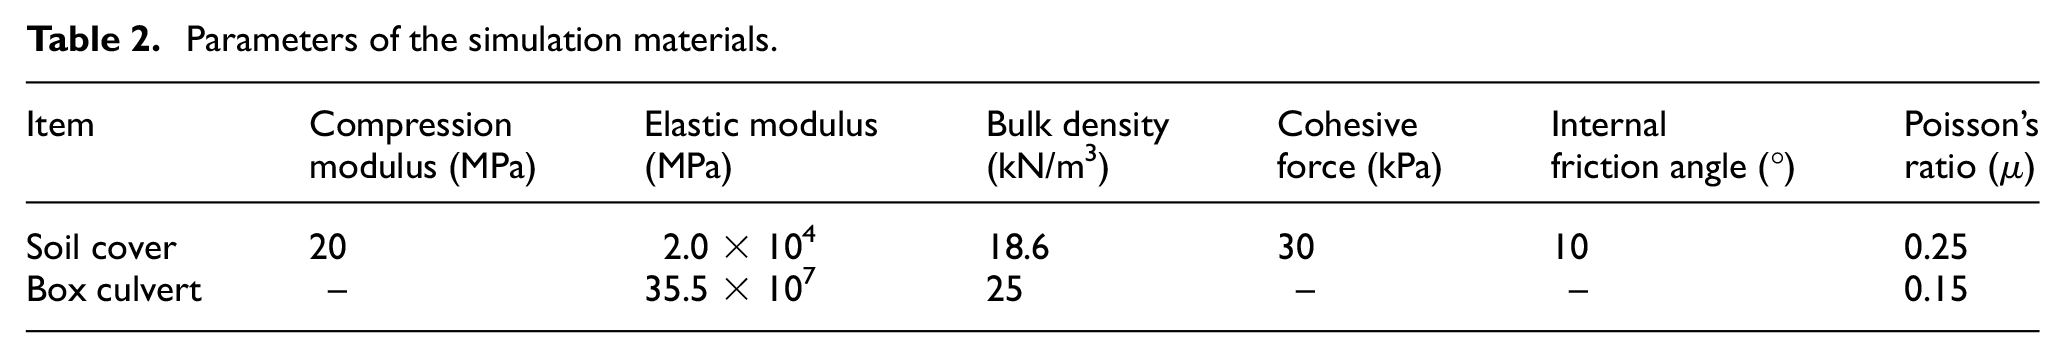
In this article, the calculation parameters (shown in Table 2) with the FE calculation of the physical–mechanical properties of the material used were obtained by geological prospecting of the supporting engineering.
Parameters of the simulation materials.
Model test results and analysis
Water content’s influence on the friction coefficient
The B specimen in this study included a soil water content of 21%, 19%, 17%, 15%, and 13% based on the climatic environmental features in this project, and the A specimen was constructed of concrete with non-drag reduction materials to analyze the water content’s effect on the friction coefficient between the culvert sidewalls and surrounding soil. For different water contents, the friction coefficient is the average value of the friction coefficient under conditions of four vertical loads (20, 30, 40, and 50 kN) and one horizontal load (50 kN). The model tests were conducted according to the content in Test model device design, and the results are shown in Figure 5.
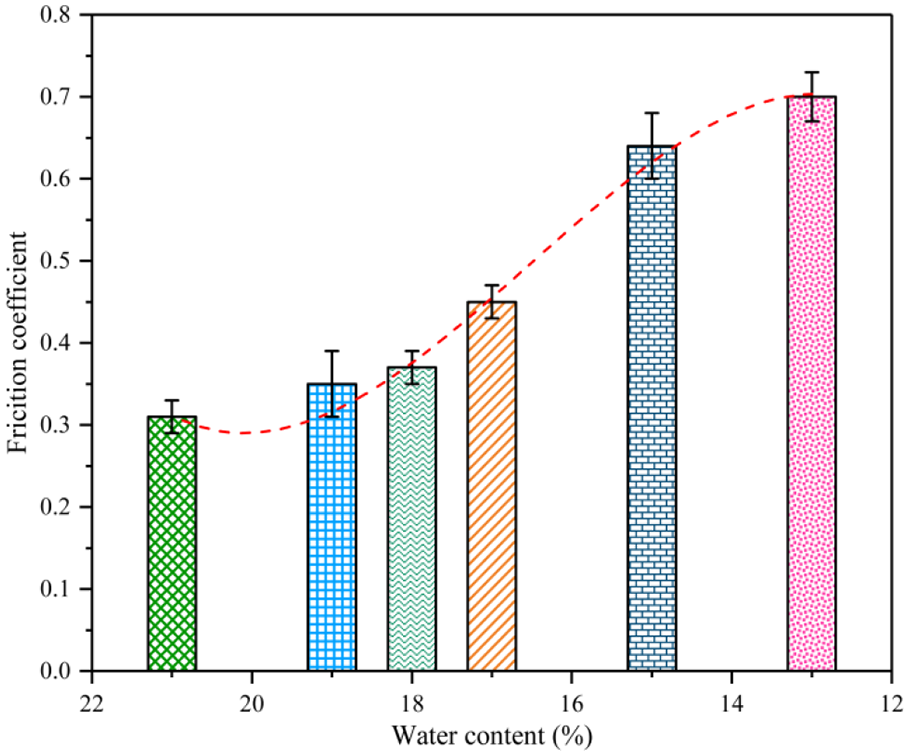
The relation between friction coefficient and water content.
The results shown in Figure 5 indicate that with a decrease in the soil’s water content, the friction coefficient on the contact surface of the A and B specimens increased constantly under jacking force and increased 8.57%–29.69% as the soil’s water content decreased by 2%. The results mentioned above indicate that the thickness of the water film on the contact surface decreased when the soil’s water content decreased, which weakened the water lubrication and increased the friction coefficient between the A and B specimens. The soil used in the test model was taken from the project site, and the water content was 18%, corresponding to its plastic limit. When the water content exceeded the plastic limit, the friction coefficient decreased gradually with increased water content, but with much smaller ranges. For example, the friction coefficient of 21% and 19% water content was less than 0.06 and 0.02 that of 18% water content, and the reduction ranged from 5.41% to 16.22%. When the water content (17%, 15%, and 13%) was less than that of the plastic limit, the friction coefficient also increased with decreases in water content and the changes ranged from 21.62% to 60%, which indicates that the water content’s effect on the friction coefficient decreased gradually when the water content in the soil around the box culvert exceeded its plastic limit.
Cement slurry dosage’s influence on the friction coefficient
The cement slurry serves to strengthen the effect on the soil. When the soil’s cement slurry content was low, the soil particles cannot be reinforced because of the lack of cementation. However, when the soil’s slurry content was high, the friction force between the sidewalls and surrounding soil increased (Jing, 2008). Therefore, it is reasonable to propose the 1:0, 1:10, 1:6, 1:4, 1:2, and 1:1 ratios of cement slurry to soil that the 15 B specimens had (same three specimens for each working condition) and with which the 15 A specimens with the concrete non-drag reduction materials were made. The results are shown in Figure 6.

The relation between friction coefficient and cement slurry dosage.
We can conclude from Figure 6 that under the four loading conditions, the friction coefficient decreased first and increased thereafter with the increase in the soil’s cement slurry dosage and reached its minimum value when the ratio of cement slurry to soil was 1:4. The results above indicate that when the ratio is less than 1:4, it is difficult to form a smooth, solid surface in the contact area between the soil and sidewalls, which results in the formation of an isolation layer of moisture and vapor at the contact surface. However, it still maintains close contact between the soil and sidewalls. When the ratio was greater than 1:4, the consolidation layer of the cement slurry formed at the culvert and the excess free water from the slurry enhanced the cohesive force between the sidewalls and the surrounding soil, which increased the friction. The results above demonstrated that the ideal ratio of cement slurry and soil was 1:4 in the supporting project, and if the ratio was more or less than 1:4, it had little effect on the friction coefficient.
Drag reducing agents’ influence on the friction coefficient
This study was designed to analyze drag reduction materials’ effect on the friction coefficient based on the previous results, in which the B specimen was made with soil with 13%, 15%, 17%, 19%, and 21% water content and a cement slurry at a ratio of 1:4. The A specimen was made from concrete with non-drag reduction materials, a mixture of PO, nanoscale polymer (NP), and paint that were brushed on to simulate different drag reduction measures. The results are shown in Figure 7.
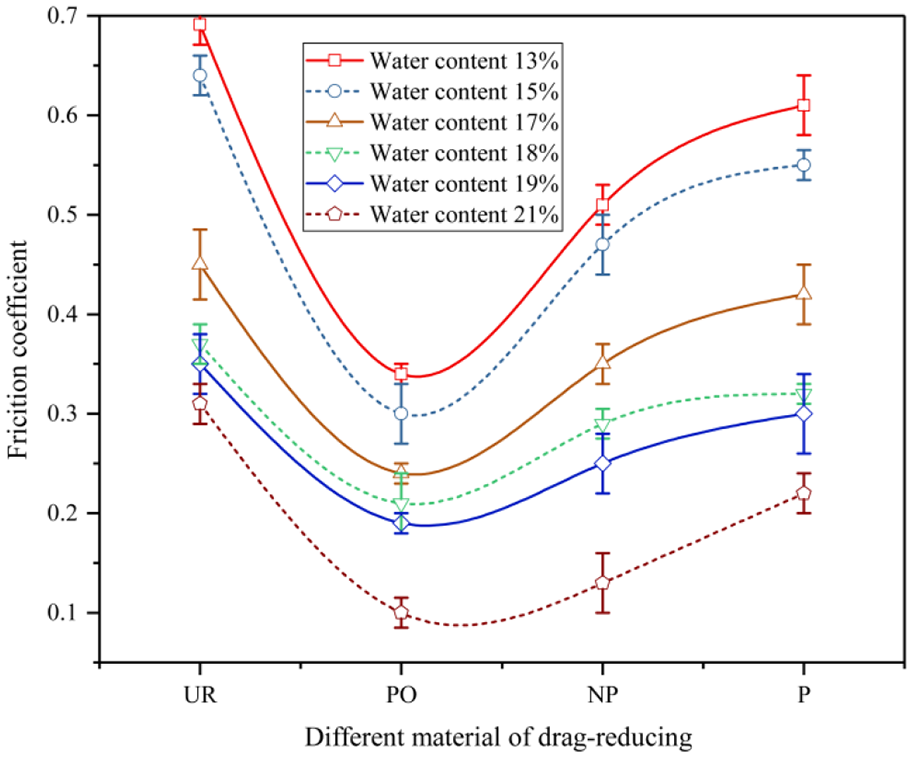
The relation between drag reduction materials and the friction coefficient.
Figure 7 shows that under the same water content conditions, the order of the friction coefficient was fPOÿɎfNPÿɎfPÿɎfNR , which indicates that the effect of the mixture composed of PO was the best of the three drag materials. Therefore, it is recommended to use this mixture as a drag reducing material in similar projects. Under the condition of no drag reduction versus different drag reduction materials, the friction coefficient decreased as the soil’s water content increased, which is consistent with the results in water content’s influence on the friction coefficient. When the water content was 18%, the friction coefficient of the mixture with PO, NP, and paint (P) used as drag reduction materials was 0.21, 0.30, and 0.32, respectively.
Numerical simulation results and analysis
In this part, three drag reduction measures (PO mixture with 0.21 friction coefficient, NP with 0.3 friction coefficient, and paint with 0.32 friction coefficient) and 90 m jacking length were selected to analyze the effect of drag reduction measures and jacking distance on both the box culvert’s stress and strain performance based on the project. The thickness of the cover soil on top of the box culvert is 4 m.
The roof’s stress–stress behavior
In this study, jacking lengths and drag reduction measures’ effect on stress and strain of box culvert roof have been analyzed based on the previous result (Guo et al., 2017), in which the surface of model box culvert was brushed PO mixture, NP, and paint. The results are shown in Figure 8.

Stress and strain laws for the box culvert roof: (a) stress characteristics and (b) strain characteristics.
Figure 8 shows that under different drag reduction measures, both the stress and strain on the box culvert roof increased with jacking distance under the same conditions, and the relation between stress and jacking distance had a “ladder” change shape. This finding can be attributed to the fact that the thickness of the covering soil and its physical properties influenced the stress and strain on the roof, in that the thicker and denser the soil cover, the higher both the stress and strain values. When the jacking distance was less than 30 m, the both stress and strain on the roof increased gradually with the soil cover’s thickness and jacking distance. When the box culvert was jacked into a 30–60 m highway embankment, the curves of both the stress and strain with jacking distance were stable and nearly linear because of the same thickness and behavior of the soil covering. When the jacking distance was greater than 60 m, the both stress and strain on the box culvert roof increased. Under the same working conditions, both the stress and strain corresponding to a 0.21 friction coefficient between the box culvert roof brushed with a mixture of PO and the surrounding soil was greater than that of a 0.3 friction coefficient with the roof brushed with NP and of 0.32 when the roof was brushed with paint, which indicates that the drag reduction effect of the mixture of PO performed the best.
The web’s stress–stress behavior
In this section, the three drag reduction measures and the jacking length were selected to analyze drag reduction measures and jacking lengths’ effect on stress and strain of box culvert web. The results are shown in Figure 9.
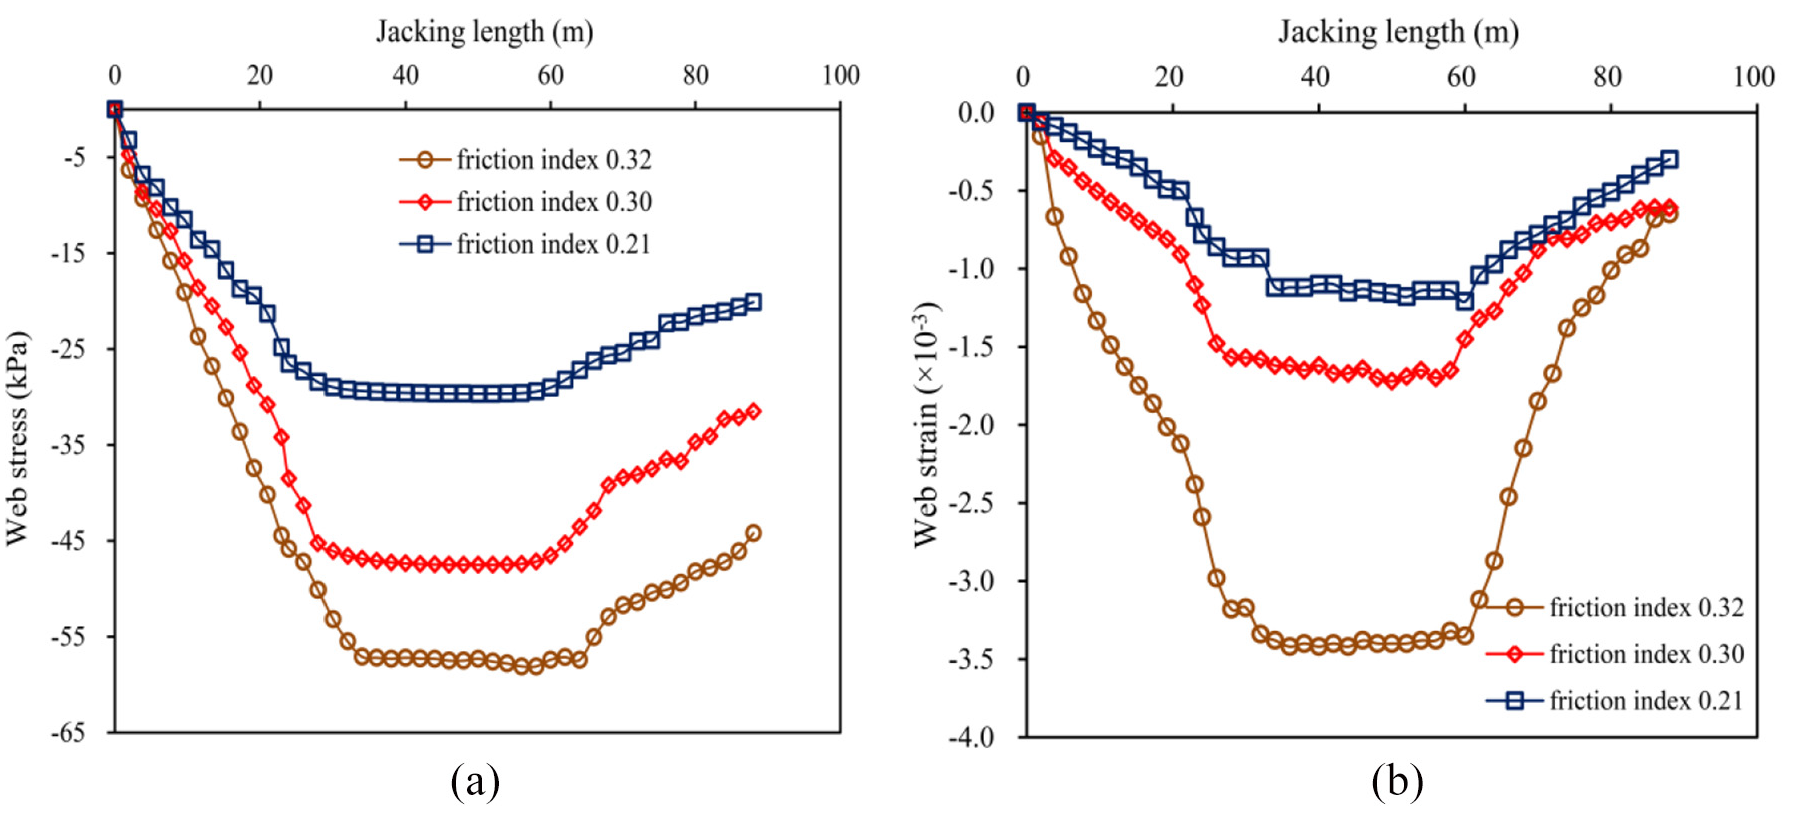
Stress and strain law for the box culvert web: (a) stress characteristics and (b) strain characteristics.
The results presented in Figure 9 indicate that with the application of different drag reduction materials, the relation between stress and strain and jacking distance in the box culvert web remained nearly the same and exhibited an overall “ladder” trend. When the jacking distance was less than 30 m, the both stress and strain on the box culvert web showed an increasing and nearly linear trend. The curve of stress and strain on the box culvert web remained stable as jacking distance increased from 30 to 60 m. When the jacking distance was 60–90 m, the stress of the box culvert web exhibited began with pressure and then tension attributable to the variation in the characteristics and thickness of the soil covering the top of the culvert. Under the same conditions, both the stress and strain on the box culvert web increased with increased friction coefficient. The drag reduction effect of the PO mixture was greater than were those of the other drag reduction materials.
The floor’s stress–stress behavior
In this study, the same drag reduction measures (PO mixture, NP, and paint) and jacking length (90 m) as mentioned above were selected to analyze the drag reduction measures and jacking lengths’ effect on stress and strain of box culvert floor. The test results are shown in Figure 10.
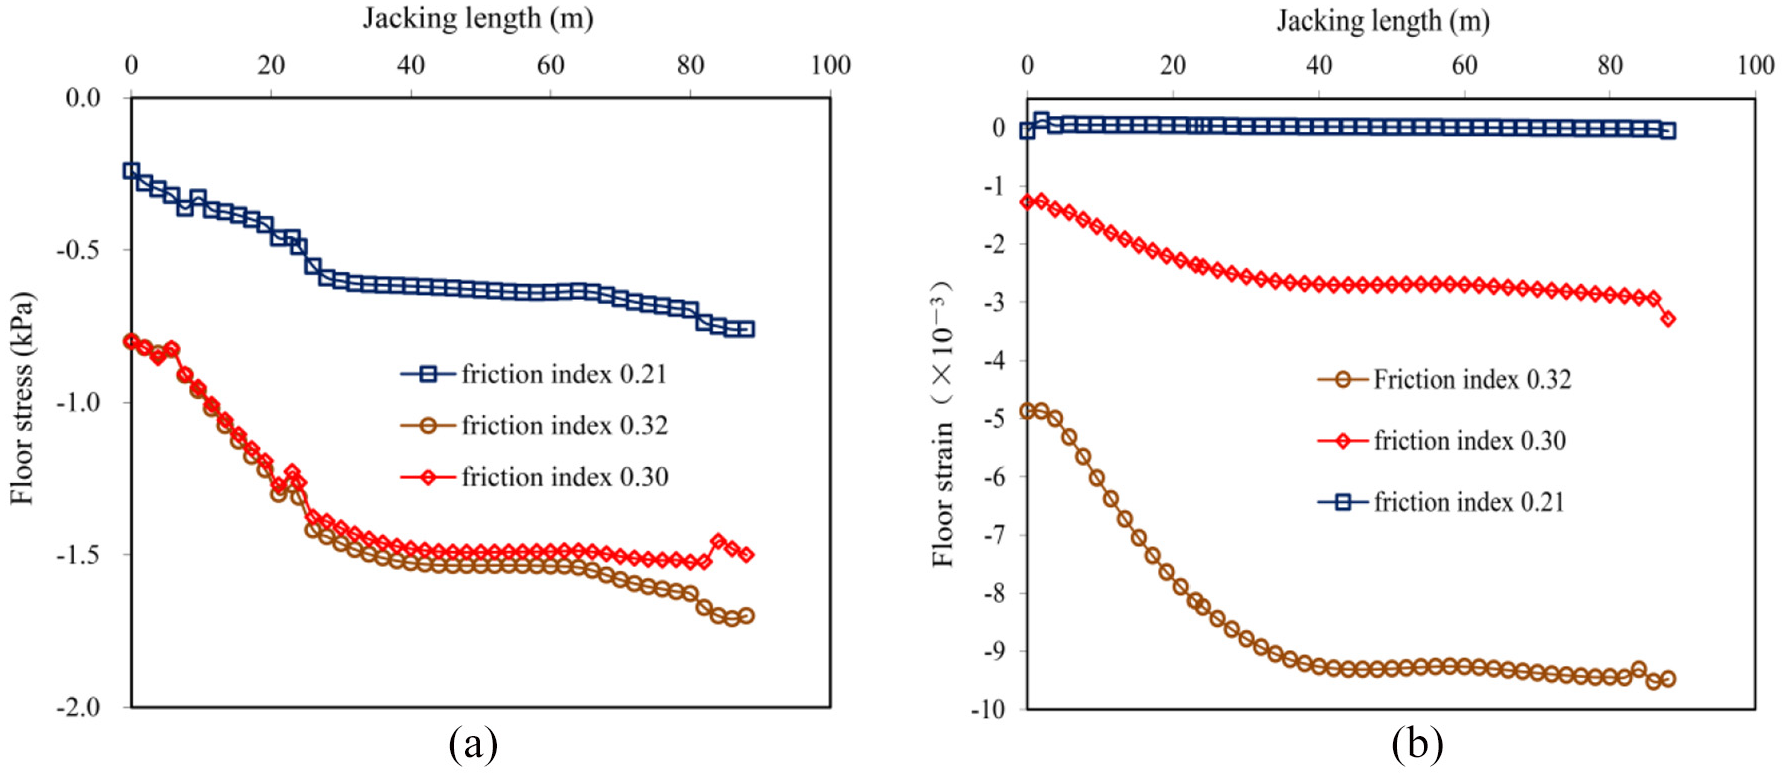
Stress and strain law for the box culvert floor: (a) stress characteristics and (b) strain characteristics.
Both the curves of stress and strain with jacking distance on the box culvert floor were shown in Figure 10. When the jacking distance was less than 30 m that the box culvert was jacked through roadbed slope that increased the soil thickness of covering roof, the stress and strain of the floor increased with increased jacking distances. The results shown in Figure 10 indicate that there is a nearly linear correlation between the stress and strain on the floor and jacking distance, with the length of the culvert into the subgrade more than 30 m, which shows that the influence of jacking length on the stress and strain law for the box culvert floor was insignificant. This finding can be attributed to the fact that in the simulation process, the box culvert is regarded as an integrated body. The box culvert floor plays a role in balancing the top soil’s compressive stress, which results in the lack of a significant change in floor stress and strain. With the increase in friction coefficient, the stress and strain of the box culvert floor also have increased, which showed the same that of the roof and web. These results indicated that in contrast to other materials used as drag reduction agents, the PO mixture has excellent potential to reduce friction.
Conclusion
The friction coefficient between the box culvert’s surface and the surrounding soil matrix increased constantly as the soil’s water content decreased, and water content’s effect on the friction coefficient decreased gradually when the water content exceeded its plastic limit.
The optimal ratio of cement slurry to soil was approximately 1:4 in our project, and it had less effect on the friction coefficient as the ratio of cement slurry and soil departed from the optimal ratio. Compared to the other materials used as drag reduction agents, the PO mixture is an ideal candidate to use as a drag reduction agent.
Under the same conditions, the stress and strain on the box culvert structure increased as the friction coefficient between the box culvert sidewalls and the surrounding soil increased.
With increased jacking distance, both the curves of stress and strain on the roof and floor with jacking distance exhibited an “armchair” shape, while the web presented a “trapezoid” shape as the box culvert was jacked into the subgrade. Both the thickness and characteristics of the soil cover had essential influences on the stress and strain values of the box culvert structure, and thick soil cover increased the values of strain and stress.
Footnotes
Acknowledgements
The authors would like to thank the technical staff of the Civil Engineering Laboratory at the Shaanxi University of Technology for their support throughout this research.
Declaration of Conflicting Interests
The author(s) declared no potential conflicts of interest with respect to the research, authorship, and/or publication of this article.
Funding
The author(s) disclosed receipt of the following financial support for the research, authorship, and/or publication of this article: This study was financially supported by the Talent Introduction Fund by the Natural Science Foundation of China (No. 11702163), Introduction Fund by Shaanxi University of Technology (No. SLGQD16-11), and Key Research and Development Program of Shaanxi Province (2017ZDCXL-SF-03-01-01).