
Abstract
Reinforced coral aggregate concrete beam and reinforced ordinary aggregate concrete beam with different concrete type, concrete strength, and steel type were designed in this study to investigate their shear behavior. The shear behavior of reinforced coral aggregate concrete beam was tested, the failure mode and deflection behavior were studied, and the calculating model for the ultimate shear capacity (Vcs) of reinforced coral aggregate concrete beam was proposed. Results showed that the failure mode of reinforced ordinary aggregate concrete beam and reinforced coral aggregate concrete beam were basically the same. As the concrete strength increases, the normal section cracking load (Vcr), inclined section Vcr, and Vcs of reinforced coral aggregate concrete beam increased gradually. Furthermore, Vcr and Vcs of reinforced coral aggregate concrete beam were as follows: 316 stainless steel > common steel > zinc-chromium coated steel > new organic coated steel. For the coral aggregate concrete structure in ocean engineering, in order to prolong its service life, the use of new organic coated steel was suggested. At the same time, the influence of high-strength coral aggregate concrete and stirrup corrosion was comprehensively considered and the calculation model for the Vcs of reinforced coral aggregate concrete beam was presented and was then verified.
Keywords
Introduction
For the ocean engineering construction background, the application of reinforced coral aggregate concrete (CAC) beam has important engineering benefits (Fathifazl et al., 2010; Lu et al., 2019; Ma et al., 2018). However, the corals which are natural porous structure and contain large amounts of Cl− in CAC easily lead to the steel corrosion (Da et al., 2020; Wang et al., 2017). When the concrete cover is subject to Cl−, the steel corrosion will affect the structure properties. For steel, the sections and mechanical properties are reduced by the corrosion (Frangopol et al., 1997; Ma et al., 2016). For concrete (Chen et al., 2008; Zhang et al., 2008), concrete cover cracks are also formed due to steel corrosion, causing damage to the concrete. For reinforced concrete (Guzmán et al., 2011; Ou and Nguyen, 2016; Zhang et al., 2017), due to the influence of steel corrosion, the bond property between the concrete and steel is reduced. In addition, the shear failure of reinforced concrete beam is brittle failure, and its influence is more serious than flexural failure (Yang et al., 2016). Therefore, research on the shear behavior of reinforced CAC beam has important engineering significance for the ocean engineering.
Kakooei et al. (2012) studied on steel corrosion in CAC and found that the rate of steel corrosion in CAC was significantly higher than that in OAC with same mix proportion. Zhang (1995) studied on mechanical behavior of reinforced CAC beam/column; however, the common steel has been corroded in the test, and this corrosion did not introduce quantitative data analysis. Wang and Zhao (2012) studied on mechanical behavior of CAC and found that CAC was similar to lightweight aggregate concrete (LAC) in failure mode. Li et al. (2013) studied on elastic modulus and steel corrosion of CAC and found that proper amount of fly ash (FA) or slag (SG) added in CAC could improve its elastic modulus and anti-corrosion. Da et al. (2016b) studied on mechanical behavior of CAC, and the results showed that CAC was more brittle than OAC and LAC with same concrete strength. Da et al. (2016c) and Yu et al. (2017) investigated on the durability of concrete structure in the Xisha island, and the Cl− diffusion and steel corrosion of CAC and OAC were analyzed. Therefore, based on current research status of CAC, this article studies the shear behavior of reinforced CAC beam.
To study the shear behavior of concrete beam, 12 reinforced CAC beams and 2 reinforced OAC beams with different of concrete type, concrete strength, and steel type were designed. The shear behavior of reinforced CAC beam was studied. Comprehensively considering the influence of steel corrosion and high strength CAC, the calculation model for Vcs of reinforced CAC beam was presented.
Experiment
Raw materials
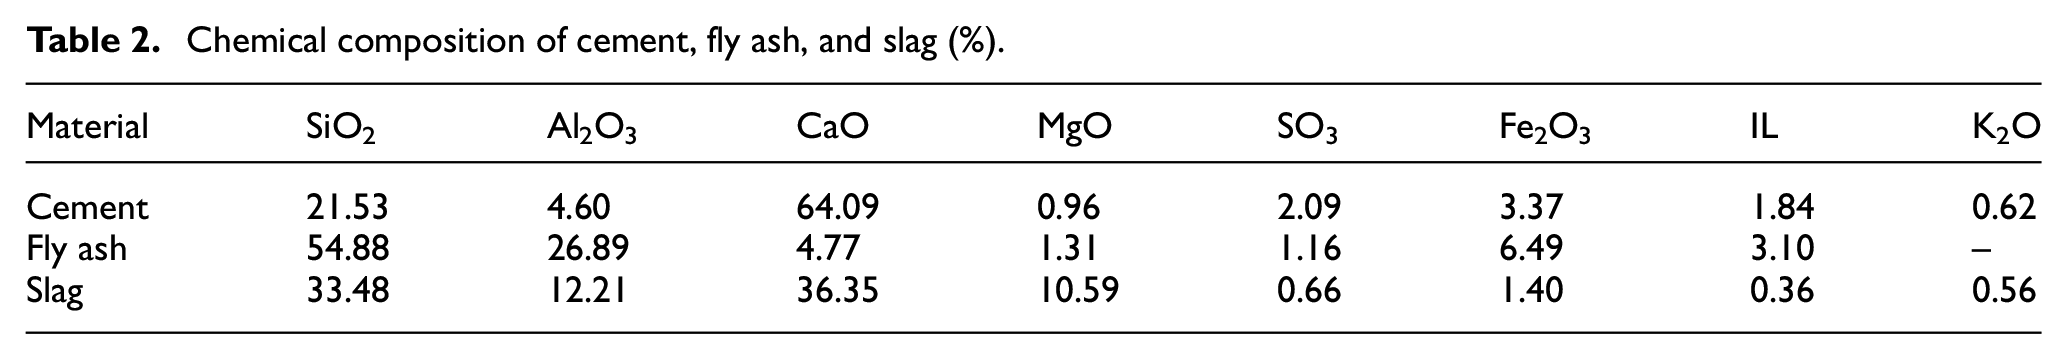
Table 1 is the basic parameters of coral aggregate. Other materials included the following: P·II52.5 ordinary Portland cement, FA, SG, calcium nitrate inhibitor, and water reducer, and the chemical composition of cement, FA, and SG is also shown in Table 2. According to ASTM D1141-2003, the mix proportion of seawater is NaCl: KCl: CaCl2: MgCl2·6H2O: Na2SO4 = 24.5: 0.7: 1.2: 11.1: 4.1. The steel included (a) common steel, (b) new organic coated steel, (c) zinc-chromium coated steel, (d) 2205 duplex stainless steel, and (e) 316 stainless steel, and the chemical composition of steel is given in Table 3.
Basic parameters of coral aggregate.

Chemical composition of cement, fly ash, and slag (%).
Chemical composition of steel (%).

Component preparation
The size of reinforced concrete beam is 150 mm × 200 mm × 1500 mm. The mix proportion and basic parameter of reinforced concrete beam are shown in Table 4 and Table 5, respectively. Among them, the shear span ratio (λ) was 1.23 and the thickness of concrete cover was 30 mm; fcu, fc, and ft were concrete cube compressive strength, axial compressive strength, and axial tensile strength, respectively; and fy and fyv were longitudinal steel yield strength and stirrup yield strength, respectively. In order to cause shear failure of beam, the beam bottom was configured with 2Φ16 rebar steels, the hanger steel with 2Φ10 rebar steels, stirrups with Φ6 plain round steels, and the stirrup spacing was 100 mm. The dimensions and steel details of reinforced concrete beam are shown in Figure 1.
Mix proportion of coral aggregate concrete (kg/m3).
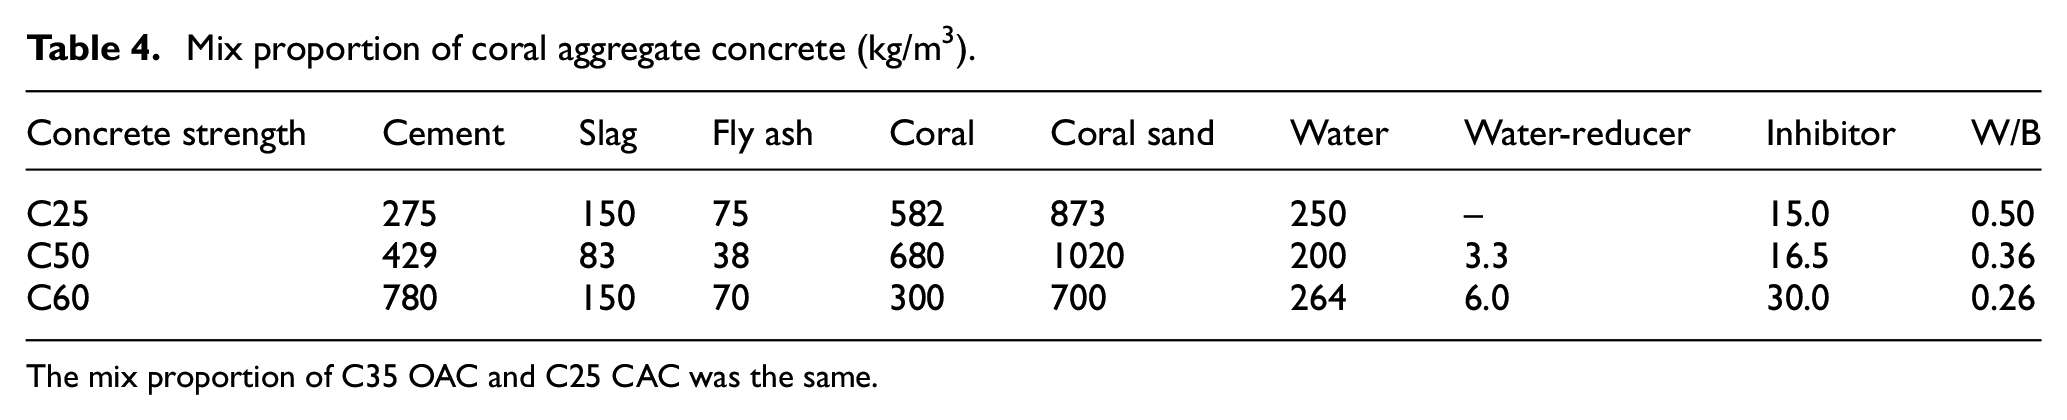
The mix proportion of C35 OAC and C25 CAC was the same.
Basic parameter of reinforced concrete beam.
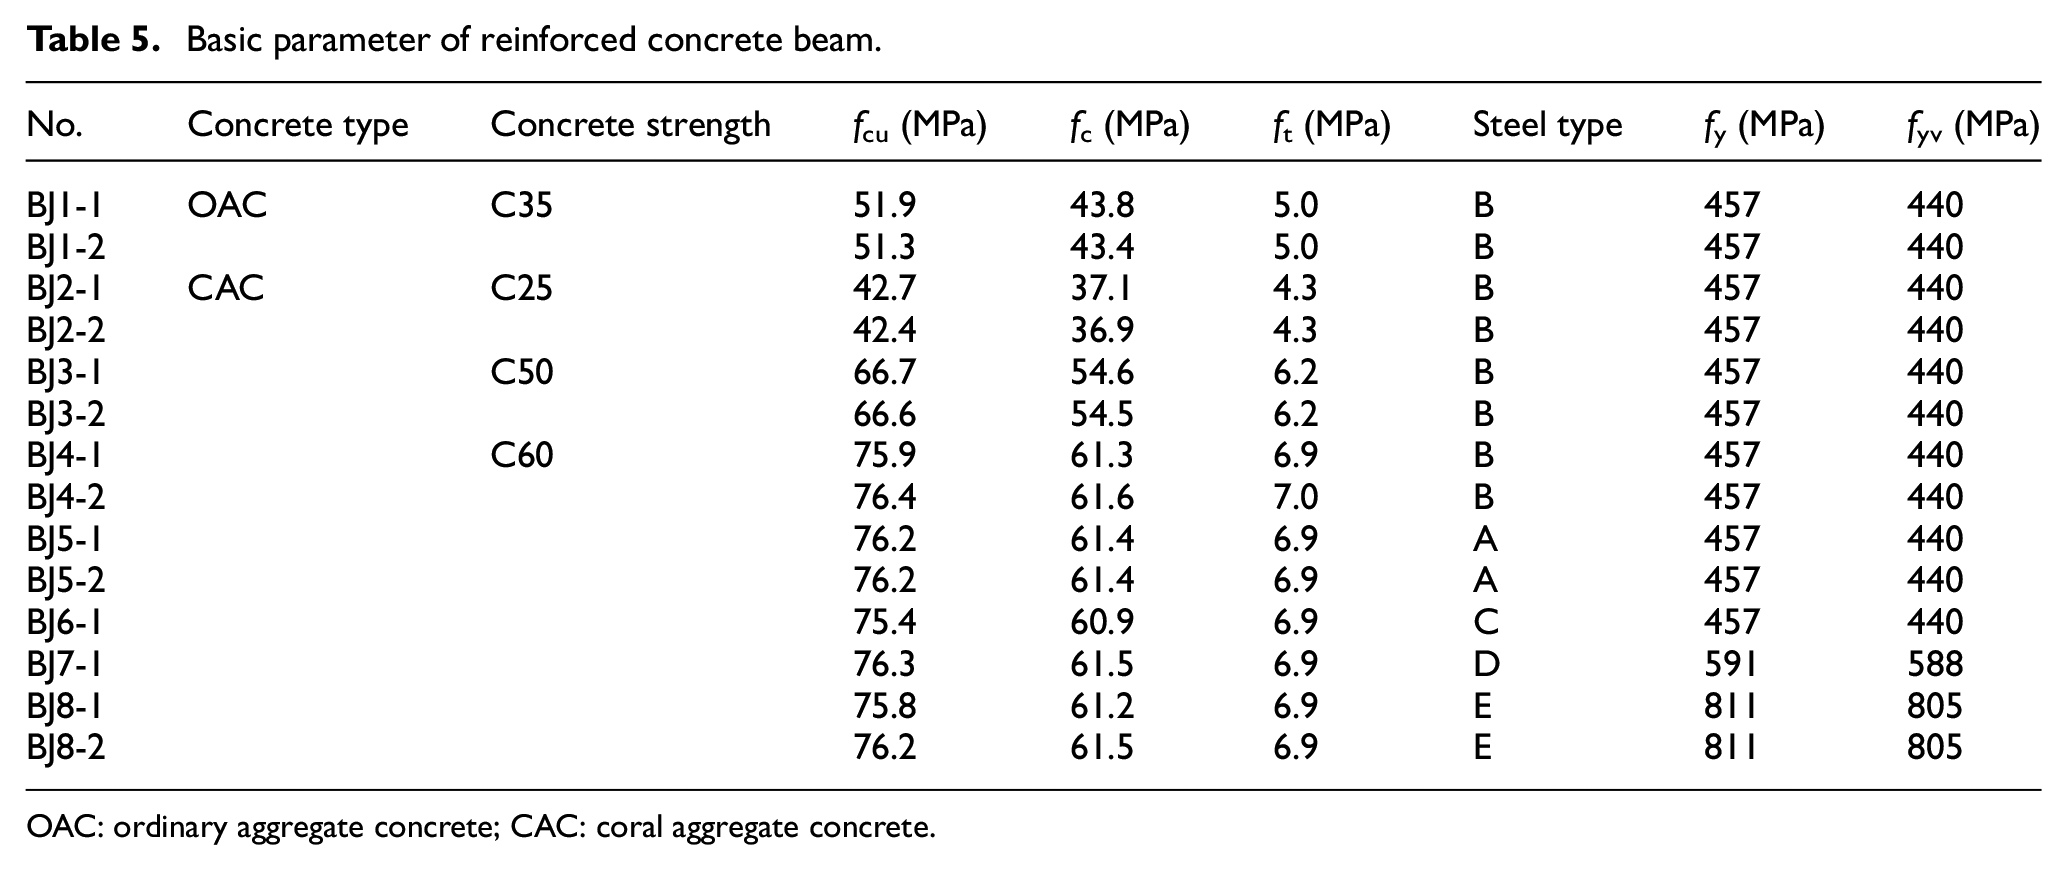
OAC: ordinary aggregate concrete; CAC: coral aggregate concrete.

Dimensions and steel details of reinforced concrete beam (mm).
Test method
According to GB/T 50152-2012, the four-point loading method was adopted in the test. The devices are shown in Figure 2. During the loading process, a load sensor of 50 t was used to measure the load changes. DH3818-2 strain indicator collects readings from steel, concrete, and displacement sensor. The development and width of cracks are measured by SW-LW-201 crack detector. In addition, YWC-50 displacement sensors were installed on the supports, loading points, and midspan of beam, respectively, to obtain the overall deformation of beam.
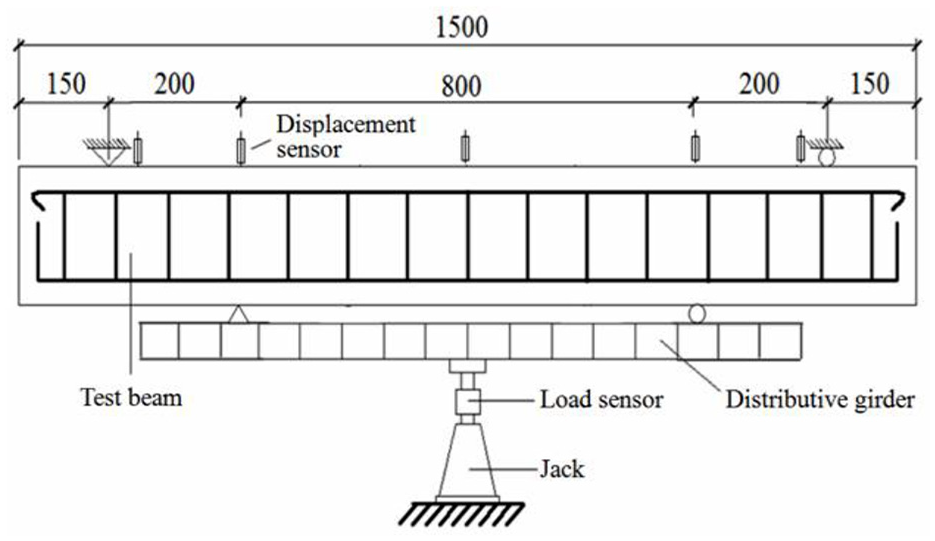
Schematic of loading devices (mm).
To measure the steel stress during loading, the four strain gauges were attached to stirrups in the shear zone. At the same time, the six strain gauges were attached to the midspan of longitudinal steels and the loading points. In order to measure the deformation of beam, the five strain gauges were arranged in the pure bending section of beam. To explore the concrete strain development, the two strain gauges were attached to the tensile and compression zones. Meanwhile, to analyze the distribution of principal stress in the shear bending section, the strain rosette was attached to the midpoint between loading point and support (Figure 1).
Results and discussion
Failure mode
Figure 3 shows the failure mode of reinforced concrete beam. As shown in Figure 3, the shear failure occurred in both reinforced OAC/CAC beam, and the failure mode was basically the same. However, for the same mix proportion (Figure 3(a)–(b)), there were more cracks in the reinforced CAC beam than in the reinforced OAC beam. The main reason is that the coral aggregates are naturally porous structural materials (Da et al., 2016b), which has the characteristic of “absorb and return water.” In the process of cement hardening, the water released was used to hydration of cement. This “micro-pump” effect reduced W/B around the coral aggregates, thus improving the bonding strength between coral aggregates and cement. At the same time, the rough surface of coral aggregates makes its surface area larger and improves the interfacial strength. Therefore, this characteristic of coral aggregates can effectively inhibit the development of inclined cracks.
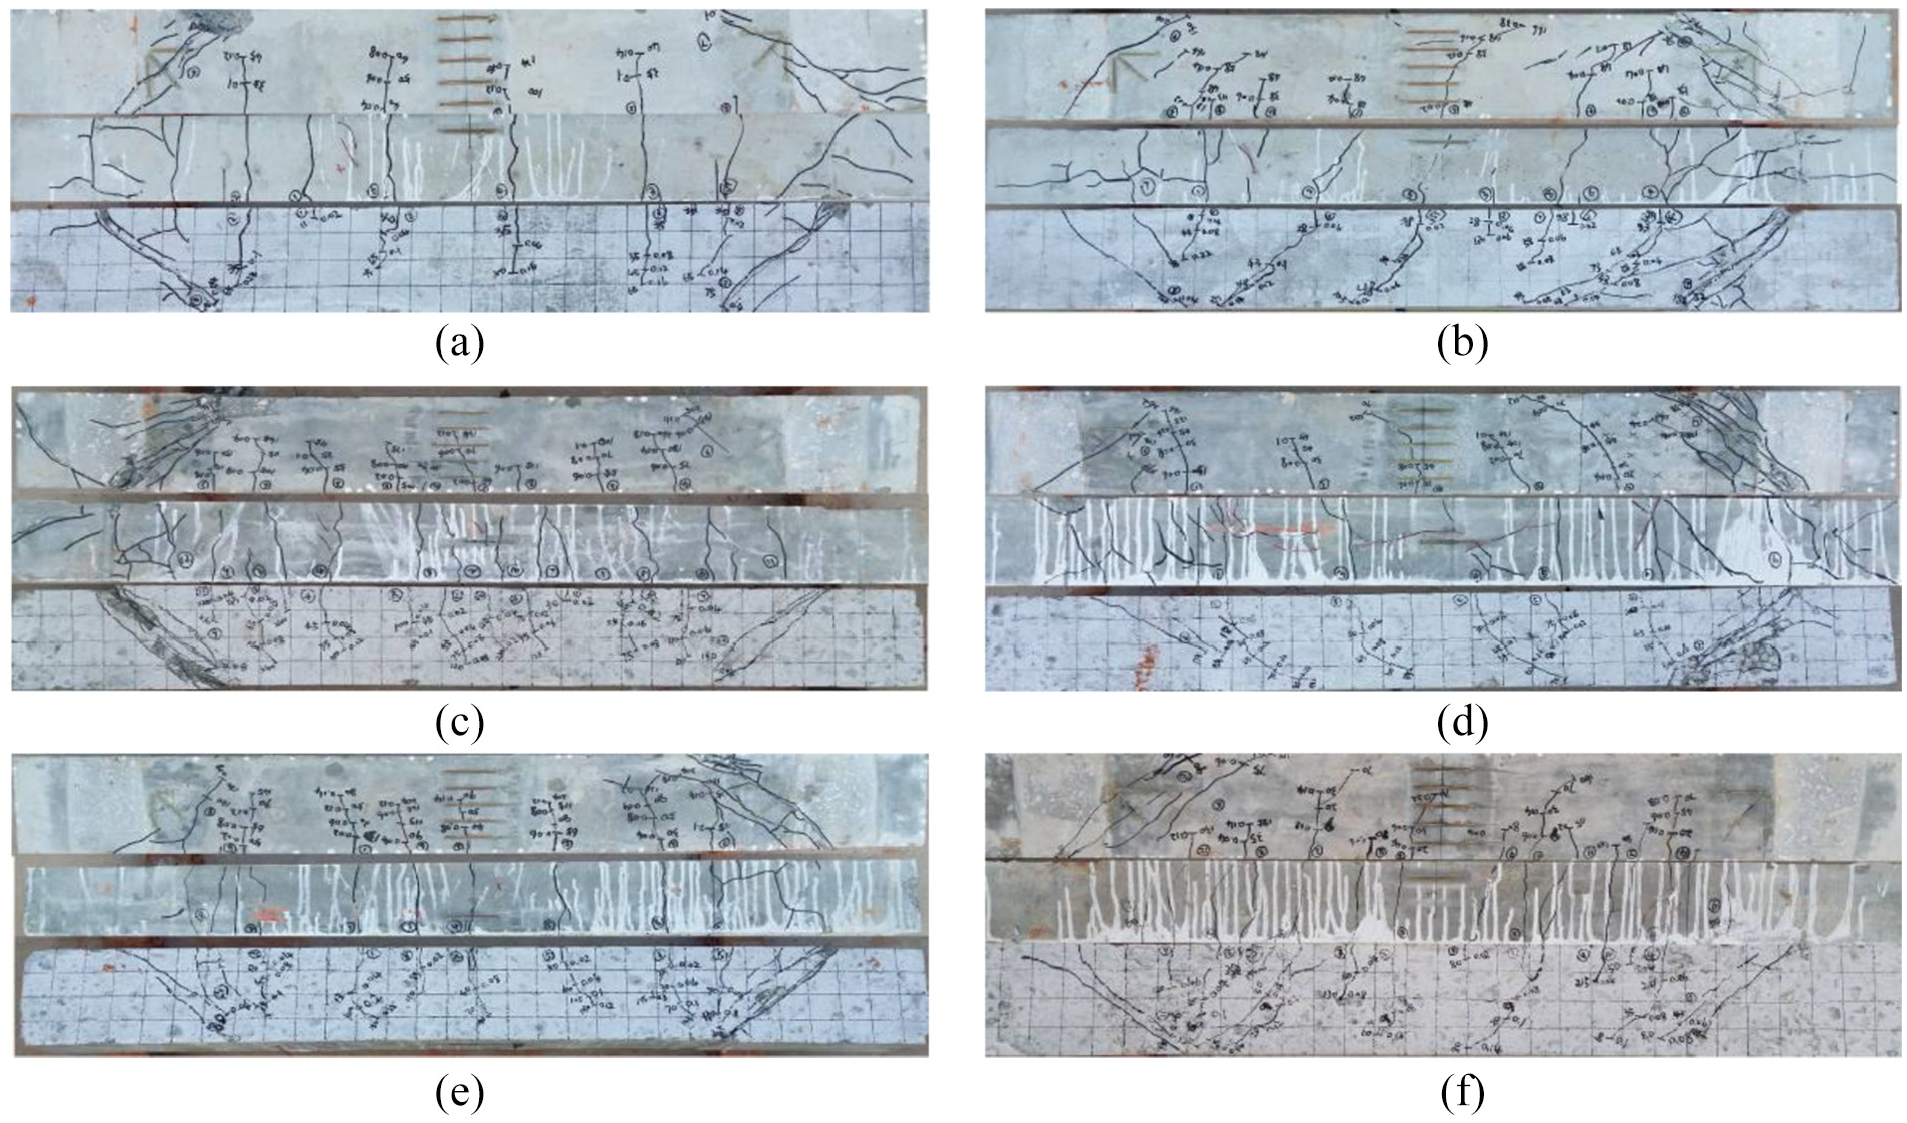
Failure mode of reinforced concrete beam: (a) BJ1-2, (b) BJ2-2, (c) BJ3-2, (d) BJ4-1, (e) BJ6-1, and (f) BJ8-2.
Furthermore, the test found that the shear strength of coral aggregates was very low, and when the shear cracking of reinforced CAC beam occurs, the coral aggregate on the cracks was cut off, failing to maintain its completion. Consequently, after the inclined sections were sheared to crack, the bonding force between the aggregates will be significantly reduced and stirrups will share more shear strength, which illustrated the low shear strength of CAC.
Bearing capacity
Table 6 shows test results of reinforced concrete beam. Among them, fmax is the maximum midspan deflection and wmax is the maximum crack width. As shown in Table 6, for reinforced CAC beam with the same steel type, as the concrete strength increases, the normal section cracking load (Vcr), inclined section Vcr, and ultimate shear capacity (Vcs) of reinforced CAC beam increased gradually. The main reason is that the higher CAC strength, the higher ft; thus, Vcr and Vcs increased.
Test results of reinforced concrete beam.
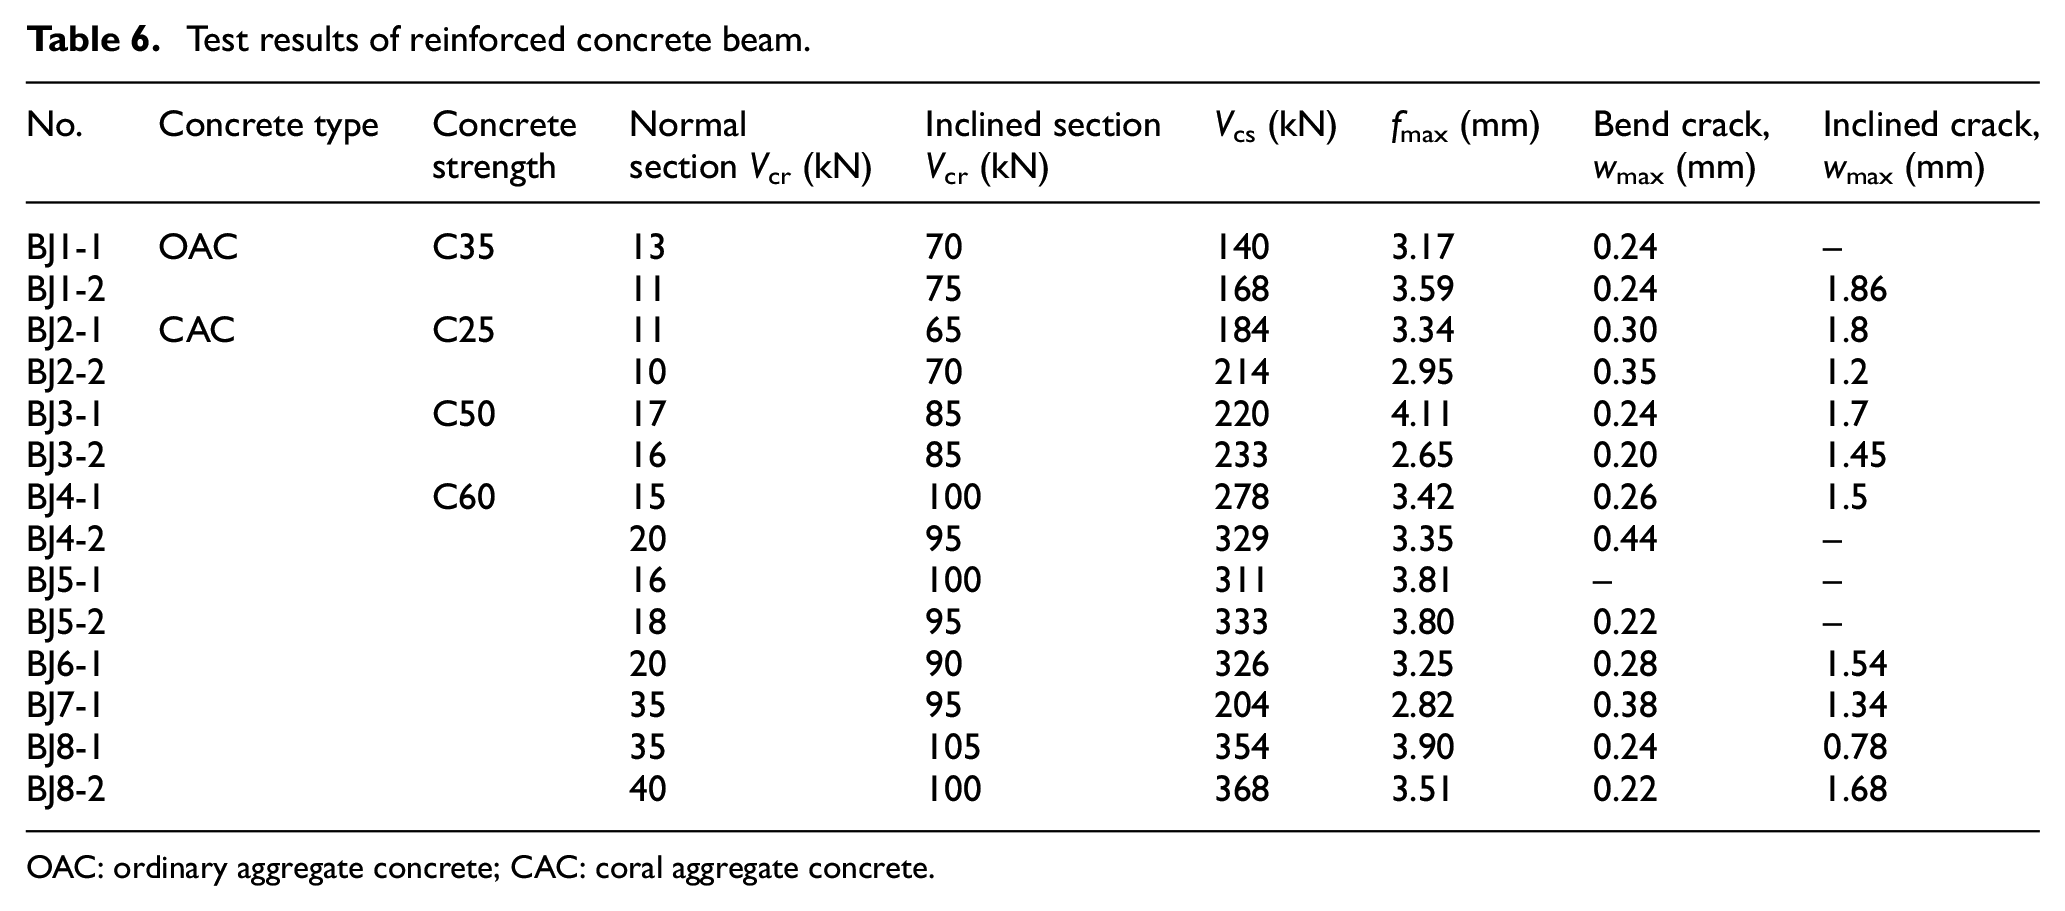
OAC: ordinary aggregate concrete; CAC: coral aggregate concrete.
Besides, for reinforced CAC beam with the same concrete strength, the rule of normal section Vcr and Vcs of reinforced CAC beam were as follows: 316 stainless steel > common steel > zinc-chromium-coated steel > new organic coated steel > 2205 duplex stainless steel. The main reason is as follows: (a) the stirrup shared part of the shear stress before cracks occurred, and the yield strength of common steel was lower than that of 316 stainless steel, so the stirrup shear strength of 316 stainless steel was the highest, and its normal section Vcr was the largest. (b) The Vcs of reinforced concrete beam was composed of the stirrup and the concrete. For the same concrete strength of reinforced CAC beam, as the stirrup strength increases, the stirrup shear capacity (Vs) increased gradually, indicating that the Vcs of 316 stainless steel CAC beam was the largest. (c) In the tests, the 2205 duplex stainless steel was plain round steel, which reduced the bonding strength between the steel and concrete, leading to a big slip between the steel and CAC. As a result, the normal section Vcr and Vcs were greatly reduced while the deflection increased.
Midspan deflection
Figure 4 shows bending moment–midspan deflection curves of reinforced concrete beam. As shown in Figure 4, (a) curves were divided into two stages, namely, the stage before concrete cracking and the stage from concrete cracking to failure. After the normal section was cracked, the curves showed its obvious linear feature. Upon reaching to Vcs, the components suddenly lost the bearing capacity, indicating obvious brittle failure. (b) For the same steel ratio, Vcs of reinforced CAC beam (BJ2-2) was higher than that of reinforced OAC beam (BJ1-1). Thus, the shear strength of C25-reinforced CAC beam was better than that of C35-reinforced OAC beam. Besides, the midspan deflection of BJ2-2 was larger than the BJ1-1, this is due to lots of Cl− in CAC, which accelerated the steel corrosion (Da et al., 2016a), reduced the stiffness, and increased the midspan deflection. (c) As the concrete strength increases, the Vcs increased, the main reason is that Vcs was composed of concrete shear capacity (Vc) and Vs. When Vs was constant, with the increase in Vc, the Vcs increased.
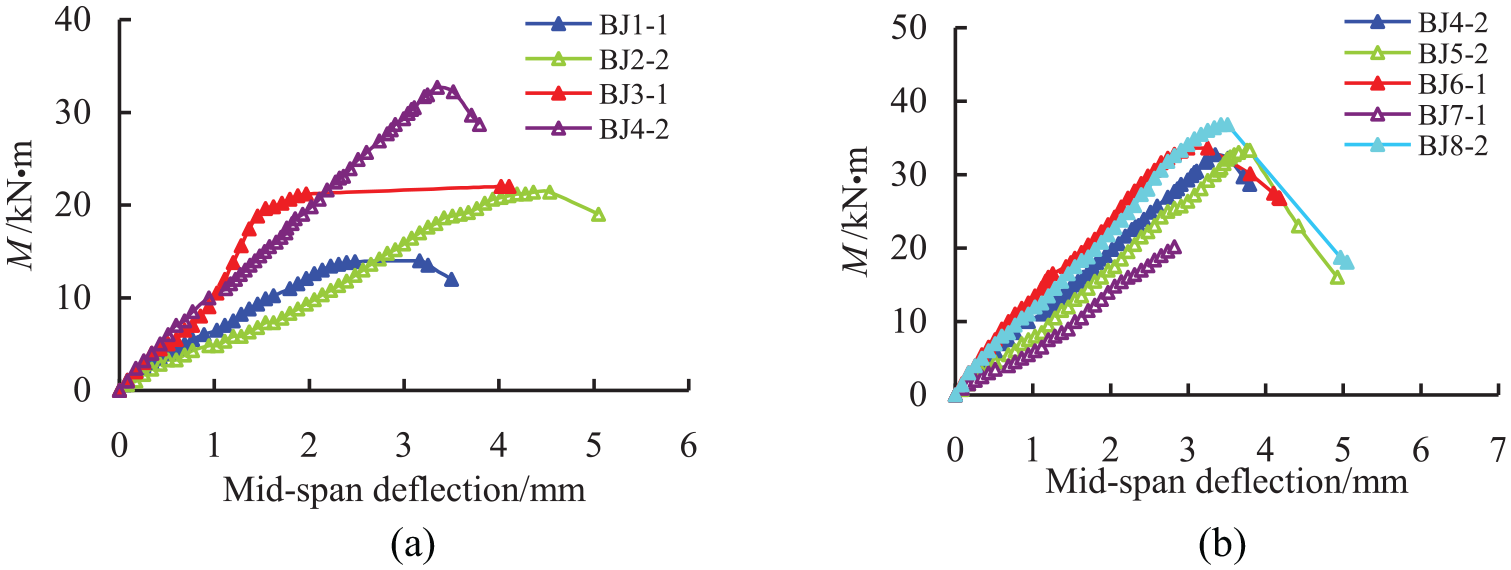
Bending moment–midspan deflection curves of reinforced concrete beam: (a) concrete type and strength and (b) steel type.
As is shown in Figure 4(b), the stiffness of BJ4-2 and BJ6-1 was higher than that of BJ5-2, indicating that the common steel (BJ5-2) had serious corrosion in reinforced CAC beam with a large amount of Cl−, which reduces the beam stiffness (Bhargava et al., 2006). However, the new organic coated (BJ4-2) and zinc-chromium coated (BJ6-1) had excellent anti-corrosion behavior to inhibit steel corrosion (Figures 8–9).
Stirrup strain
Figure 5 shows load-stirrup strain curves of reinforced CAC beam. As shown in Figure 5, as the load increases, the stirrup strain increased gradually. In the initial stage of loading, the strain of stirrups was very small. But due to the emergence of inclined section cracks, the strain of stirrups increased rapidly. Based on the mechanical test results, the strain of stirrup yield (ε) is as follows: common steel ε=fy/Es= 440×106/(2.1 × 105) = 2095 με, 2205 duplex stainless steel ε = 588 × 106/(2.1 × 105) = 2800 με, and 316 stainless steel ε = 805 × 106 / (2.1×10⁵)= 3833 με.
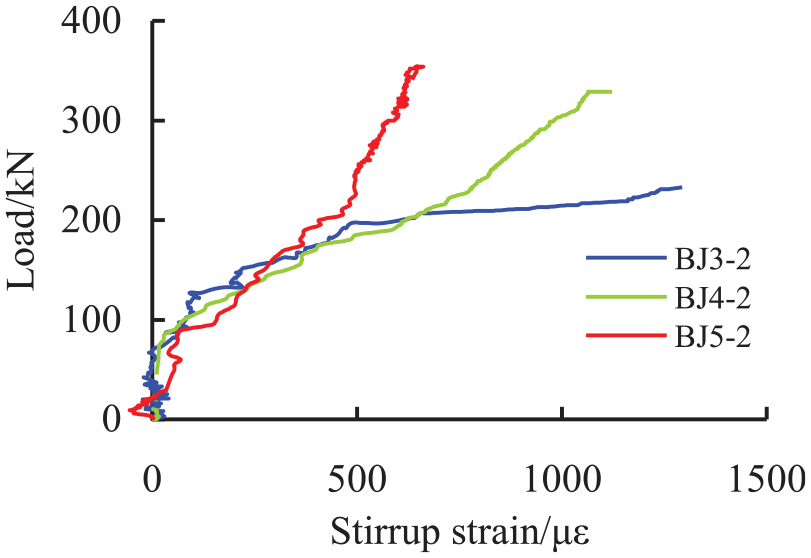
Load–stirrup strain curves of reinforced CAC beam.
When load reached to Vcs, the stirrups of both beam did not yield. The main reason is that the stirrup spacing was too small. Moreover, by comparing the load-stirrup strain curves of BJ3-2, BJ4-2, and BJ5-2, it is found that the strain of stirrup increased rapidly at 75, 85, and 90 kN when the inclined cracks of beam occurred, indicating that with the increase in concrete strength, the load of stirrup strain began to mutate is larger. The concretes shared part of shear strength, and the required external load increased when the stirrups began to work.
Crack width
Figure 6 is the load–maximum crack width (wmas) curves of reinforced CAC beam. As shown in Figure 6, as the load increases, the wmas increased gradually. In the initial loading stage, bending cracks in normal sections occur near beam midspan with slow expansion. However, as the load increases, inclined cracks are formed from the support to the concentrated force point, which eventually widen and lead to the beam failure. As shown in Figure 6(a), the rule of the bearing capacity of reinforced CAC beam with the same wmas was as follows: BJ2-1 > BJ3-1 > BJ4-2. The result indicates that the development of wmas was related to the concrete strength. The main reason is that the Vcs was composed of Vc and Vs; when Vs was constant, with the increase in Vc, the Vcs increased and resulted in smaller wmas. As shown in Figure 6(b), for the reinforced CAC beam with the same wmas (0.1 mm), the load of BJ4-2, BJ5-1, BJ6-1, BJ7-1, and BJ8-1 reached to 34.7%, 54.9%, 23.3%, 30.0%, and 42.5%, respectively, in terms of Vcs. It was obvious that the wmas development was related to the steel type. The loads of BJ4-2 and BJ6-1 were small, mainly due to greater slip between the CAC and the coated steel that destroyed the bonding strength.
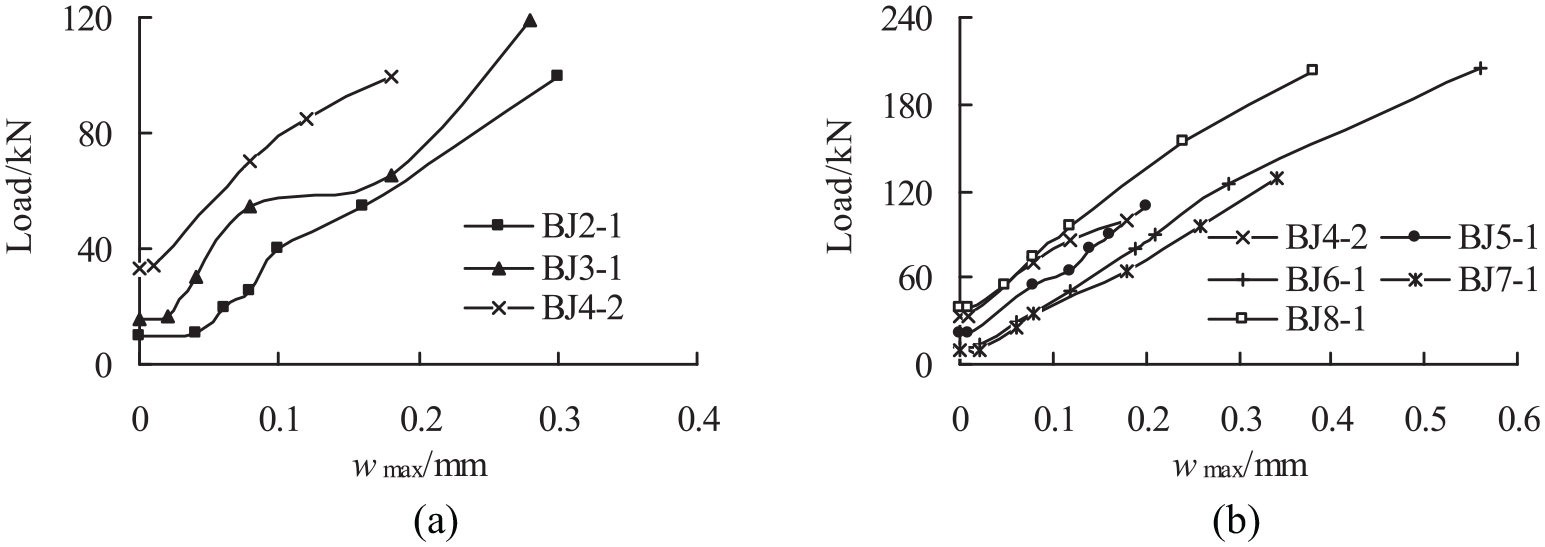
Load-maximum crack width curves of reinforced CAC beam: (a) concrete strength and (b) steel type.
Calculation model
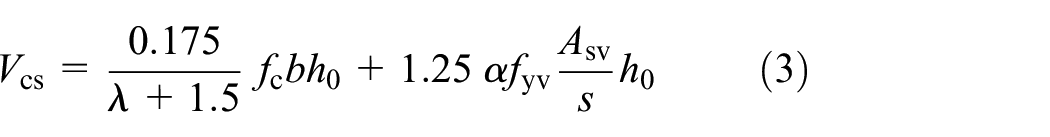
Based on the different codes, the calculation models for the Vcs of reinforced CAC beam was as follows
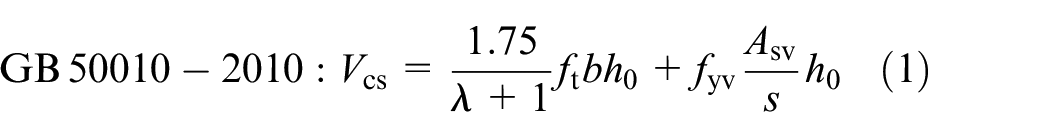
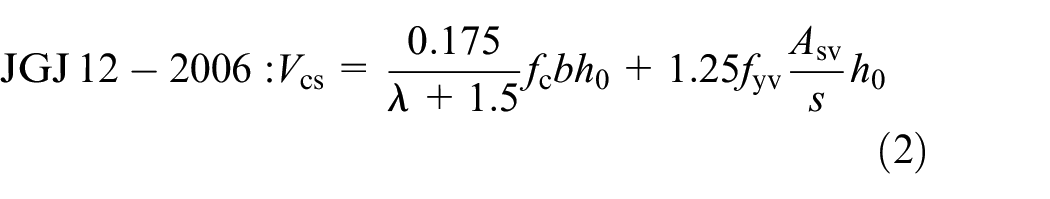
where Vcs is the ultimate shear capacity (kN) and λ is the shear span ratio. For the GB 50010-2010, when λ < 1.5, λ = 1.5 and when λ > 3, λ = 3; for the JGJ 12-2006, when λ < 1.4, λ = 1.4 and when λ > 3, λ = 3; ft, fc are the concrete axial tensile and compressive strength (MPa), respectively; b is the rectangular section width (mm); h0 is the section effective depth (mm); fyv is the stirrup yield strength (MPa); Asv is the stirrup sectional area in the same section (mm2); and s is the stirrup spacing (mm).
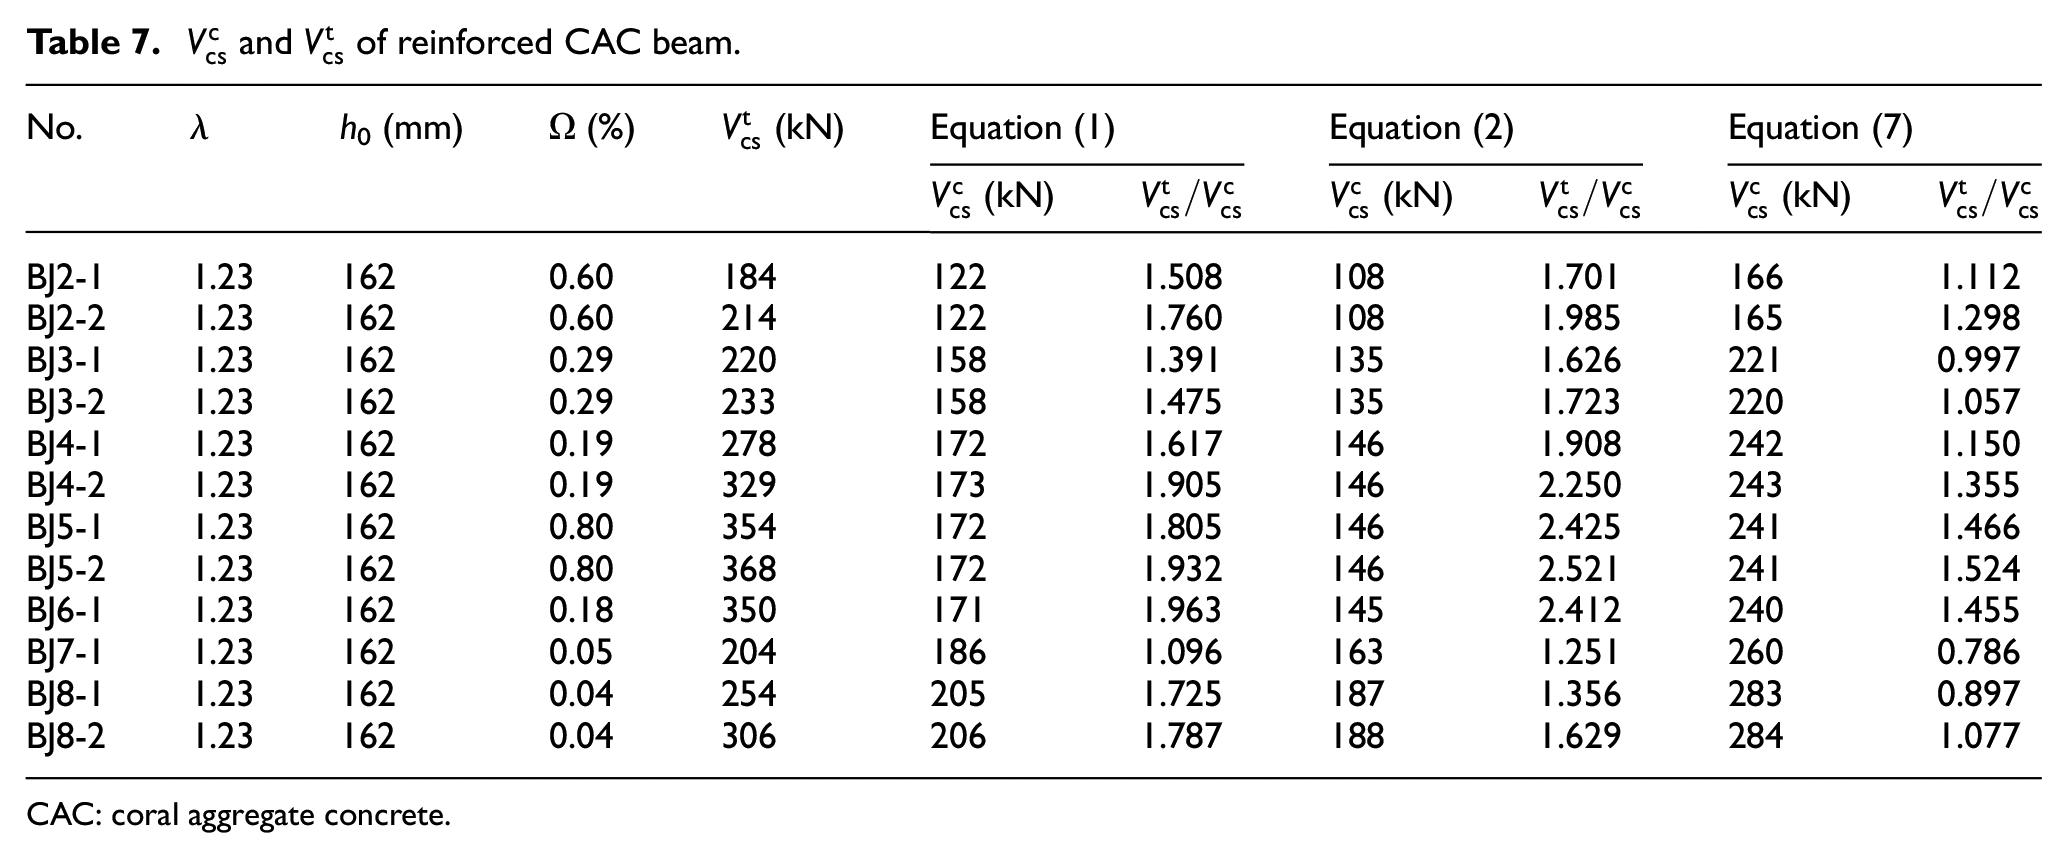
Using equations (1) and (2), the Vcs of reinforced CAC beam was shown in Figure 7 and Table 7. The mean values of
CAC: coral aggregate concrete.
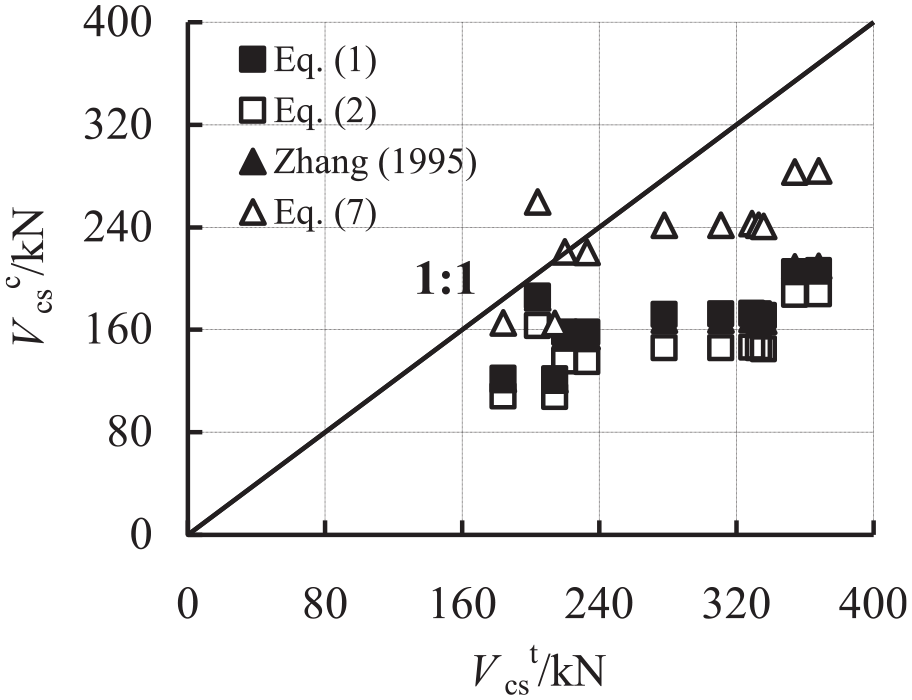
Comparison of
Vs coefficient correction
Figure 8 shows the steel corrosion status in C60-reinforced CAC beam. Figure 9 shows electrochemical test results of steel in CAC by linear polarization resistance (LPR) method and electrochemical impedance spectroscopy (EIS) method. Among them, the concrete cover thickness is 15 mm and the steel diameter is 10 mm, Rp is the polarization resistance (kΩ cm2), and Rct is the charge transfer resistance (kΩ cm2); the larger of Rp and Rct, the stronger anti-corrosion of steel bars in CAC. As shown in Figures 8 and 9, in addition to the stainless steels were not corroded, coated steels and common steel were corroded. Besides, in the ocean environment, the anti-corrosion of steel in CAC was as follows: 2205 duplex stainless steel > 316 stainless steel > new organic coated steel > zinc-chromium-coated steel > common steel. According to GB 50082-2009, mass loss rate (ω) of steel is given in Table 7. The research of Mohamed et al. (2014) shows that steel corrosion mainly influences the reduction of steel strength and section area. Consequently, in terms of stirrup corrosion, the calculation model for the Vcs of reinforced CAC beam is as follows
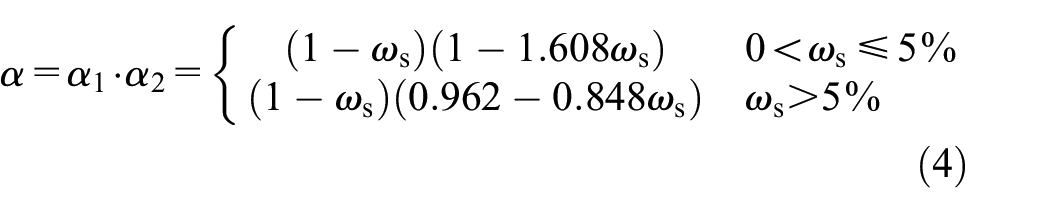
where α is the stirrup corrosion reduction coefficient, ωs is the mean section loss rate (%), and α1, α2 are the stirrup section and strength reduction coefficient; other parameters are equal in meaning with those in equation (2).
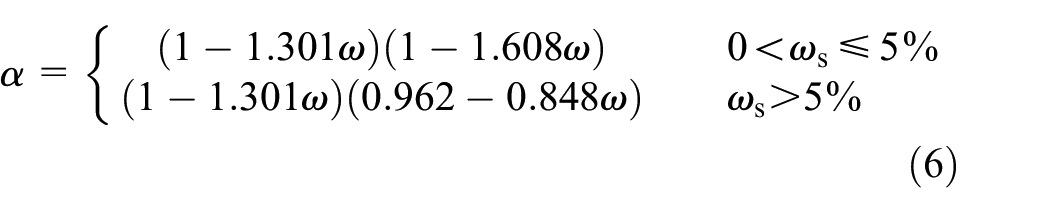
In the ocean environment, pitting corrosion of steel is easy to occur. Therefore, the minimum section of steel is the easiest to break. That is to say, the position of maximum section loss rate (ωsm) is the easiest to break. Therefore, ωsm used to calculate the α is more accurate. Wang and Zhong (2005) studied ωsm and mean section loss rate (ωs) of reinforced concrete, and the research showed that the ωsm and ωs form a linear relationship

In addition, the research shows that (Yuan et al., 2001; Zhang et al., 2014a) ω and ωs are roughly equal. Therefore, based on rationality and practicality, α is expressed as follows
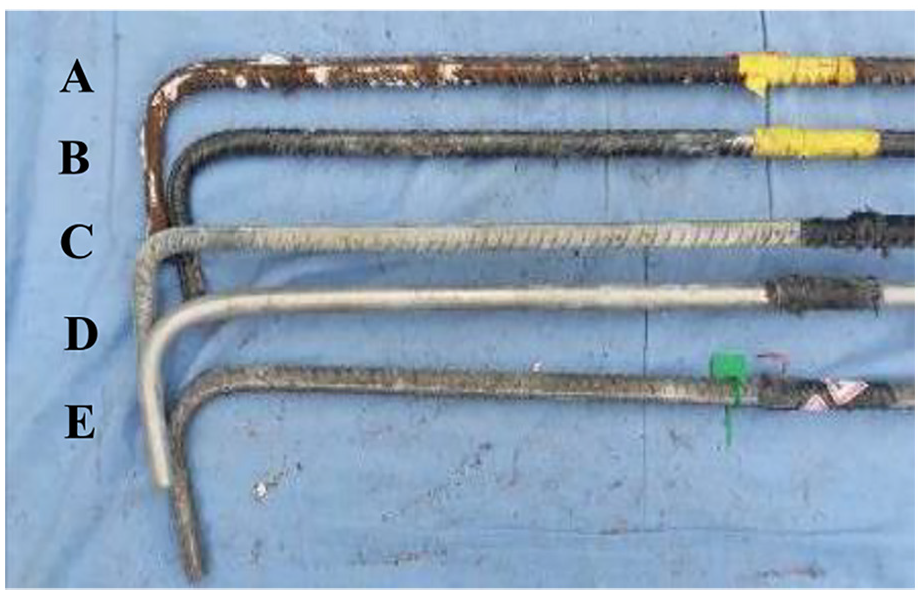
Steel corrosion status in C60 reinforced CAC beam (test time: 90 days).
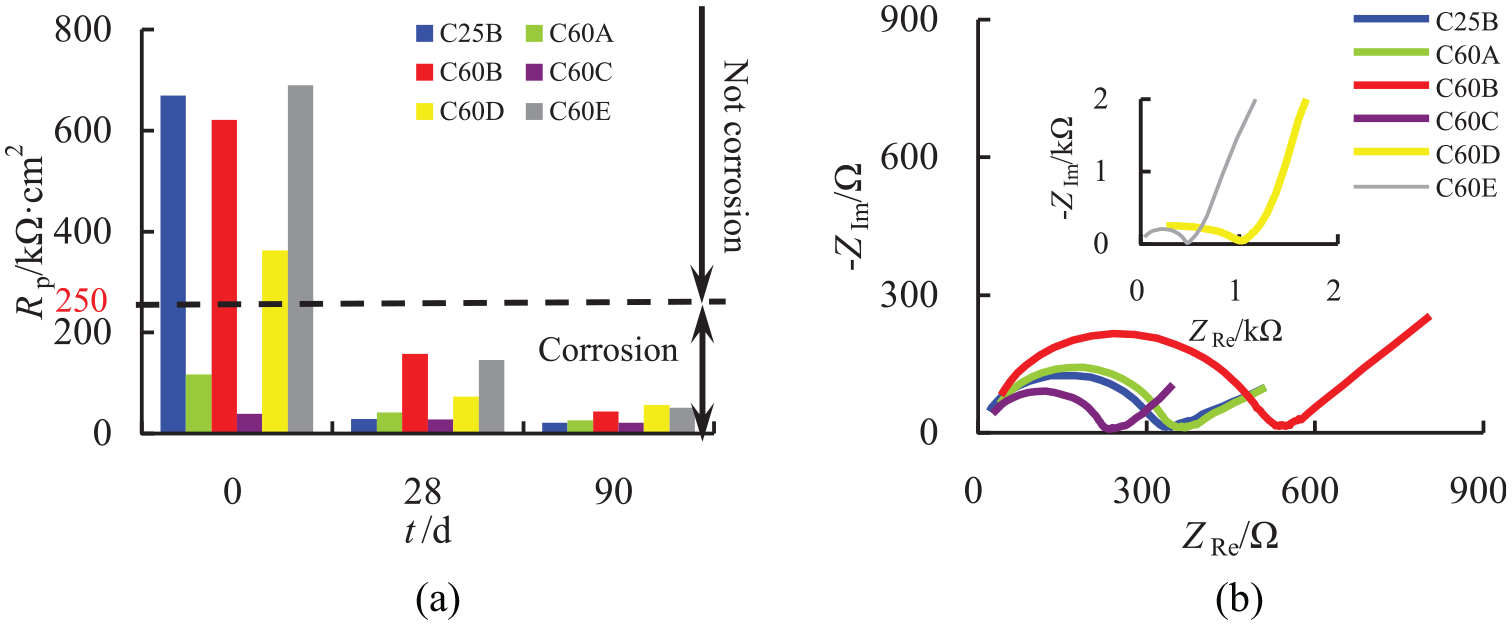
Electrochemical test results of steel in CAC: (a) LPR method and (b) EIS method (test time: 90 days).
Vc coefficient correction
According to equation (3), Vc could be replaced by (Vcs−1.25αfyvh0Asv/s). Figure 10 shows the relationship between Vc/(fcbh0) and λ with different reinforced CAC beam. As shown in Figure 10, the
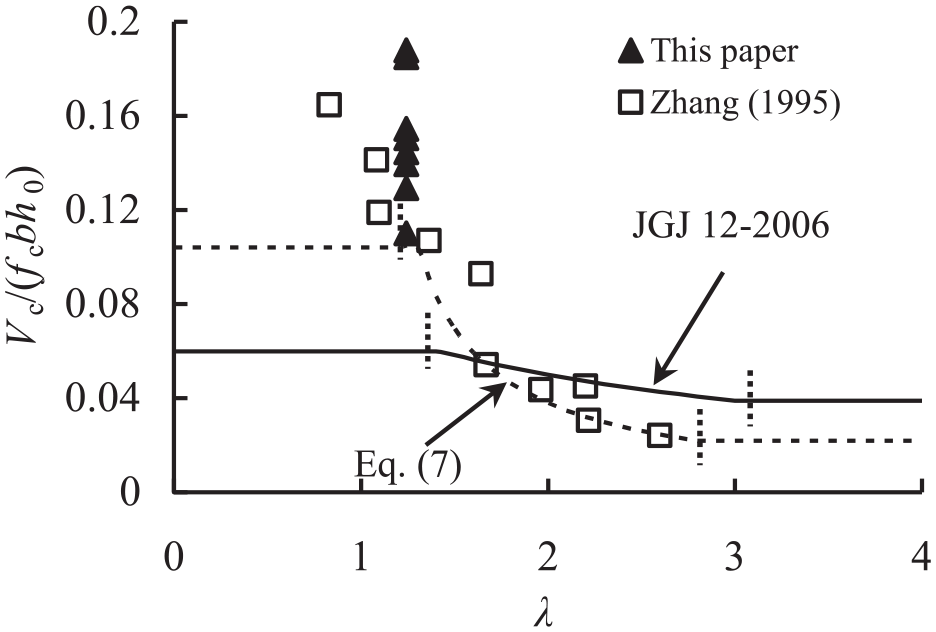
Relationship between Vc/(fcbh0) and λ of reinforced CAC beam.
While calculating the Vcs of reinforced OAC beam, the rule for coefficient of Vc was as follows: at the range of the shear compression failure (λ = 1–3), the coefficient indicated the “lower enveloping curve” of all test points. For Vcs of reinforced CAC beam in this test λ = 1.23 and in the study by Zhang (1995), λ = 0.84–2.60. As shown in Figure 10, when λ ≤ 1.3, the coefficient of Vc can be 0.104. When λ ≥ 2.8, the coefficient of Vc can be 0.022. Therefore, the coefficient of Vc could be obtained as follows: 0.1/(2.4(λ − 0.9)), namely, 0.042/(λ − 0.9).
Therefore, comprehensively consider the influence of high-strength CAC and stirrup corrosion, and the calculation model for the Vcs of reinforced CAC beam was as follows
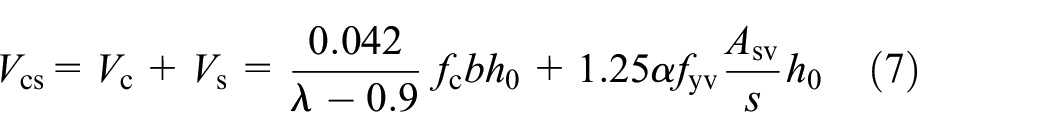
where Vc and Vs are shear capacity of concrete and stirrup (kN), and other parameters are equal to those in equations (2) and (6).
Using equation (7), the Vcs of reinforced CAC beam was shown in Figure 7 and Table 7. The mean value of
Calculation model verification
The Vcs of 11 reinforced CAC beams in Zhang (1995) was calculated according to equation (7). The basic parameter and calculation results of reinforced CAC beam were shown in Figure 11 and Table 8, and the literature (Zhang, 1995) model of
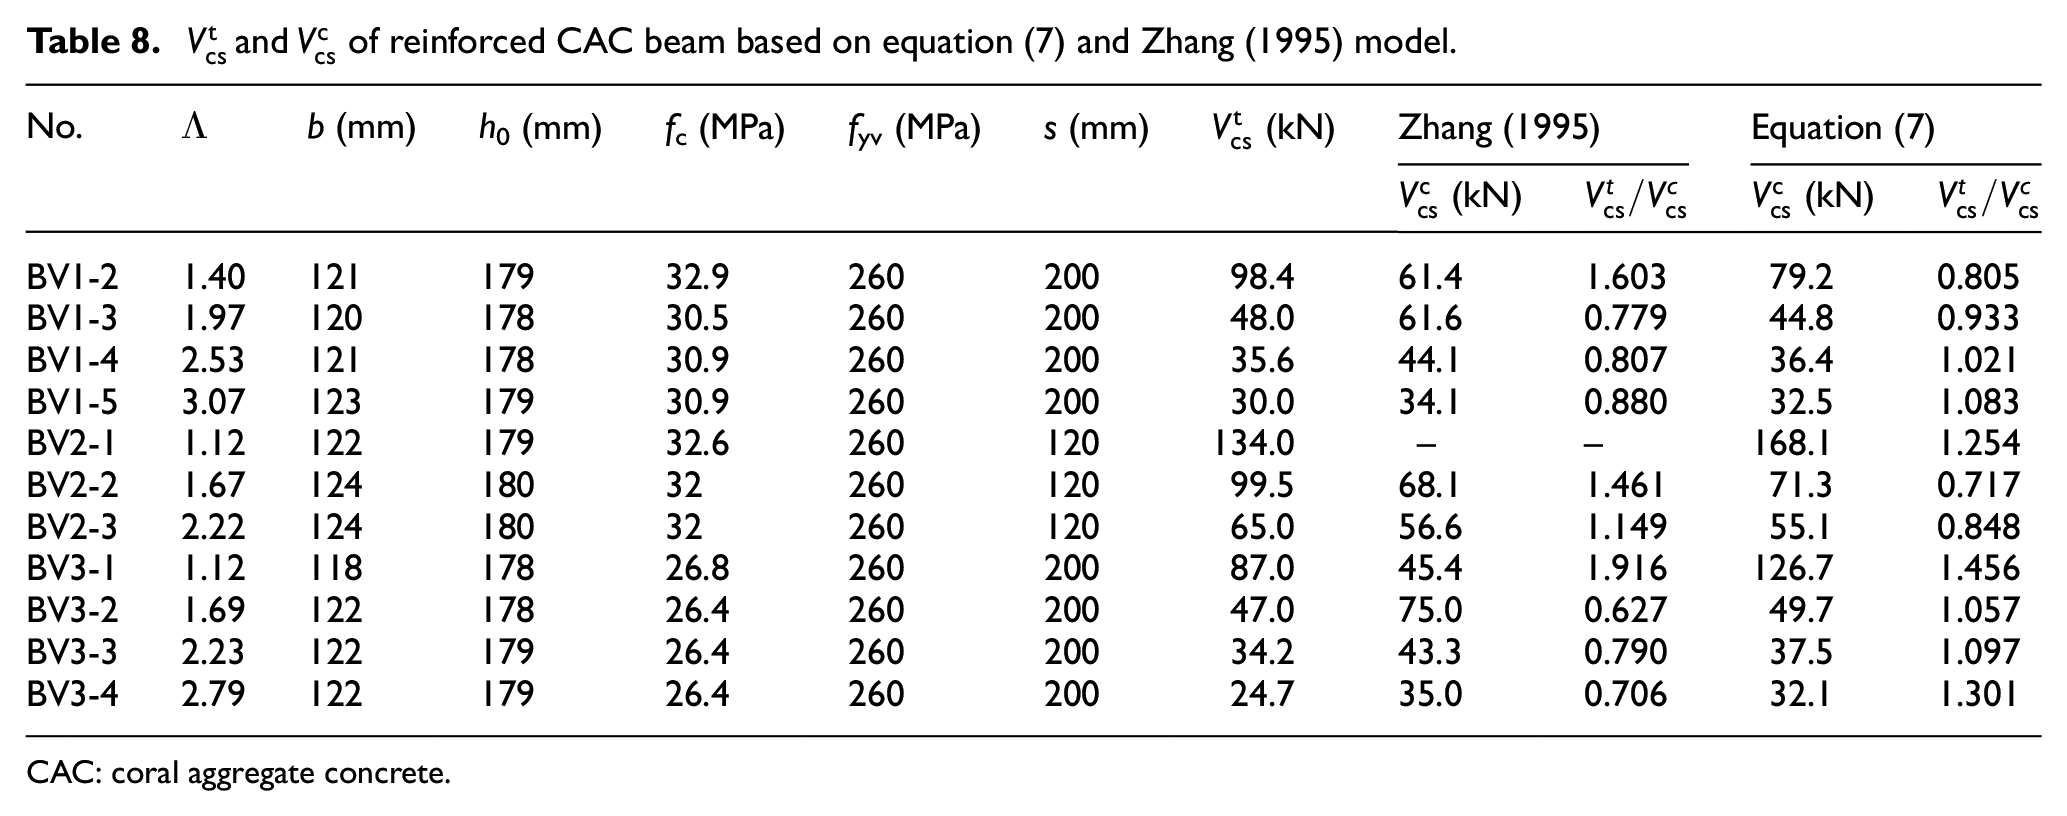
CAC: coral aggregate concrete.
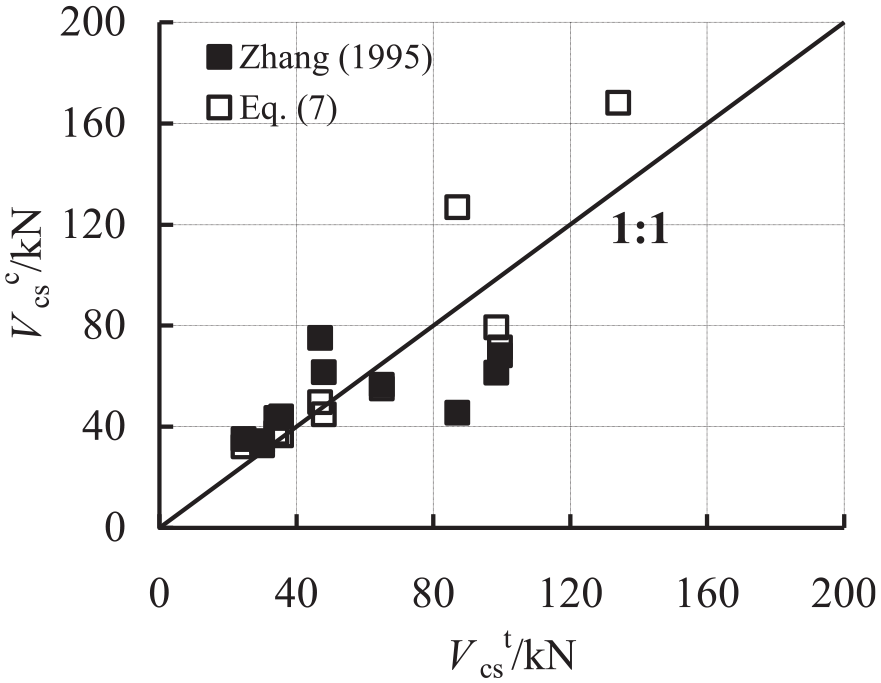
Comparison of
Conclusion
The failure mode of reinforced OAC beam and reinforced CAC beam was basically the same. In addition, due to the coral naturally porous structure, which has the characteristic of “absorb and return water,” this characteristic can effectively inhibit the development of inclined section cracks.
As the concrete strength increases, the normal section Vcr and inclined section Vcr and Vcs of reinforced CAC beam increased gradually. Furthermore, Vcr and Vcs of reinforced CAC beam were as follows: 316 stainless steel > common steel > zinc-chromium coated steel > new organic coated steel.
For the CAC structure in ocean engineering, in order to prolong its service life, the use of new organic coated steel was suggested.
Comprehensively considering the influence of high-strength CAC and stirrup corrosion, the calculation model for the Vcs of reinforced CAC beam was presented and was then verified.
Footnotes
Appendix 1
Acknowledgements
The authors gratefully acknowledge the financial supports from the National Natural Science Foundation of China under Grant Nos 11832013, 51678304, and 51878350; the Natural Science Foundation of Jiangsu Province under Grant No. BK20180433; the Guangxi Science Fund for Distinguished Young Scholars under Grant No. 2019GXNSFFA245004; and the Systematic Project of Guangxi Key Laboratory of Disaster Prevention and Structural Safety under Grant No. 2019ZDK006.
Declaration of Conflicting Interests
The author(s) declared no potential conflicts of interest with respect to the research, authorship, and/or publication of this article.
Funding
The author(s) received no financial support for the research, authorship, and/or publication of this article.