



Abstract
A truss arch tower is a large-span arch structure with multiple skewbacks. This tower is made of a large number of members with unique form, and contains more than five kinds of geometric features. The wind forces and the corresponding wind effects on the truss arch tower are notably complicated. In this study, wind tunnel tests were conducted to evaluate the wind forces on the steel latticed structure mentioned above using the high-frequency base balance technique. Four segmental models, including one arch foot of main truss, two arch feet of sub-truss, and one arch crown of main truss were tested in nominally smooth flow. The drag forces were measured and compared with several existing codes, including the British, American, and Chinese codes. The incidence angle effects and the interference effects on the drag coefficient were analyzed. The testing results showed that the direction of the wind forces has a marked effect on the whole truss tower. The solidity ratio and layout of the segmental models, including the cross-section and the centerline of the members, have critical effects on the drag forces.
Introduction
Steel truss towers are made of steel latticed members and are being increasingly used in high-rise structures, such as transmission towers. This type of structure is characterized by light weight, high flexibility, and low damping (Fu and Li, 2007; Li et al., 2017), and the wind load of steel latticed structures is one of the main controlling factors. Many structural failures and progressive collapses of the power transmission towers have been induced by strong wind (Asgarian et al., 2016; Holmes, 2008; Moon et al., 2009). Therefore, new types of truss towers with high stability and high wind resistance should be designed and constructed. A truss arch tower has a large span and multiple skewbacks, which takes advantages of its high structural stability characteristics. The wind forces on a truss arch tower structure are different and more complex than those on a regular steel truss tower. Thus, special studies of the parameter values and calculation methods for these wind loads are warranted to determine the wind loads in structural wind-resistance design.
The wind loads on steel truss towers can be evaluated by two methods: (1) wind tunnel test approach with global or local downscaled models of generic shapes and layouts and (2) computational fluid dynamics (CFD) approach. Studies have been conducted by CFD analysis combined with wind tunnel tests in order to calculate the wind forces acting on steel transmission towers more accurately. Yang et al. (2016) studied the wind loads acting on an angled steel triangular transmission tower by simplifying the tower geometry for their wind tunnel tests and CFD simulations. Deng et al. (2016) investigated the response of a transmission tower subjected to skewed incident winds. Calotescu and Solari (2016) studied the along wind load effects on latticed towers. Xie et al. (2017) conducted a study on wind-induced vibration of transmission tower systems. To decrease the computational time and cost of the simulations, Allegrini et al. (2018) predicted the drag force of a latticed transmission tower based on a computationally efficient porous media CFD model. However, determining the wind loads on a transmission tower with CFD remains infeasible with the currently available computational power.
The resultant force acts in the direction of the wind for the latticed structures and does not consider the calculation of the orthogonal side force in most codes. Being developed and verified on the basis of numerous tests (Bayar, 1986; Georgiou and Vickery, 1980; Whitbread, 1980), this method is highly effective for regular lattices subjected to crossflow. For the latticed structures with irregular or complex geometry at varied wind incidence angles, this method is difficult to apply. However, a modification factor of the wind force is considered with the solidity ratio method, which takes into account the shielding effect of the upstream lattice on the downstream lattice and the diffusion in its wake (National Building Code of Canada (NBCC), 2015). Wind tunnel tests have been most widely used to estimate the wind-induced structural dynamic response of normal structures, such as long-span bridges (Zhang and Ge, 2017; Zhang et al., 2019a, 2019b), building structures (MOHURD, 2012; Zhang and Li, 2017), and high-rise steel latticed structures (Carril et al., 2003; Prud’homme et al., 2018). These tests are the base of the present design codes. For steel latticed structures, there are two main methods (Prud’homme et al., 2014): (1) a global method in which the wind forces are evaluated directly on a whole truss or part of a truss and (2) a local method in which the wind forces are evaluated on each member separately. The first method has been adopted by most codes. This method is based on the drag coefficients determined as a function of the solidity ratio, which may introduce the correction factors of the wind incident angle and the aspect ratio of the truss (BSI, 2005). In the second method, the wind force on a member outside of any wake can be evaluated directly with the force coefficient of the section alone. The wind mean forces on a member need to be calculated using a velocity value that differs from the value of the unperturbed wind or force coefficients that considers the shielding effect. However, there is no local method available to determine the wind force on trusses made of angle members.
In wind tunnel testing, the high-frequency base balance (HFBB) testing technique is commonly used in the load measurements (Chen and Kareem, 2005; Xie and Garber, 2014). This popularity is observed not only because of the low cost, technical simplicity, compact size, and easy operation of this technique but also because of the simple demand for information about the geometric shape of the structures. In the HFBB testing technique, three overturning forces and three torsional moments induced by wind in three directions can be measured, and the shape coefficient can be obtained by considering the flow field effect and Reynolds number effect for the truss towers. Simiu and Scanlan (1996) determined the relationship between drag coefficients and Reynolds numbers of square-section circular-latticed tower structures when the length-to-width ratio is infinite. Georgakis et al. (2009) measured the drag coefficients of four different triangular-latticed mast configurations in a wind tunnel and reported that compared with various design standards, the drag coefficient is generally underestimated when its tested in nominally smooth flow tests, while it is overestimated under turbulent flow. Mara and Galsworthy (2011) completed a series of wind tunnel tests on a typical three-dimensional lattice frame and compared the experimental results to those measured for a corresponding prototype under similar flow conditions for different wind incidence angles. The conclusions of these researchers indicated that the model-scale section tests successfully evaluated the drag coefficient of a triangular-section lattice frame. Reynolds number mismatches between the model-scale section tests and the prototype tests had a small influence on both the individual member drag forces and the overall group effect. Prud’homme et al. (2014) evaluated the aerodynamic loads on simplified latticed structures by taking into account the force on each individual member and the effect of Reynolds number, edge shape, and thickness ratio in smooth and turbulent flows. The results showed that Reynolds numbers between 14,000 and 38,100 have a negligible effect on drag coefficients, and turbulence generally reduces the drag coefficients. Li et al. (2017) experimentally investigated the effects of the vertical and inclined leg members on the aerodynamic forces of circular steel tubular lattice structures and the interference mechanism between the leg and diagonal members. The aforementioned studies indicate that the HFBB technique has sufficient accuracy to measure the wind loads for the wind-resistant design of high-rise latticed structures.
The regulations on the wind loads of tower-type structures with single-leg supports are outlined in various design codes (BSI, 1986, 2013; CEPPEI, 2012; MOHURD, 2012; SEI, 2010). For example, the calculation methods for the shape coefficients of different body types, including latticed truss structures, tower structures, round-section components, and single-pole structures, are available in the Chinese structural design standard (MOHURD, 2012). However, regulations and research on the wind force coefficients of multi-leg supported structures are rare.
This study experimentally investigated the aerodynamic loads of a truss arch tower using the HFBB technique under nominally smooth flow and elucidated the underlying mechanism of wind loads by considering the effect of the multiple skewbacks. The drag coefficients of four segmental models of the truss arch tower were tested under different wind incidence angles. The interference effect between nearby skewbacks was revealed and described with an interference factor.
Wind tunnel tests
Test conditions
The wind tunnel tests using the HFBB technique were conducted in the CSU-2 wind tunnel of Central South University, Changsha, China. The width and height of the cross-section were 12. and 3.5 m, respectively. The wind speed ranged from 0 to 20 m/s. All experiments were carried out in nominally smooth flow with a turbulence intensity lower than 0.8%. The nonuniformity of the wind velocity in the test region is less than 2%. The fluctuating wind forces were measured under a wind speed of 12 m/s with a carefully calibrated six-component HFBB.
Truss arch tower geometry
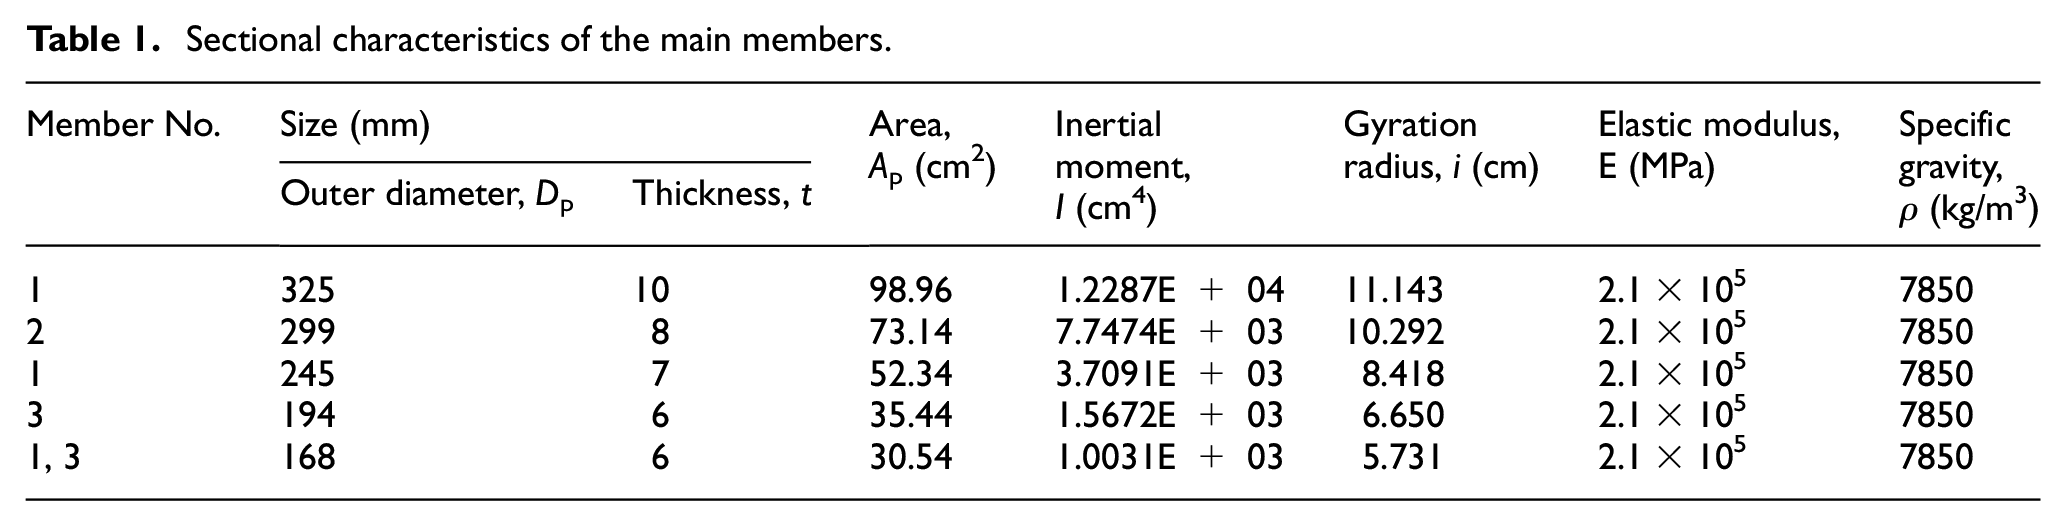
The truss arch tower is a three-axis symmetrical latticed structure with a span of 200.8 m that is supported by six legs, as shown in Figure 1. This tower is composed of one main truss and four sub-trusses. The inside chord of the main truss is a semi-arc with a diameter of 100.4 m. Four arch-shaped sub-trusses enhance the main truss on both sides of both legs. The configuration and the corresponding global coordinate system of the structure are illustrated in Figure 1. The truss tower is composed of 3462 truss members with different geometric characteristics. All of them are made of round steel pipes. Table 1 summarizes the geometrical characteristics of the prototype.

Configuration of the truss arch tower (unit: mm): 1-chord member; 2-vertical web member; 3-diagonal web member.
Sectional characteristics of the main members.
Four typical segments of the truss arch tower, including one arch foot of the main truss (AFMT), two arch feet of the sub-truss (AFST), and one arch crown of the main truss (ACMT), as shown in Figure 1, were selected for wind tunnel tests. The scaled ratio is set as 1/20. The heights
External diameters and Reynolds numbers of the cylinder members.
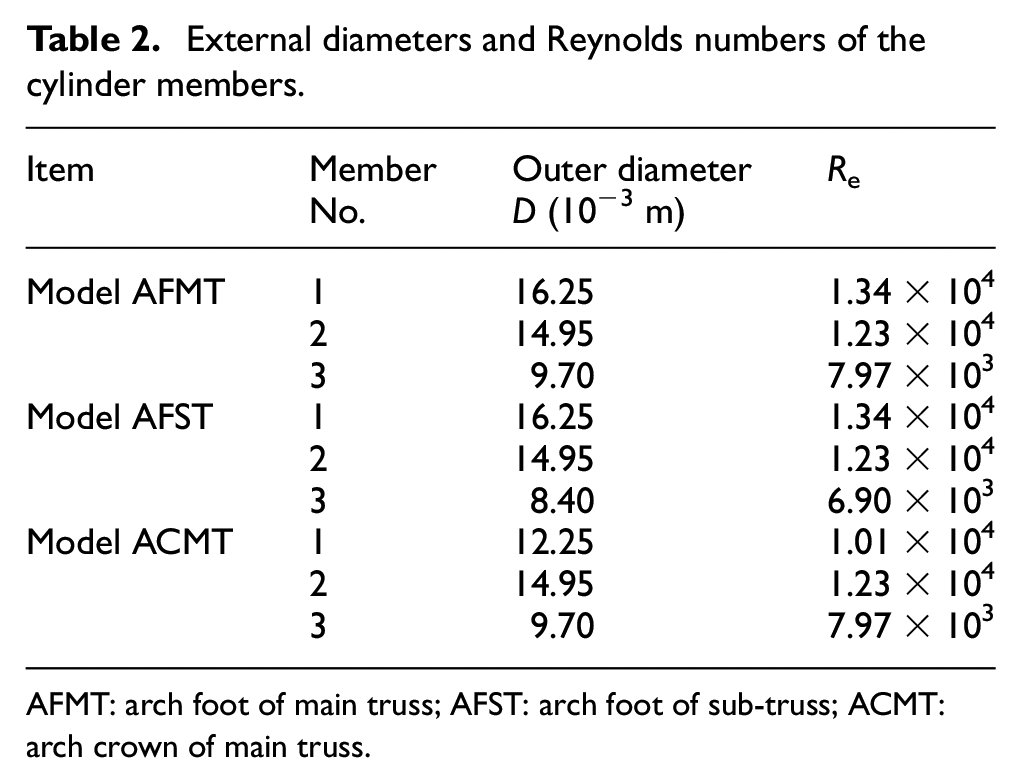
AFMT: arch foot of main truss; AFST: arch foot of sub-truss; ACMT: arch crown of main truss.
Test cases
The wind incidence angle β for the segmental models is defined as shown in Figure 2. The interval of the wind incidence angle is 15°. The general views for the location and local coordinate system of segmental models are illustrated in Figure 3. The segmental models were fixed vertically on the HFBB using the base-plate, which was approximately 120 mm away from the bottom wall of the CSU-2 wind tunnel, as shown in Figure 4. The transverse bracing was set as the end plate. Considering the complex geometry, arched sectional axis, small diameter (8.4–16.25 mm), and small subcritical Reynolds number effect of the cylinder members for the segmental models, the end effect was not to be considered in this study. The HFBB coordinate systems were consistent with the local coordinate systems of the segmental models.
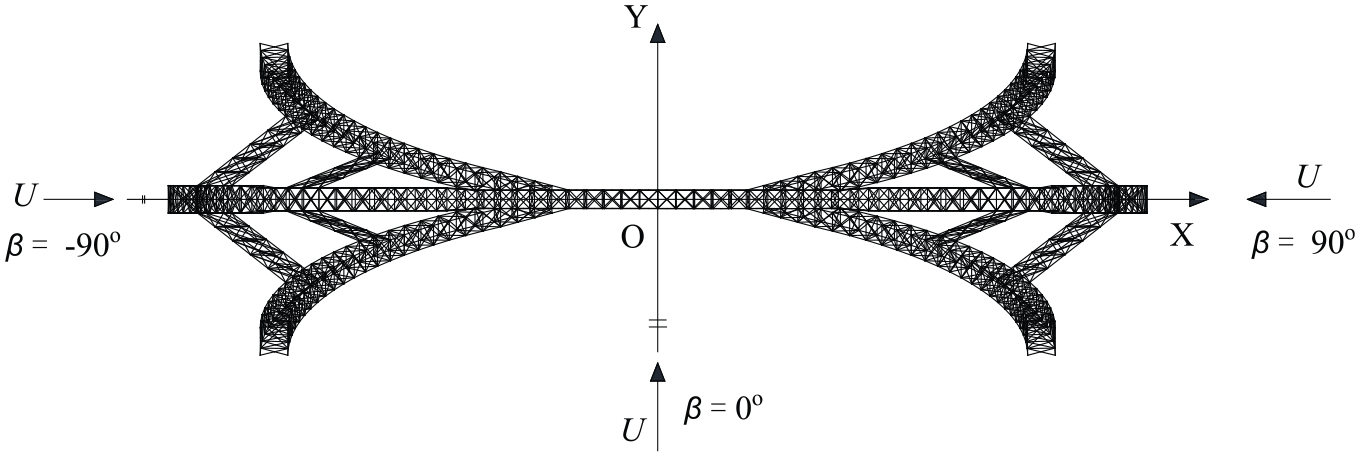
Definition of the wind incidence angle.

Locations and local coordinate systems of segmental models.
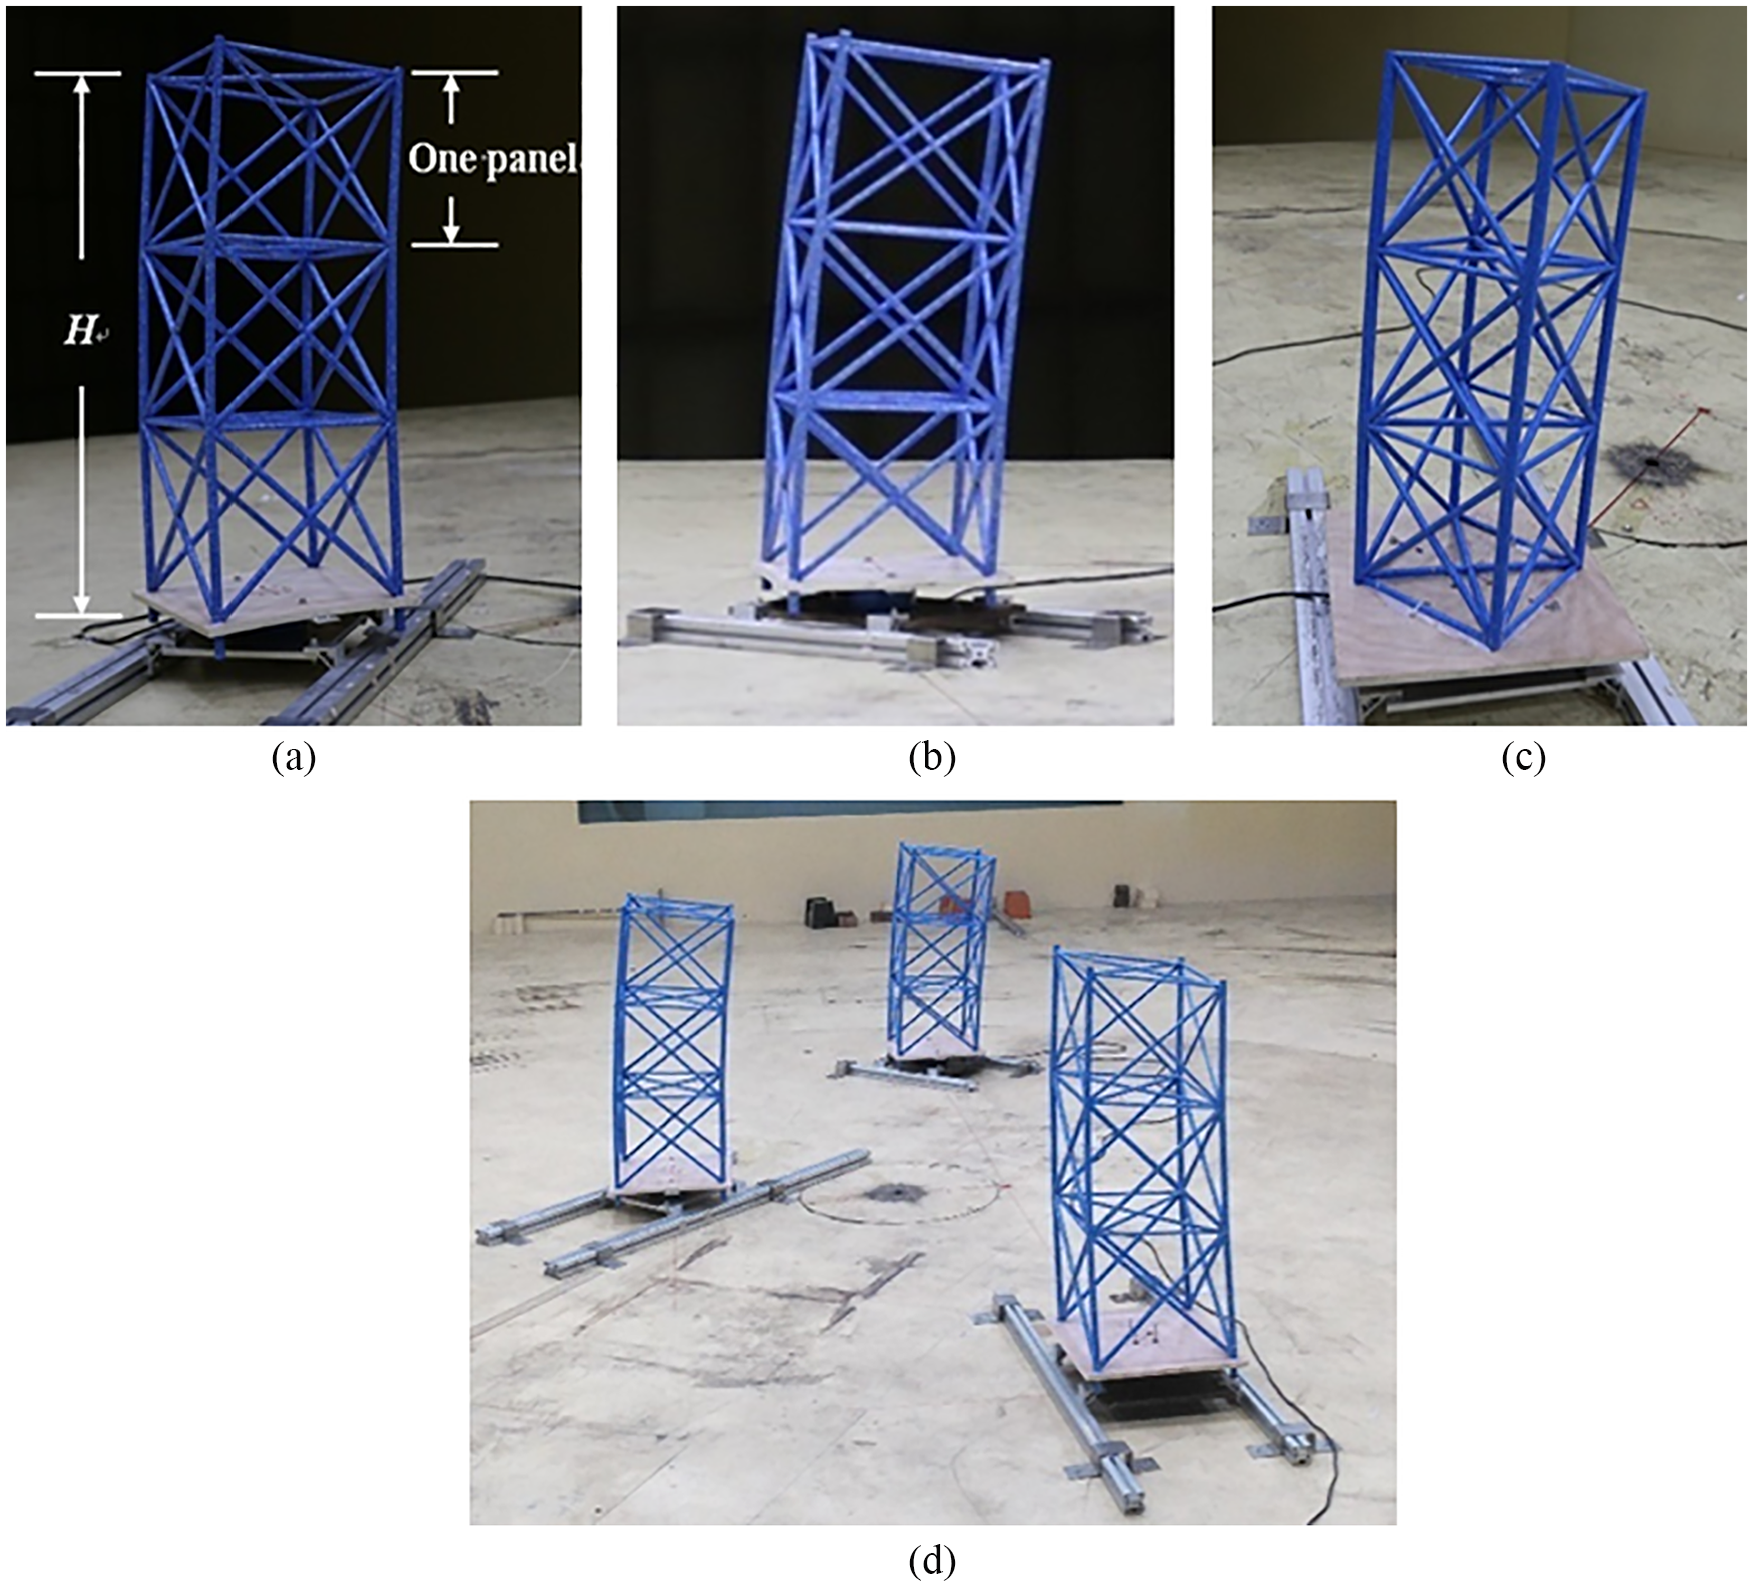
Photos of the segmental models in the wind tunnel: (a) AFMT in Case 1; (b) AFST in Case 2; (c) ACMT in Case 3; and (d) three segmental models in Case 4.
The center distance 36.9 m of the AFMT and AFST sections was smaller than the tower height 100.4 m. At different wind incidence angles, the degree of occlusion between the three arch feet for the truss arch tower was different; therefore, the interference effect of nearby trusses was considered. To investigate the characteristics of the drag coefficient, the interference effect and the skewed wind loads of the latticed truss tower, four test cases were designed. All test cases are listed in Table 3 and shown in Figure 4. Cases 1 to 3 investigated the local drag coefficient of segmental models of AFMT, 1#AFST, and ACMT at different wind incident angles, respectively. The interference effect of nearby segmental models of the skewbacks was ignored. Case 4 investigated the local drag coefficients of segmental models of AFMT and 1#AFST by considering the interference effects of nearby segmental models of the skewbacks. In Case 3, the segmental model of ACMT was horizontally arranged to change the wind attack angle easily, and the wind attack angle varied from –12° to +12° with an interval of 1°.
Illustrations of the wind tunnel test cases.

HFBB: high-frequency base balance; AFMT: arch foot of main truss; AFST: arch foot of sub-truss; ACMT: arch crown of main truss.
Experimental results and discussion
Data process
The measured data were processed and expressed using dimensionless parameters, as shown in equation (1)

where
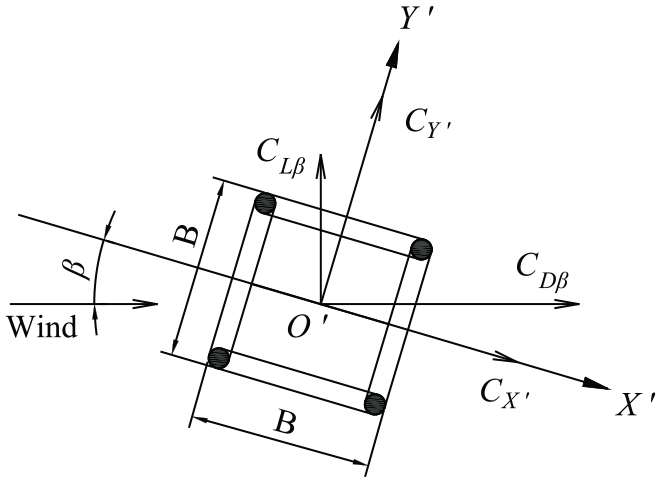
Definition of aerodynamic forces in body axis and wind axis coordinates.
The measured dimensionless drag and lift parameters of the segmental models in the body axis coordinates,


where


Effect of wind incidence angles
The aerodynamic force parameters

Aerodynamic force parameters

Aerodynamic force parameters
The drag parameter

Drag parameters
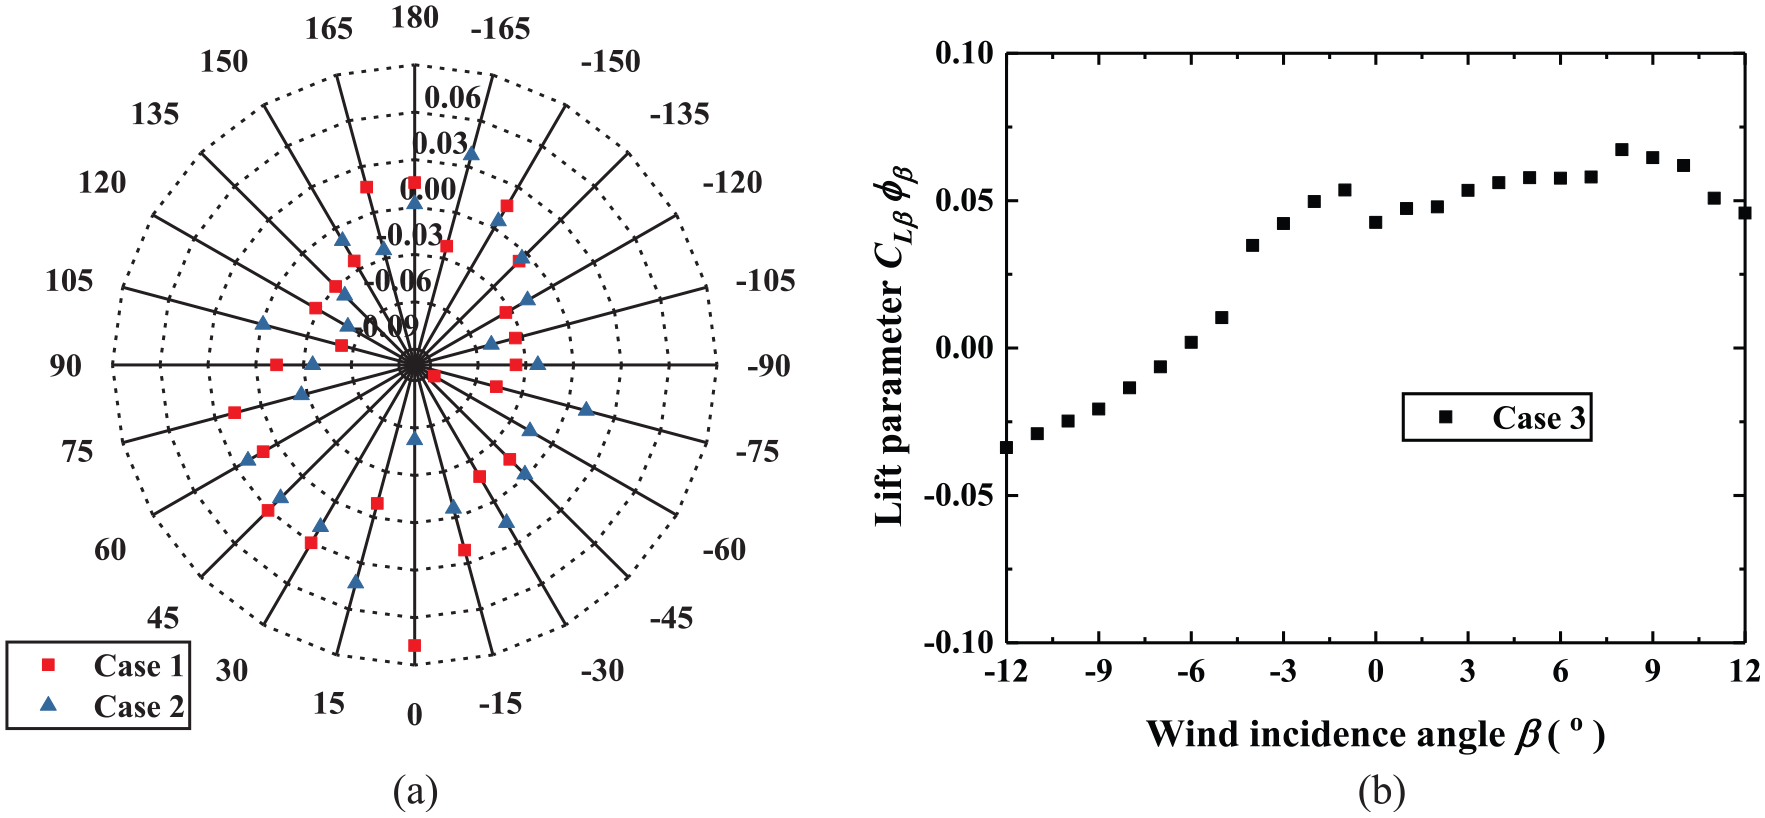
Lift parameters
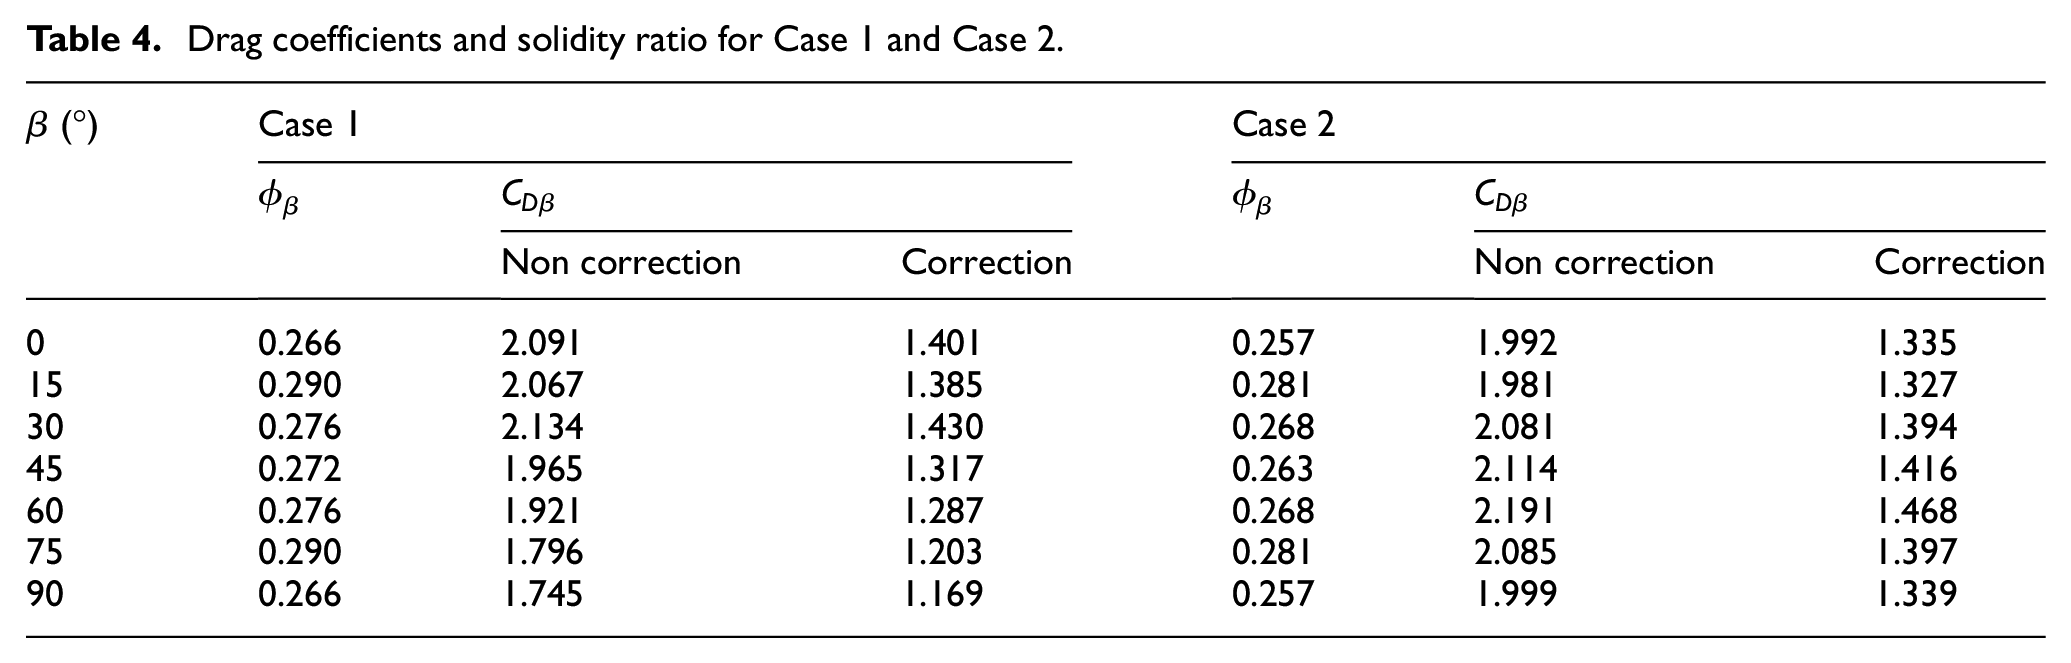
The drag coefficients
Drag coefficients and solidity ratio for Case 1 and Case 2.
Drag coefficients and solidity ratio for Case 3.

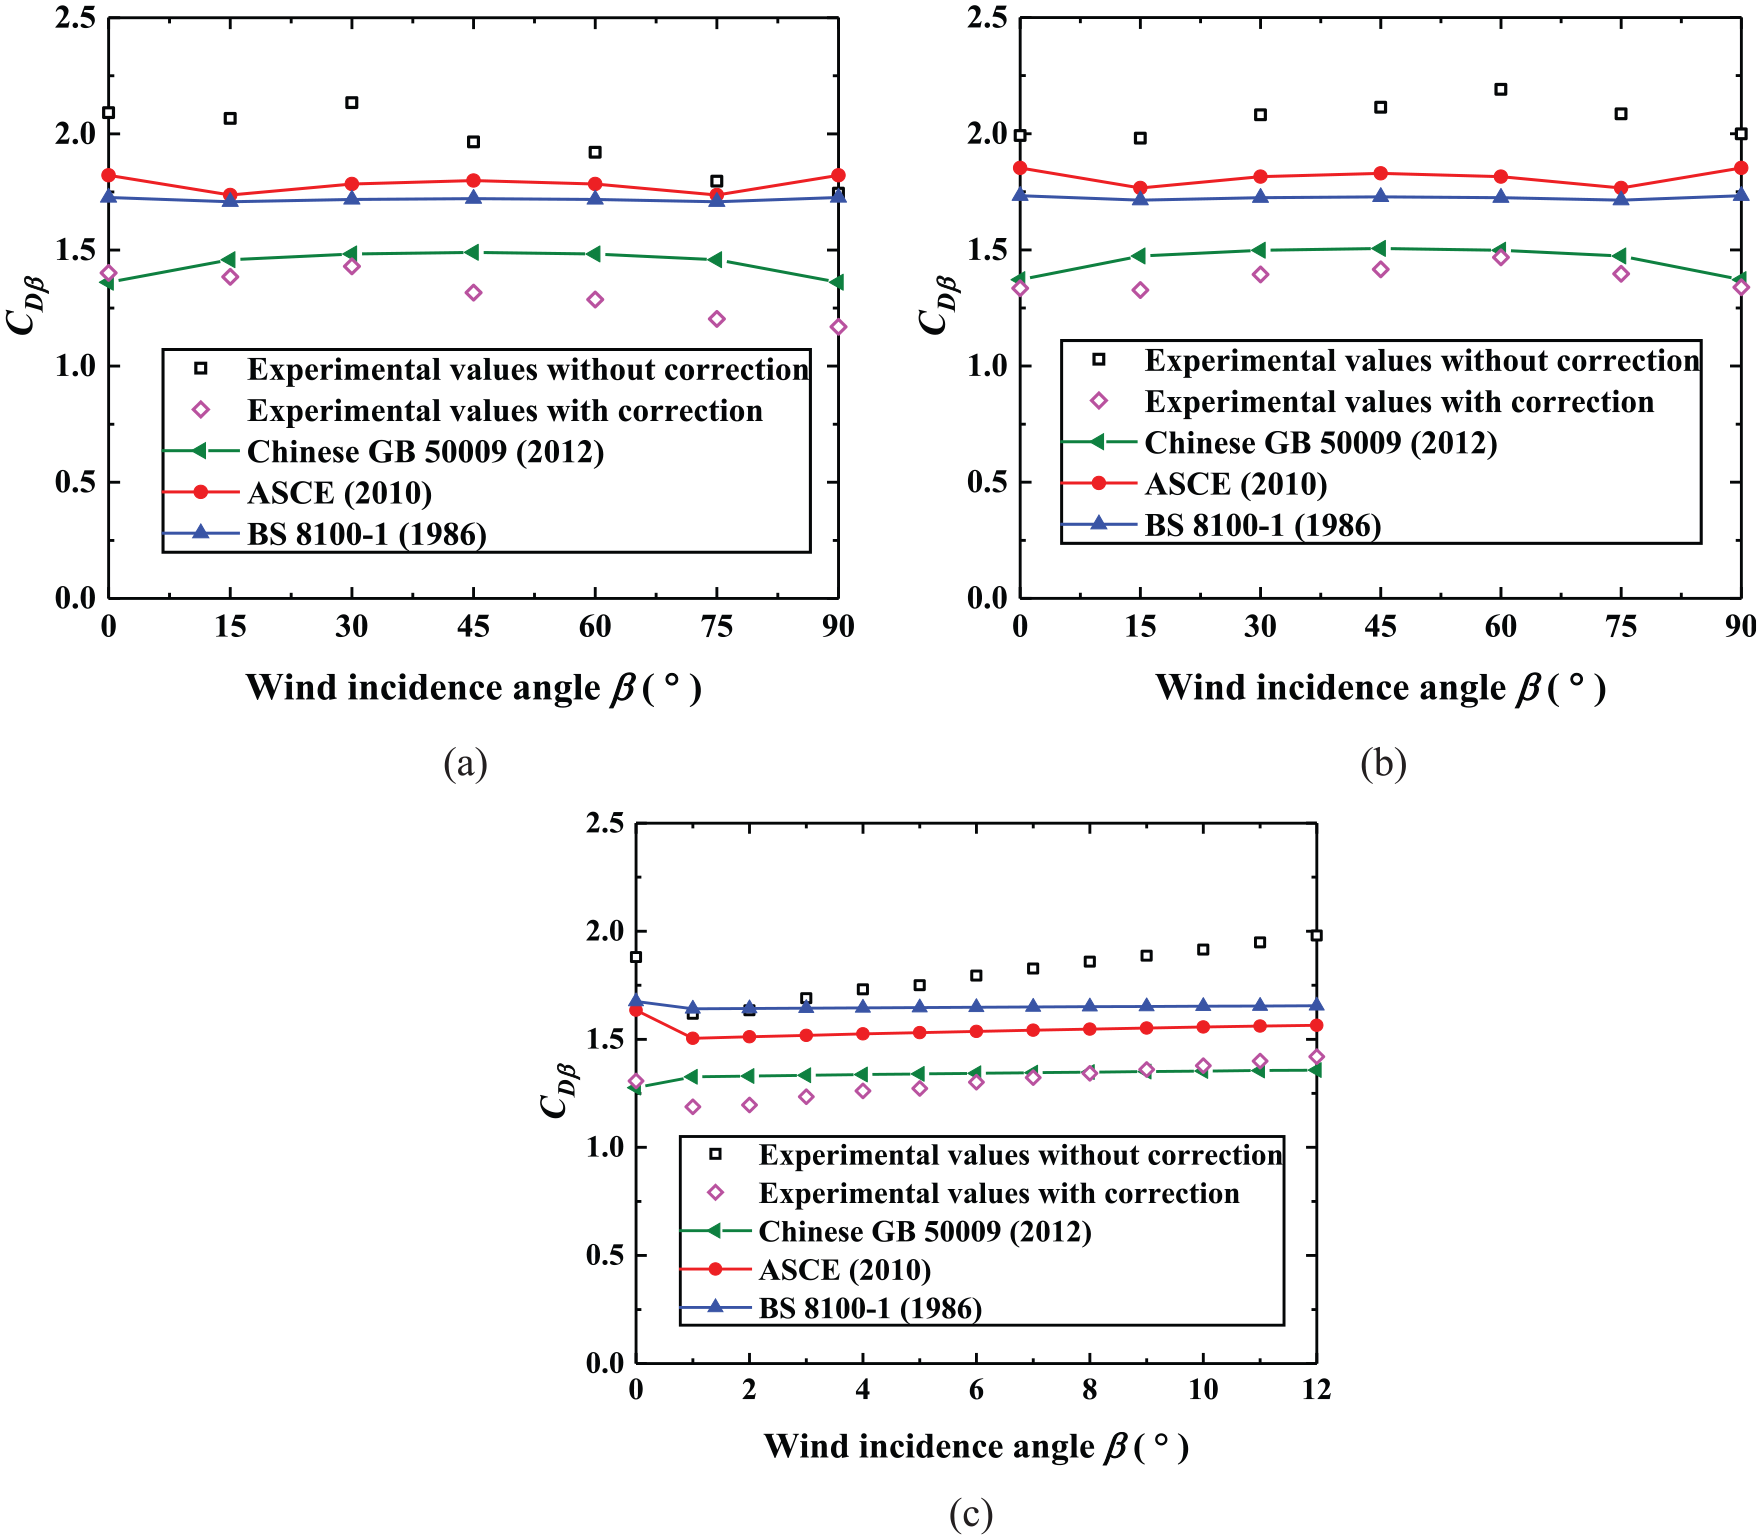
Drag coefficients of separate segmental models: (a) Case 1; (b) Case 2; and (c) Case 3.
The varying trends of
Interference effect
The aerodynamic force coefficients of separate segmental models have been discussed in the above text. In an actual situation, the AFMT and AFST are close and on the same side of the global X-axis. The interference effects on the drag coefficients
Figure 11 shows the comparison of the drag coefficients of the AFMT and 1#AFST for Case 1, Case 2, and Case 4 in the incidence angle range of 0°–90°. For both AFMT and 1#AFST in Case 4,

Comparison of the drag coefficients for Case 1, Case 2, and Case 4.
To conveniently describe the interaction of nearby skewbacks, the interference factor

where
Interference factor
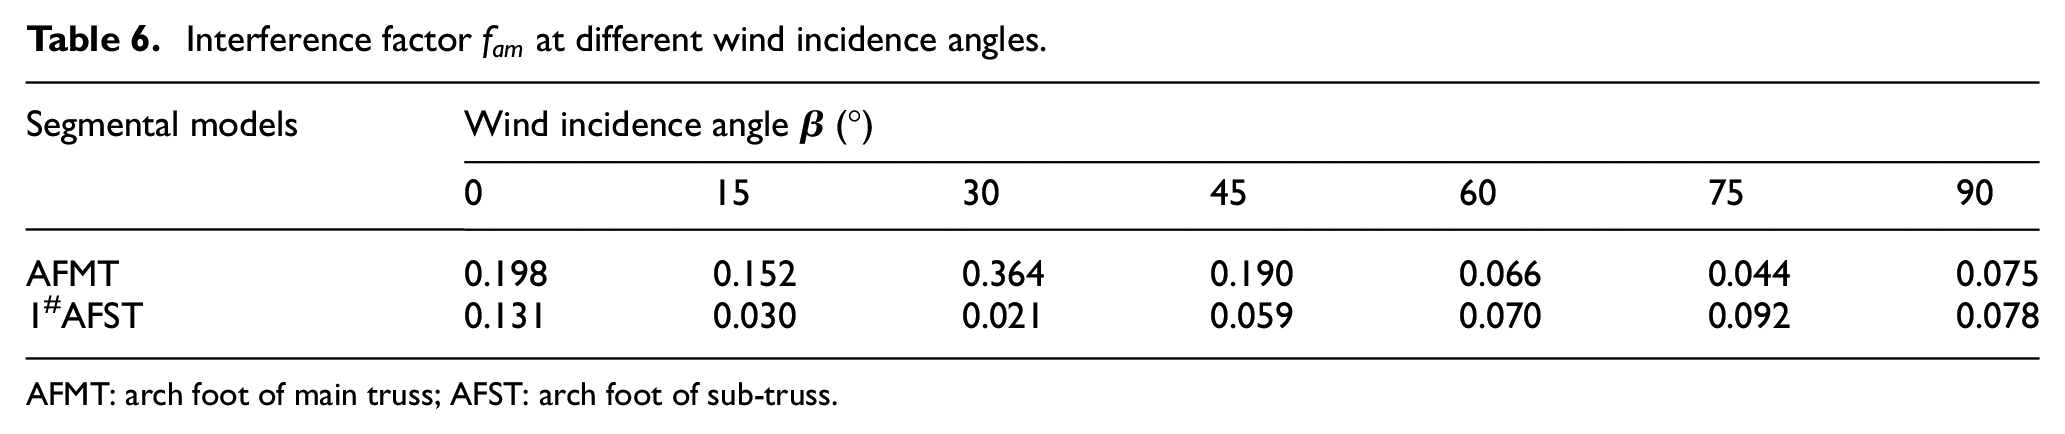
AFMT: arch foot of main truss; AFST: arch foot of sub-truss.
When the approaching wind flows through the three segmental models for Case 4, the free shear layer shed from the upstream segmental models reattaches on the downstream segmental model immersed in the wake region of the upstream segmental model, thereby developing a quasi-stationary wake between them. As a consequence, the drag coefficient of the downstream segmental model is reduced differently at different wind incidence angles, which is smaller than that of the separate segmental model. Meanwhile, there also exist obvious discrepancies of
In summary, the experimental investigation of the interference mechanism of the three segmental models implies that the presence of nearby skewbacks in the truss tower would decrease the drag coefficients of separate sections of the arch foot to varying degrees with the wind incidence angle. For this circular-steel-made truss tower, the
Conclusion
In this study, the aerodynamic forces of a truss arch tower were experimentally investigated through wind tunnel testing. The drag coefficient of three typical scaled segmental models was measured using the HFBB technique under nominally smooth flow. The effects of incidence angle and interference from nearby skewbacks were discussed. The major findings are summarized as follows:
The drag coefficients of the segmental models for the truss arch tower are generally smaller than the values outlined in the BS 8100 code and ASCE code and are close to the Chinese code. The drag coefficients obtained from the codes are on the safe side, except for the individual incidence angles in the range of 0°–15°, which are calculated by using the Chinese code.
A comparison between the values of
The drag coefficient of the downstream segmental model is smaller than that of the separate segmental model because of the interference effect. For this particular truss arch tower, the drag coefficient of AFMT is most sensitive to the interference of nearby skewbacks under a wind incidence angle of 30°.
Footnotes
Acknowledgements
The authors acknowledge the contributions of M.A. Xiongjie Liu and Dr. Xiaoyan Zhao studying at Central South University in performing the experimental phases of the study.
Declaration of Conflicting Interests
The author(s) declared no potential conflicts of interest with respect to the research, authorship, and/or publication of this article.
Funding
The author(s) disclosed receipt of the following financial support for the research, authorship, and/or publication of this article: The research presented in this paper was supported by the National Natural Science Foundation of China under project no. 51508574, project no. U1534206 and the National Key R&D Program of China under project no. 2017YFB1201204; their support is gratefully acknowledged.
