
Abstract
Vibration-based structural damage identification through optimization techniques has become an interesting research topic in recent years. Dynamic characteristics such as frequencies and mode shapes are used to construct the objective function. The objective functions based on only frequencies are not very sensitive to damage in large structures. However, objective functions based on both mode shapes and frequencies are very effective. In real measurement condition, the number of installed sensors is limited, and there are no economic reasons for measuring the mode shapes at all degrees of freedom. In this kind of circumstances, mode expansion methods are used to address the incompleteness of mode shapes. In this article, the system equivalent reduction and expansion process is applied to determine the unmeasured mode shapes. Two experimental examples including a cantilever beam and a truss tower are investigated to show system equivalent reduction and expansion process’ efficiency in estimating unmeasured mode shapes. The results show that the technique used for expansion is influential. Damage identification is formulated as an optimization problem, and the residual force vector based on expanded mode shapes is considered as an objective function. In order to minimize the objective function, grey wolf optimization and Harris hawks optimization are used. Numerical studies on a 56-bar dome space truss and experimental validation on a steel frame are performed to demonstrate the efficiency of the developed approach. Both numerical and experimental results indicate that the combination of the grey wolf optimization and expanded mode shapes with system equivalent reduction and expansion process can provide a reliable approach for determining the severities and locations of damage of skeletal structures when it compares with those obtained by Harris hawks optimization.
Keywords
Introduction
Identification of damage and development of methods for structural health monitoring aimed at maintaining safety and satisfying economic considerations has been the subject of extensive research studies over the past years. Damage can cause changes in dynamic characteristics such as natural frequencies and mode shapes. Damage detection techniques can be categorized as inverse and direct methods. In inverse method, typically the finite element model (FEM) is utilized for system model updating and objective functions are determined. In direct method, modal characteristics are estimated using measured responses. Then damages are detected by highlighting changes in modal characteristics (Hosseinlou and Mojtahedi, 2016). Generally, failure detection is classified into two categories: (a) damage detection and (b) crack detection. Crack modeling is performed using parameters such as geometry, location, and depth of crack. However, to model the more general type of damage in structural elements, stiffness reduction is usually considered. Reduction of stiffness could be caused due to various factors, such as corrosion, erosion, fatigue, hysteretic degradation, and so on. In the past few years, machine learning and optimization algorithms have been developed to solve the inverse problems of damage detection. Due to extensive studies in failure identification, a summary review of recent developments is listed in Table 1.
A summary review of recent developments in failure identification.

There are numerous degrees of freedom (DOFs) in structures modeled as a discrete system. Therefore, a large number of frequencies and mode shapes are obtained. Identifying all mode shapes is impossible (Humar et al., 2006). There are two common solutions to address the incompleteness of mode shapes. First approach involves the following steps: FEM is reduced to the size of the measured DOFs using a variety of techniques. Ghannadi and Kourehli (2018) reviewed and presented a comprehensive overview of different FEM reduction techniques such as Guyan, improved reduced system (IRS), iterated improved reduced system (IIRS), and system equivalent reduction and expansion process (SEREP). Wilde (2008) eliminated rotational DOFs of a cantilever beam by SEREP, so a reduced model of the beam was obtained. The reduced model was used for subsequent FEM updating and damage detection. Ettefagh et al. (2015) developed a damage-detection algorithm based on FEM updating and model reduction using Guyan. The aforementioned study used an experimental beam under real environmental conditions to evaluate the efficiency of the proposed method. Yin et al. (2017) developed a probabilistic methodology based on FEM reduction technique and Bayesian inference for a bolted connection damage identification. Dinh-Cong et al. (2018b) presented a two-stage method of damage assessment in truss structures. At first, they introduced a new damage indicator called normalized modal strain energy–based damage index, and they subsequently located the damage. In the second stage, teaching-learning-based optimization (TLBO) was utilized as an optimization scheme to determine damage severity. Moreover, they used a Neumann series expansion to reduce the DOFs. Kourehli (2017) proposed a method based on incomplete static responses and least square support vector machine (LSSVM). The latest study on damage detection using SEREP reduction and particle swarm optimization (PSO) has been presented by Cancelli et al. (2019). The method consists of three stages: (a) retrieving modal properties through a stochastic subspace identification algorithm, (b) reconstructing a reduced-order stiffness matrix through SEREP technique, and (c) reconstructing an FEM optimized with a PSO. Some of the other damage detection methods based on model reduction techniques can be found in Hosseinzadeh et al. (2016, 2017, 2019) and Kourehli et al. (2013).
The second group of solutions to overcome limited measurements are expansion techniques. In this method, mode shapes of unmeasured DOFs are estimated. Hosseini et al. (2017) introduced a damage-detection method based on modal characteristics and improved data expansion. Au et al. (2003) performed a damage assessment procedure by SEREP and genetic algorithm for beam-like structures. Miguel et al. (2006) investigated Guyan and SEREP on a truss tower. Their results indicated a weak performance of Guyan and high accuracy of SEREP in estimation of unmeasured mode shapes. Guyan is a static method and may give accurate mode shape expansion estimates only when there are enough DOFs to represent the mass/inertia of the actual tested dynamic system (Chen, 2010). The static method properly expands only the first mode with a modal assurance criteria (MAC) close to the ideal value. For instance, Chen (2008) compared different expansion methods where it was clearly observed that Guyan has a proper correlation in the first mode.
Abdalla and Al-Khawaldeh (2012) presented a methodology for optimal sensor placement based on expanded mode shapes and PSO. In this study, unmeasured DOFs were estimated by SEREP. Zhao and Zhang (2011) developed a method for damage detection and quantification based on residual force vector and mode shape expansion. Changes observed in residual force vector before and after damage occurrence were used to localize damages, and then to determine the extent of damage by allocating damage coefficients. In this study, to solve the problem of the incompleteness of measured mode shapes, a mode shape expansion algorithm based on SEREP was proposed.
When using SEREP for mode shape expansion, an FEM is required to obtain the mode shapes. So, Chen et al. (2019) introduced a non-model-based expansion technique to expand vibration characteristics without using an FEM.
Some mode shape expansion methods for offshore jacket platforms were proposed in Liu and Li (2012, 2013). Chen et al. (2012) introduced a new approach for expanding incomplete experimental mode shapes, which considers modeling errors in the analytical model and quantifying the uncertainties in vibration modal data.
Measuring all DOFs is impossible due to limitation in number of installed sensors. Hence, this study presents a new approach based on limited measured locations. First, a mode shape expansion method called SEREP is employed. In this method, the unmeasured mode shapes are determined by SEREP transformation matrix. To show the efficiency of SEREP for estimation of unmeasured mode shapes, two experimental examples including a cantilever beam and a truss tower are studied. Inverse problems of damage detection are then formulated as an optimization problem. Subsequently, the residual force vector based on expanded mode shapes was utilized as the objective function. The minimization process is carried out via grey wolf optimization (GWO) and Harris hawks optimization (HHO). To demonstrate the performance of proposed method based on expanded mode shapes and optimization algorithms for structural damage detection, numerical and experimental examples are investigated.
Methodology of damage detection
The damage is simulated as a reduction of stiffness. Hence, the stiffness matrix of the eth damaged element can be formulated as

where
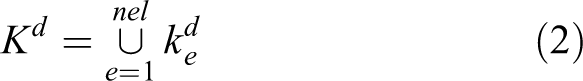
where nel represents the number of elements.
The eigenvalue equation for the damaged structure will be as follows

where
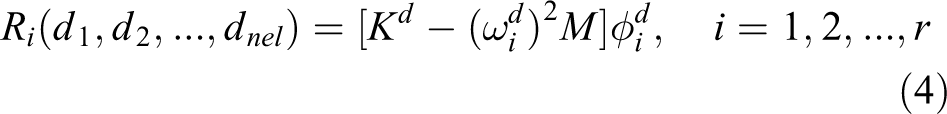

where F is considered to be the objective function, r is the number of modes used, and R is the residual force vector. Variations in masses are neglected and M is assumed to be the same in both healthy and damaged states. The valid and minimum value of F is zero. Optimization algorithms can be utilized in this step to set damage index (de
) by minimizing the objective function. Therefore,
To consider the real measurement conditions, random noise levels are imposed as follows
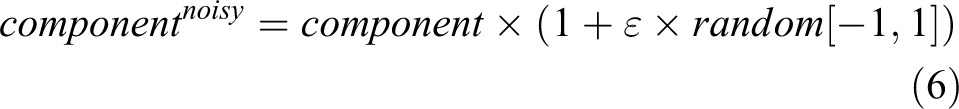
where component represents natural frequencies and mode shapes, and ε is the noise level (Kaveh and Dadras, 2018).
SEREP
Most mode shape expansion methods (Guyan, IRS, and IIRS) use the same model reduction transformation matrix as an expansion mechanism to obtain unmeasured mode shapes of the actual tested dynamic system. But SEREP method employs analytical mode shapes to generate a transformation matrix between measured and unmeasured DOFs (Chen, 2010). SEREP could yield very good results when analytical modes are close to experimental mode measurements. However, SEREP significantly deteriorates the accuracy of expanded results if the difference between analytical modes and experimentally measured modes is relatively large. This may happen in structures with extreme modeling errors in analytical model (Chen, 2010; Qu, 2013).
A possible solution for increasing the accuracy of the numerical model is the use of an appropriate model updating technique. For instance, minimizing the differences between analytical and experimental natural frequencies as an objective function and employing an evolutionary algorithm that can be suitable candidates.
The mode expansion usually takes the form of a matrix transformation:

where the subscript Exp denotes the expanded mode shape, and subscript Test denotes the experimental mode shapes. T is the transformation matrix which transforms incomplete measured DOFs to the full set of DOFs (Qu, 2013).
The transformation matrix (O’Callahan and Li, 1994) is obtained as follows
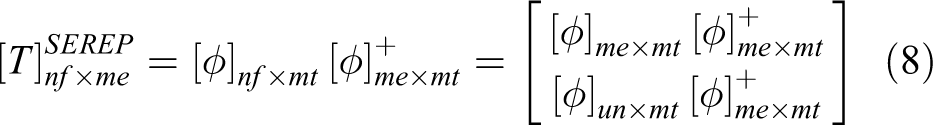
where nf is the number of DOFs in FEM, mt is the number of modes used to form the transformation matrix, me is the number of measured (or master) DOFs, and un is the number of unmeasured (or slave) DOFs. Also, “+” represents pseudo inverse of a matrix.
As it is obvious, SEREP expansion method is not directly related to stiffness and mass of the analytical model and it is rather dependent on the analytical mode shapes to develop a mapping between the incomplete set of measured DOFs and the full set of analytical DOFs (Chen, 2010).
Thus, equation (4) can be rewritten via expanded mode shapes as follows

Objective function in equation (5) can be rewritten as follows
Performance evaluation of SEREP—beam example
To evaluate the performance of SEREP, an experimental box-sectional cantilever beam is herein employed. Experimental configuration has been carried out by Altunışık et al. (2017). A number of research on FEM updating and damage detection have been performed in recent years based on this experiment and they can be found in Altunışık et al. (2019a, 2019b). To obtain the experimental natural frequencies and mode shapes, the cantilever beam is excited by ambient vibration. B&K3560 data acquisition system with 17 channels, B&K8340-type uniaxial accelerometers, and uniaxial signal cables are used as experiment requirements. Figure 1 shows the experimental model of cantilever beam including the locations of the accelerometers. As seen in Figure 1, vertical accelerations from the accelerometers have been collected. Therefore, only vertical modes of vibration are available.
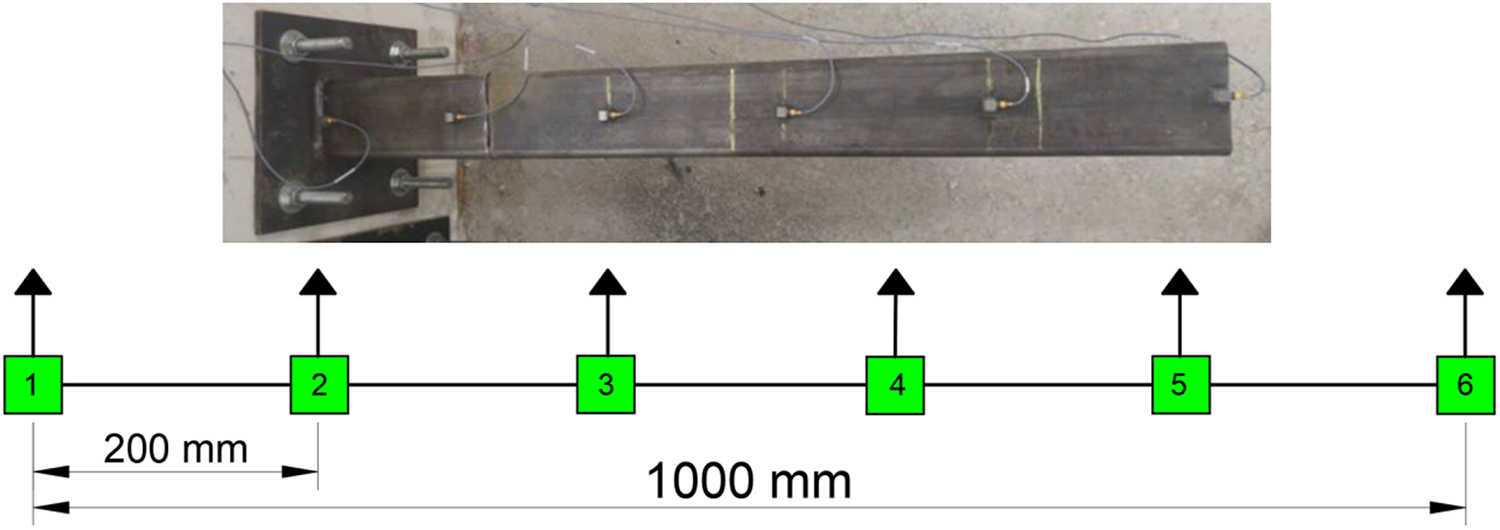
Experimental model of cantilever beam and accelerometer locations (Altunışık et al., 2019a).
Damages are induced at three different locations in beams as shown in Figure 2. Material properties of the steel are E = 206 GPa, ρ = 7850 kg/m3, and ν = 0.3.
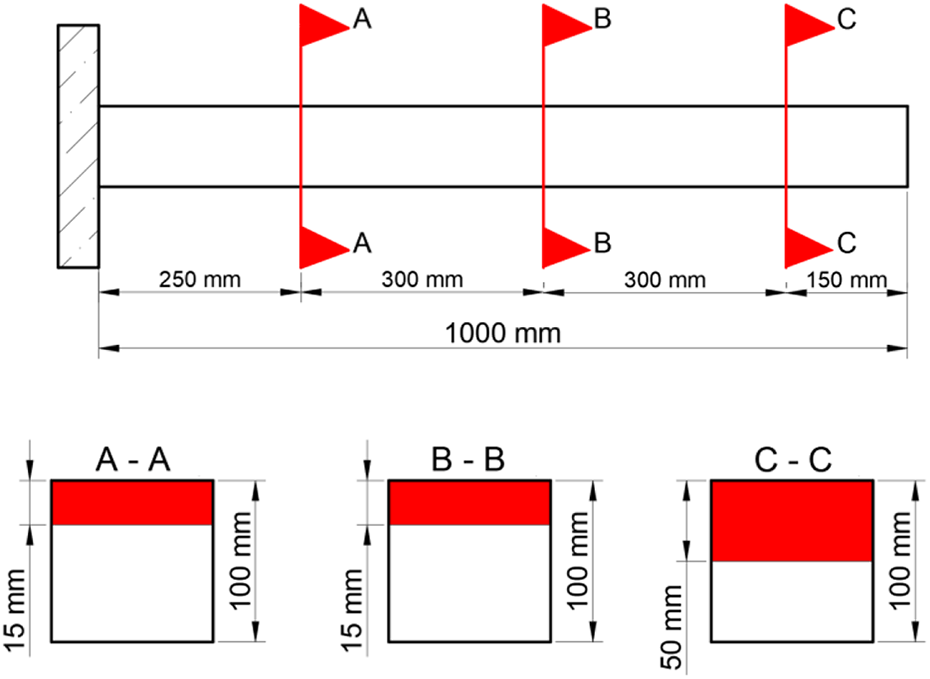
Extent and location of damages for the cantilever beam (Altunışık et al., 2019a).
Figure 2 shows the location and extent of damages for the cantilever beam. The section marked red represents the cut surface.
To show the efficiency of SEREP, 3 DOFs of 3, 5, and 6 were assumed as measured mode shapes and the rest of the DOFs were expanded. Figure 3 is a mode shape comparison between experimental and expanded values from first to third modes. It is evident that mode shape expansion procedure is more effective by using SEREP.

Comparison of experimental and expanded values for first to third modes—beam example.
The MAC between the mode shapes r and s is calculated as follows (Liu and Li, 2012)
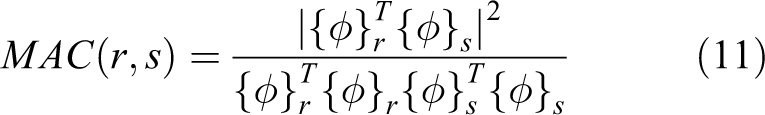
When MAC is close to 1, it denotes a great degree of similarity between two mode shape vectors, whereas a value of MAC close to 0 denotes weak or no correlation between two vectors. MAC values between experimental and expanded mode shapes for first to third modes of beam example are 0.9998, 0.9976, and 0.9986, respectively. It is evident these values are closer to 1 and represent a good correlation.
Performance evaluation of SEREP—truss example
In this subsection, another experimental example named truss tower (see Figure 4) is studied to evaluate the performance of SEREP for mode shapes expansion. This experiment was configured by Weber and Paultre (2009) for damage detection and FEM updating in a truss tower. As seen in Figure 4(a), this structure has been constructed of L-shaped aluminum elements that are connected together with single steel bolts. The truss is installed on a 1-in-thick aluminum plate and has a total height of 2.8 m. For determining the dynamic characteristics, output-only vibration tests were conducted. Two fixed accelerometers were installed at the top to measure reference values and two moving accelerometers were employed to measure the values at every DOFs. Sensor locations are shown in Figure 4(b). For modeling the damage, a diagonal element is removed, as shown in Figure 4(b). Additional information about this experiment can be found in Weber and Paultre (2009).
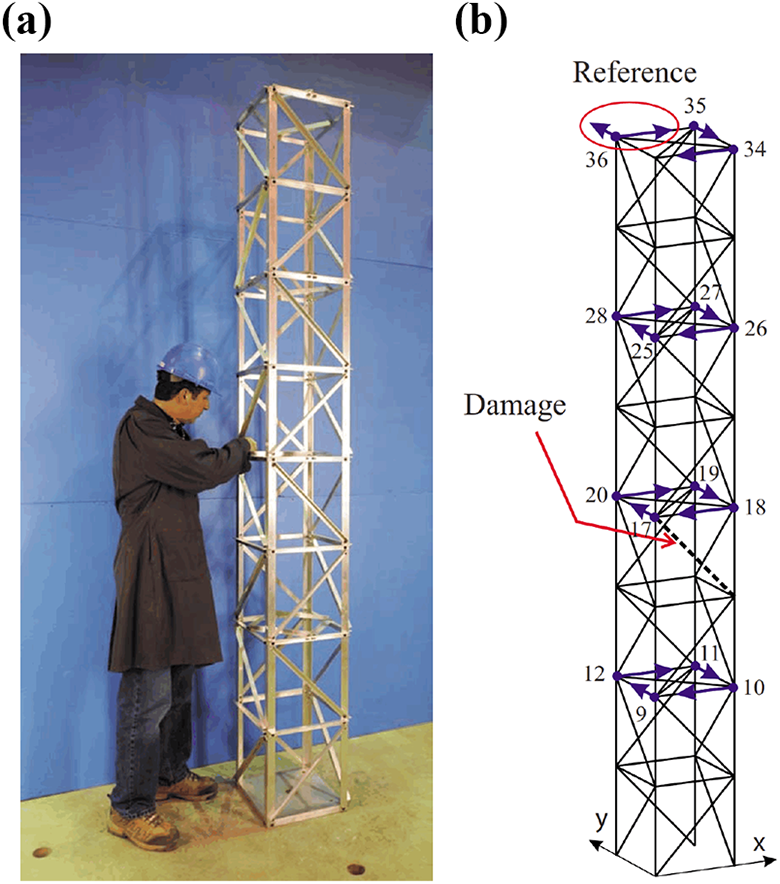
Laboratory model of (a) a truss tower and (b) sensor locations (Weber and Paultre, 2009).
To demonstrate the effectiveness of SEREP, 3 DOFs of 18x, 20x, and 27y were assumed as measured DOFs and the rest of the DOFs were expanded. Figure 5 is a mode shape comparison between the experimental and the expanded values from first to third modes. It can be observed that the mode shape expansion procedure is more effective by using SEREP. MAC values between experimental and expanded mode shapes for first to third modes of truss example are 0.9994, 0.9850, and 0.9985, respectively. It is evident that these values are closer to 1 and represent a good correlation.

Comparison of experimental and expanded values for first to third modes—truss example.
Optimization algorithms
In this section, a summary review of two nature-inspired optimization algorithms, grey wolf and Harris hawks, are presented.
GWO
GWO is a recent metaheuristics swarm intelligence method. It has been extensively employed for a wide variety of optimization problems because of its impressive characteristics over other swarm intelligence methods. The advantages of this method are as follows: It has very few parameters, and no derivation information is required in the initial search. Moreover, it is simple, easy to use, flexible, scalable, and has a unique capability to strike the right balance between the exploration and the exploitation during the search (Faris et al., 2018). The GWO algorithm’s capability is to handle a large number of variables. However, it can miss the local solutions when solving large-scale problems. This is the main drawback which can be improved (Faris et al., 2018). This algorithm simulates the leadership hierarchy and hunting mechanism of grey wolves in nature. To simulate the leadership hierarchy, four types of grey wolves defined as alpha (α), beta (β), delta (δ), and omega (ω) are introduced. Leaders are a male or a female and called alphas. Alpha is often responsible for making decisions about hunting, sleeping place, and wake up time. The second level of the hierarchy of grey wolves is beta. Betas are subservient wolves assisting alphas in decision making or other collective activities. Beta can be male or female and she or he is the best candidate to be an alpha wolf when the environment becomes too old. The lowest ranking of the grey wolves is omega. Omega is the scapegoat, and it always has to submit to all other powerful wolves. They are the last wolves allowed to eat. It may seem that omega is not a critical individual in the pack, but it is observed that the whole pack faces internal difficulties in case they miss omegas.
Three steps of hunting are as follows: Tracking, chasing, and approaching the prey; Pursuing, encircling, and harassing the prey until it stops moving; Attacking the prey.
These steps are illustrated in Figure 6.
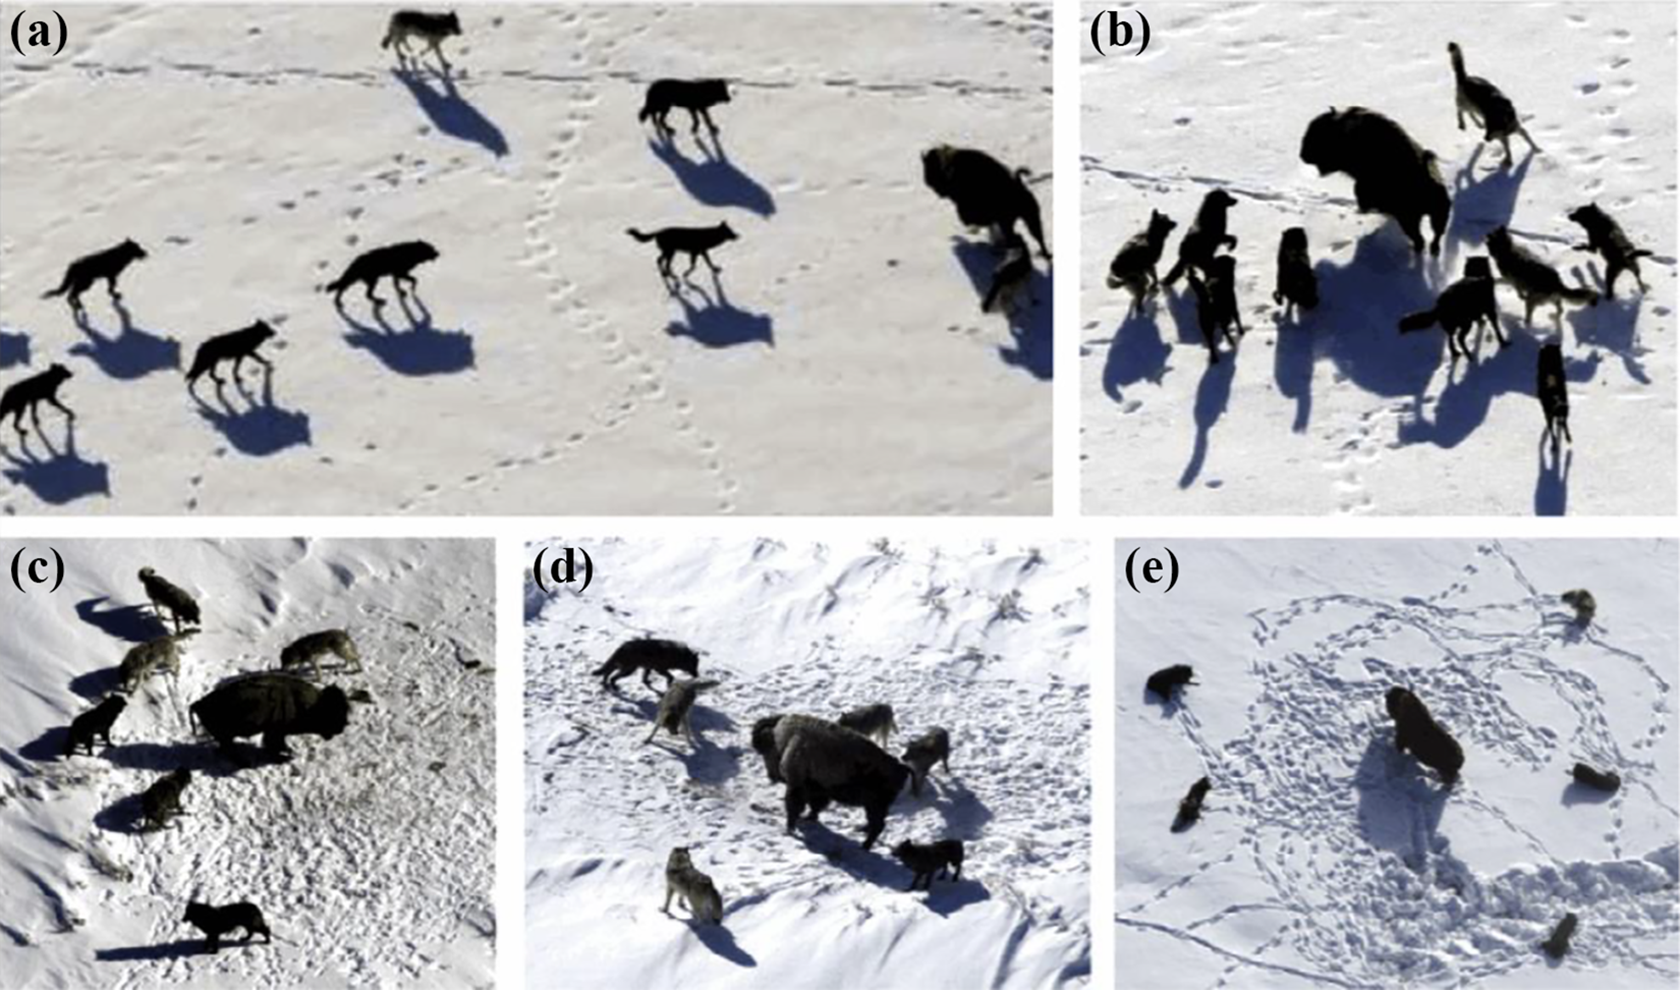
Hunting procedure (Mirjalili et al., 2014) of grey wolves: tracking, chasing, and approaching the (a) prey, (b–d) pursuing, encircling, and (e) attacking.
To form a mathematical model using social hierarchy of wolves, we consider the fittest solution as alpha (α) upon designing a GWO. Therefore, the second and the third best solutions are called beta (β) and delta (δ), respectively. Also, other solutions are assumed to be omega (ω). Additional information is presented by Mirjalili et al. (2014).
HHO
Harris hawks is another optimization technique. This algorithm was inspired by the cooperative behaviors of one of the most intelligent birds, Harris hawks, in nature. The most important strategy of Harris hawks to capture a prey is called surprise pounce, which is also known as seven kills strategy. In this attack tactic, some hawks attempt to collectively attack from several directions and together converge on a detected escaping prey outside the cover. The main interest of these collaborative strategies is that Harris hawks can track the detected prey to extreme tiredness, which increases the risk of vulnerability. Figure 7 shows Harris Hawk and surprise pounce. See more details of the HHO in Heidari et al. (2019).

(a) Harris’ hawk and (b) surprise pounce (Heidari et al., 2019).
Numerical example
To demonstrate the efficiency of the proposed method for detecting the location and severity of damages, a 56-bar dome space truss was studied. The FEM of space truss was developed using simple bar elements with 3 DOFs at each node. To simulate the actual measurement conditions, 3% and 10% random noises were applied in the natural frequencies and corresponding mode shapes, respectively. The parameters of GWO and HHO for the numerical example are given in Table 2. It should be mentioned that the selection of the parameters of optimization algorithms and the number of selected modes to organize the objective function is dependent upon trial and error method and engineering judgment. The flowchart in Figure 8 shows the damage detection and severity identification procedure. All computations were performed by MATLAB software.
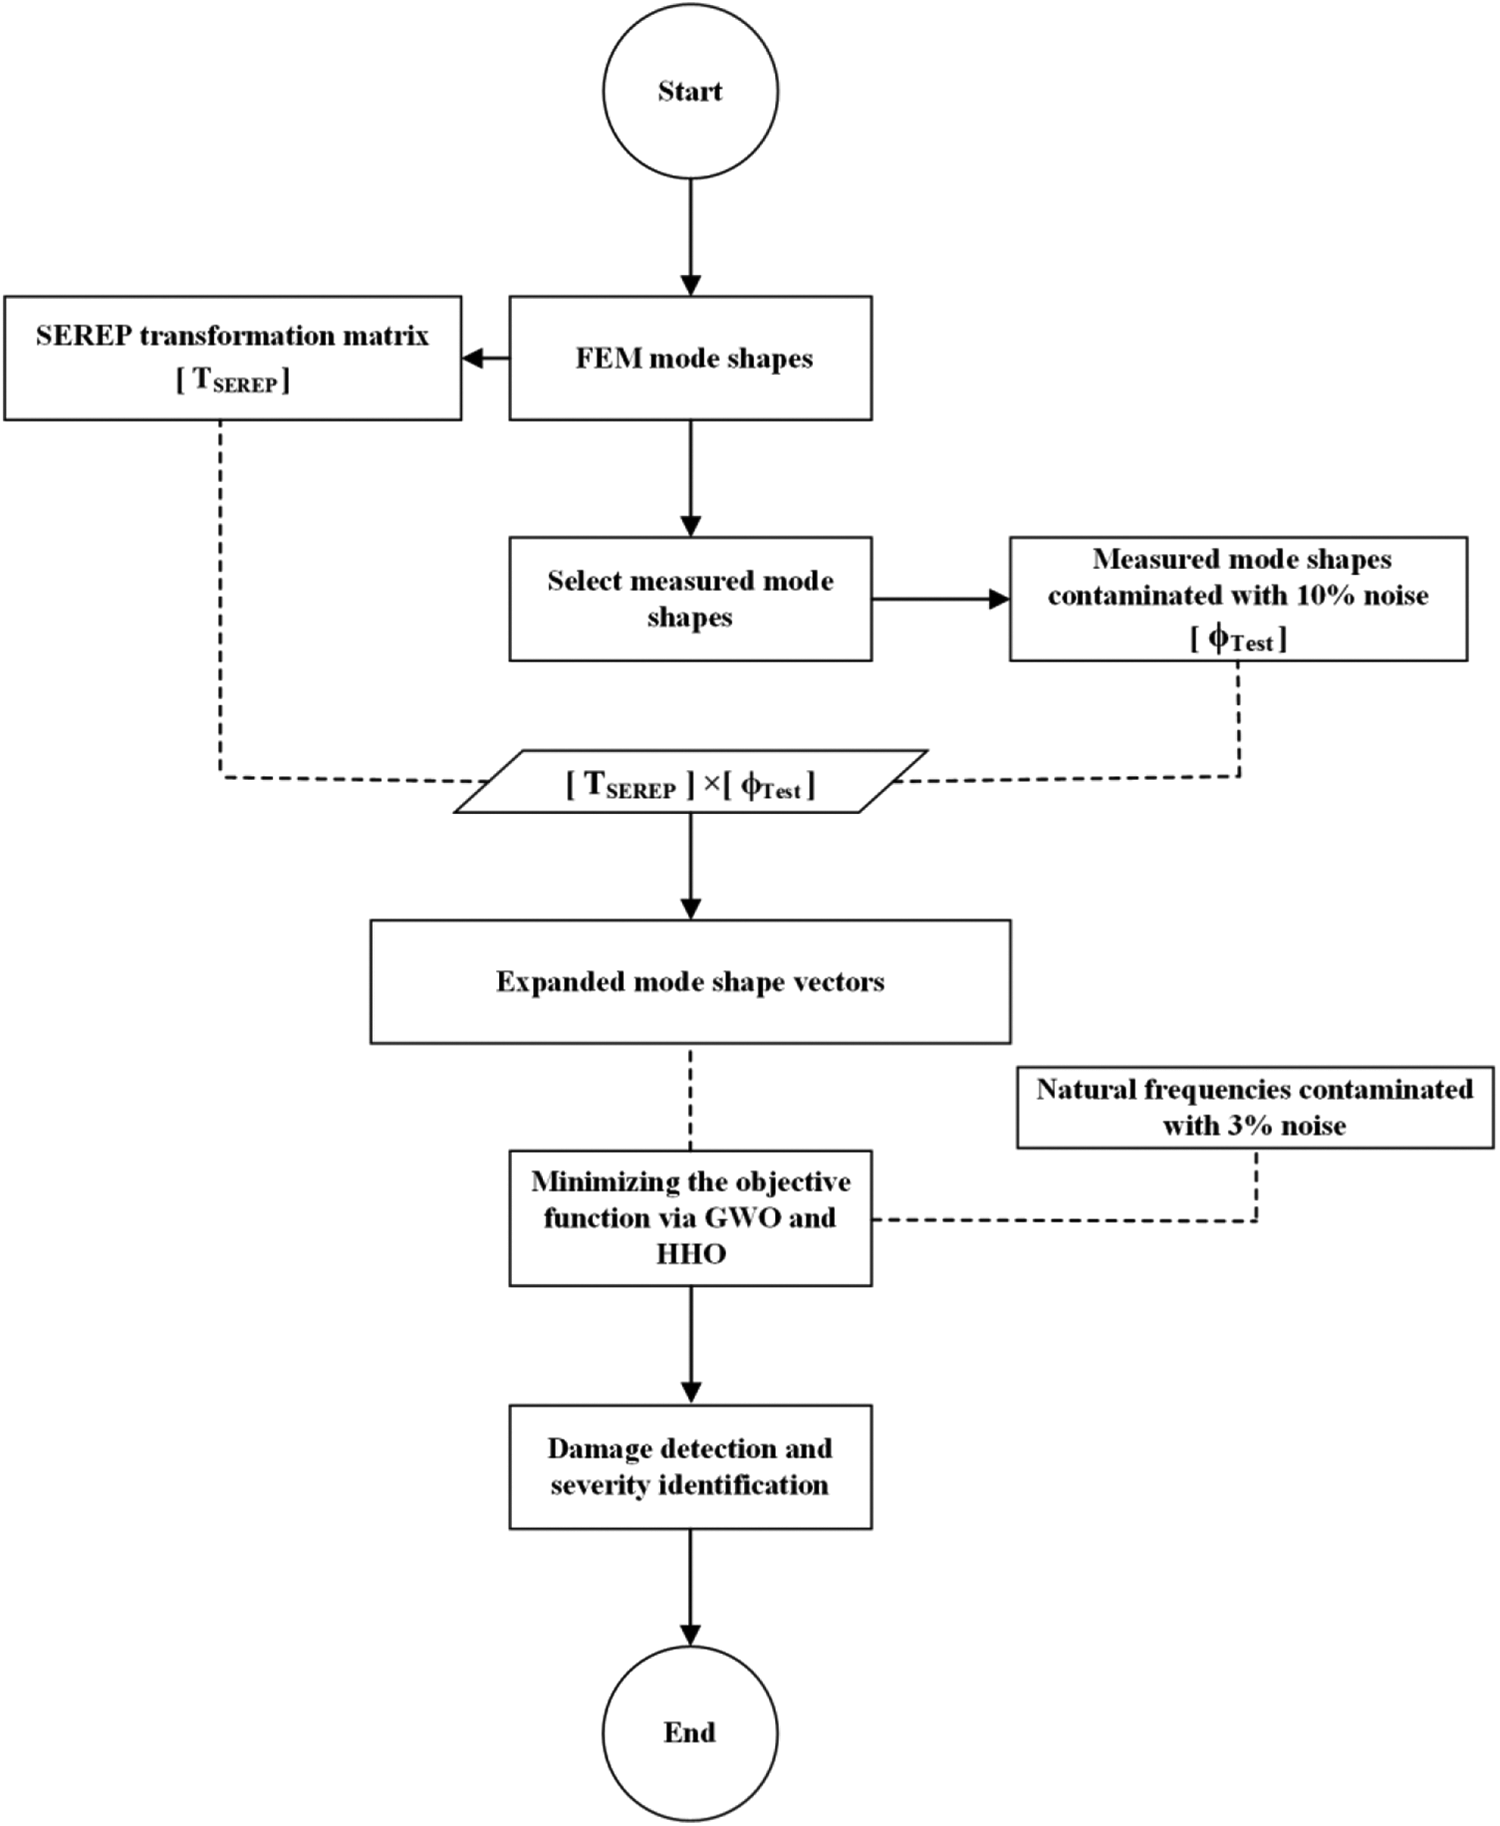
Flowchart of the damage detection procedure for the numerical example.
Parameters of GWO and HHO for the numerical example.
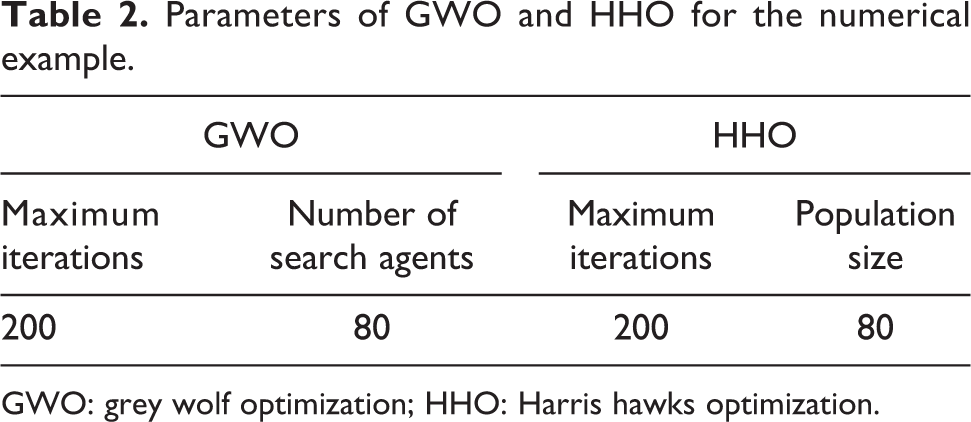
GWO: grey wolf optimization; HHO: Harris hawks optimization.
56-bar dome space truss
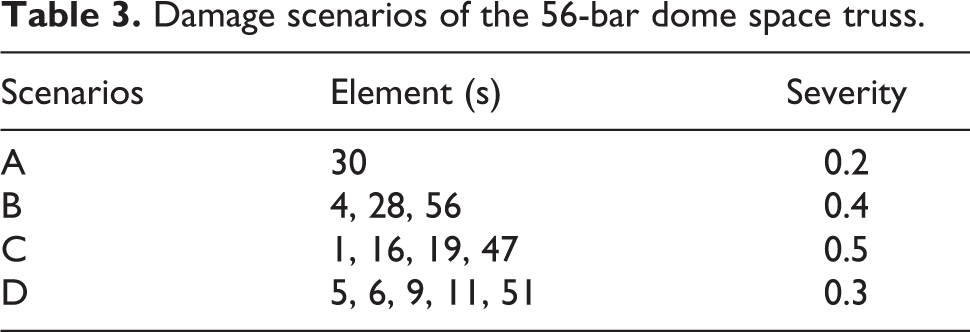
The FEM of a space truss (Kelesoglu, 2007) consists of 56 elements, 25 nodes, and 75 DOFs, as shown in Figure 9. The material properties of this example are given: Young’s modulus E = 210 GPa, mass density ρ = 7800 kg/m3, and cross-section A = 2 × 10⁻⁴ m2. After applying boundary conditions at support locations, the total number of DOFs is decreased to 51. Six DOFs (1, 2, 3, 4, 5, 6) of the total 51 DOFs were measured. Measured DOFs (in X, Y, and Z direction) were related to the nodes 1 and 2, respectively. Thus, 45 DOFs were estimated by SEREP. In each damage scenario, only the first six modes are inputted into the objective function. The optimal number of utilized modes are determined by trial and error method. Damage scenarios are listed in Table 3. Figure 10 shows the evolutionary process of the damage detection for this example using GWO and HHO. It can be clearly observed that the convergence of GWO is better than HHO. Consequently, GWO was adopted as a suitable optimization algorithm for damage detection. The results for damage detection and severity identification of 56-bar dome space truss are illustrated in Figure 11. These figures reveal that all damage scenarios have been detected with small errors.

Schematic of a 56-bar dome space truss (Kelesoglu, 2007).
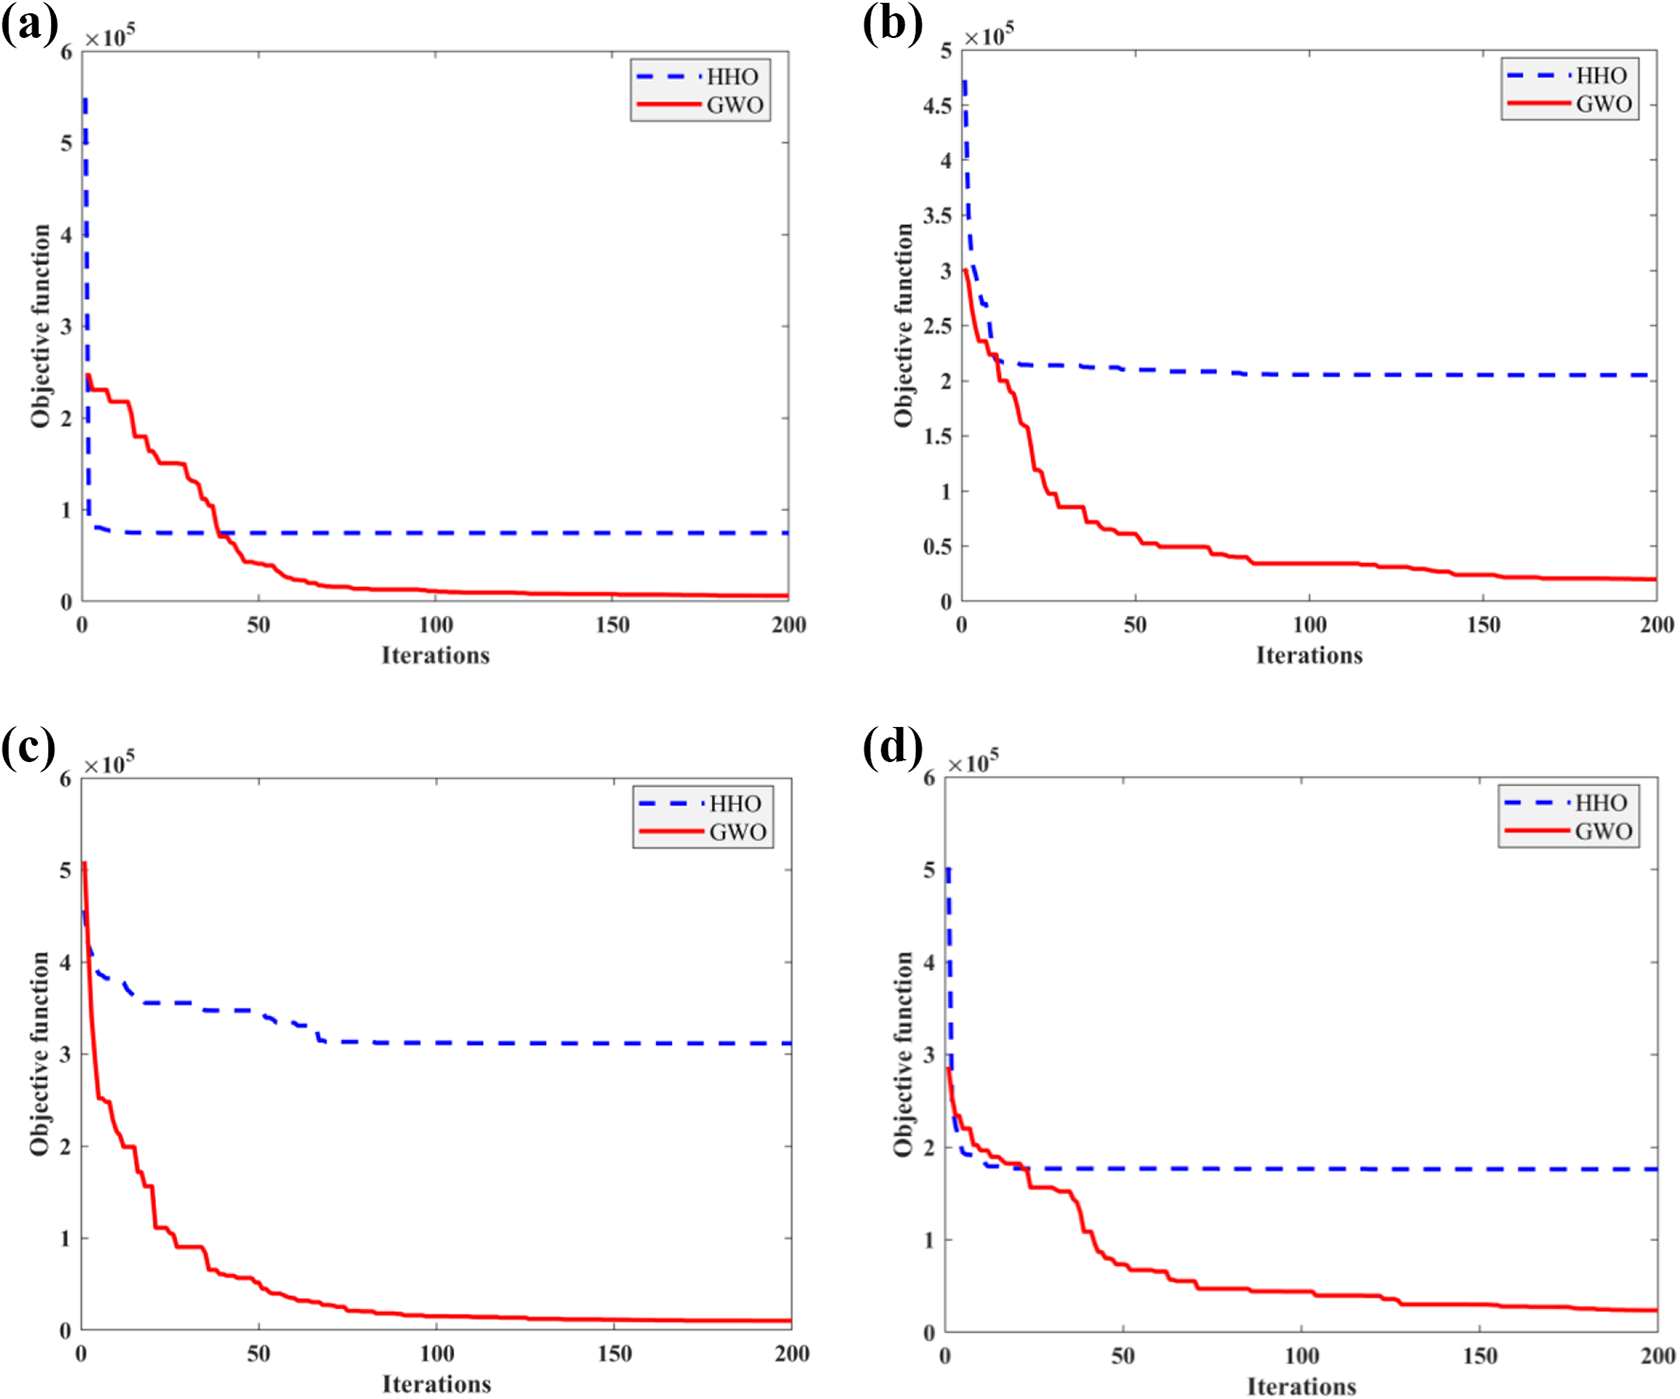
Evolutionary process of the damage detection for a 56-bar dome space truss: scenarios a, b, c, and d.
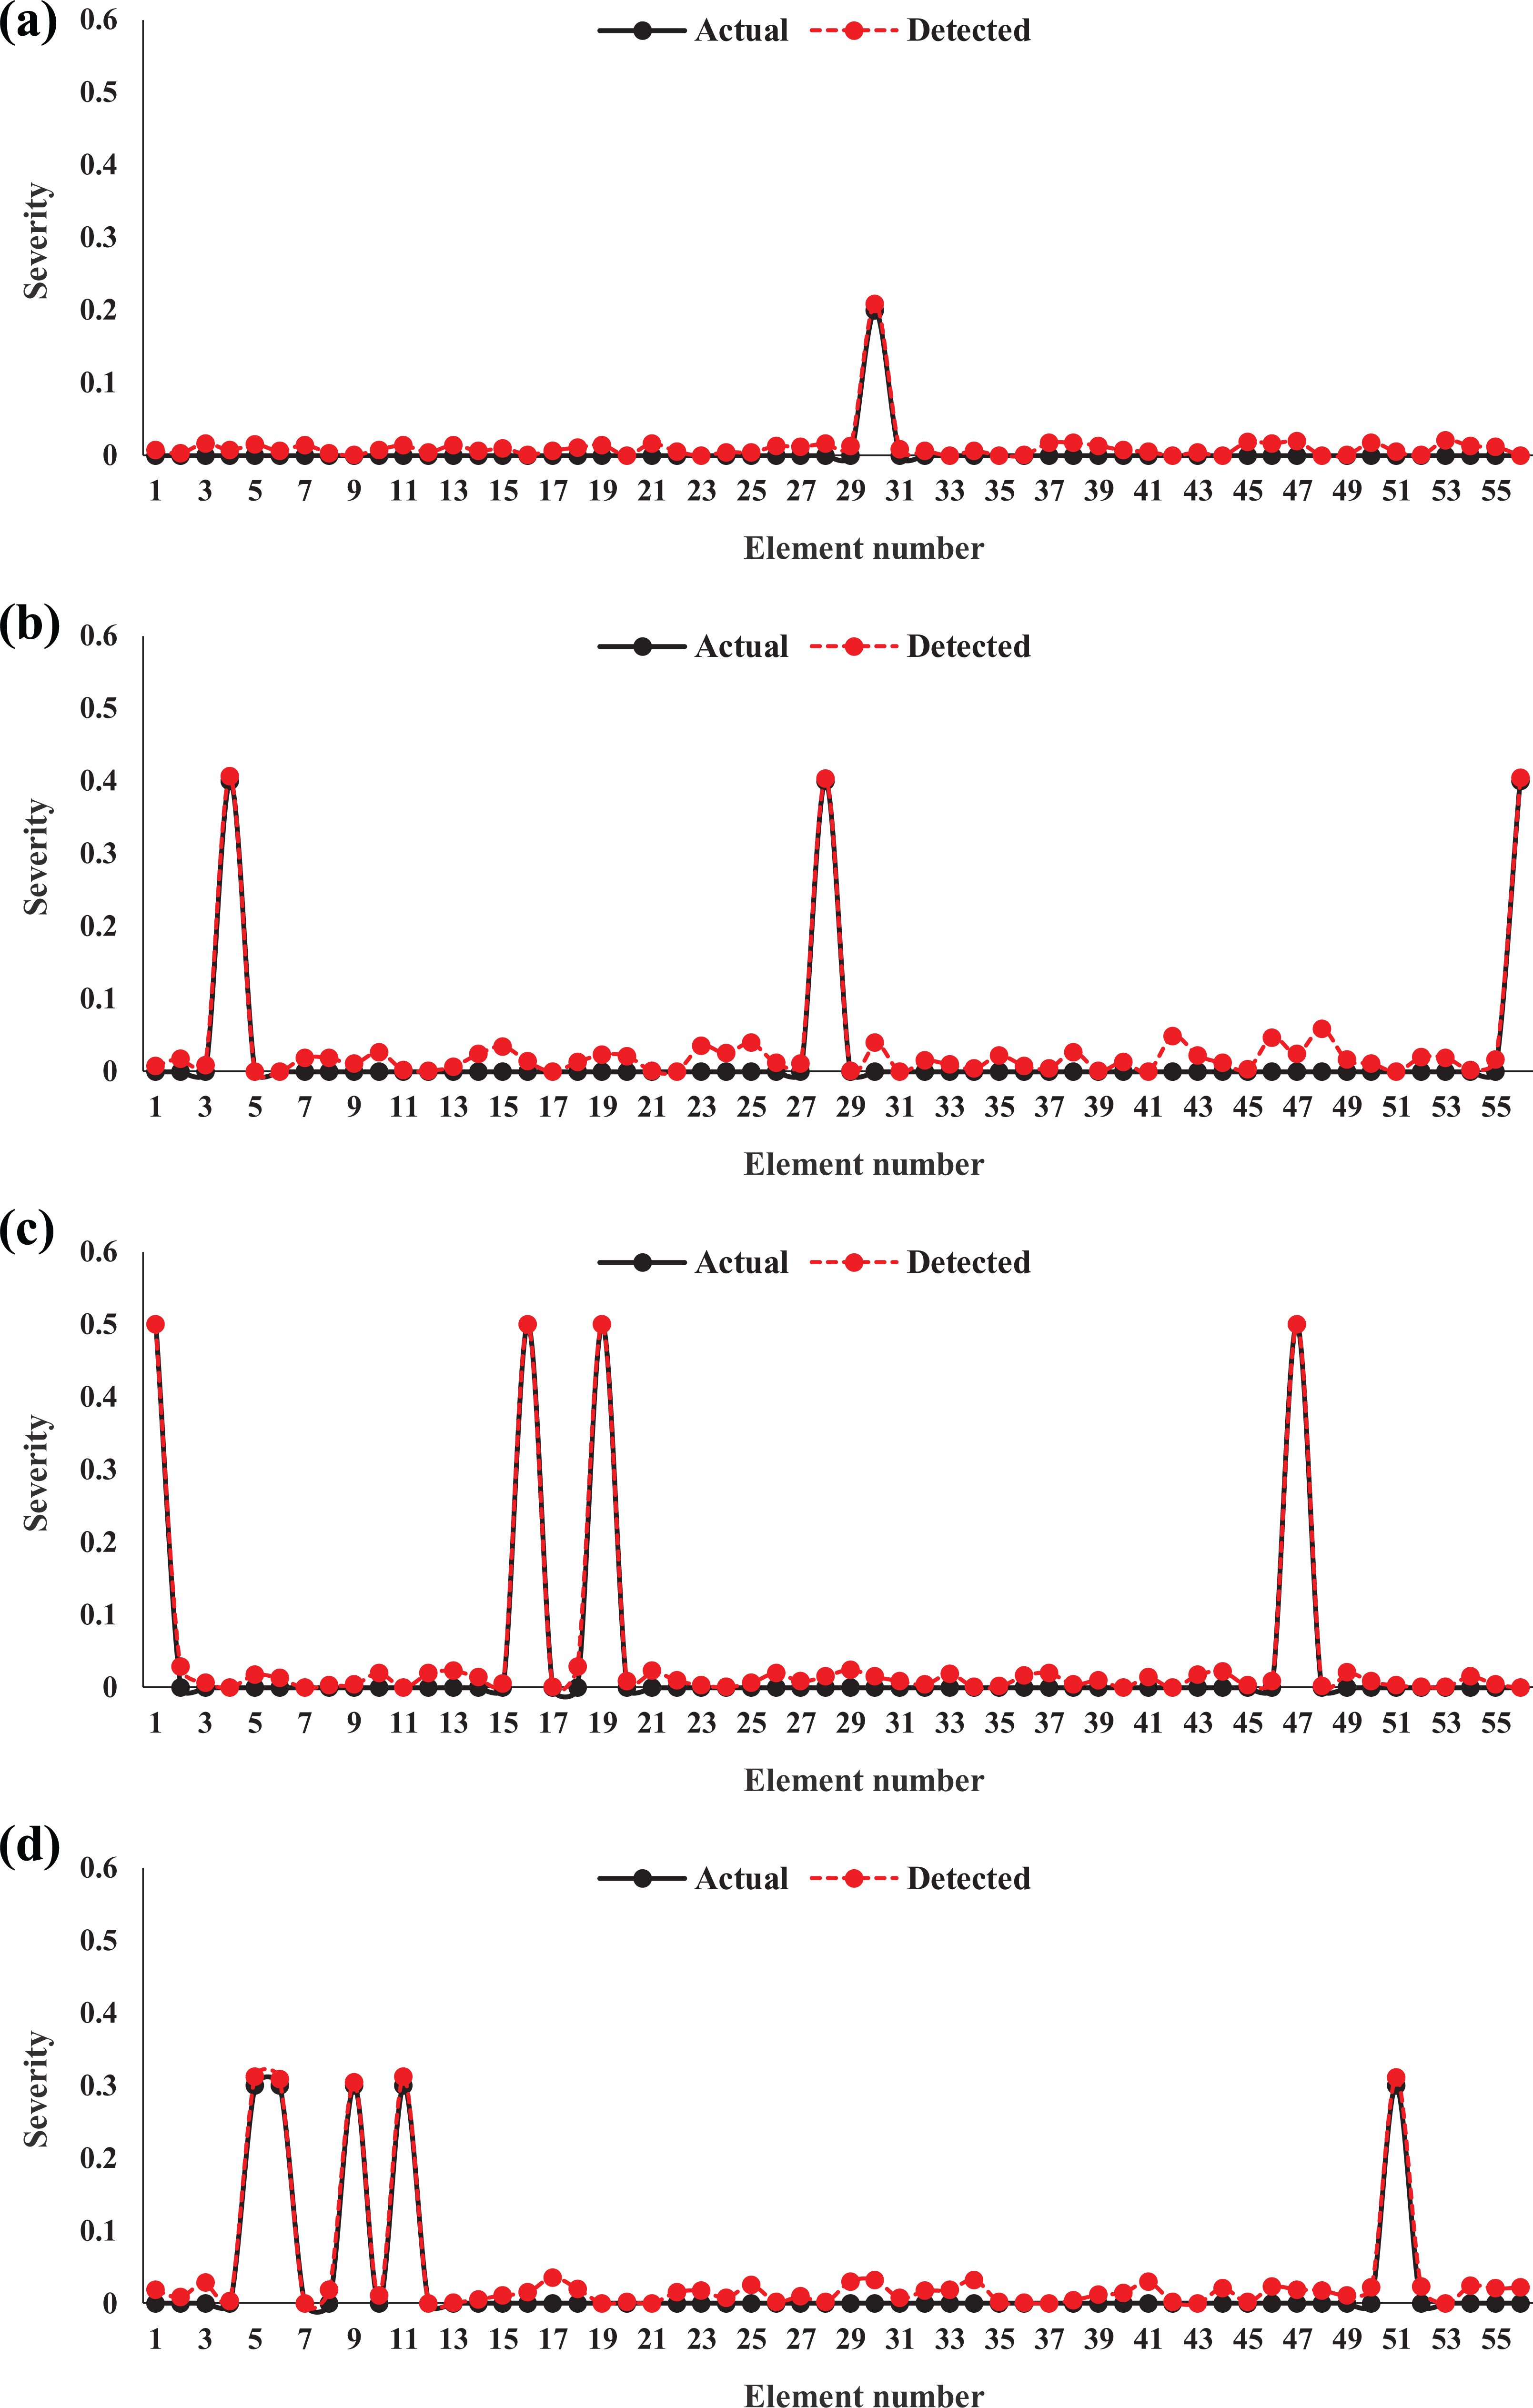
The results for the 56-bar dome space truss using GWO: scenarios a, b, c, and d.
Damage scenarios of the 56-bar dome space truss.
Experimental validation
In this section, experimental verifications are conducted on a four-story steel frame, as shown in Figure 12, to demonstrate the performance of the presented method in damage localization and severity identification using expanded mode shapes. This frame has been tested at Columbia University in New York. Some researchers have made efforts to employ several methods for damage detection in this structure (Cavalieri et al., 2012; Chatzi and Smyth, 2011; Fraraccio et al., 2008, 2010).
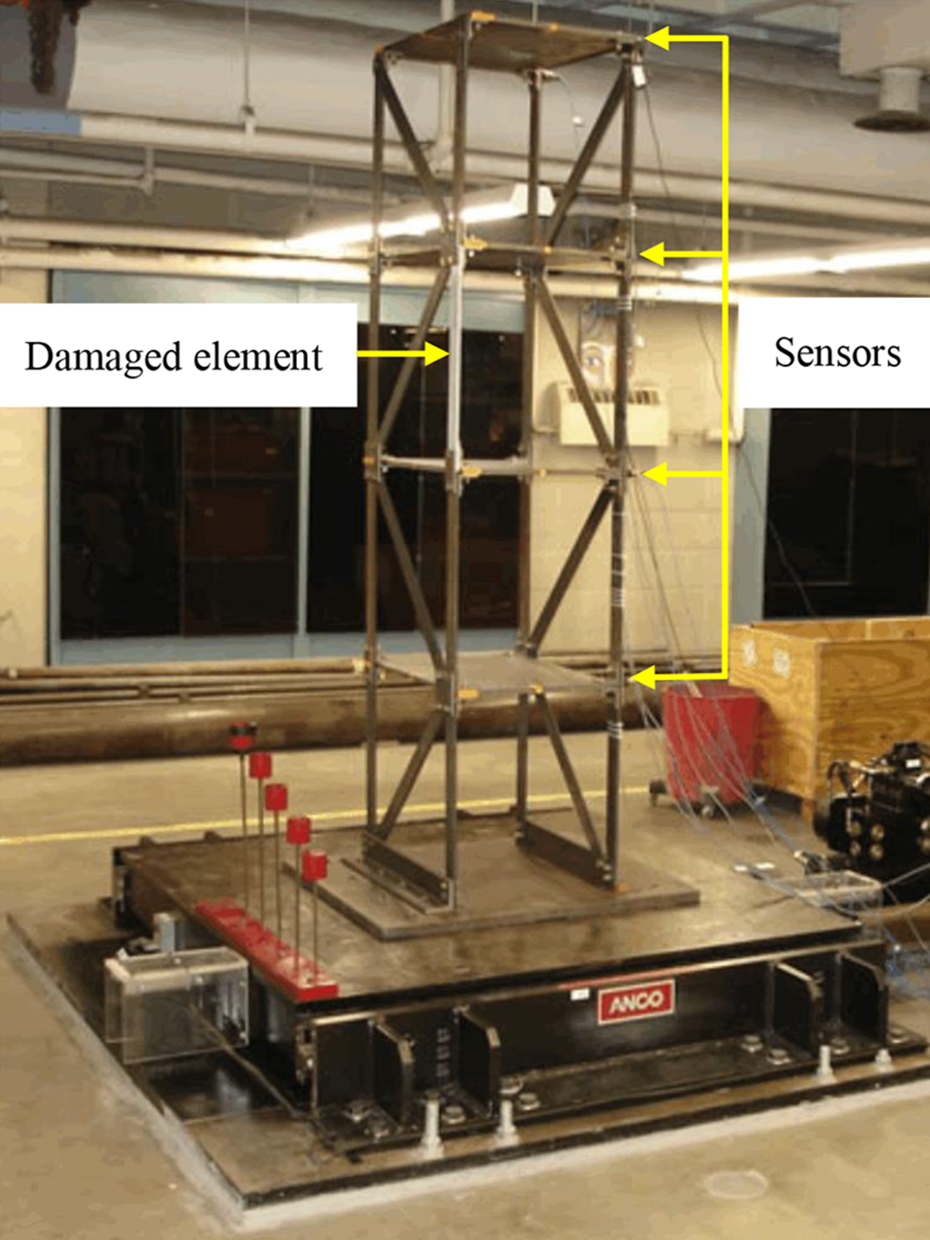
Experimental steel frame (Chatzi and Smyth, 2011).
The steel frame is excited on a hydraulic shake table in the frequency range of about 0–150 Hz with a peak acceleration of 3 g. Structural responses are measured by piezoelectric accelerometers. The sensor locations are illustrated in Figure 12. The frame was constructed of four stories, with an inter-story height of 533 mm, floor plate dimensions of 610 × 457 × 12.7 mm3, and column cross-sectional dimensions of 50.8 × 9.5 mm2. All structural elements are connected with a bolt, allowing fast replacement and change of members. Damage is induced by reducing 66% of the cross-section of one column between the second and third floors, effecting a 22.2% reduction of stiffness at inter-story. The damaged element is shown in Figure 12.
Natural frequencies of undamaged steel frame are listed in Table 4. Comparison of experimental natural frequencies and corresponding values from initial FEM shows an FEM updating is necessary to generate a baseline model for the subsequent damage detection. The FEM updating is organized to calibrate the story stiffness of the numerical model by minimizing the difference between the first four natural frequencies obtained from the FEM analysis (calculated natural frequencies) and corresponding measured values from the experiment, according to equation (12)
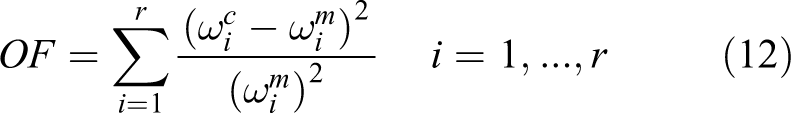
where
Natural frequencies (Hz) of undamaged steel frame.
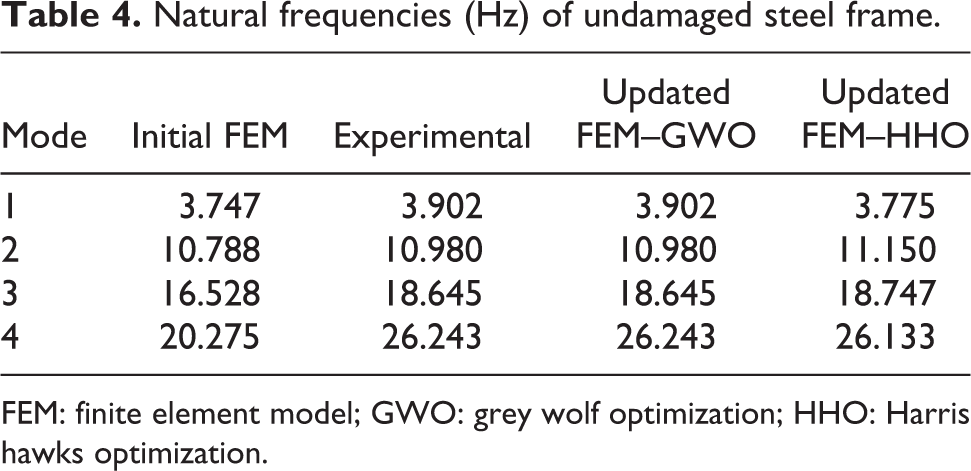
FEM: finite element model; GWO: grey wolf optimization; HHO: Harris hawks optimization.
Figure 13 shows the evolutionary process of the FEM updating for experimental steel frame.
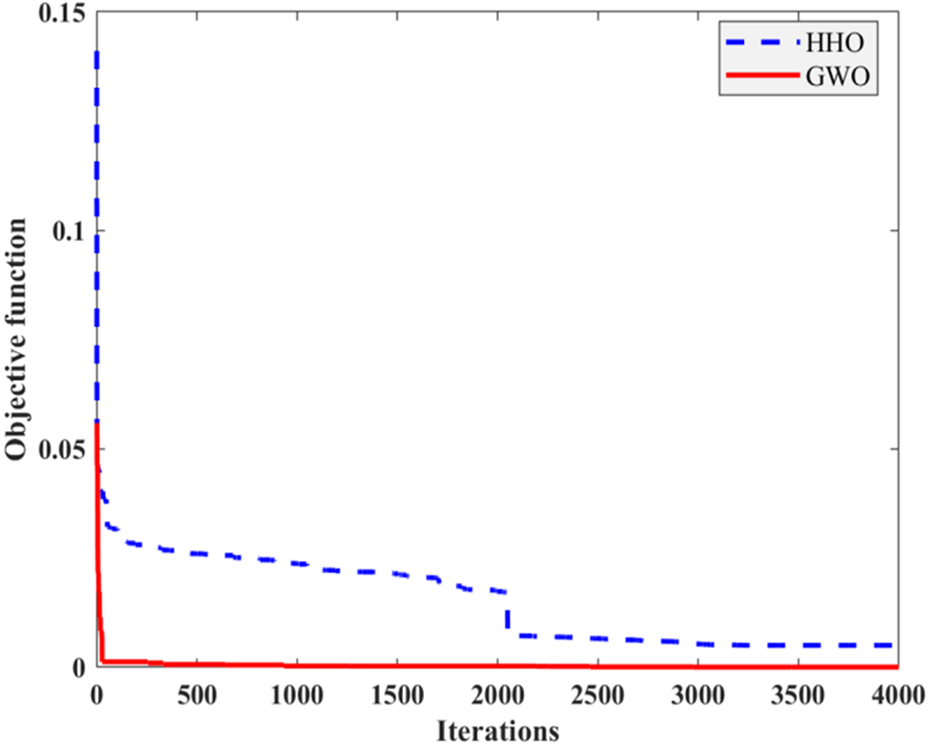
Evolutionary process of the FEM updating for experimental steel frame.
It can be observed that the GWO has better convergence than HHO. Therefore, GWO provides a more accurate solution, compared with HHO, in FEM updating. As shown in Table 4, natural frequencies which are updated by GWO, match very well with the experimental ones.
Stiffness matrices of initial FEM and updated models using GWO and HHO are as follows


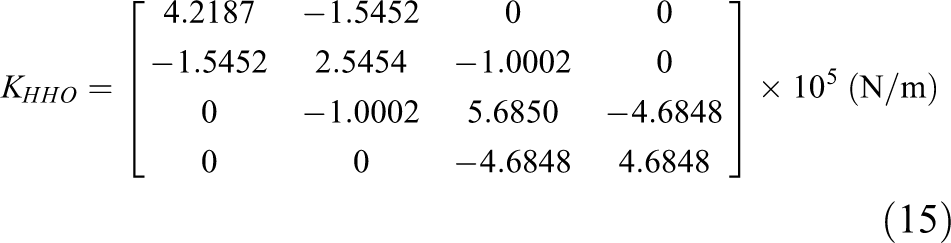
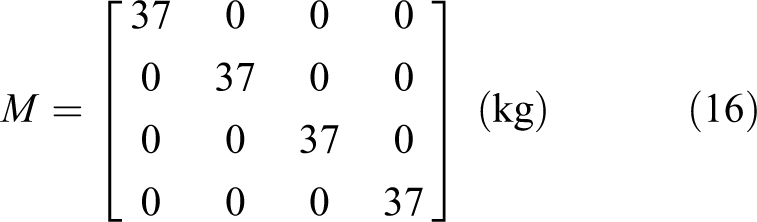
For subsequent calculations on damage detection, stiffness matrix which is optimized using GWO (KGWO ) has been adopted. The diagonal mass matrix of the steel frame is as follows
Modal analysis is also performed to obtain the mode shapes and natural frequencies under the damaged condition. Damaged modal data are presented in Figure 14. As expected, damage at the third story has reduced the natural frequencies in all four modes.
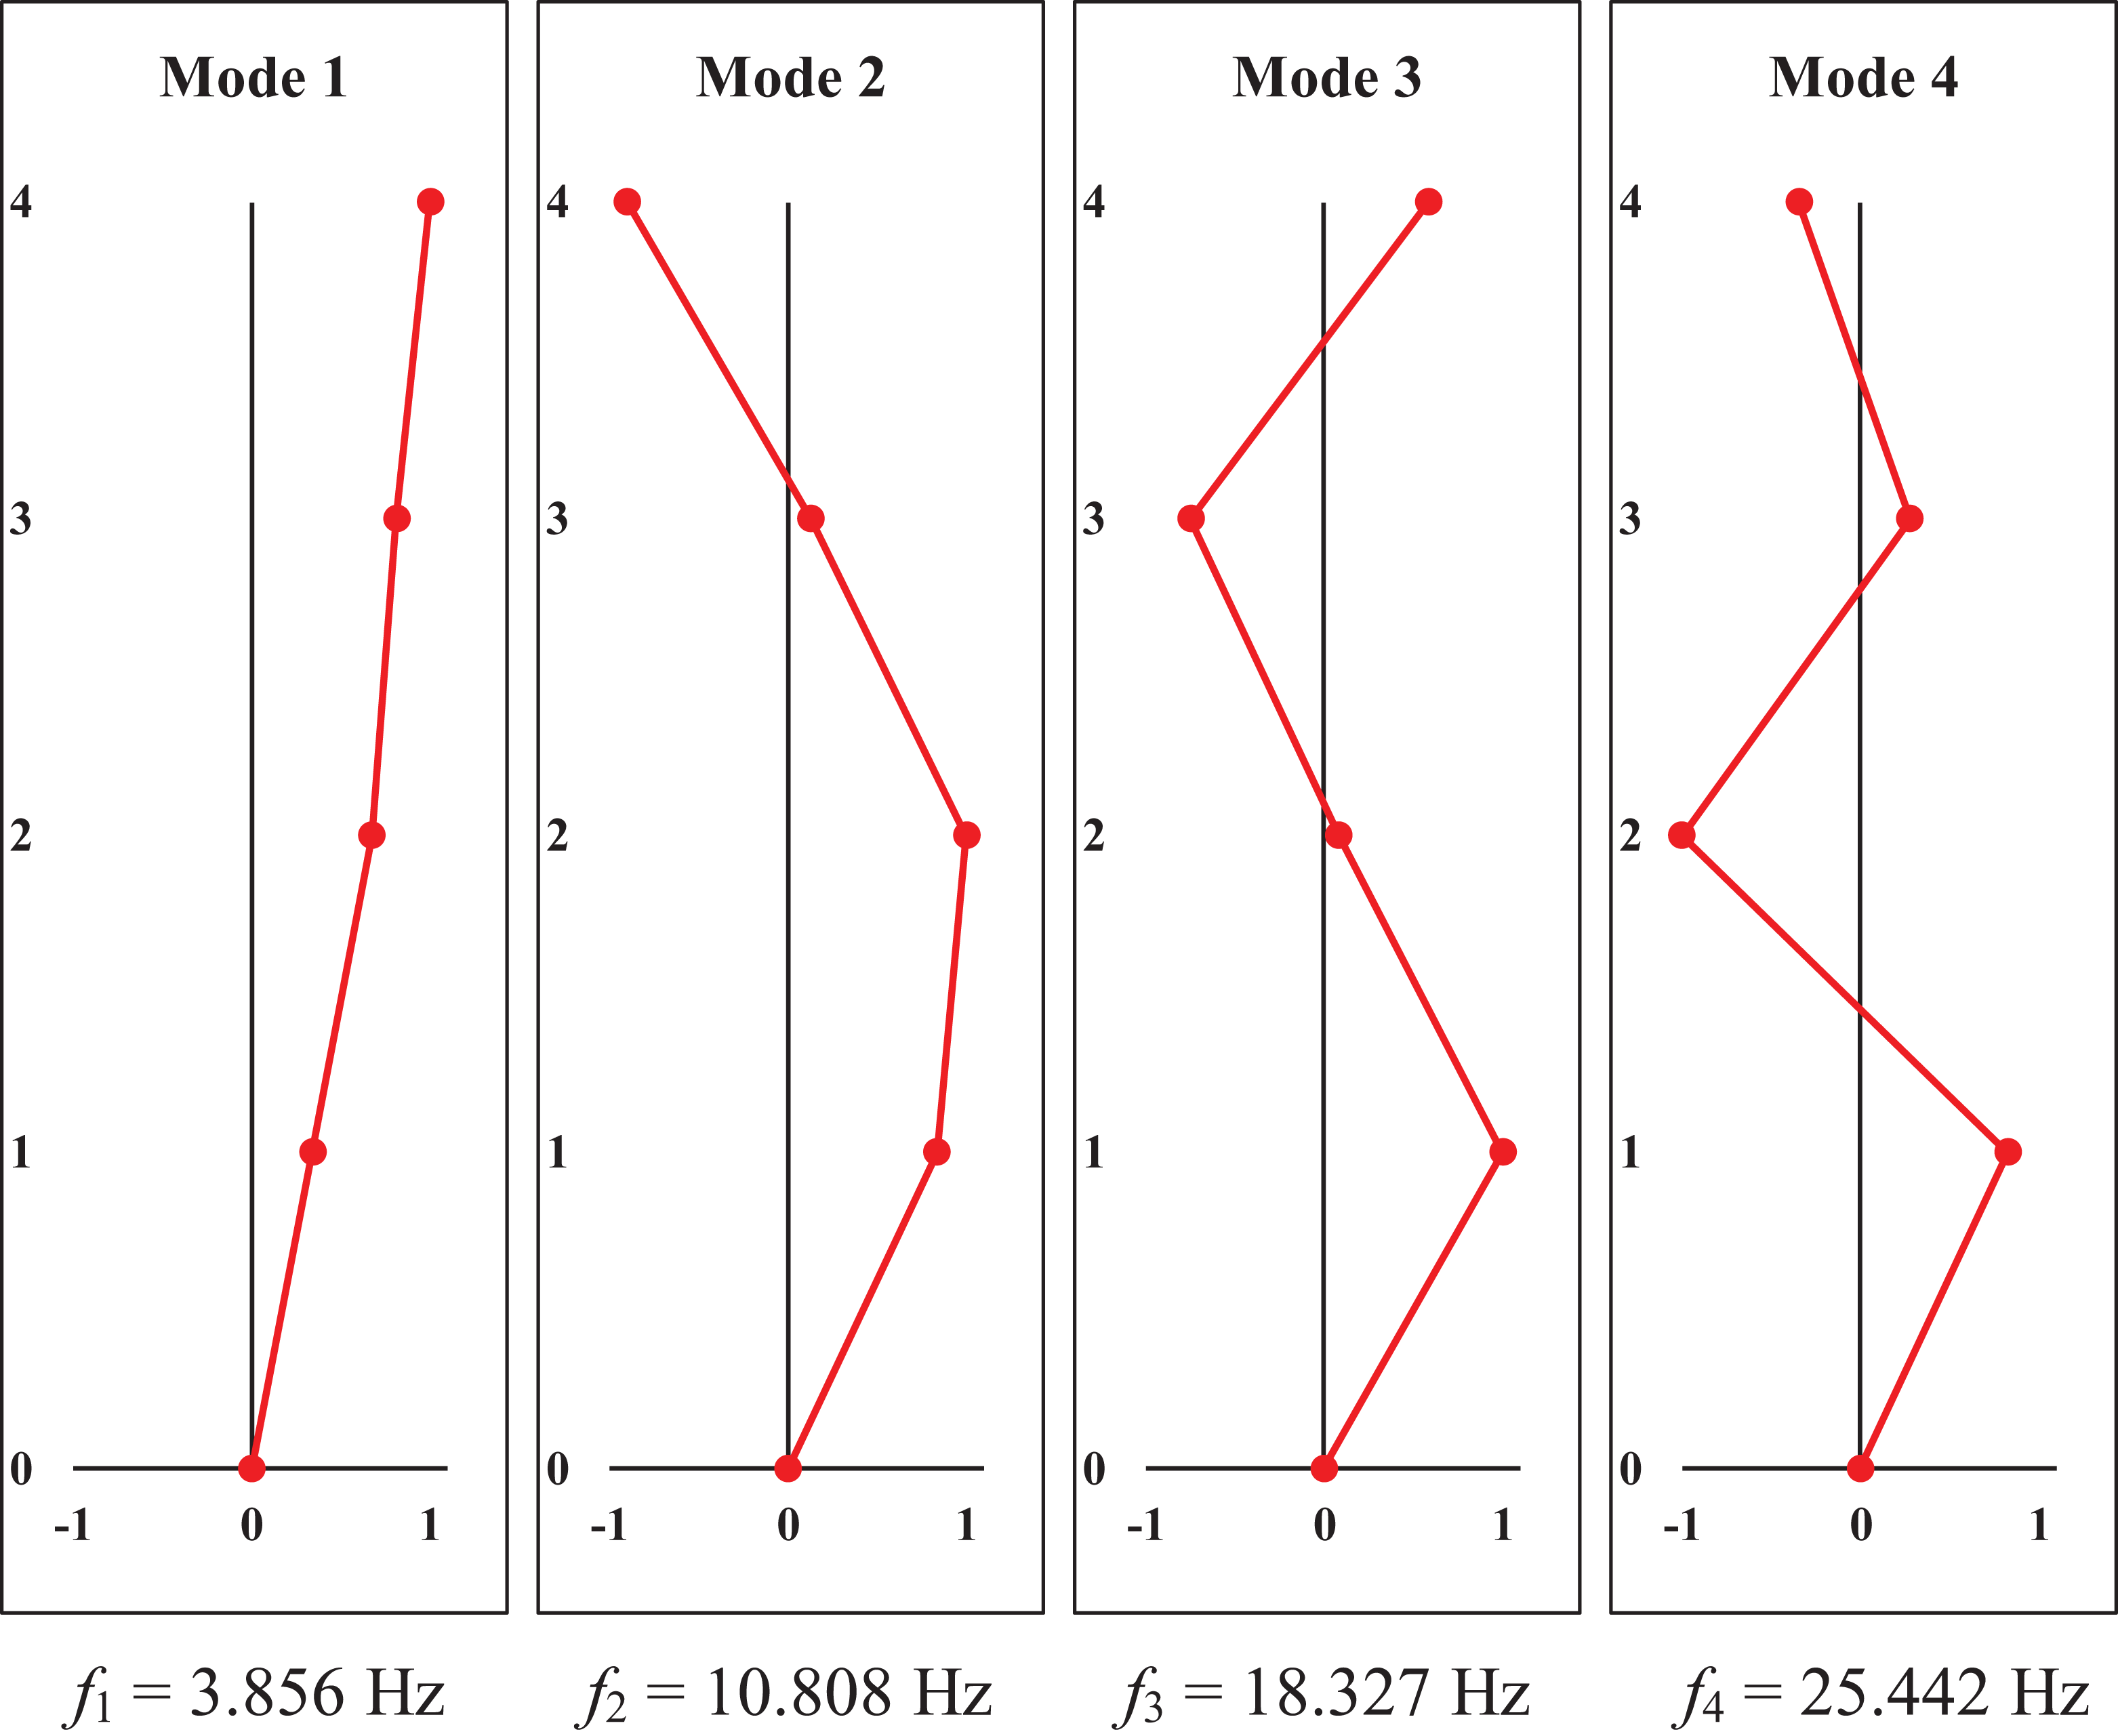
Experimental mode shapes and natural frequencies of damaged steel frame.
To detect the damage and its severity, both damaged natural frequencies and mode shapes were used as input in objective function described by equation (10). Given that the main contribution of this article is the damage detection using expanded mode shapes, 2 DOFs of first and third stories are assumed as measured and the rest of the DOFs, which are related to second and fourth stories, are estimated by SEREP. After applying the mode shape expansion method, only two first modes of damaged natural frequencies and mode shapes used as input in the objective function described in equation (10). Optimizing the objective function for finding damage index (de ) is carried out by HHO and GWO. Parameters of the optimization algorithms for both FEM updating and damage detection are listed in Table 5.
Parameters of GWO and HHO for experimental steel frame.
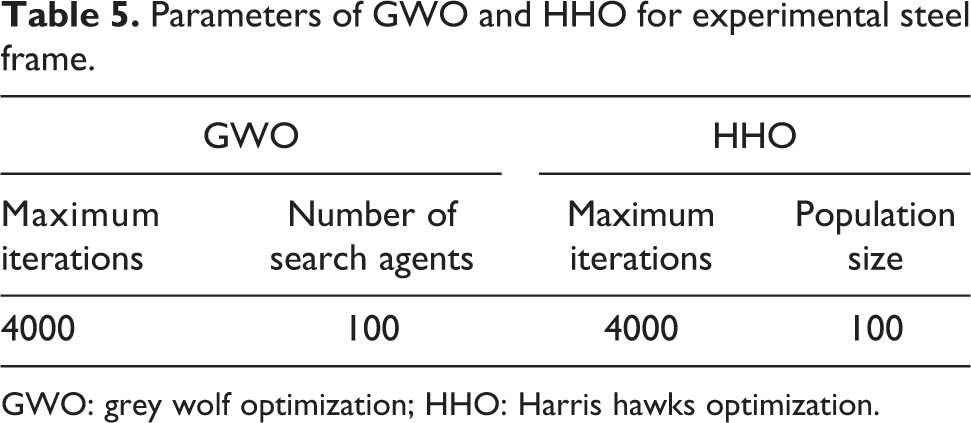
GWO: grey wolf optimization; HHO: Harris hawks optimization.
Figure 15 shows the evolutionary process of the damage detection for the experimental steel frame. The results clearly show that GWO has better convergence than HHO. Therefore, GWO is adopted as a suitable optimization algorithm for damage detection. Comparison between actual damage and detected value using GWO is illustrated in Figure 16. The results indicate that although the presented method identified the damage location, a minor error in severity identification has happened.

Evolutionary process of the damage detection for experimental steel frame.
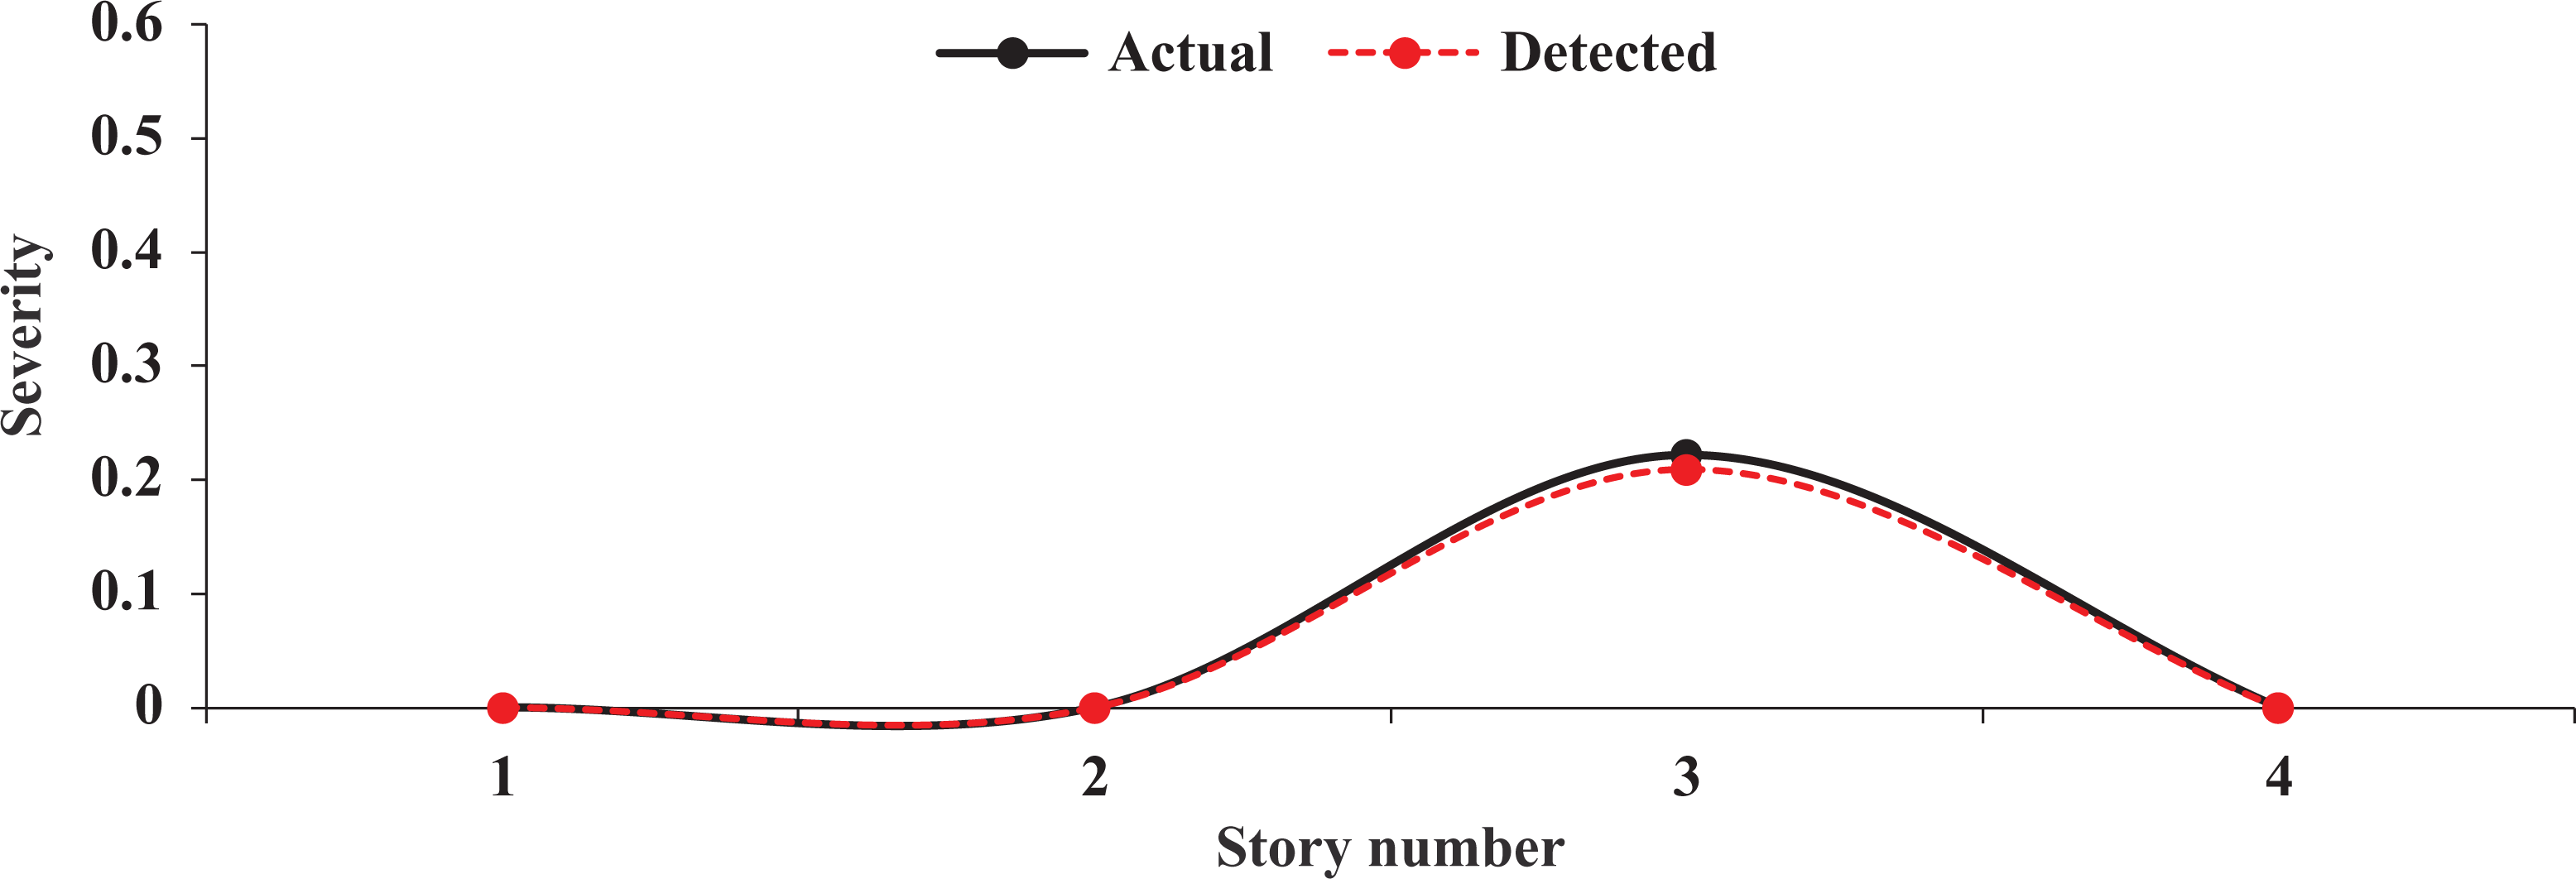
The result of damage detection for experimental steel frame using GWO.
Conclusion
An important issue in damage identification problems is the lack of adequate number of measured DOFs and the limitations of installed sensors. Therefore, a mode shape expansion method, called SEREP, was employed in this article to address this shortcoming. In this method, unmeasured mode shapes are determined by SEREP transformation matrix. To show the efficiency of SEREP for estimation of unmeasured mode shapes, two experimental examples including a cantilever beam and a truss tower have been studied. The results show that SEREP provides an accurate solution for mode shape expansion.
In the second part of this study, damage detection of skeletal structures is formulated as an optimization problem in which the objective function is established based on a combination of expanded mode shapes with SEREP and residual force vector. Two nature-inspired optimization algorithms, GWO and HHO, are adopted to solve the damage identification problem.
Finally, numerical study and experimental verification demonstrate that the combination of objective function based on expanded mode shapes and GWO can provide accurate results than those obtained with HHO.
Footnotes
Acknowledgements
Authors would like to thank Professor Michael Friswell for his invaluable and constructive comments.
Declaration of conflicting interests
The author(s) declared no potential conflicts of interest with respect to the research, authorship, and/or publication of this article.
Funding
The author(s) received no financial support for the research, authorship, and/or publication of this article.